Downloaded 46 times


![An example for $unwind Count how many airports each carrier lands in { "_id": { "$oid": "5383623b7bfb8767e2e9ca1f" }, "iata": "00M", "airport": "Thigpen ", "city": "Bay Springs", "state": "MS", "country": "USA", "lat": 31.95376472, "long": -89.23450472, "carriers": [ "AA", "UA", "DL", "BA" ] } … [ { "_id": { "$oid": "5383623b7bfb8767e2e9ca1f" }, "iata": "00M", "airport": "Thigpen ", "city": "Bay Springs", "state": "MS", "country": "USA", "lat": 31.95376472, "long": -89.23450472, "carriers": "AA" }, { "_id": { "$oid": "542217ffc026b858b47a6640" }, "iata": "00M", "airport": "Thigpen ", "city": "Bay Springs", "state": "MS", "country": "USA", "lat": 31.95376472, "long": -89.23450472, "carriers": "UA" } … ] [ { "_id": { "carriers": "BA" }, "count": 10 }, { "_id": { "carriers": "DL" }, "count": 10 } … ] airports2 $unwind $group](https://image.slidesharecdn.com/aggmongodaysrbn-141001121340-phpapp01/75/MongoDB-Analytics-Learn-Aggregation-by-Example-Exploratory-Analytics-and-Visualization-Using-Flight-Data-17-2048.jpg)


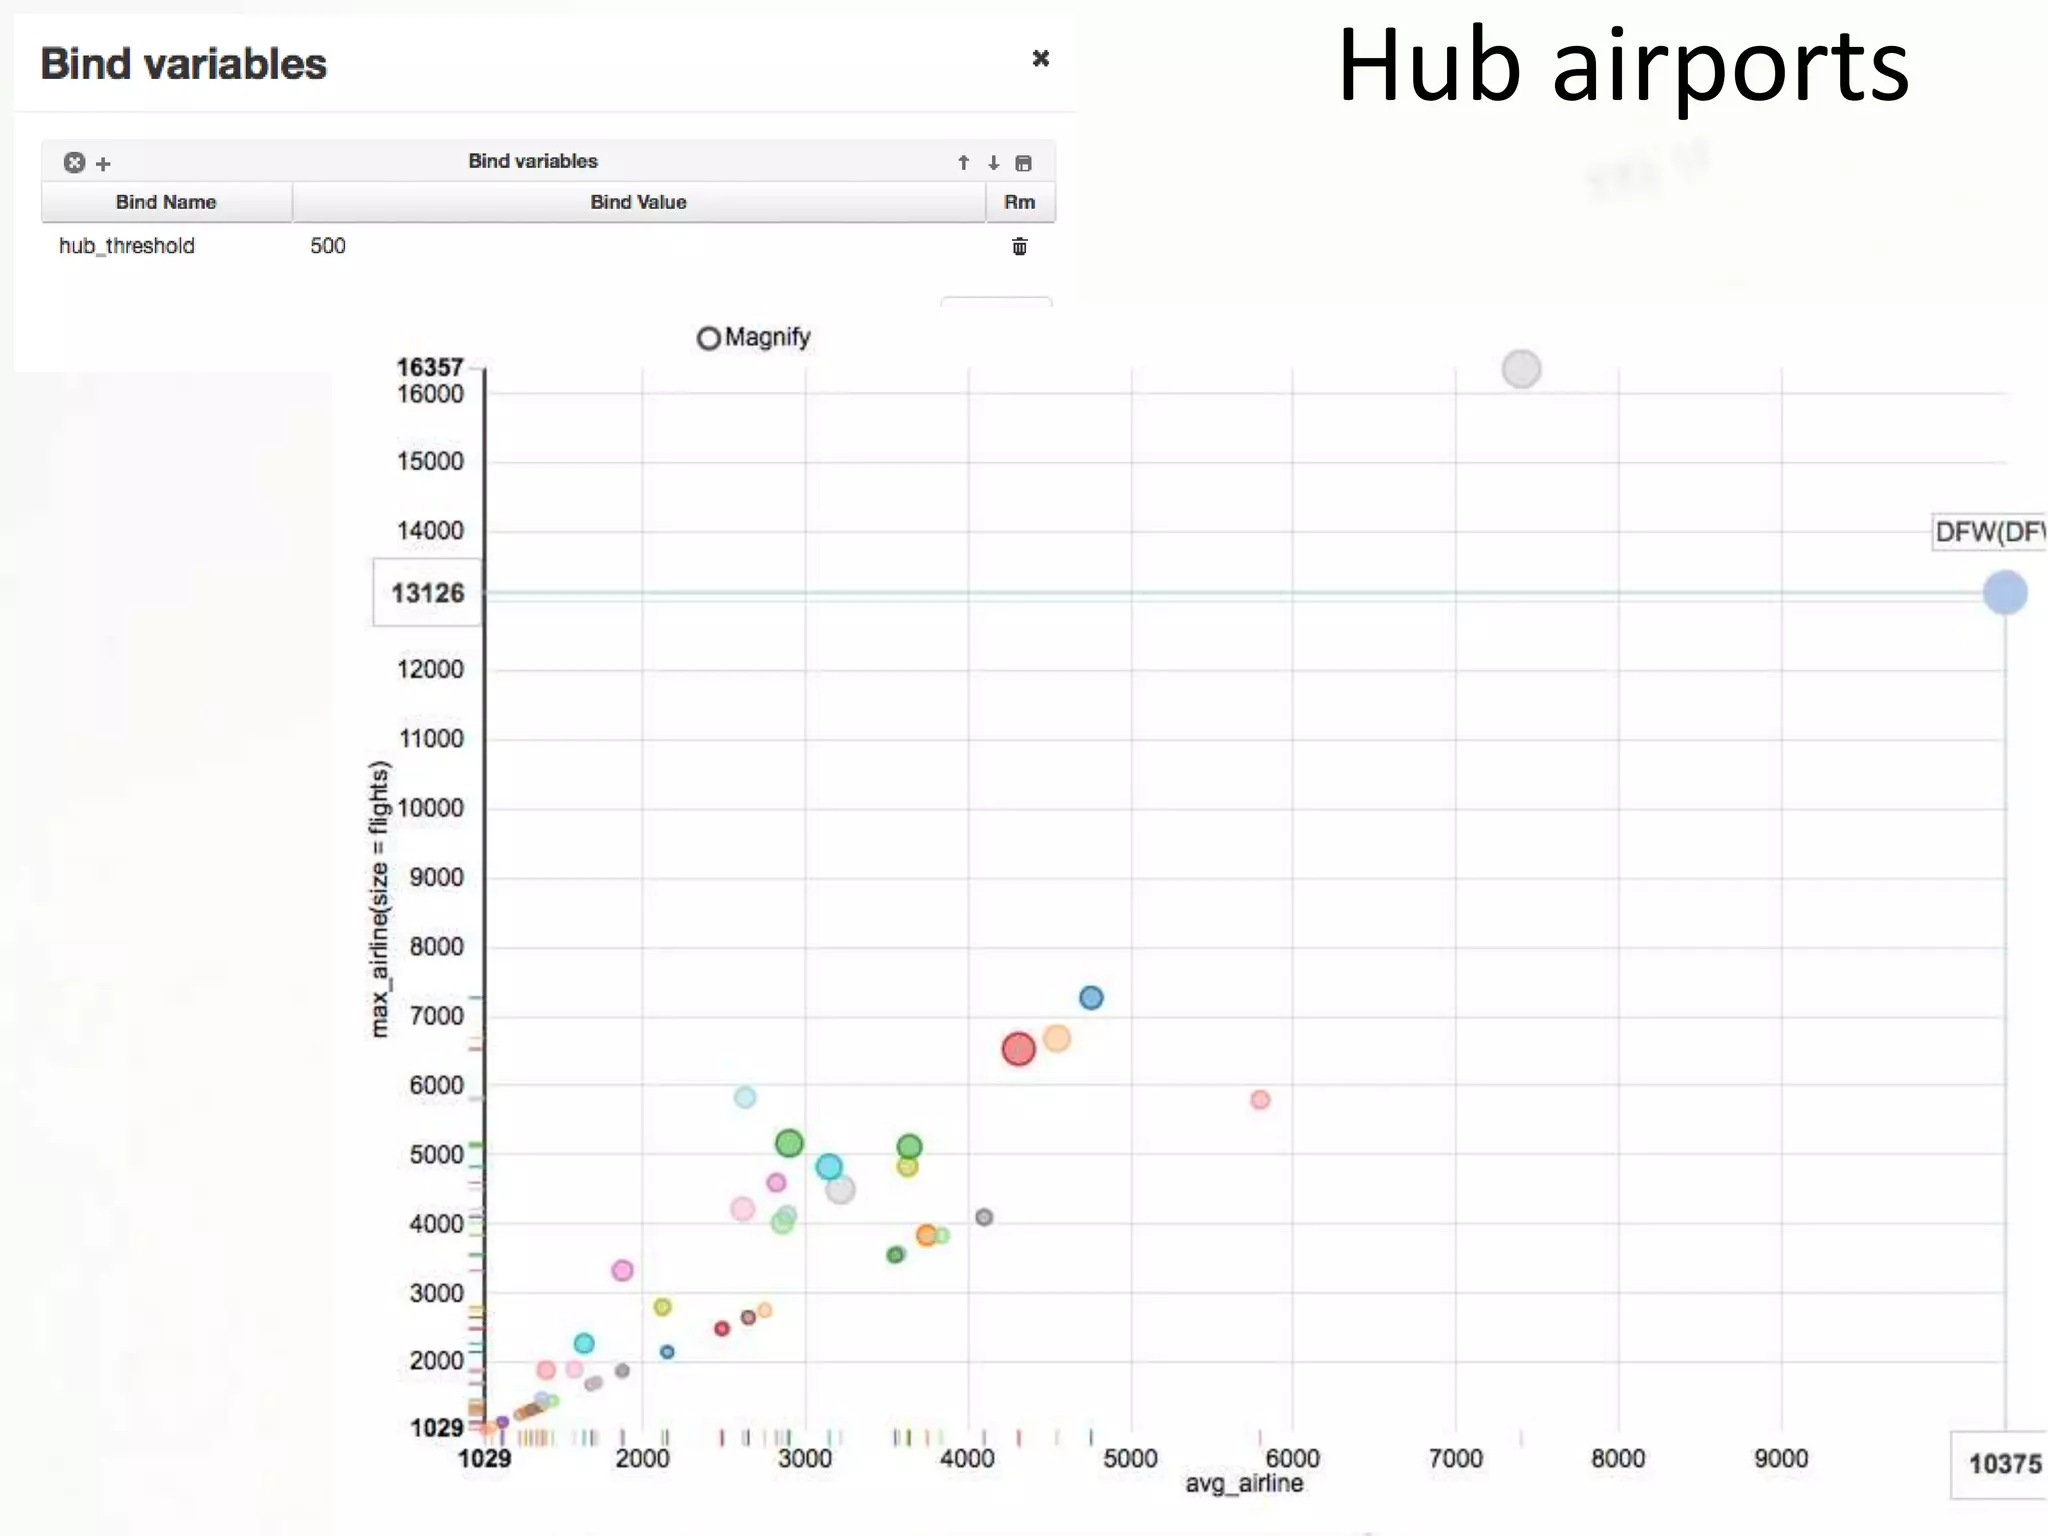
![Hub airports – try 3 { $group: { _id: { ORIGIN: "$ORIGIN", CARRIER: "$CARRIER" }, count: { $sum: 1 } } }, { $project: { airport: "$_id.ORIGIN", carrier: "$_id.CARRIER", "count": 1 } }, { $match: { "count": { $gte: "$$hub_threshold" } } }, { $group: { _id: { airport: "$airport" }, airlines: { $sum: 1 }, flights: { $sum: "$count" }, avg_airline: { $avg: "$count" }, max_airline: { $max: "$count" } } }, { $project: { "airlines": 1, "flights": 1, "avg_airline": 1, "max_airline": 1, "avg_no_max": { $divide: [ { $subtract: [ "$flights", "$max_airline" ] }, "$airlines" ] } } }, { $sort: { "flights": -1 } }](https://image.slidesharecdn.com/aggmongodaysrbn-141001121340-phpapp01/75/MongoDB-Analytics-Learn-Aggregation-by-Example-Exploratory-Analytics-and-Visualization-Using-Flight-Data-20-2048.jpg)
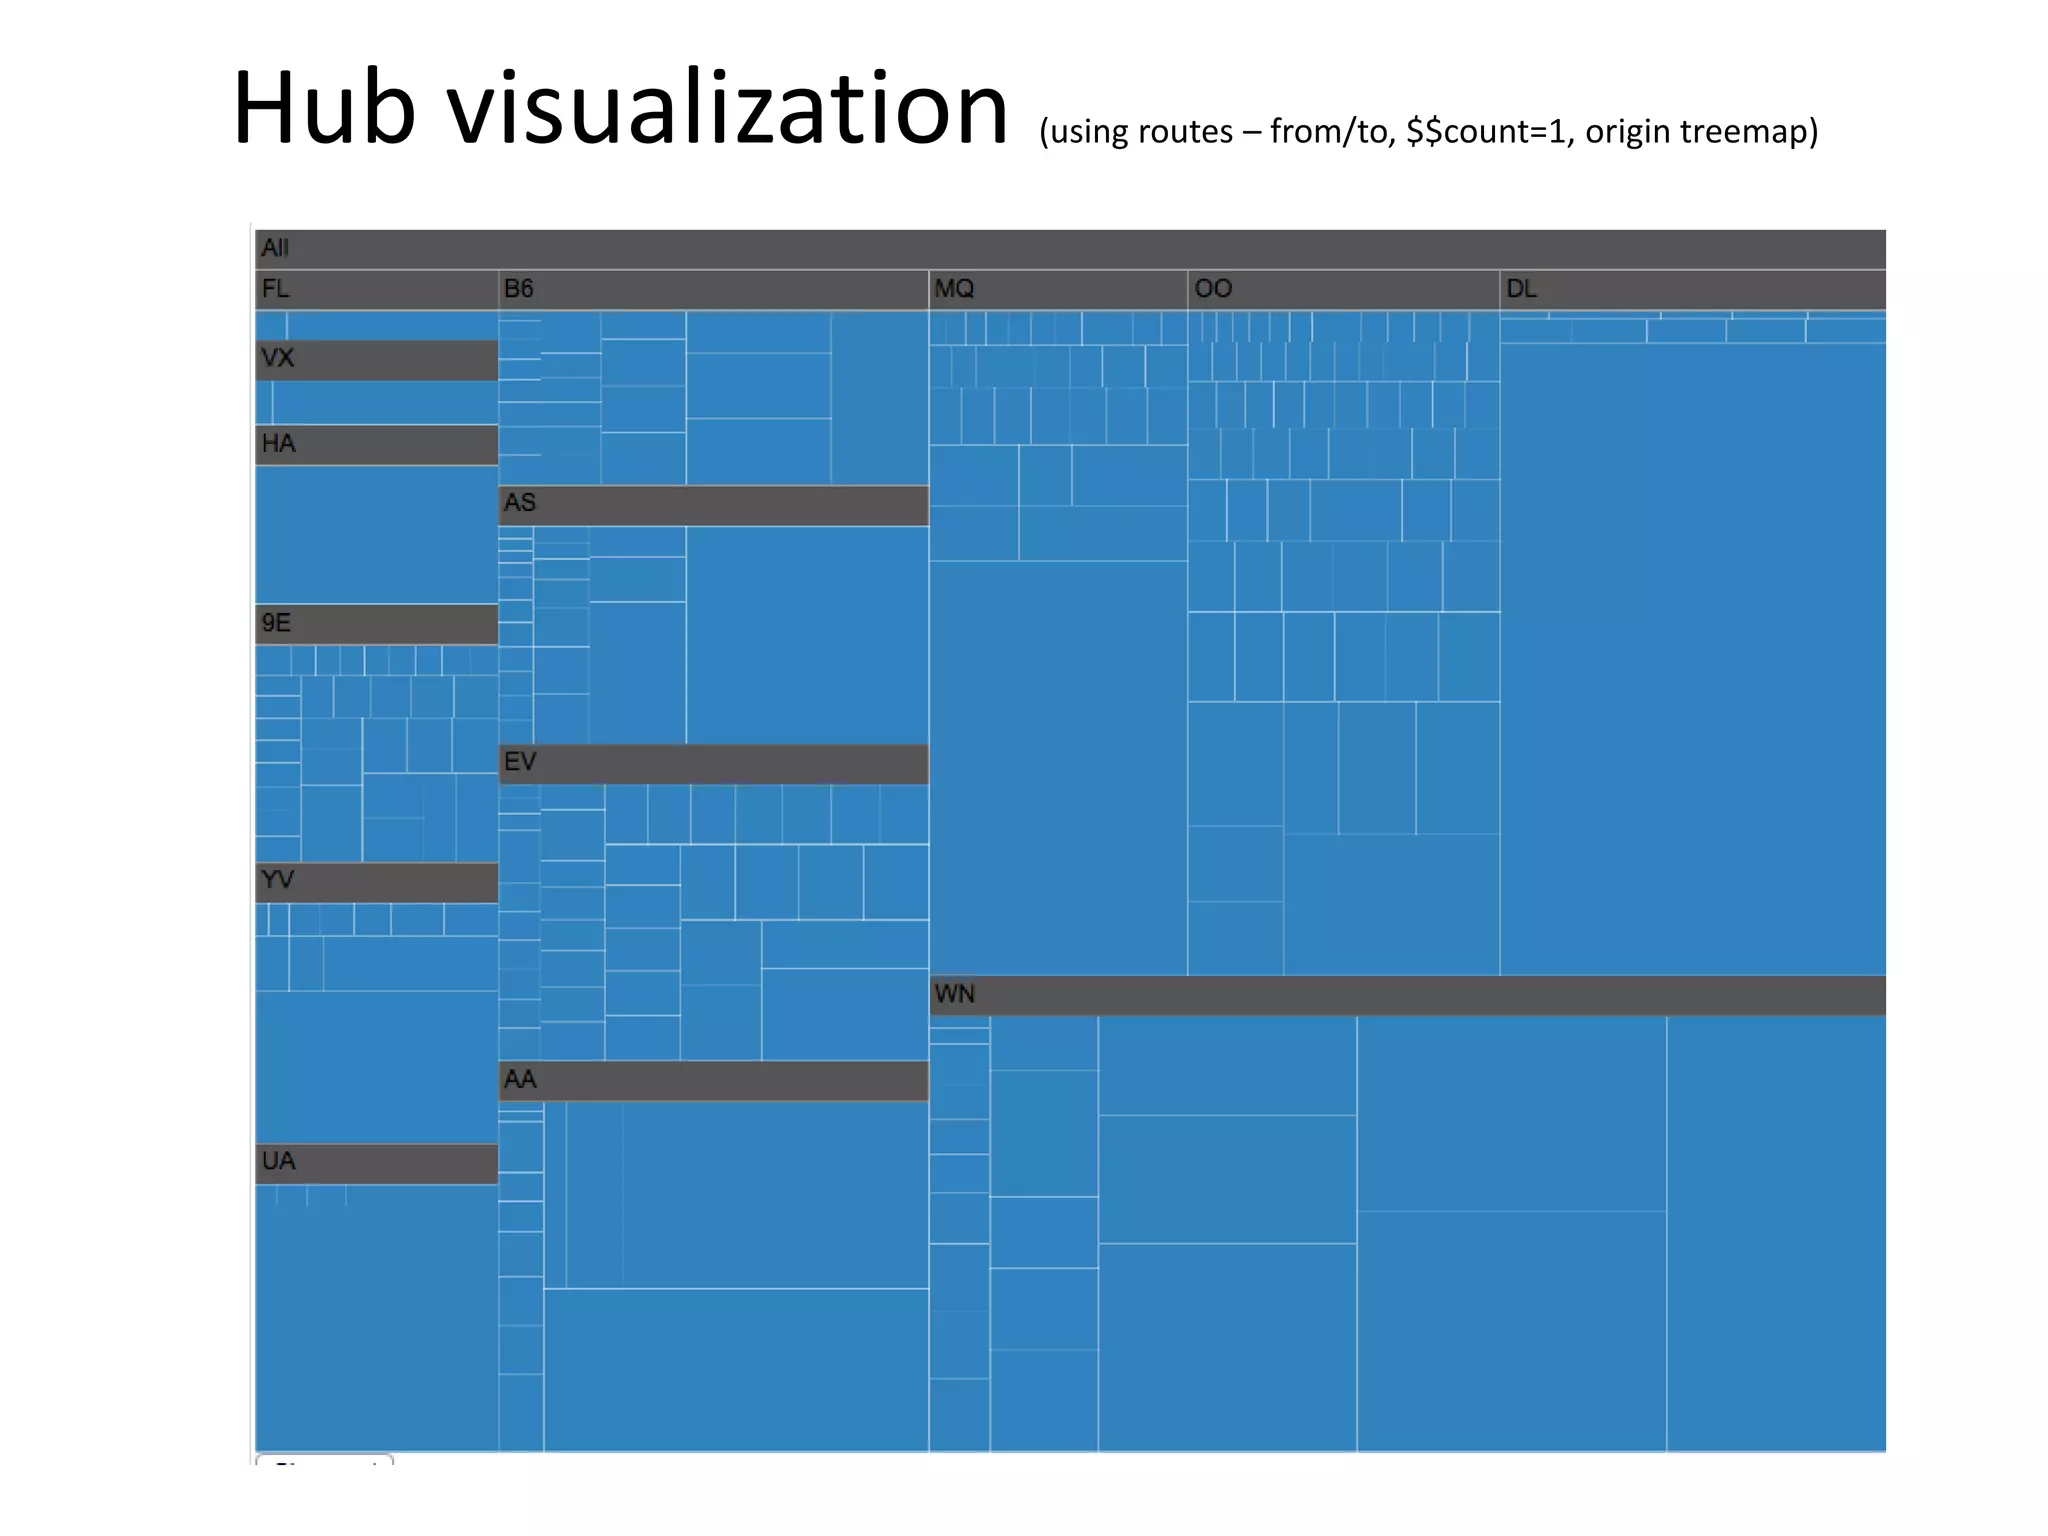
![From-to Insensitive { $group: { _id: { UNIQUE_CARRIER: "$UNIQUE_CARRIER", ORIGIN: "$ORIGIN", DEST: "$DEST" }, count: { $sum: 1 } } }, { $match: { "count": { $gt: "$$count_threshold" } } }, { $project: { _id_UNIQUE_CARRIER: "$_id.UNIQUE_CARRIER", "count": 1, rroute: { $cond: [ { $lt: [ { $cmp: [ "$_id.ORIGIN", "$_id.DEST" ] }, 0 ] }, { $concat: [ "$_id.ORIGIN", "$_id.DEST" ] }, { $concat: [ "$_id.DEST", "$_id.ORIGIN" ] } ] } } }, { $group: { _id: { _id_UNIQUE_CARRIER: "$_id_UNIQUE_CARRIER", rroute: "$rroute" }, _sum_count: { $sum: "$count" } } }](https://image.slidesharecdn.com/aggmongodaysrbn-141001121340-phpapp01/75/MongoDB-Analytics-Learn-Aggregation-by-Example-Exploratory-Analytics-and-Visualization-Using-Flight-Data-22-2048.jpg)

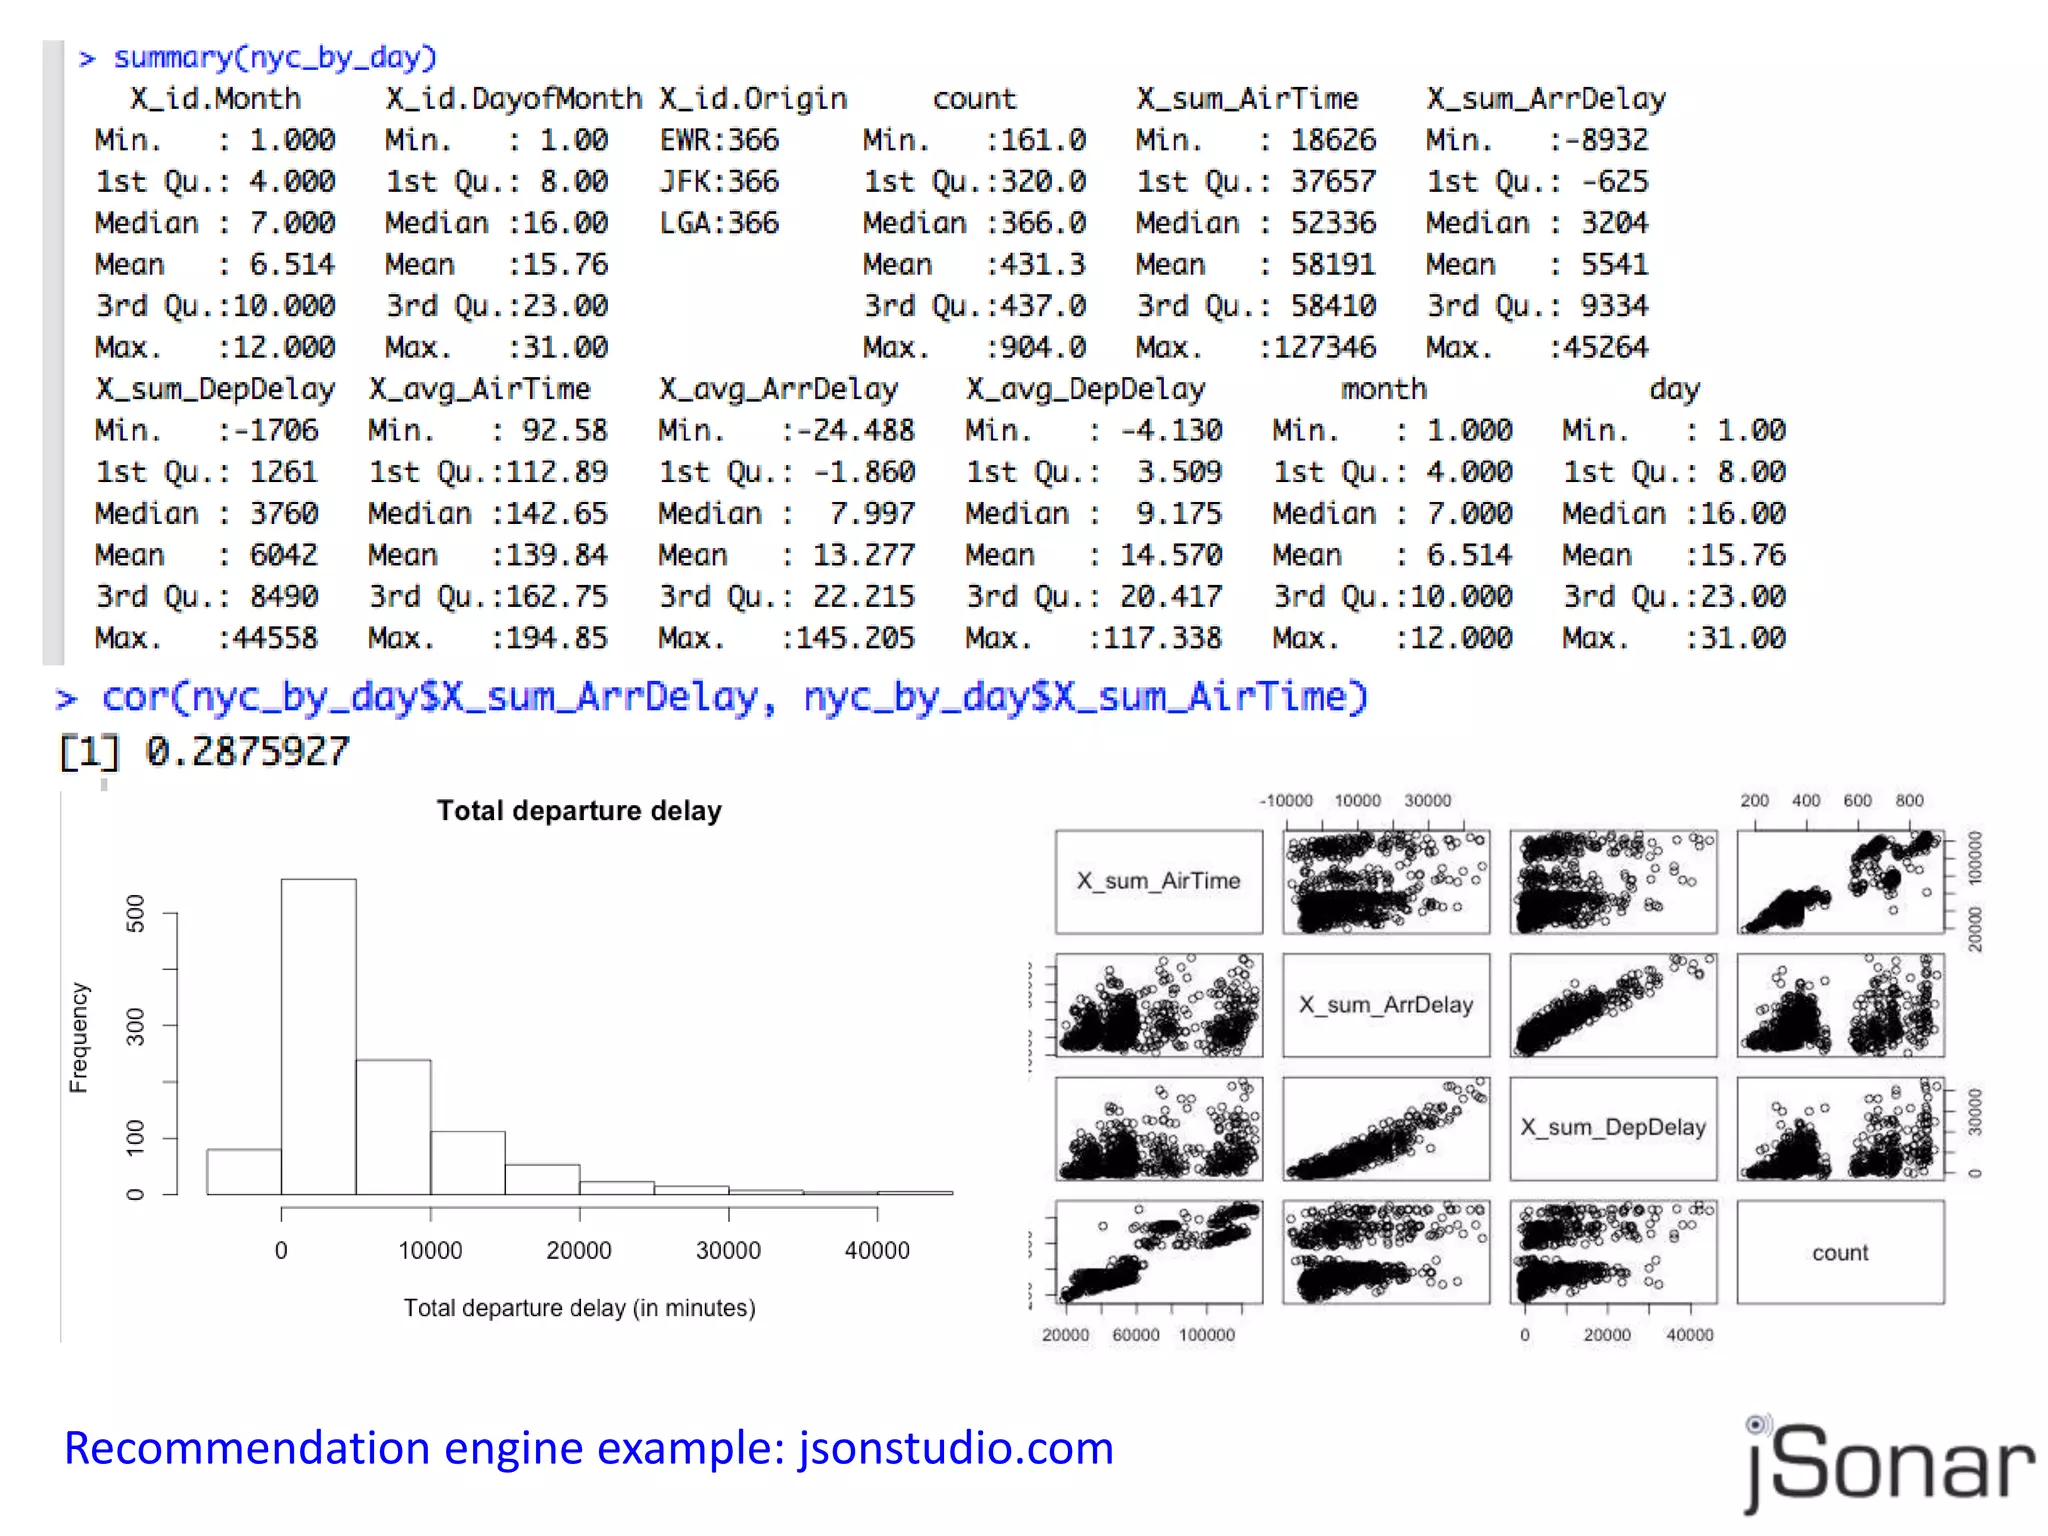


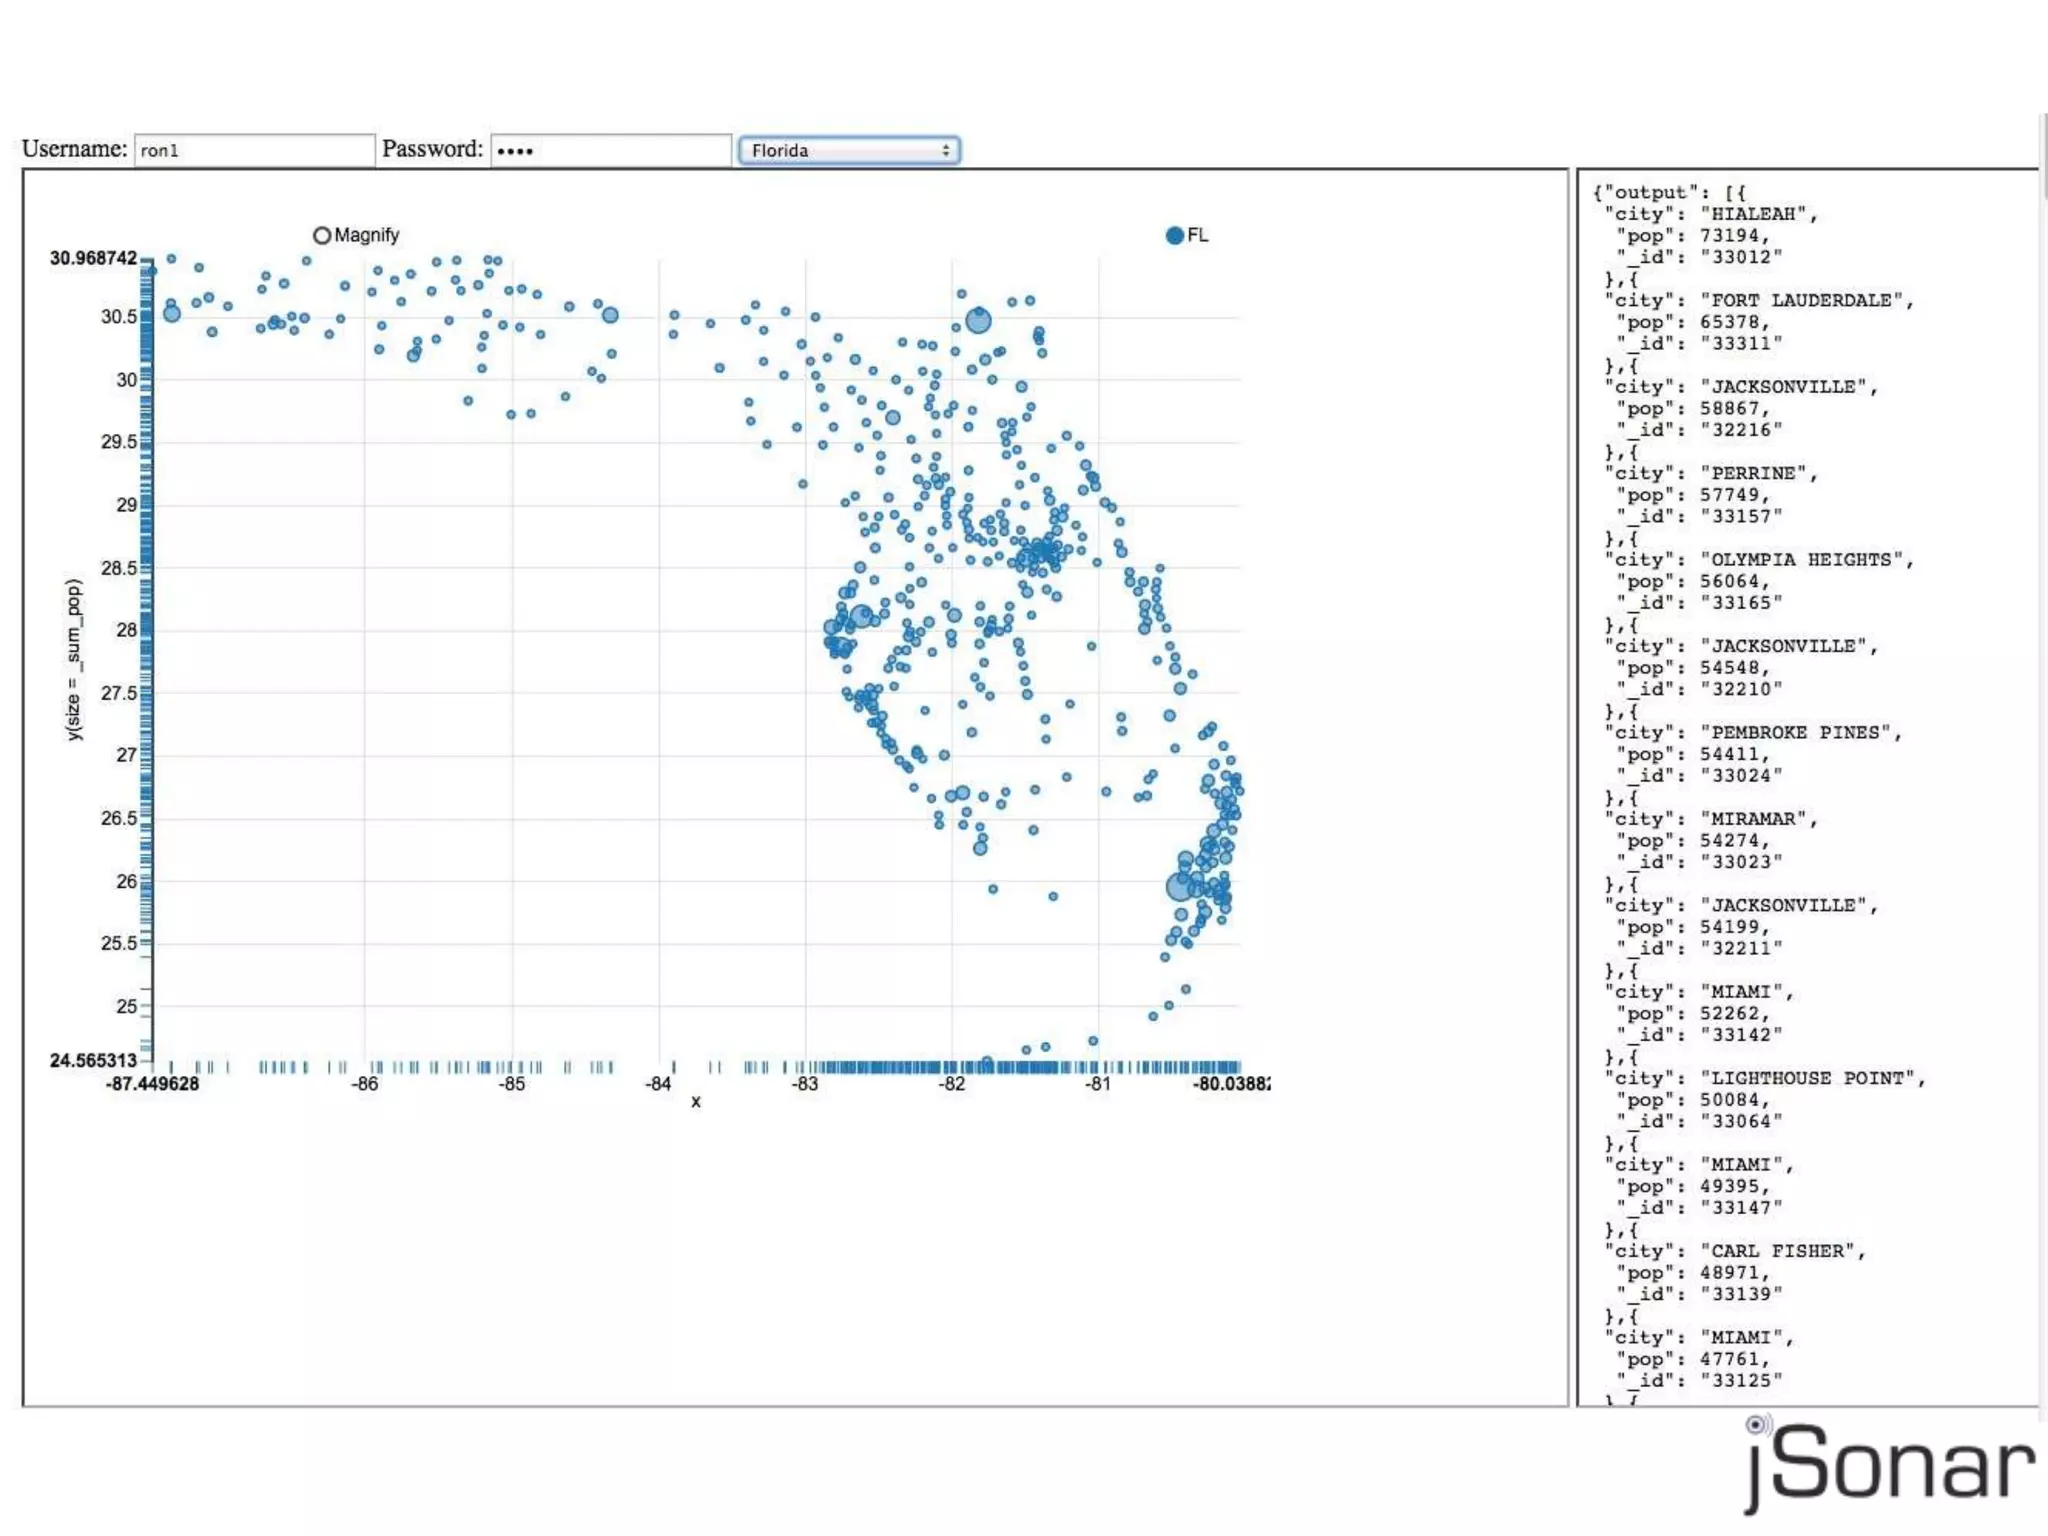

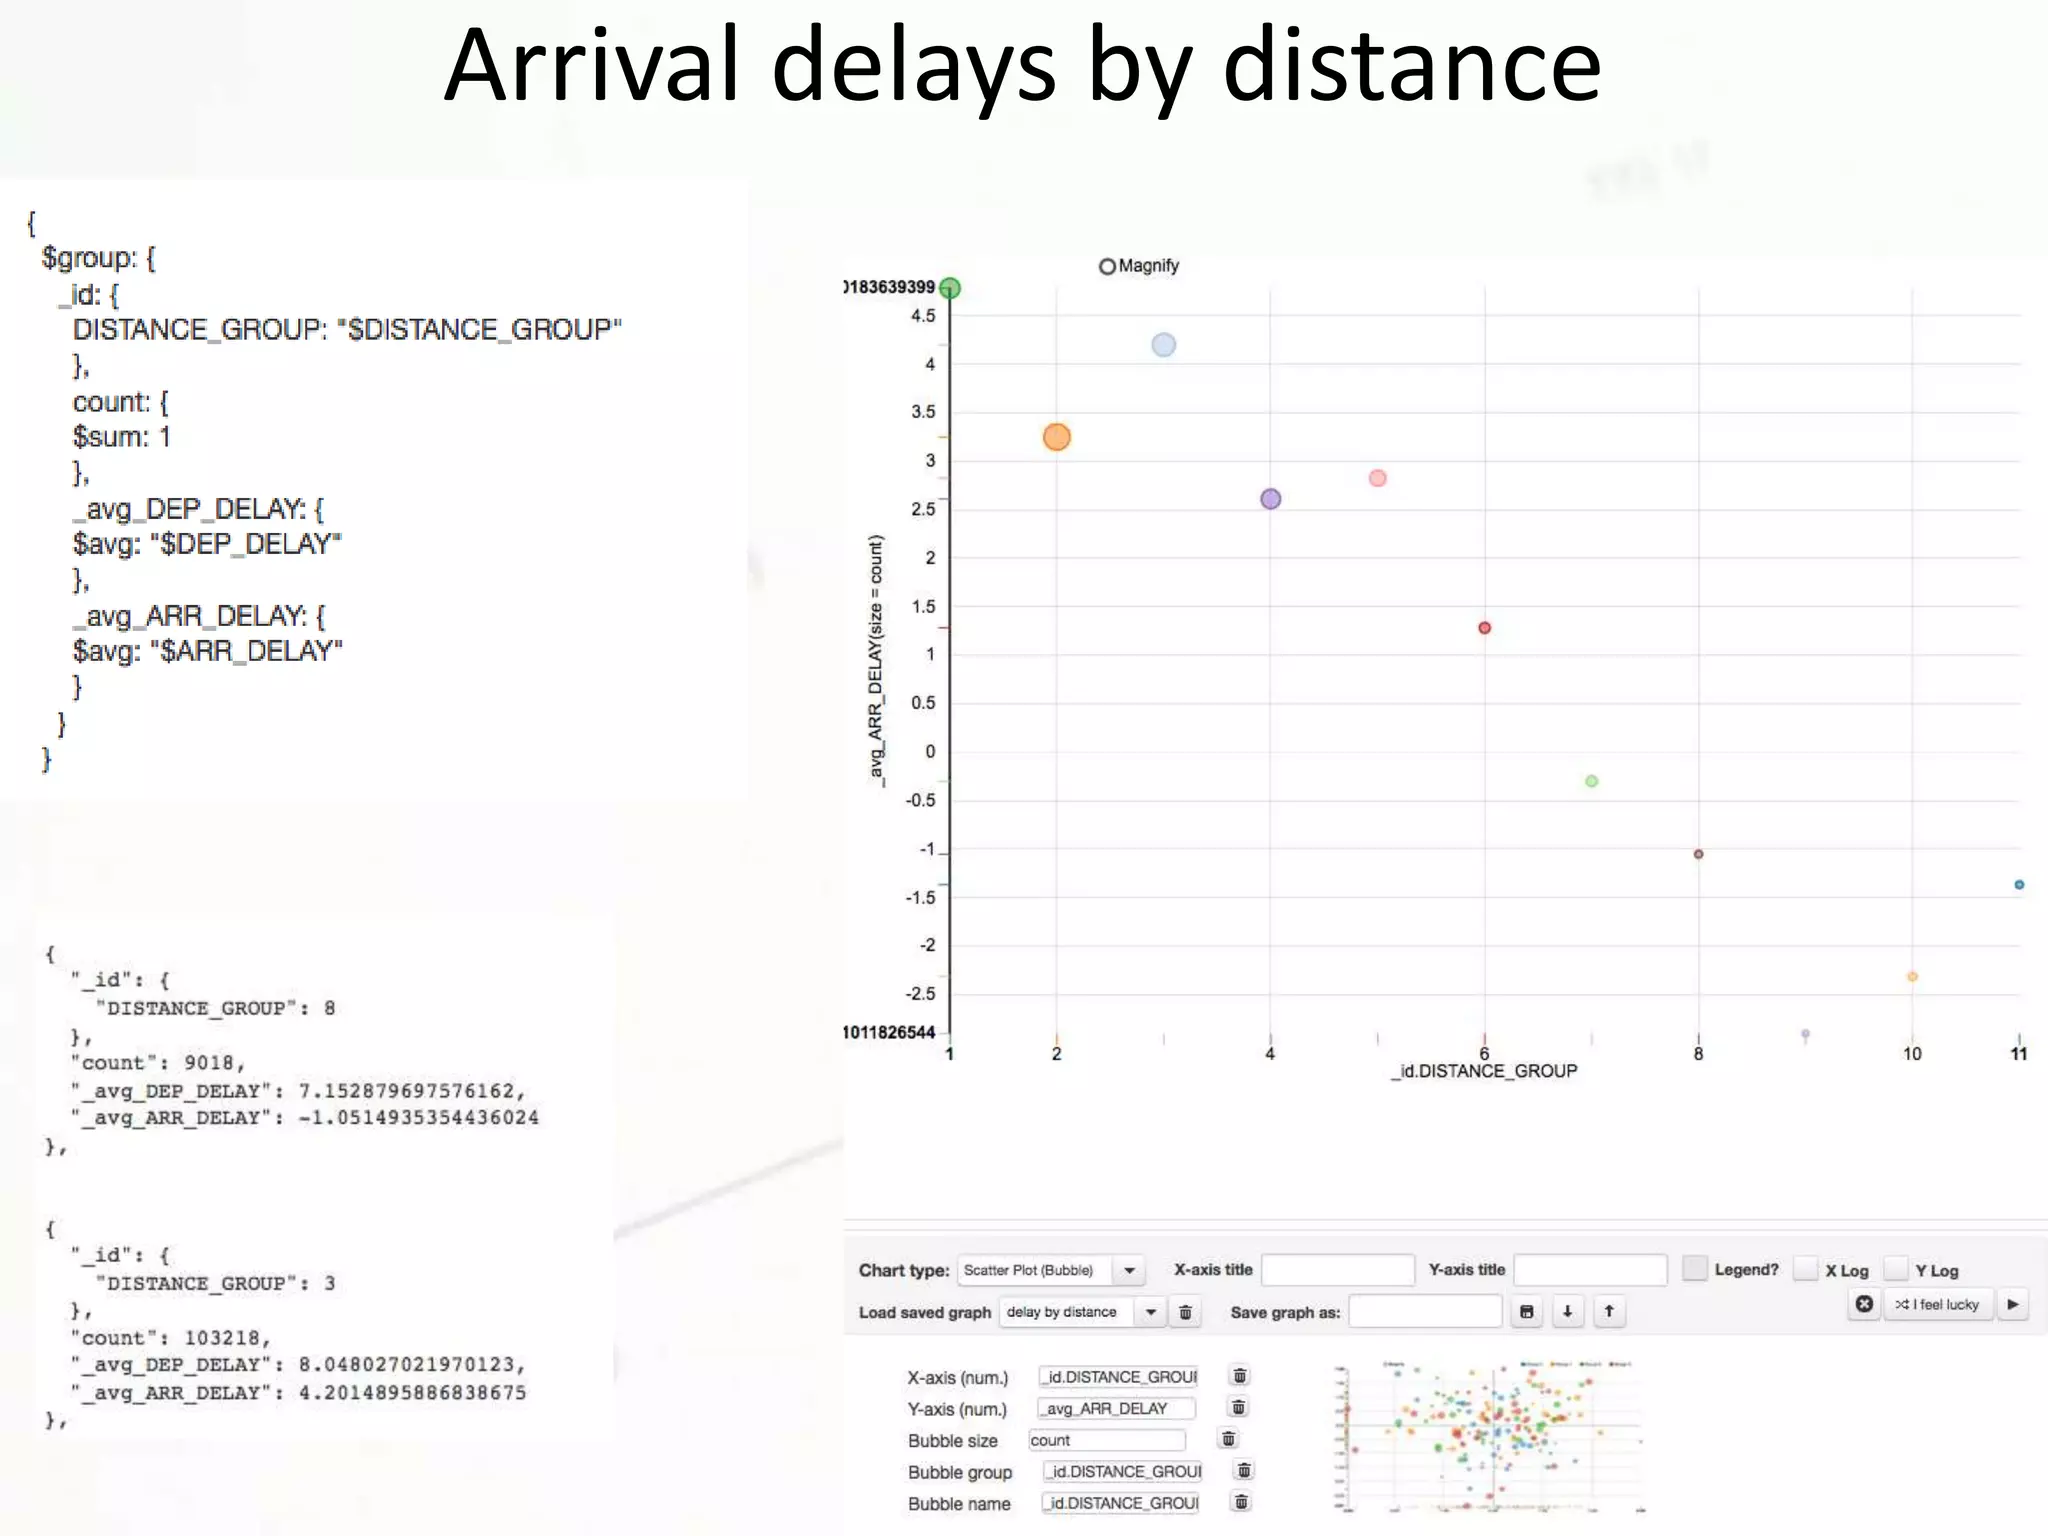
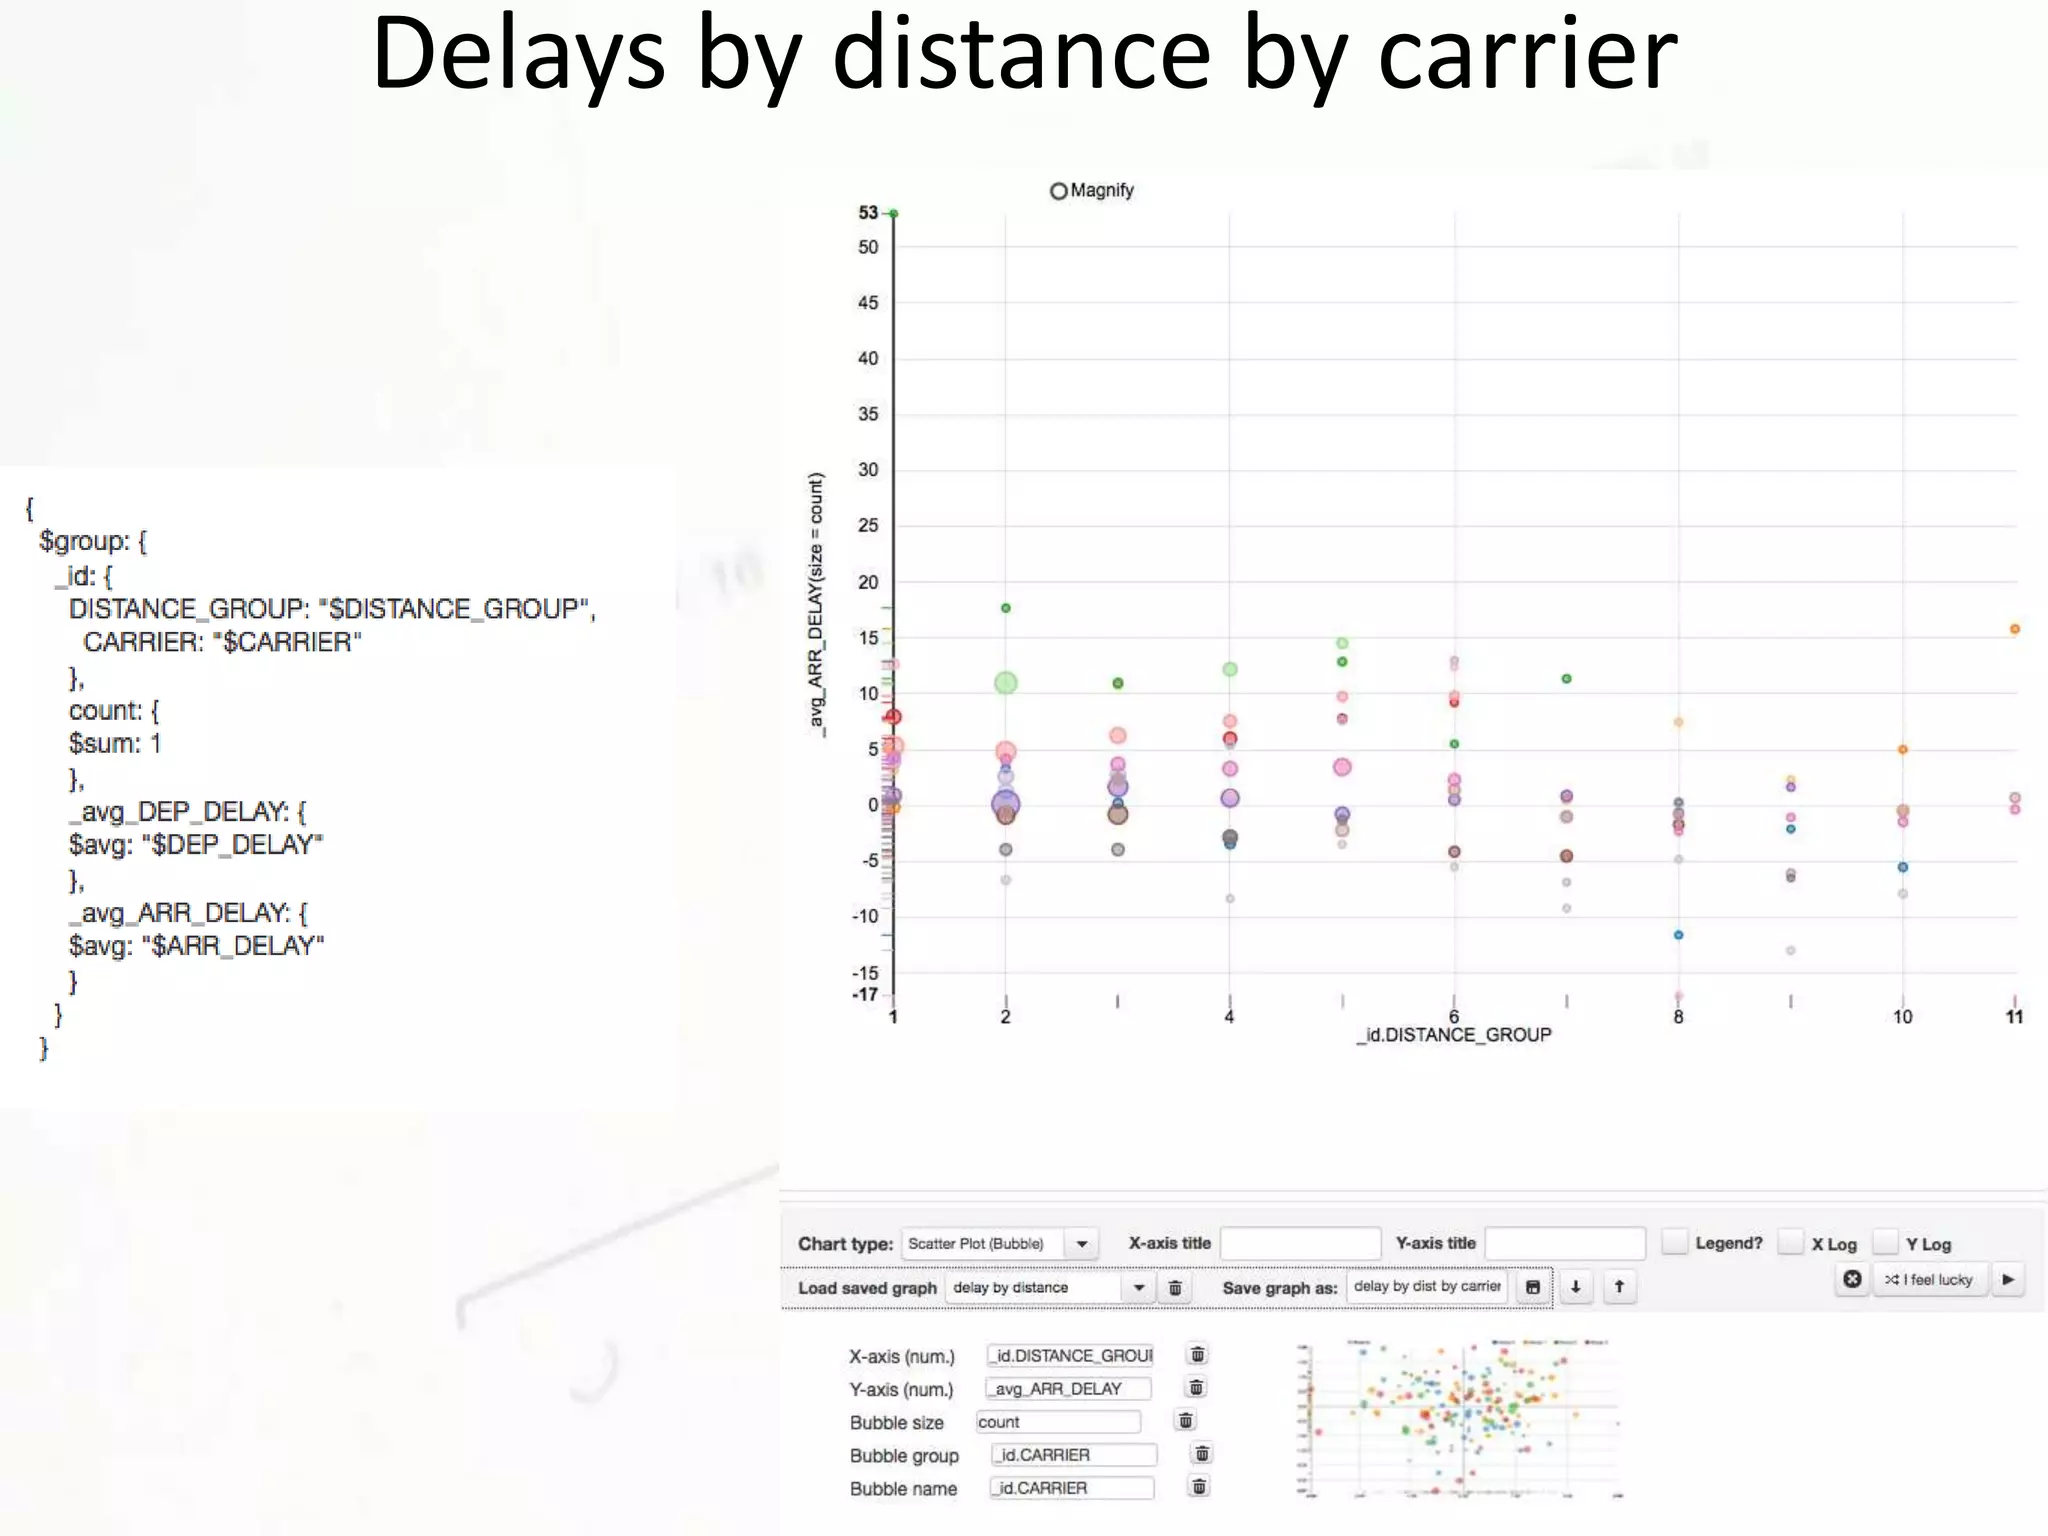
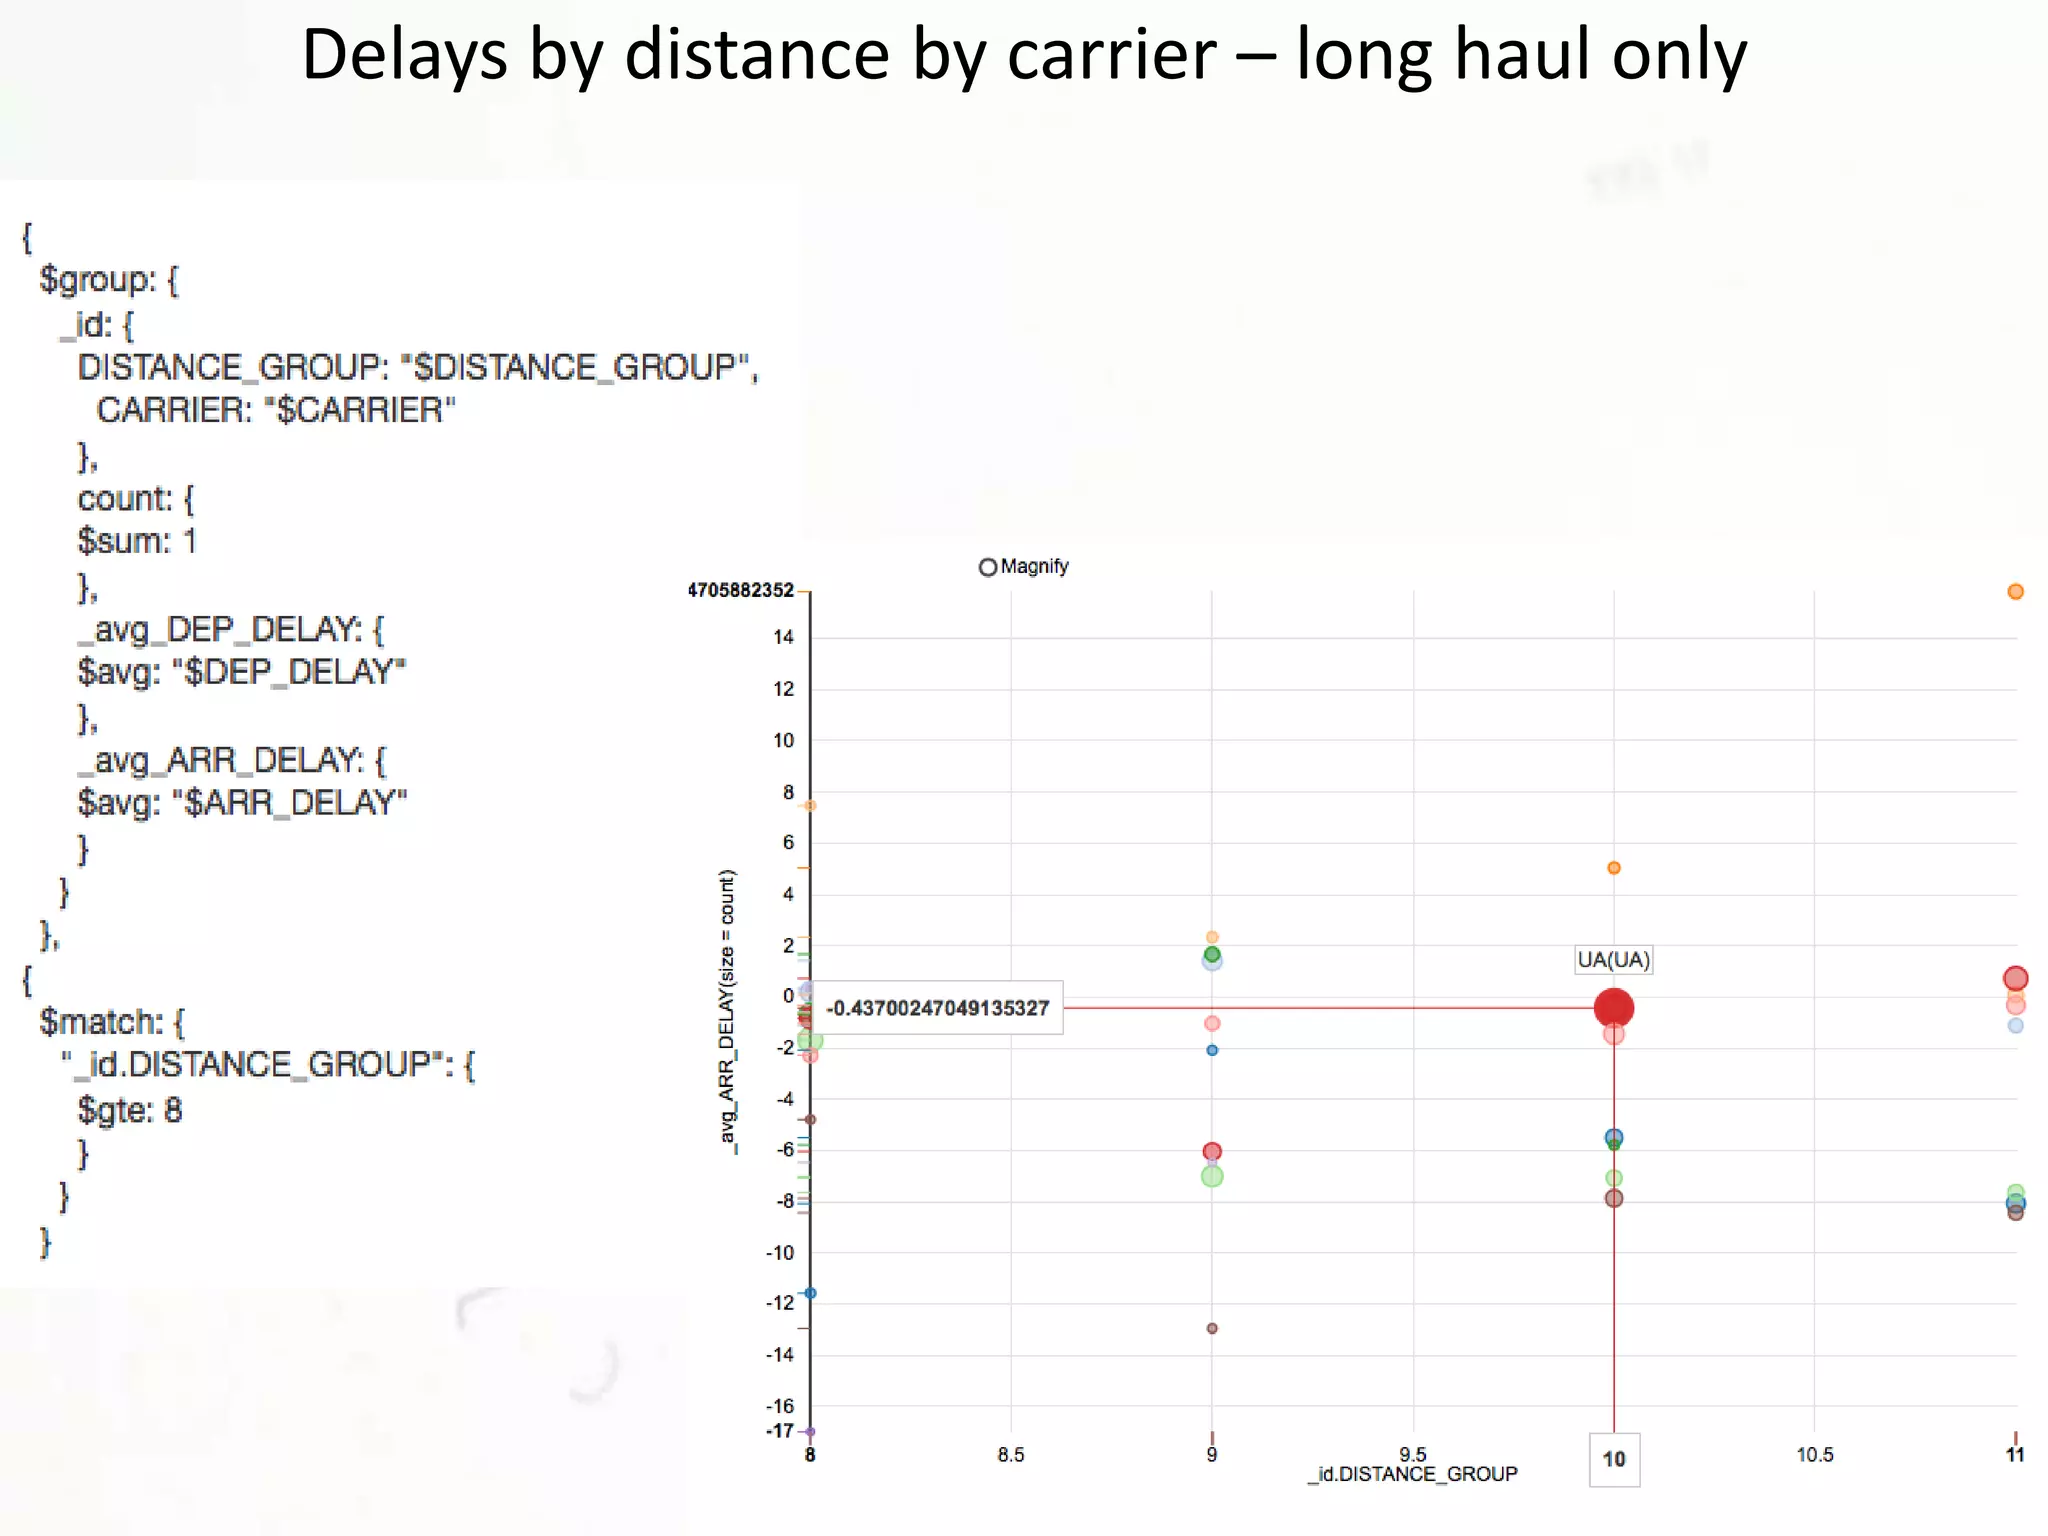
This document discusses analyzing flight data using MongoDB aggregation pipelines and visualization with JSON Studio. It provides examples of aggregation queries to group and calculate statistics on carriers, airports, routes and delays. These include finding the largest carriers, airports with most cancellations, carrier delay statistics, and hub airports. Visualizing the results in JSON Studio is recommended to explore the data further.