Download as PDF, PPTX


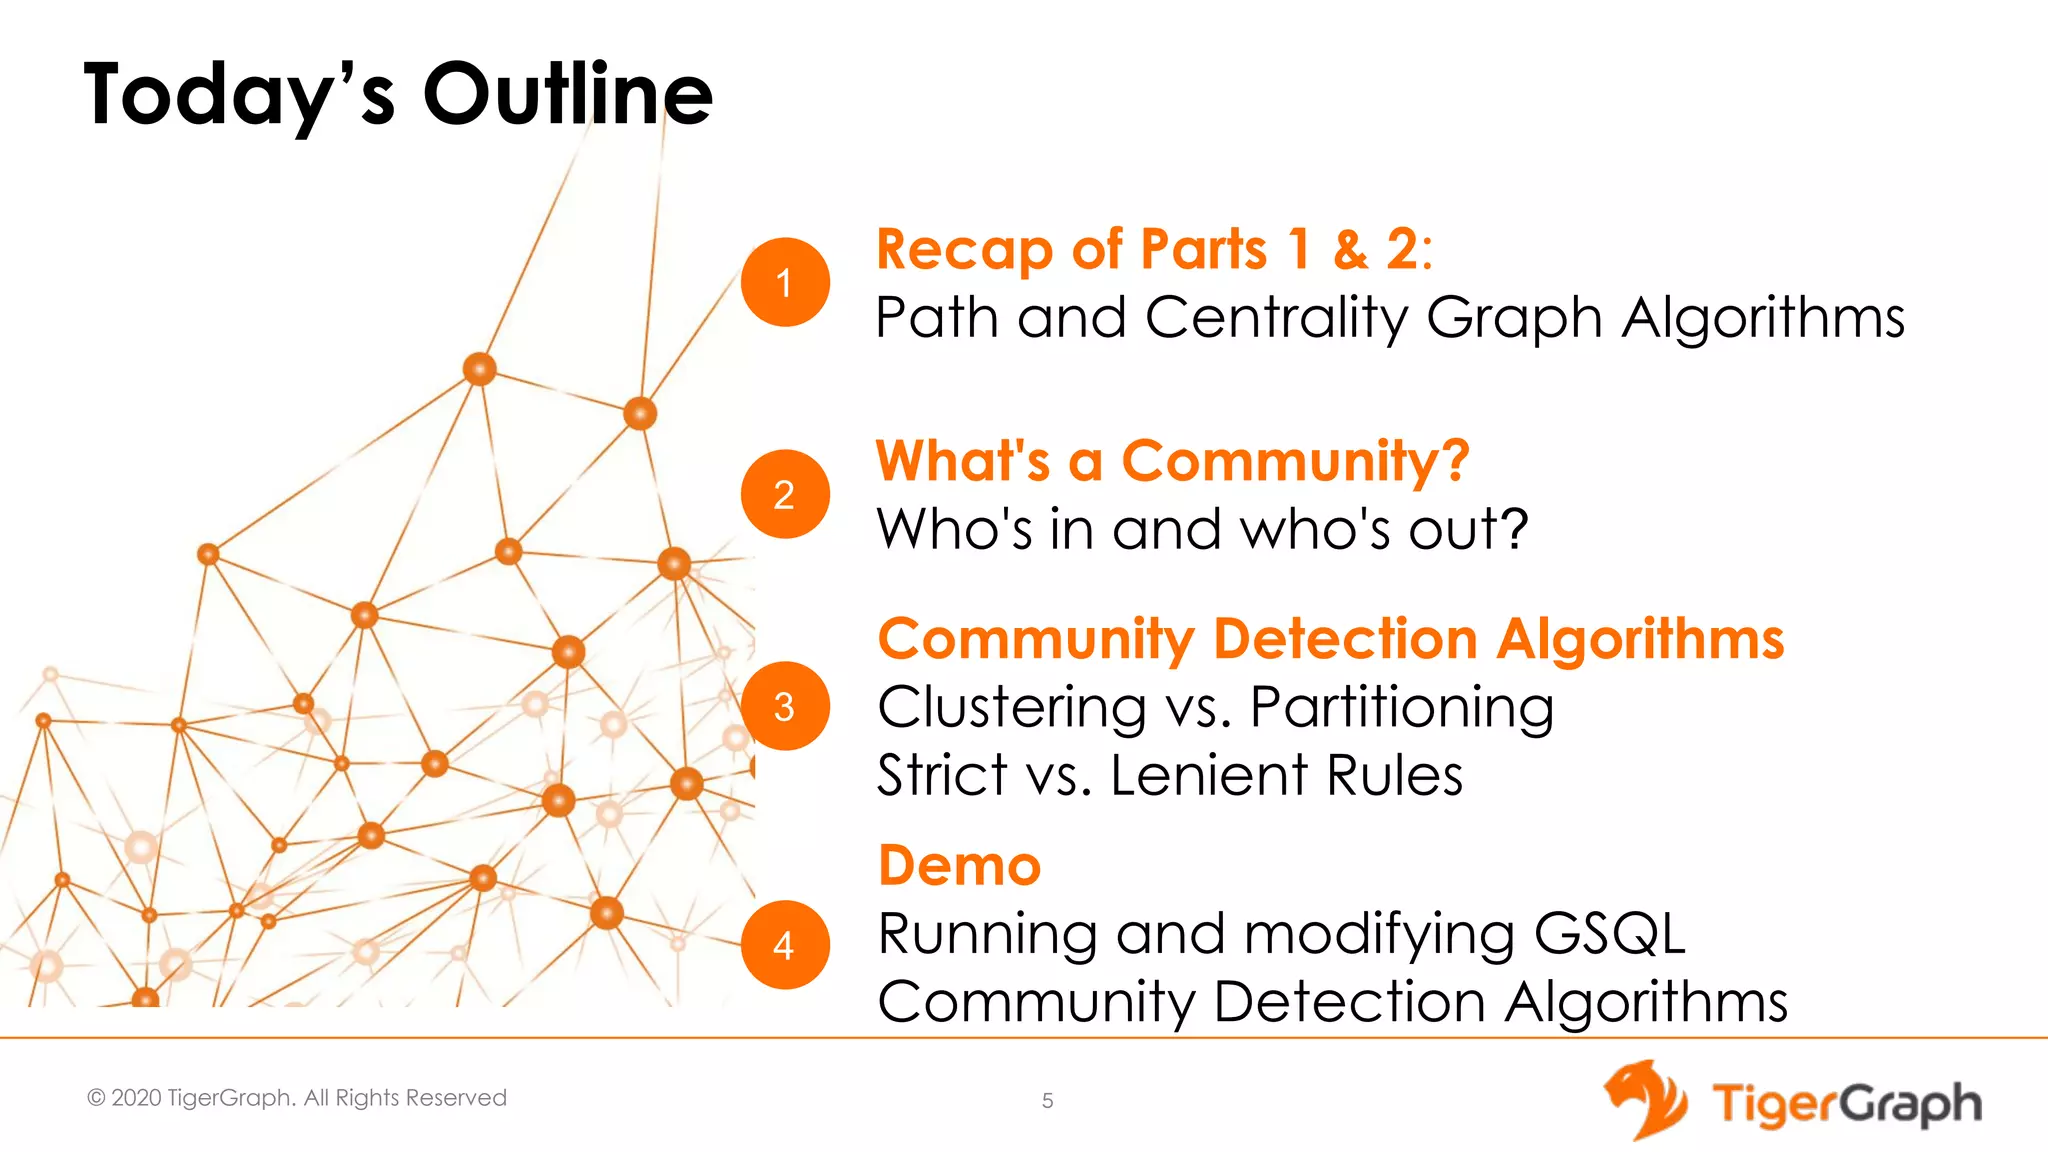
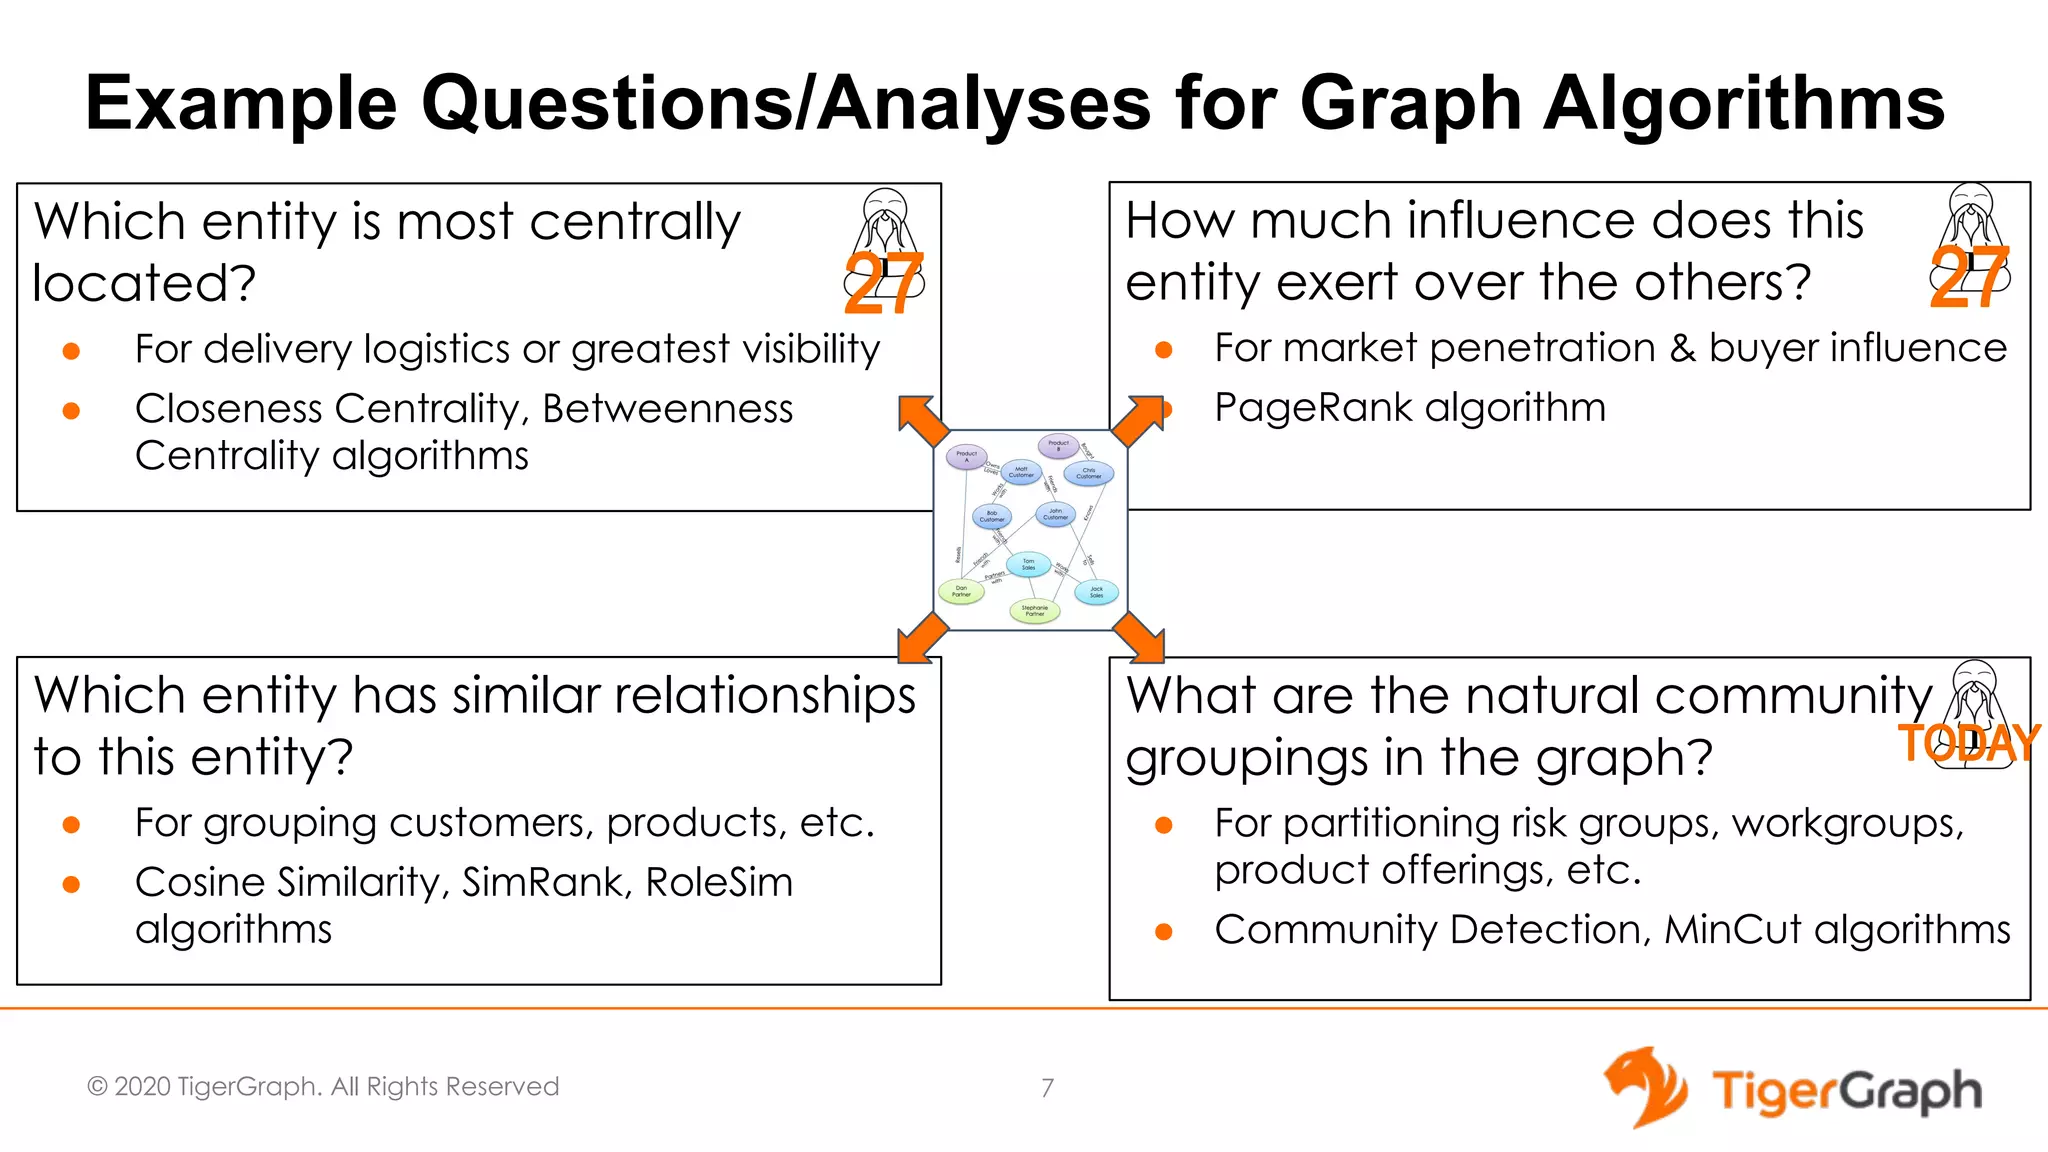
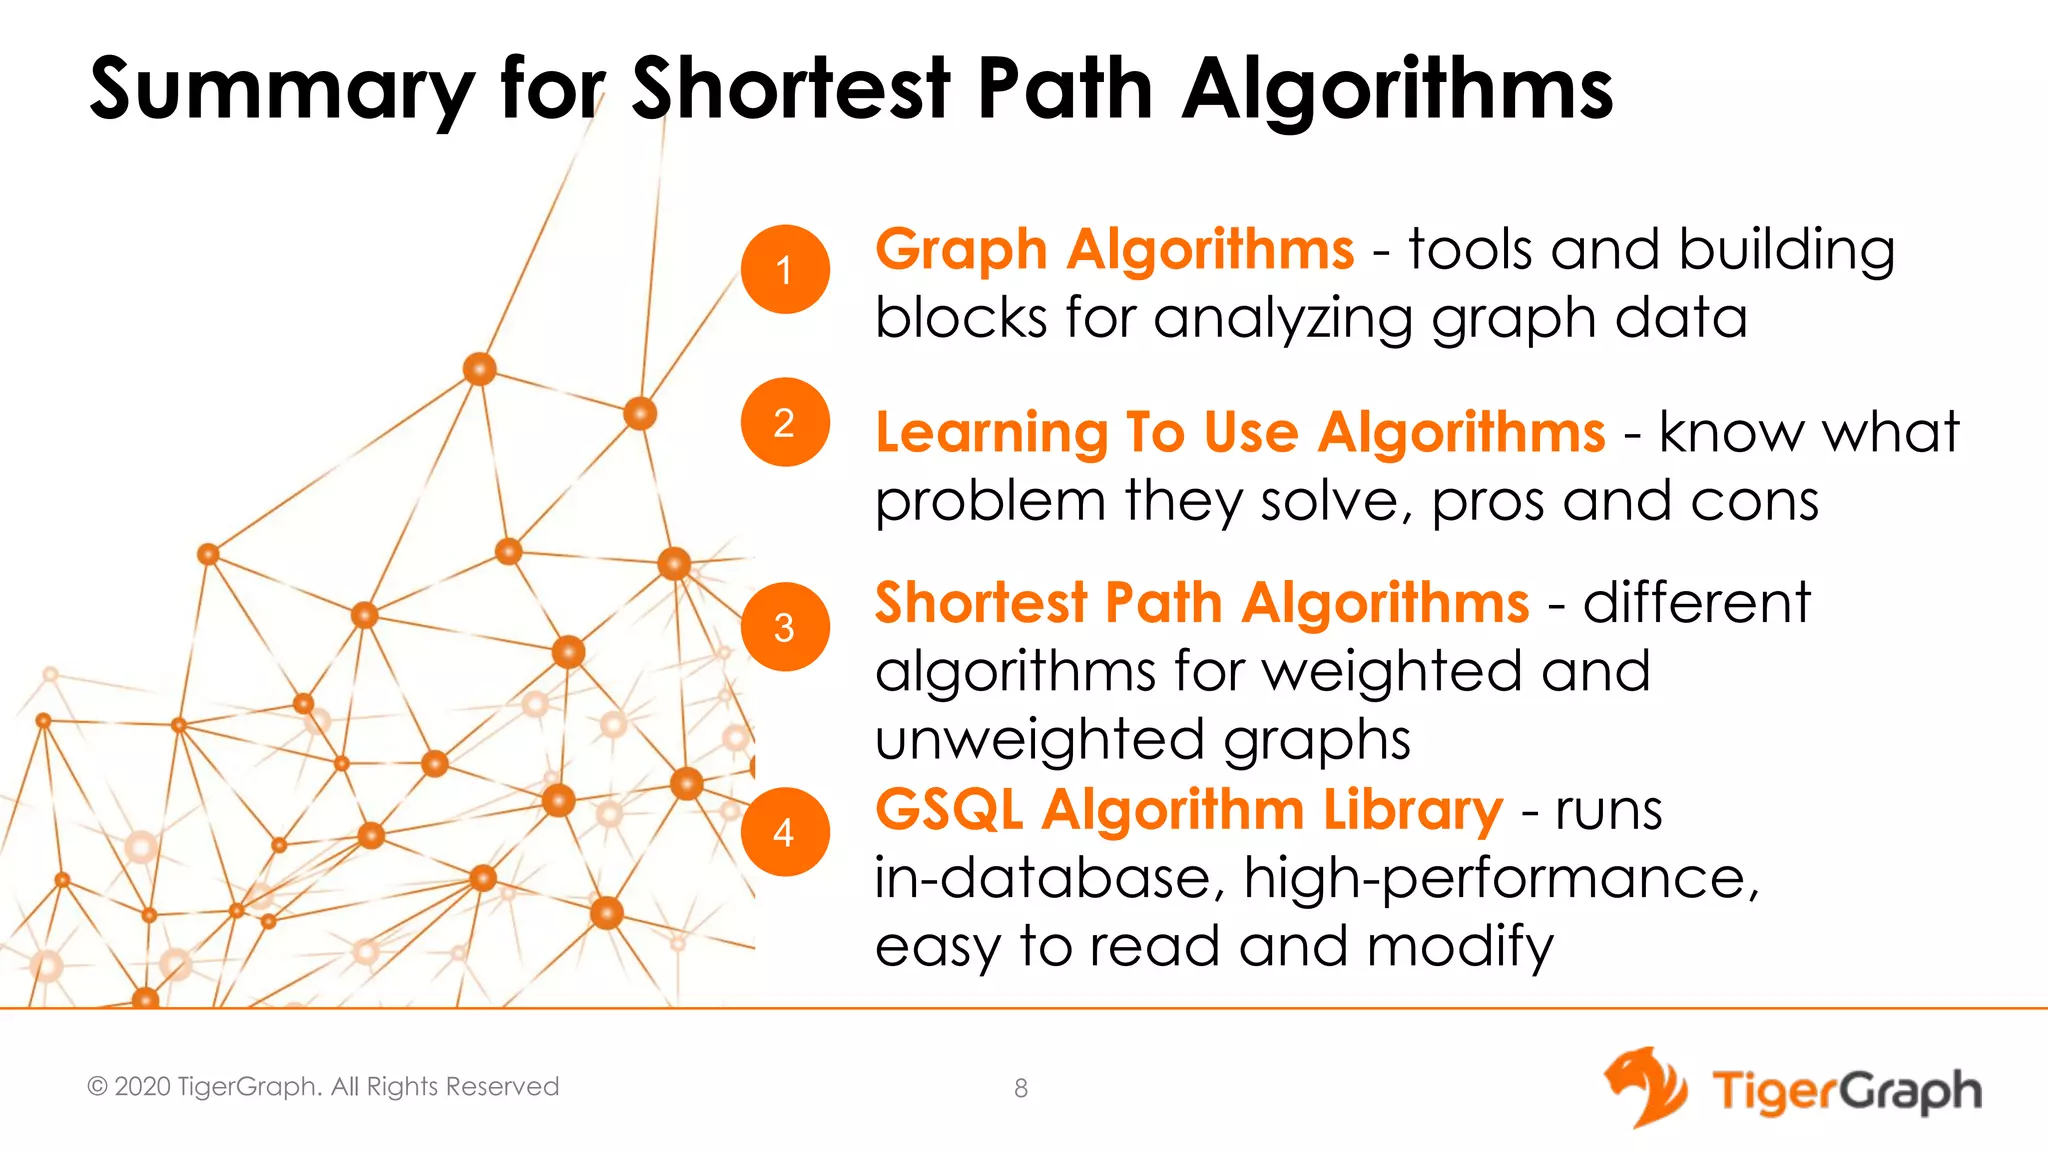
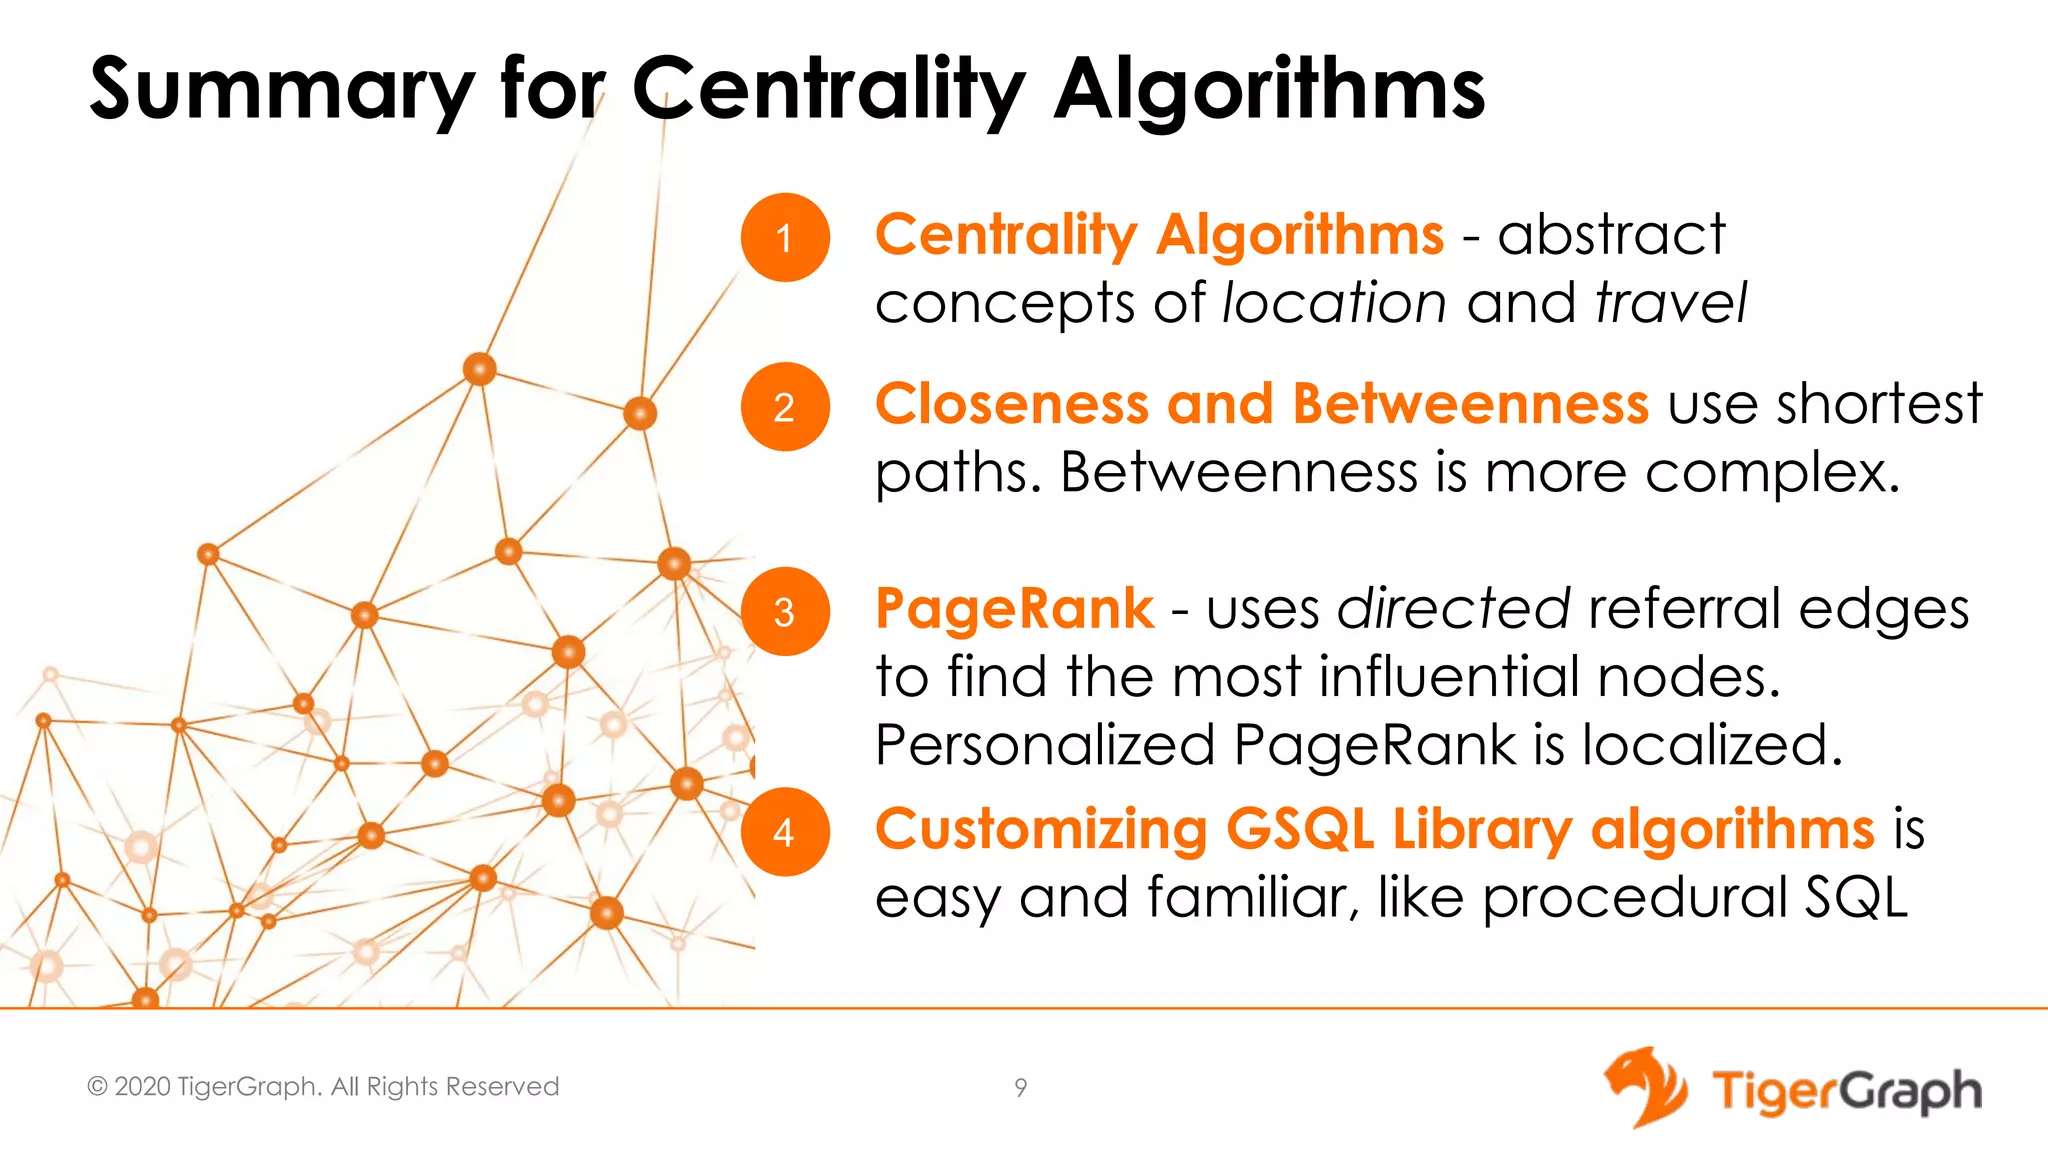
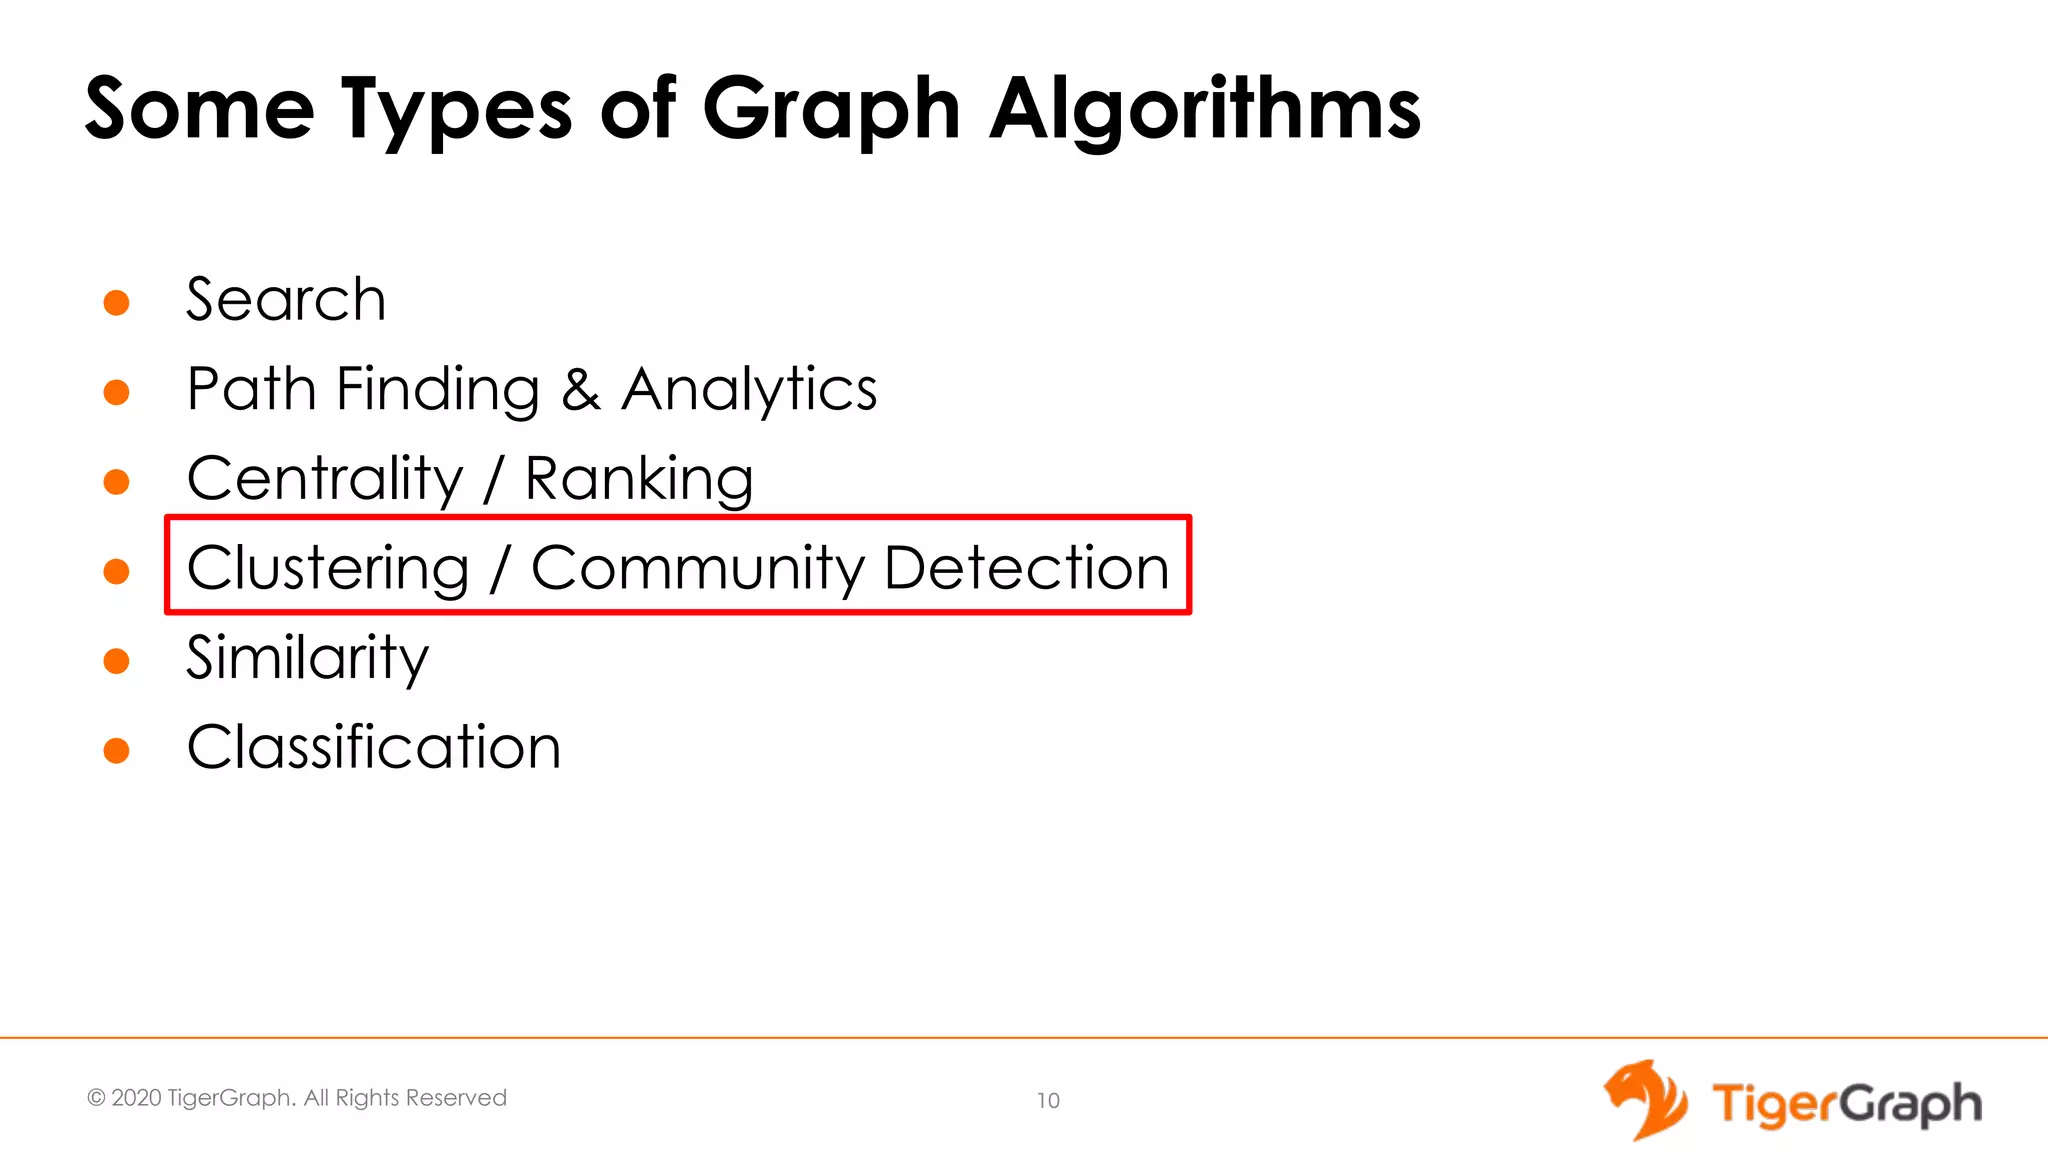


The document outlines a webinar hosted by Victor Lee, focusing on the use of graph algorithms for community detection in advanced analytics. It discusses the principles of community detection, different types of graph algorithms, and their applications in various fields such as healthcare and marketing. Additionally, it highlights the features of the GSQL graph algorithm library and includes a demonstration of algorithms implemented in the TigerGraph cloud.