Download as PDF, PPTX


![© 2020 TigerGraph. All Rights Reserved Cosine Similarity If each item is described by a list of numerical values (a vector), then multiply the vectors together and divide by their lengths. ● If A=B, then Cos(A,B) = 1 19 A= (6,2) B= (4,4) Cos(A,B) = (6*4 + 2*4) / [√(6*6+2*2)√(4*4 + 4*4)] = (24+8) / [√40 √32 ] = 0.8944](https://image.slidesharecdn.com/graphgurus30graphalgorithms4-similarity1-200402221701/75/Using-Graph-Algorithms-For-Advanced-Analytics-Part-4-Similarity-30-graph-algorithms-4-similarity-1-19-2048.jpg)
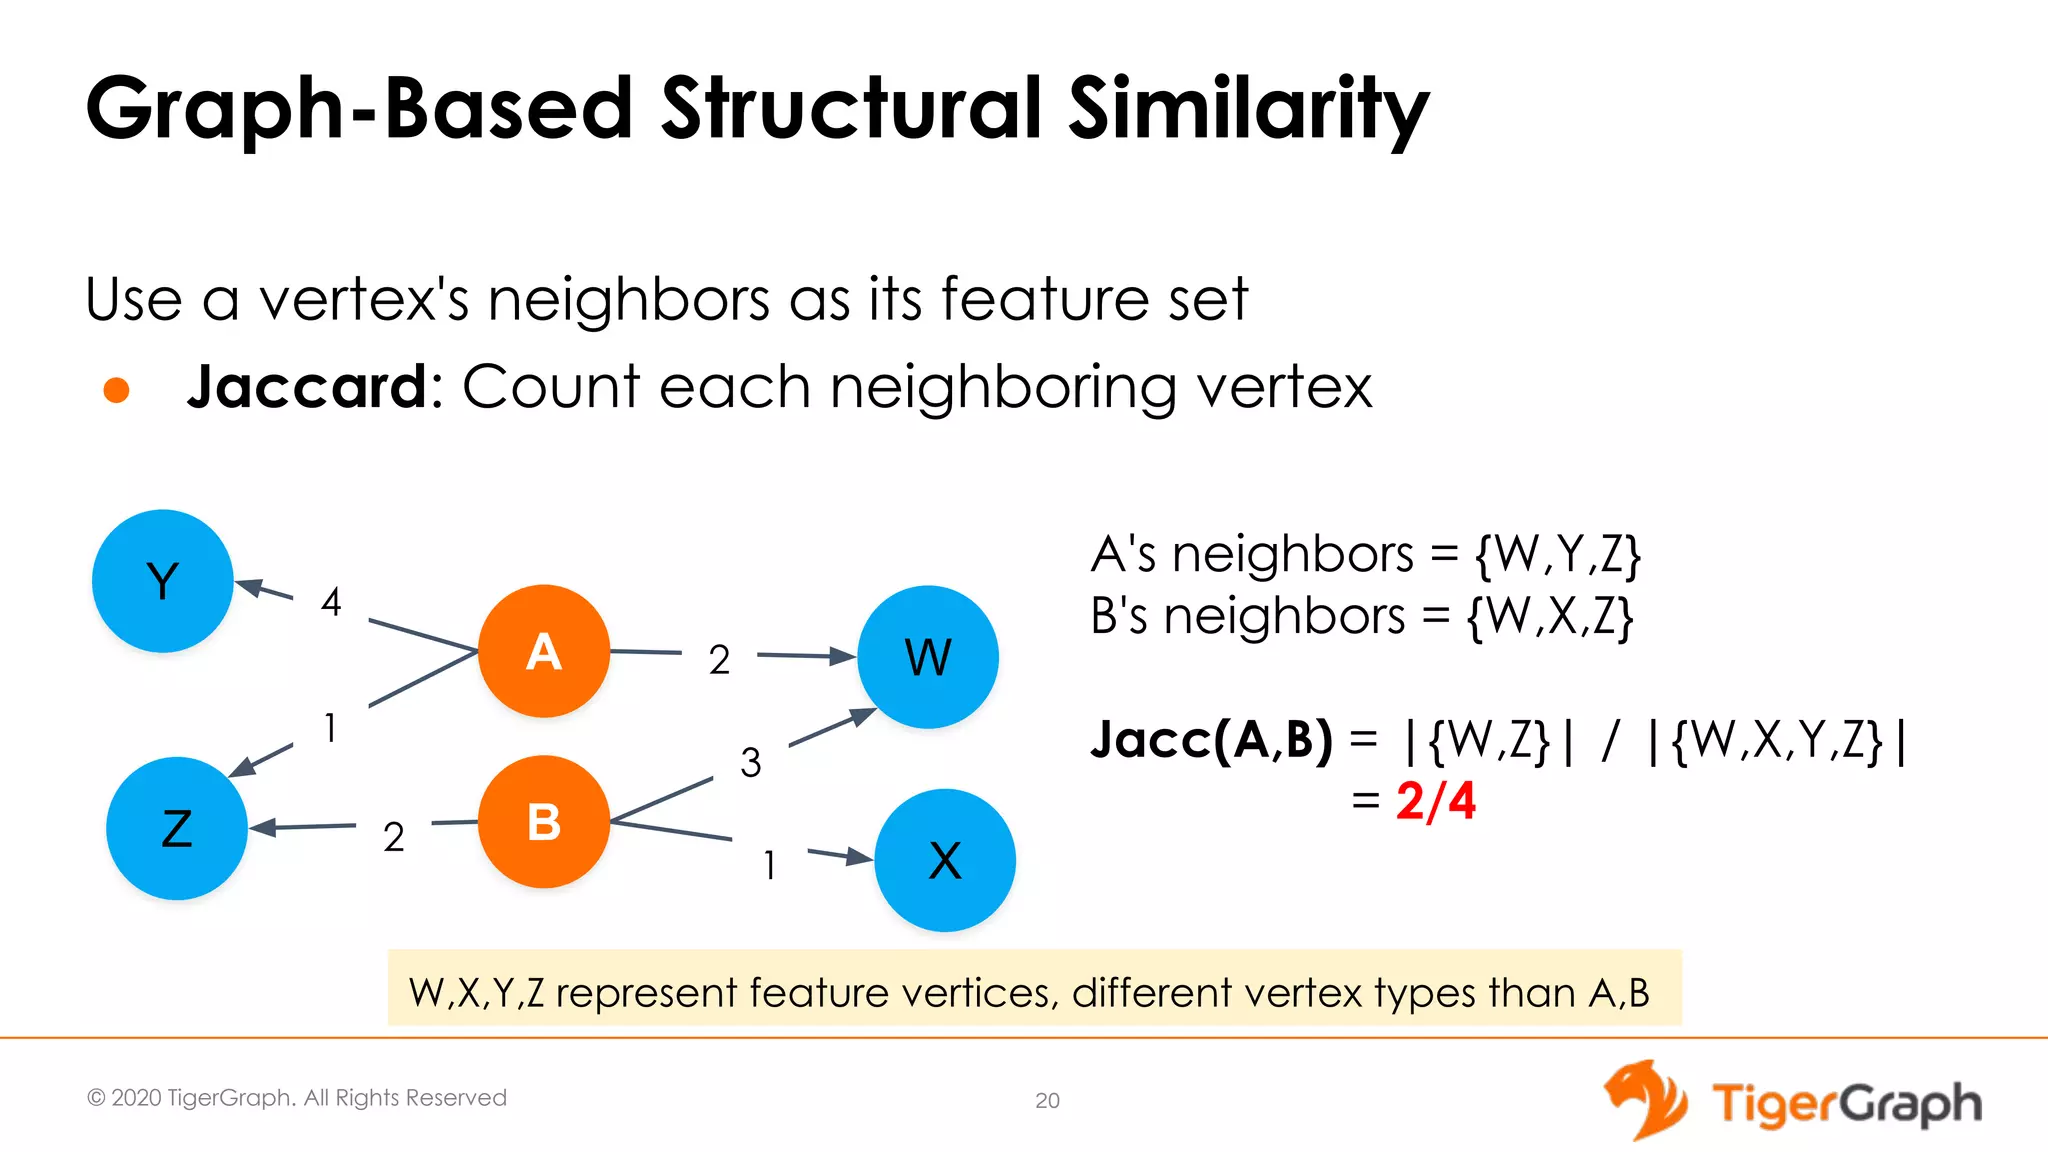
![© 2020 TigerGraph. All Rights Reserved Graph-Based Structural Similarity Use a vertex's neighbors as its feature set ● Cosine: Use edge weights to each neighboring vertex 21 A Order W B X Y Z 2 3 1 2 1 4 A's weighted neighbors = {2,0,4,1} B's weighted neighbors = {3,1,0,2} Cos(A,B) = 8 / [√21√14] = 0.4666 W,X,Y,Z represent feature vertices, different vertex types than A,B](https://image.slidesharecdn.com/graphgurus30graphalgorithms4-similarity1-200402221701/75/Using-Graph-Algorithms-For-Advanced-Analytics-Part-4-Similarity-30-graph-algorithms-4-similarity-1-21-2048.jpg)
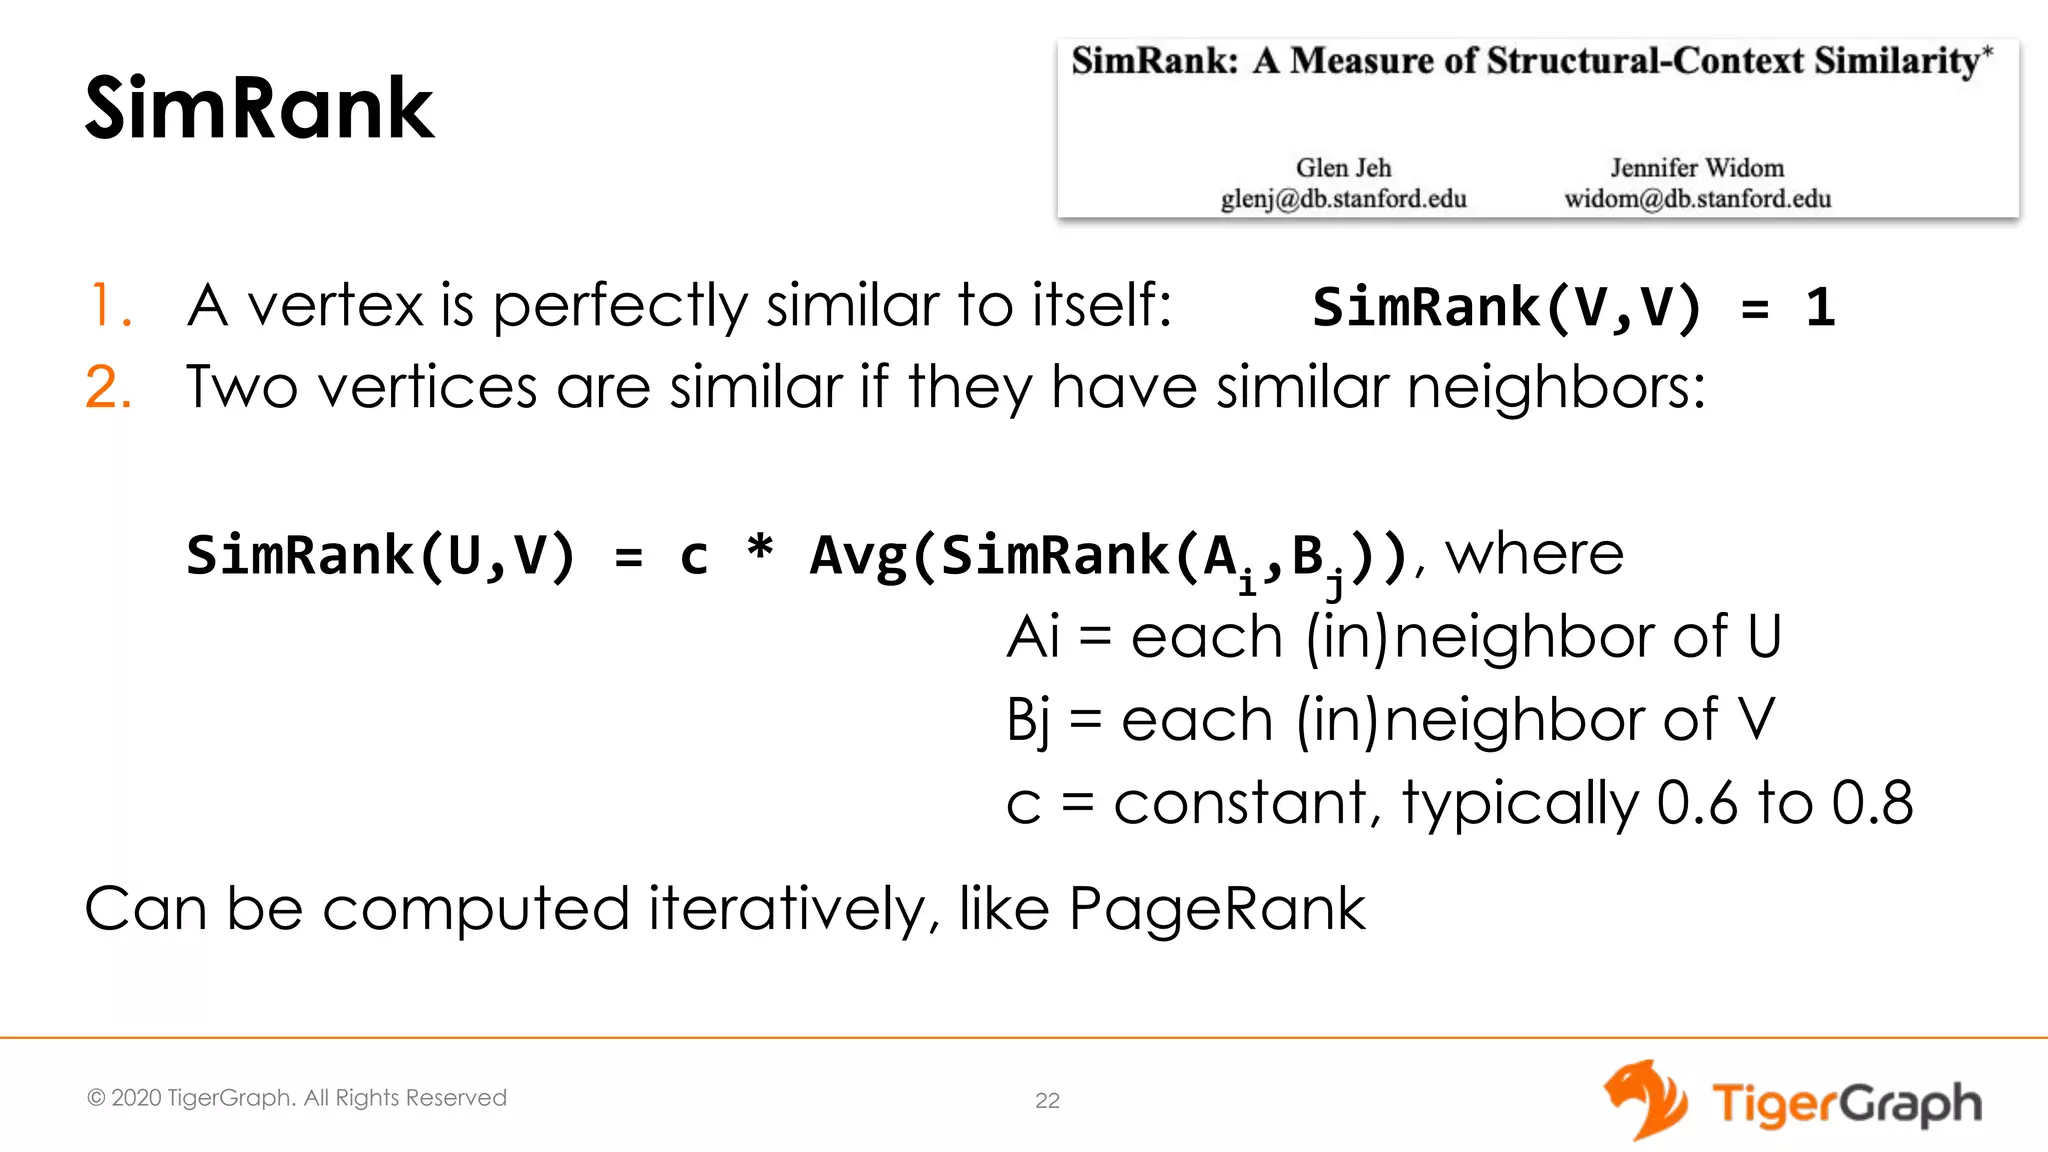
![© 2020 TigerGraph. All Rights Reserved SimRank Example 1st Round: sr(A,B) = c * Avg [ sr(W,W), sr(Y,W), sr(Z,W), sr(W,X), sr(Y,X), sr(Z,X), sr(W,Z), sr(Y,Z), sr(Z,Z)] = c*(1+0+0+0+0+0+0+0+1)/9 = 2c/9 23 A Order W B X Y Z 2 3 1 2 1 4 A and B each have 3 neighbors, so there are 9 possible pairs of neighbors. 2 of the neighbors are shared (W and Z) To complete round 1, compute scores for every other pair of vertices. For round 2, repeat, using the round 1 values for computing the average SimRank of neighbors.](https://image.slidesharecdn.com/graphgurus30graphalgorithms4-similarity1-200402221701/75/Using-Graph-Algorithms-For-Advanced-Analytics-Part-4-Similarity-30-graph-algorithms-4-similarity-1-23-2048.jpg)
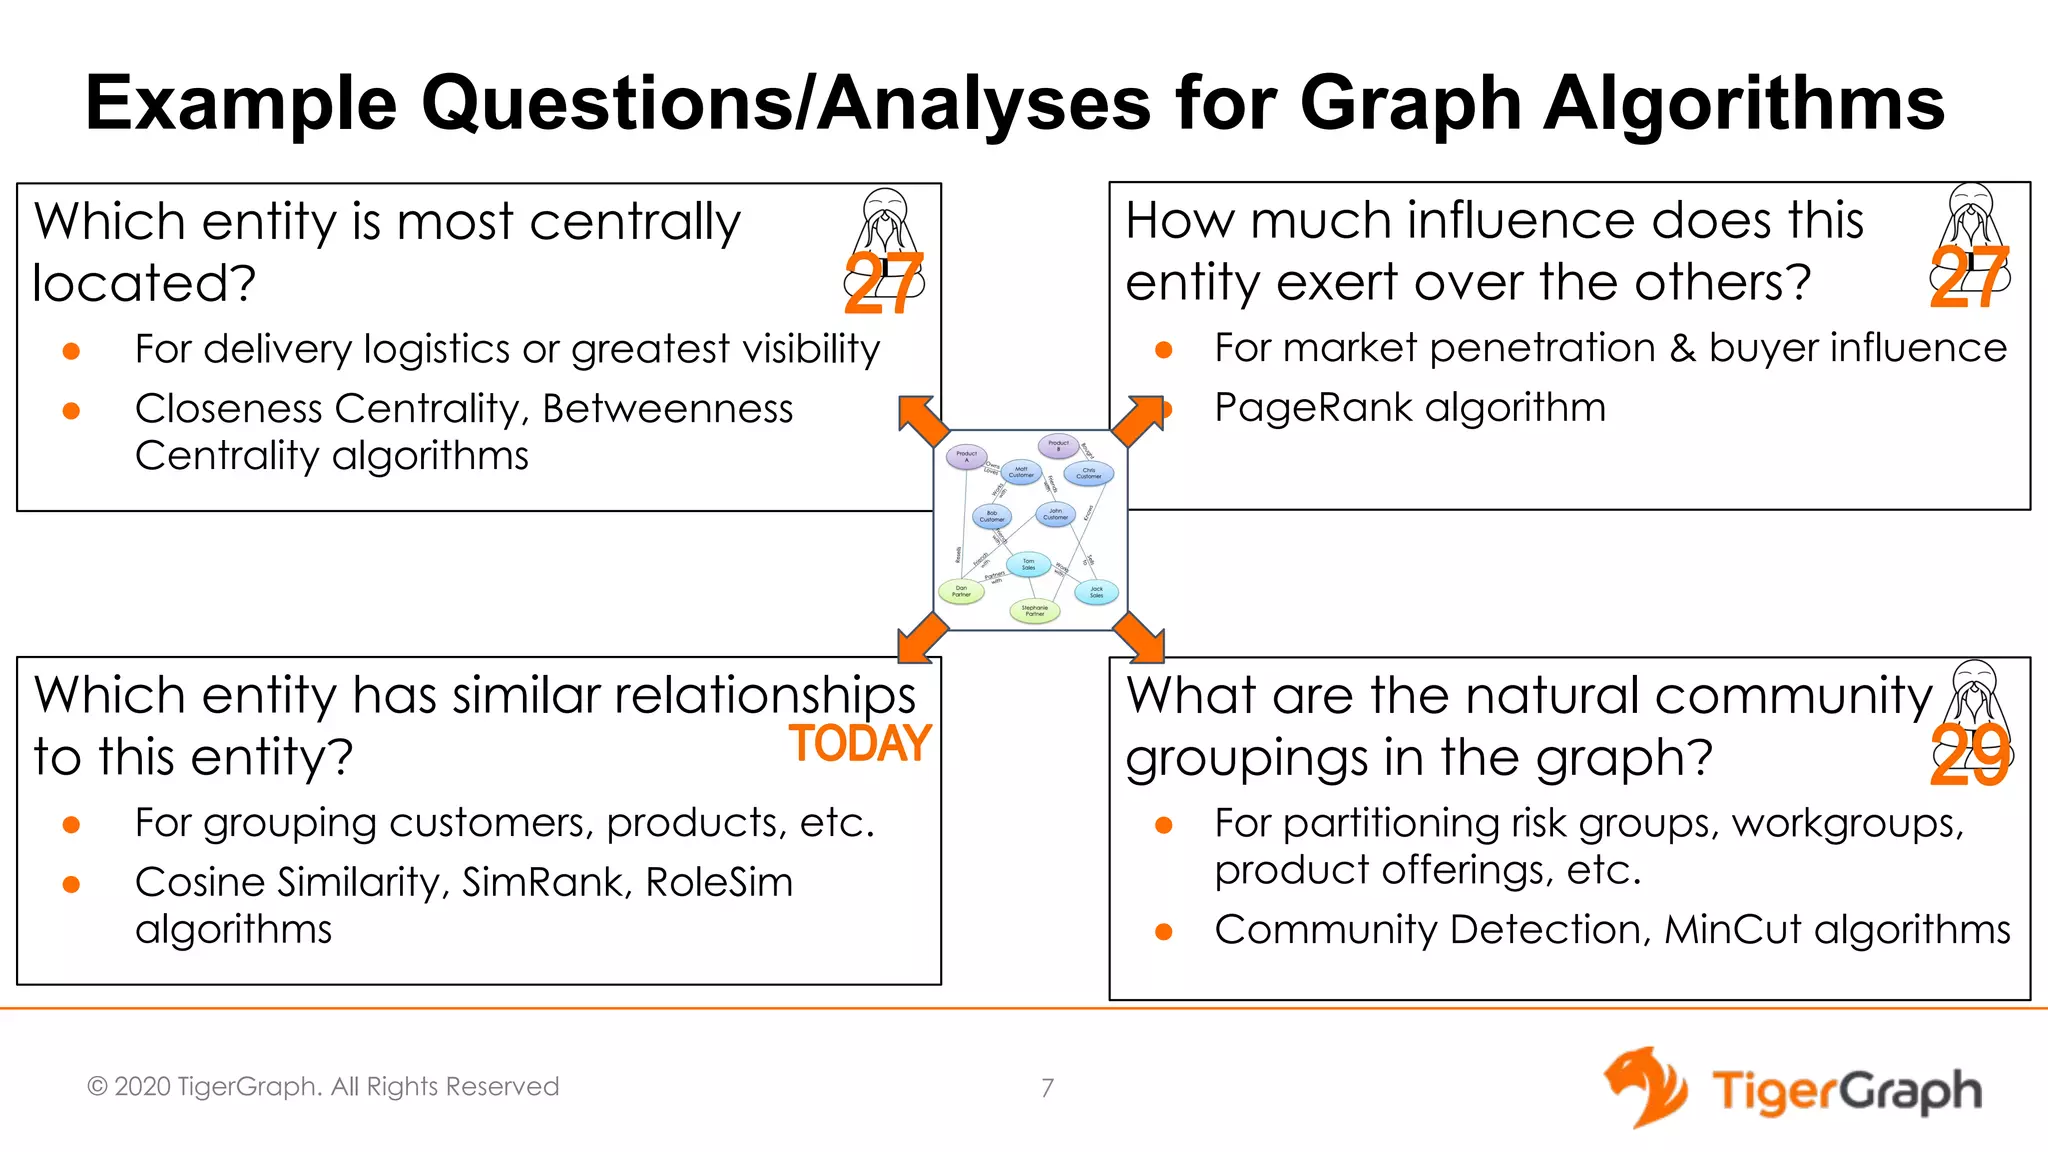
![© 2020 TigerGraph. All Rights Reserved RoleSim Example 1st Round: rs(A,B) = (1-b) * Max [ sr(W,W), sr(Y,W), sr(Z,W), sr(W,X), sr(Y,X), sr(Z,X), sr(W,Z), sr(Y,Z), sr(Z,Z)] / 3 + b = (1-b)*(1+1+0)/3 + b = 2(1-b)/3 + b 27 A Order W B X Y Z 2 3 1 2 1 4 A and B each have 3 neighbors, so we seek 3 pairs of neighbors. 2 of the neighbors are shared (W and Z) To complete round 1, compute scores for every other pair of vertices. For round 2, repeat, using the round 1 values for computing the max. RoleSim of neighbor-pairs.](https://image.slidesharecdn.com/graphgurus30graphalgorithms4-similarity1-200402221701/75/Using-Graph-Algorithms-For-Advanced-Analytics-Part-4-Similarity-30-graph-algorithms-4-similarity-1-27-2048.jpg)

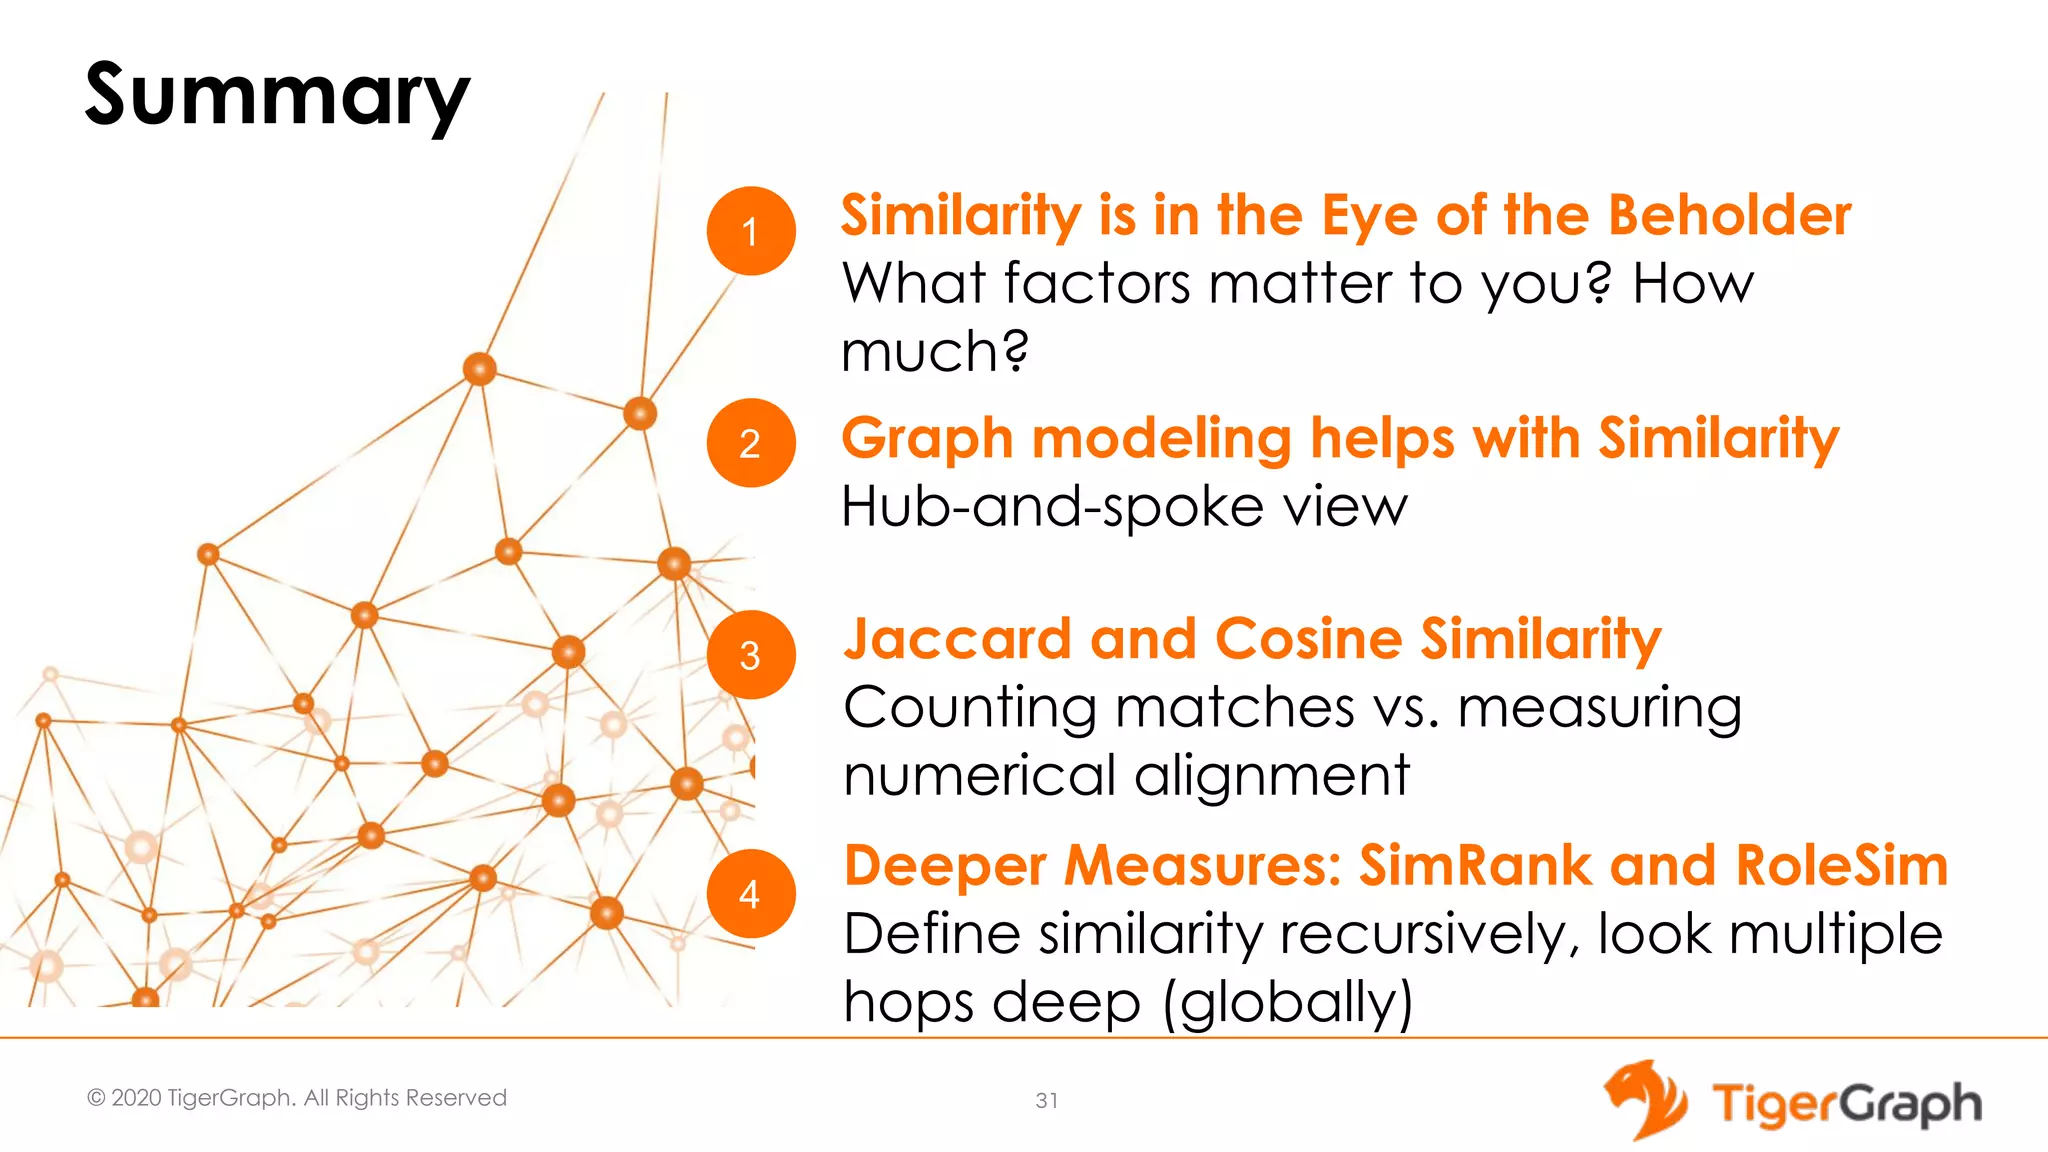


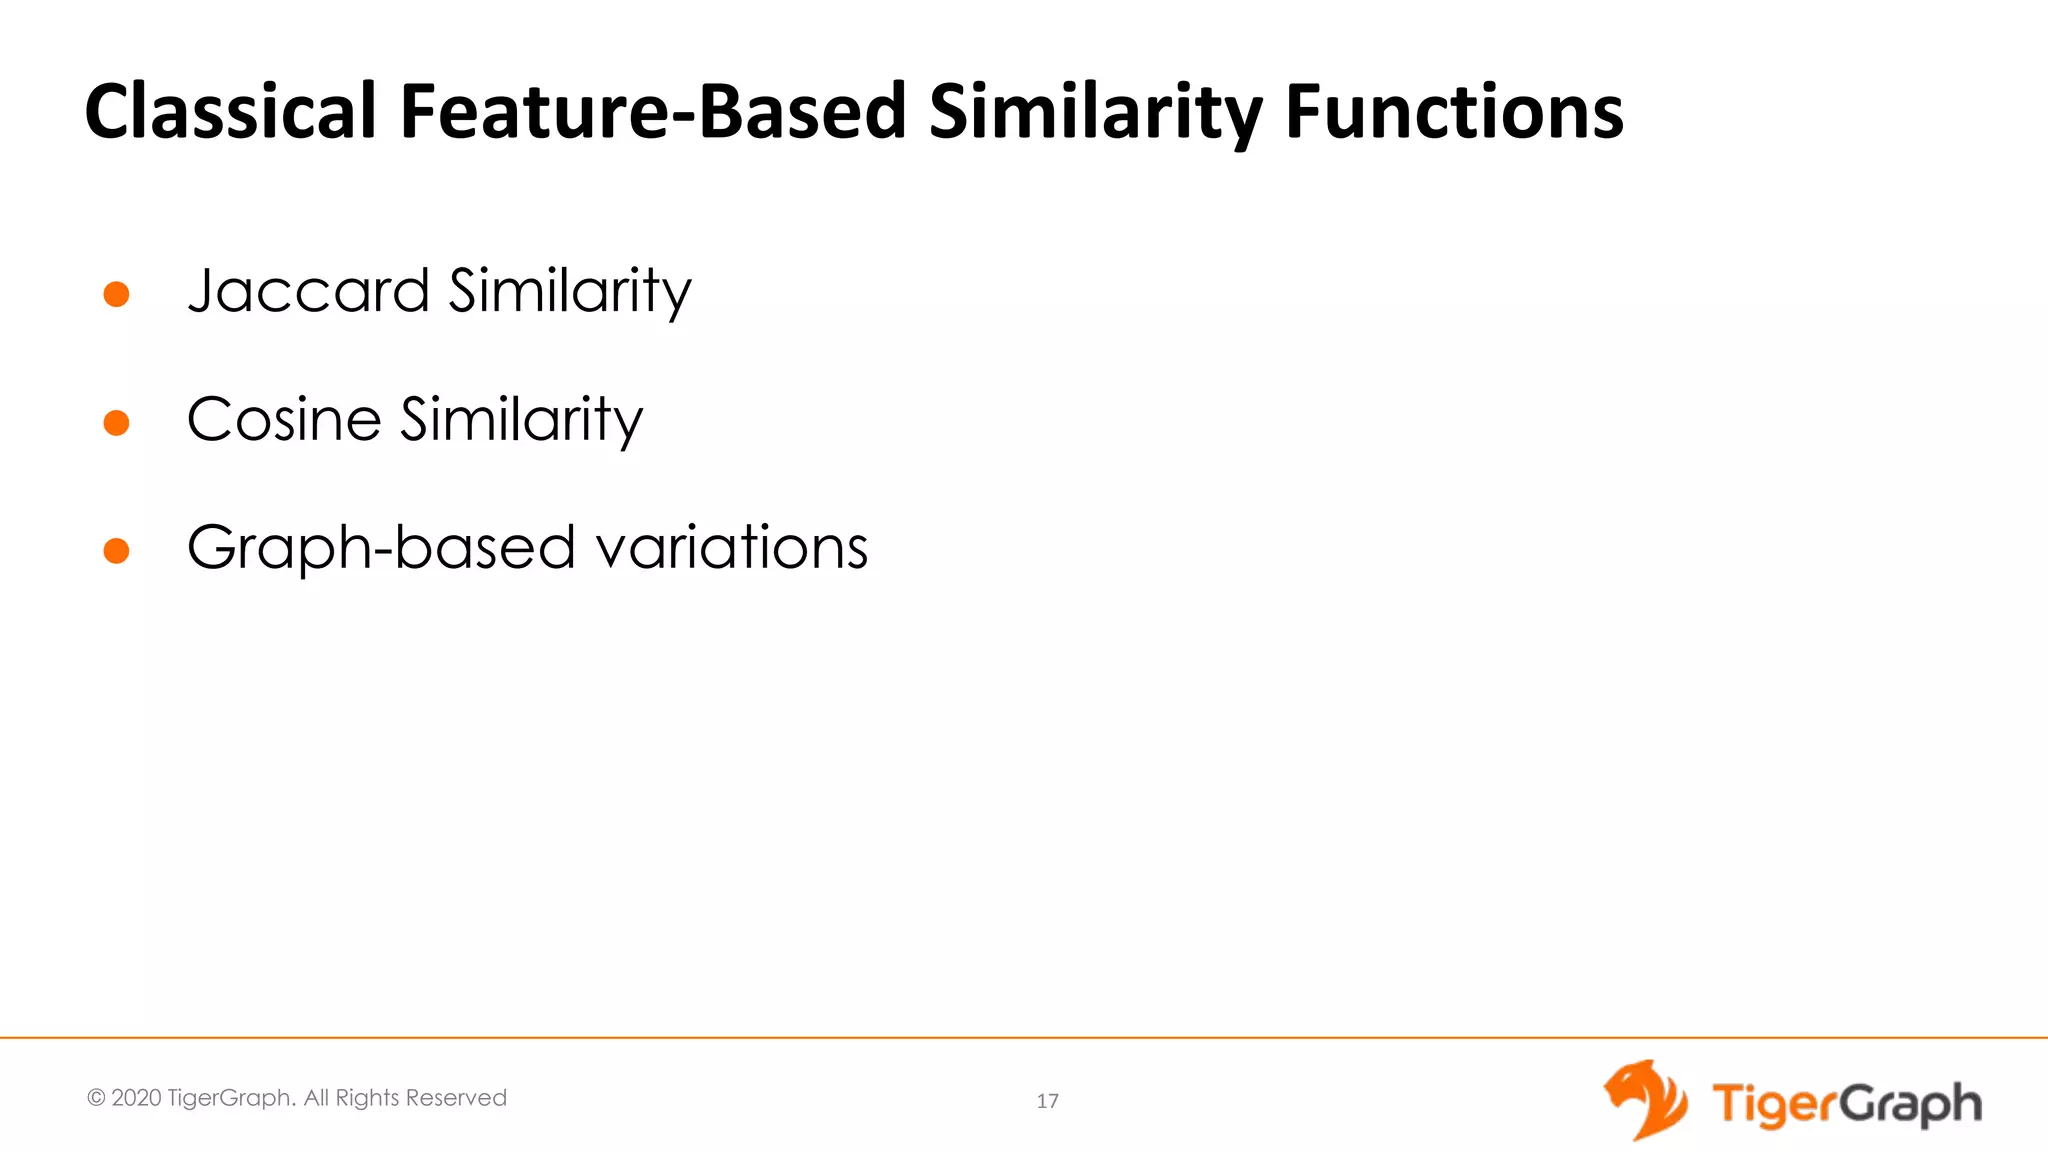
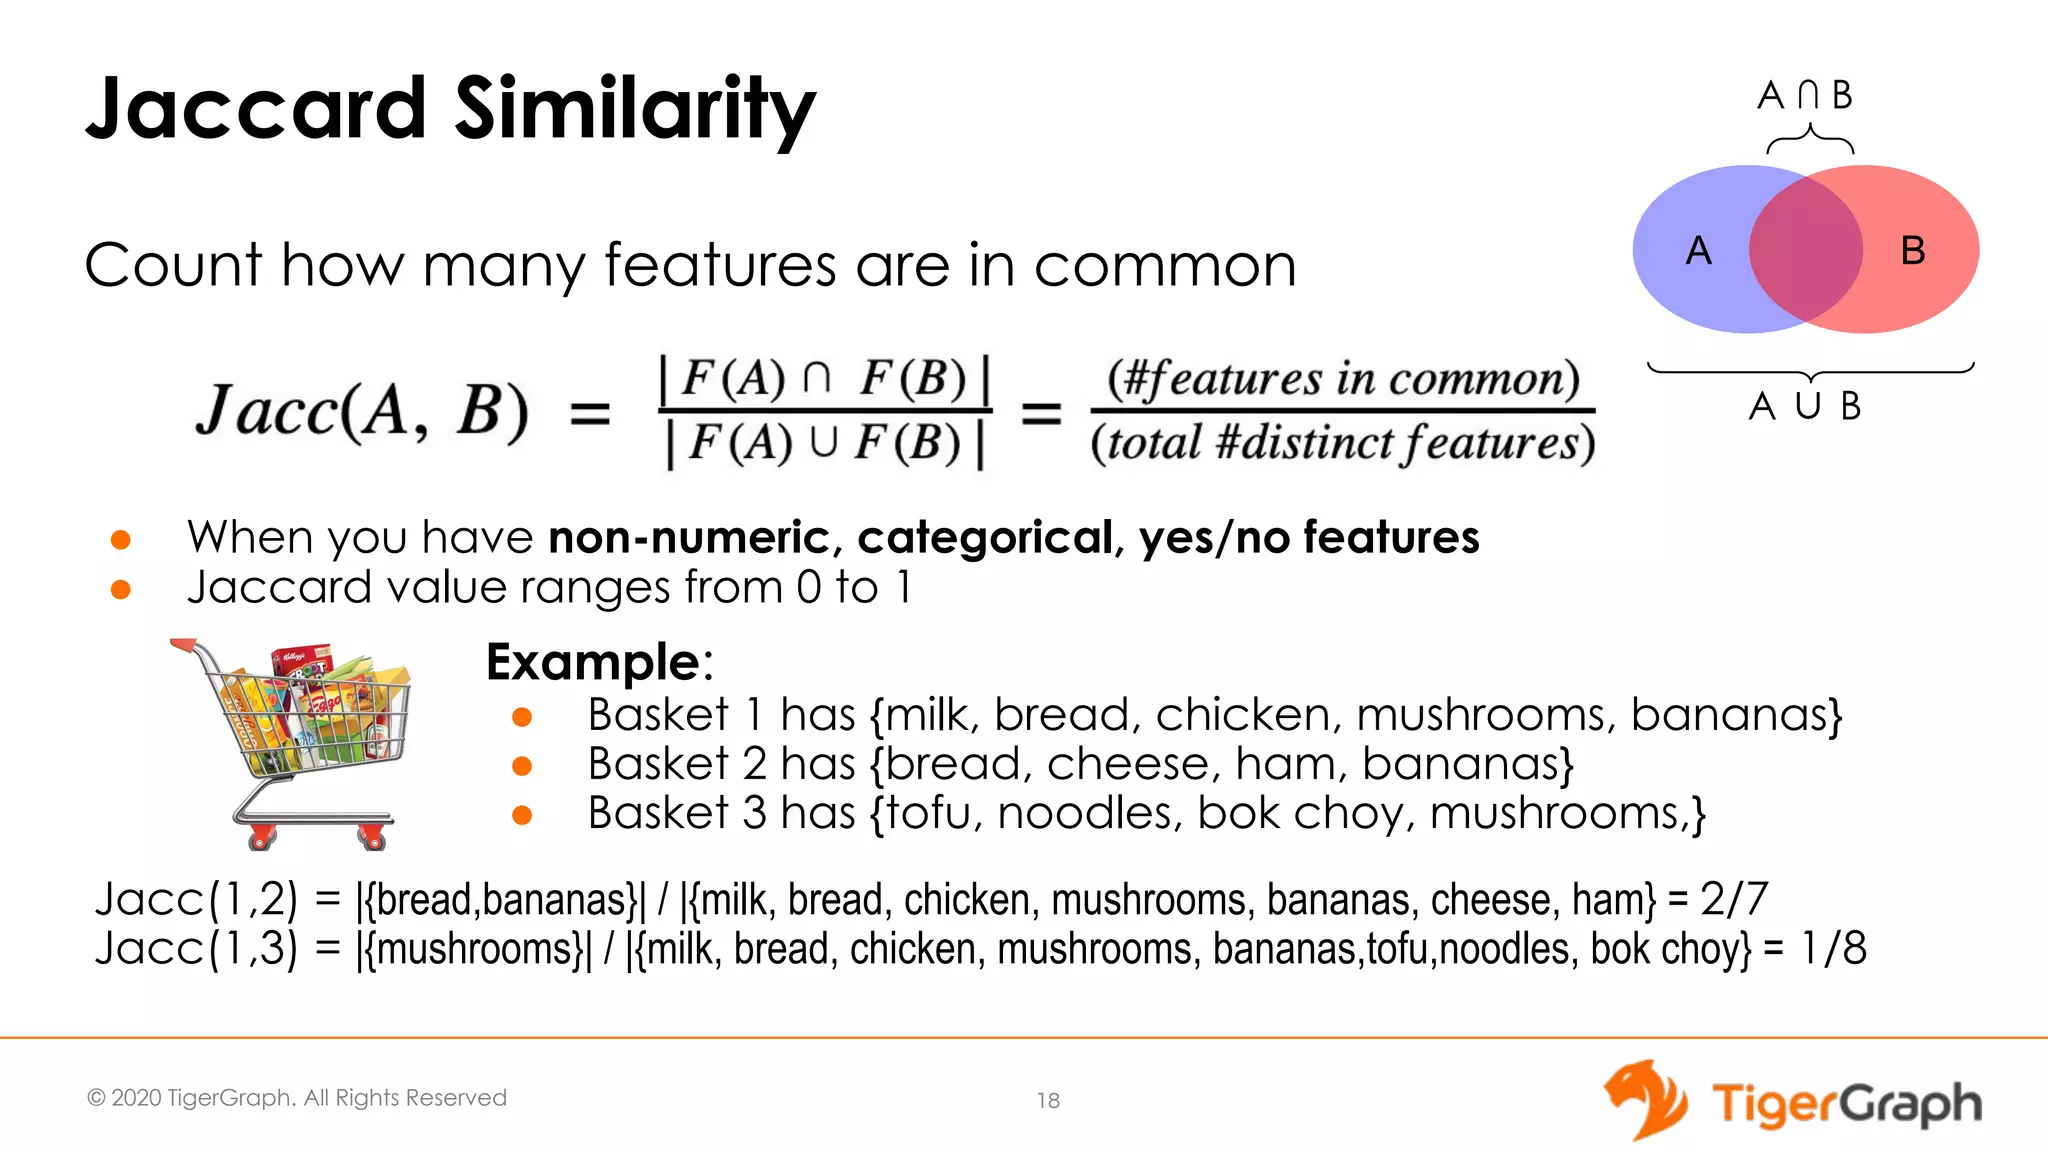
The document discusses the use of graph algorithms for advanced analytics, focusing on similarity algorithms and their role in identifying relationships within data. Victor Lee, the presenter, outlines various types of algorithms such as Jaccard, Cosine, SimRank, and RoleSim, which help analyze connected data and ascertain similarity between entities. It emphasizes that defining similarity is subjective and context-dependent, with implications for applications such as healthcare and fraud detection.