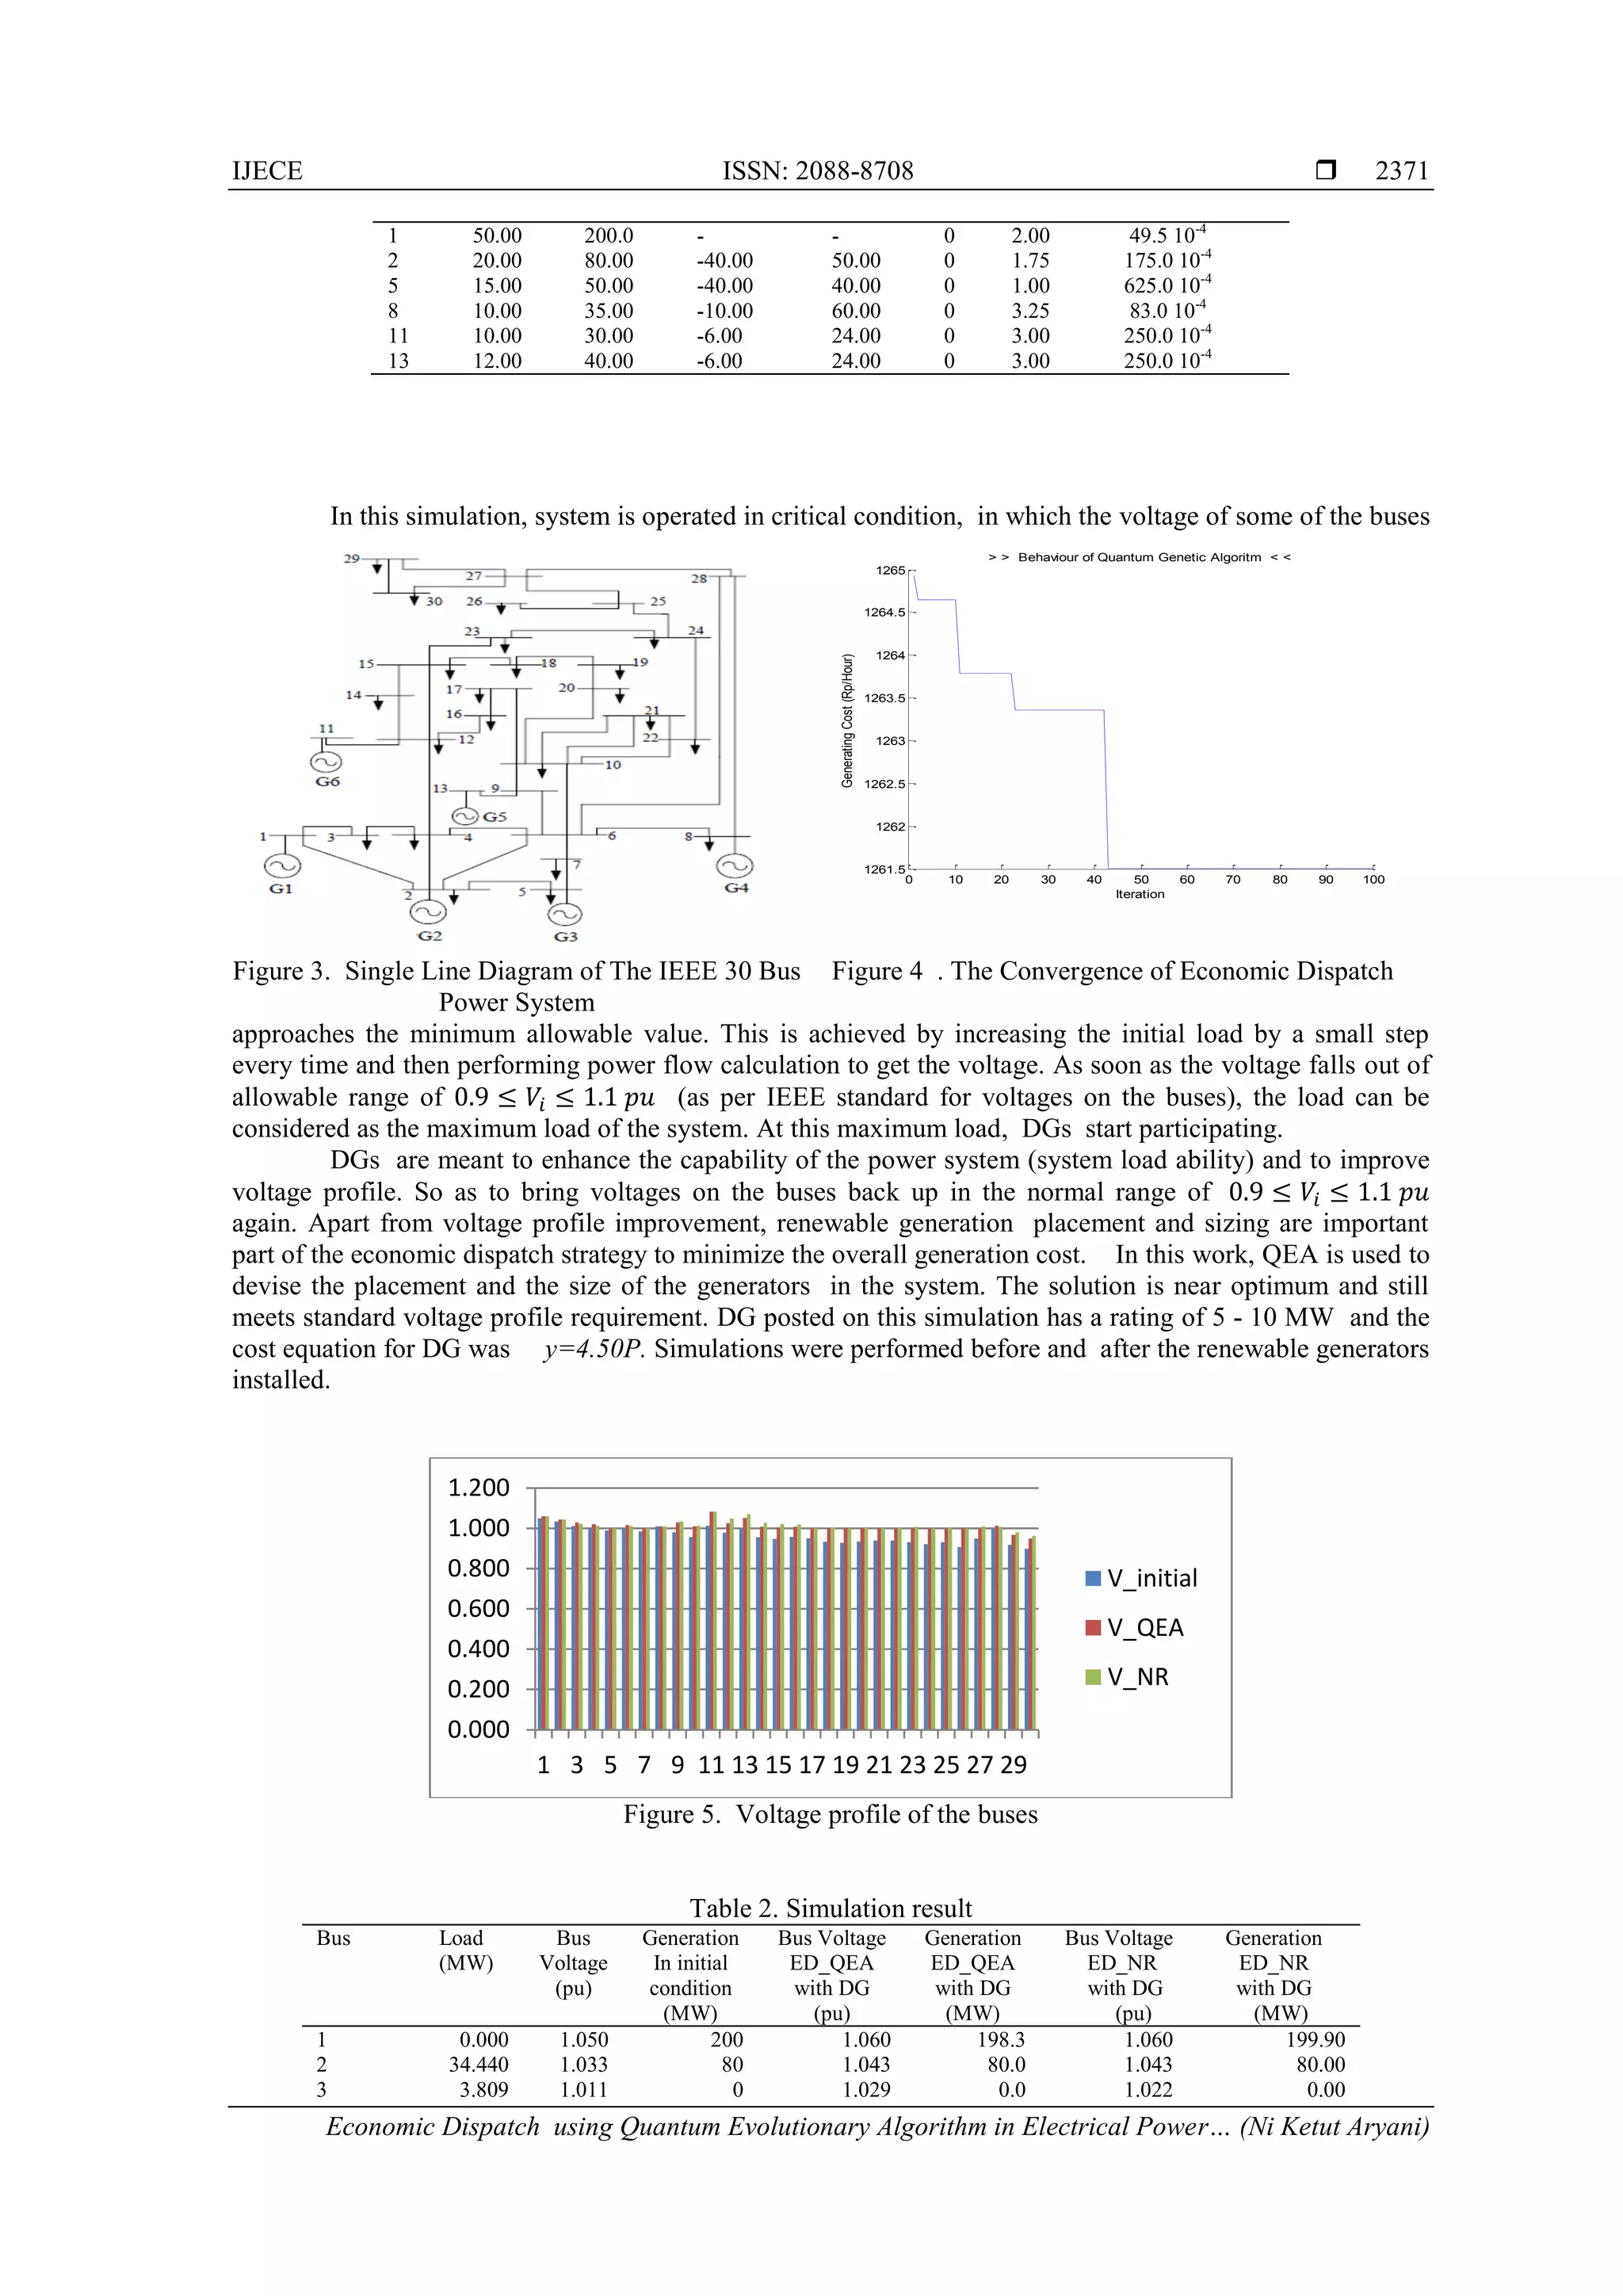
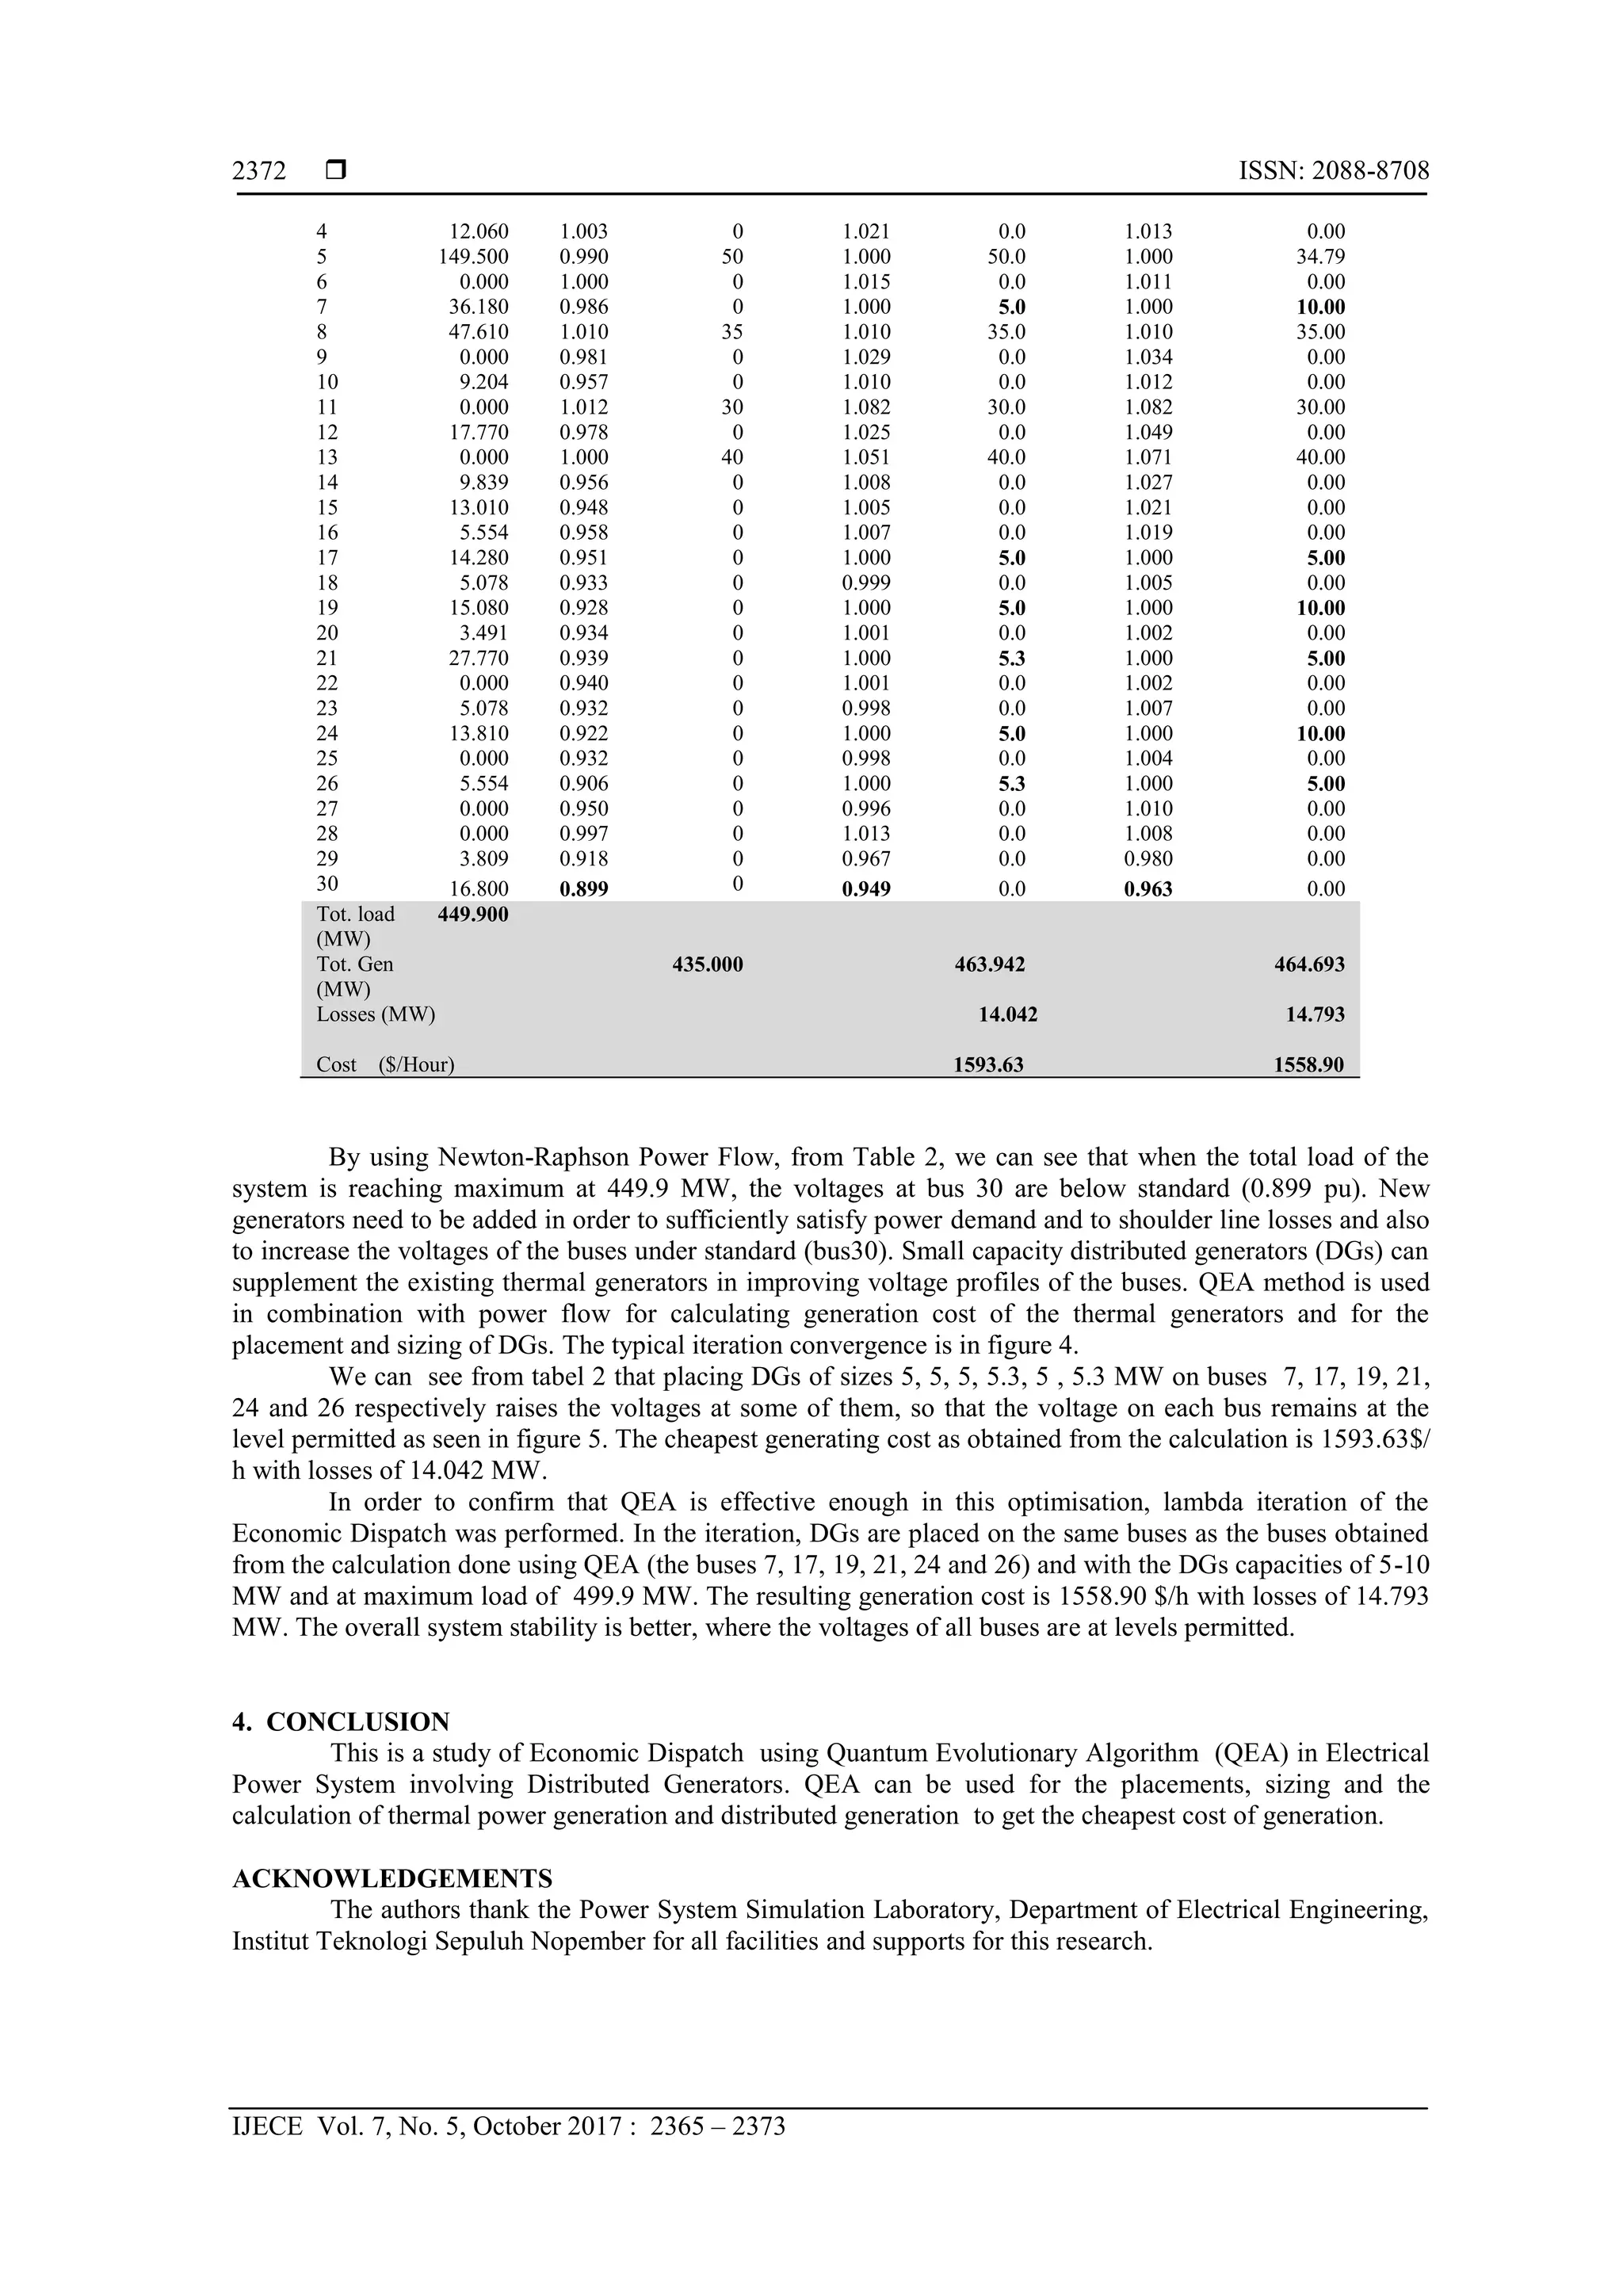
The document discusses the use of a Quantum Evolutionary Algorithm (QEA) for optimizing the placement and sizing of distributed generators (DGs) in an electrical power system to enhance efficiency and reduce operational costs. It emphasizes the importance of strategic DG placement to minimize power losses and ensure system stability, and details the mathematical formulations used to achieve economic dispatch. The algorithm leverages principles of quantum computing to improve the performance and diversity of search solutions compared to classical methods.
![International Journal of Electrical and Computer Engineering (IJECE) Vol. 7, No. 5, October 2017, pp. 2365~2373 ISSN: 2088-8708, DOI: 10.11591/ijece.v7i5.pp2365-2373 2365 Journal homepage: http://iaesjournal.com/online/index.php/IJECE Economic Dispatch using Quantum Evolutionary Algorithm in Electrical Power System involving Distributed Generators Ni Ketut Aryani1 , Adi Soeprijanto2 , I Made Yulistya Negara3 , Mat Syai’in4 Department of Electrical Engineering, Institut Teknologi Sepuluh Nopember (ITS), Surabaya, Indonesia Article Info ABSTRACT Article history: Received Oct 25, 2016 Revised Jun 5, 2017 Accepted Jun 19, 2017 Unpredictable increase in power demands will overload the supply subsystems and insufficiently powered systems will suffer from instabilities, in which voltages drop below acceptable levels. Additional power sources are needed to satisfy the demand. Small capacity distributed generators (DGs) serve for this purpose well. One advantage of DGs is that they can be installed close to loads, so as to minimise loses. Optimum placements and sizing of DGs are critical to increase system voltages and to reduce loses. This will finally increase the overall system efficiency. This work exploits Quantum Evolutionary Algorithm (QEA) for the placements and sizing. This optimisation targets the cheapest generation cost. Quantum Evolutionary Algorithm is an Evolutionary Algorithm running on quantum computing, which works based on qubits and states superposition of quantum mechanics. Evolutionary algorithm with qubit representation has a better characteristic of diversity than classical approaches, since it can represent superposition of states. Keywords: Distributed generation Economic dispatch Quantum genetic algorithm Copyright © 2017 Institute of Advanced Engineering and Science. All rights reserved. Corresponding Author: Ni Ketut Aryani, Power System Simulation Lab, Department of Electrical Engineering, Institut Teknologi Sepuluh Nopember (ITS), Surabaya, Indonesia. Email:ketut.aryani@gmail.com 1. INTRODUCTION Distributed generation has an important role in a modern and complex electrical power system. DGs are of small sizes, high efficiencies, low investment costs and the most importantly is their ability to run on renewable energy sources. DGs can also provide stand-alone remote applications with their required power. However, improper placement of Distributed Generation will result in increased system losses, resulting in higher costs. Placements and sizings of DG are critical to the overall system efficiency. The use of distributed generator in the system has some advantages in terms of economic, technical and environmental. Environmental advantages entail reductions of sound pollution and emission of gases. The economical advantages are reductions in transmission and distribution costs, electricity prices and savings on fuel. Technical advantages cover wide varieties of benefits, for examples, line loss reduction, increased system voltage profiles and increased power stability and reliability. It can also provide stand-alone remote applications with their power need. Planning of an electrical power systems involving DGs requires the definition of several factors, such as: the best technology and method to use, the number and the capacity of the units, the best location, the network connection way, and alike. Researchers have used evolutionary computational methods for economic dispatch. Joko Pitono used the sigmoid decreasing inertia weight PSO for calculating Hybrid Optimization of Emission and Economic Dispatch [1], Hybrid Optimization of Emission and Economic Dispatch by the Sigmoid Decreasing Inertia Weight Particle Swarm Optimization, this paper proposed technique of optimization which combined fuel cost economic optimization and emission dispatch using the Sigmoid Decreasing](https://image.slidesharecdn.com/v095jun1725oct1613141-28227-1-ededit-201021064332/75/Economic-Dispatch-using-Quantum-Evolutionary-Algorithm-in-Electrical-Power-System-involving-Distributed-Generators-1-2048.jpg)
![ ISSN: 2088-8708 IJECE Vol. 7, No. 5, October 2017 : 2365 – 2373 2366 Inertia Weight Particle Swarm Optimization algorithm (PSO) to reduce the cost of fuel and pollutants resulted. Leandro dos Santos Coelho a,*, Chu-Sheng Lee b, using chaotic and Gaussian particle swarm optimization Solving economic load dispatch problem [2]. Hossein Shahinzadeh used Particle Swarm Optimization algorithm to solve the economic load dispatch of units in power systems with valve-point effects consideration [3]. PSO is used for the solution of Dynamic Economic Load Dispatch (DELD) problem with valve point loading effects and ramp rate limits in the paper writen by G.Sreenivasan [4]. Important issues in electric power industries are effectively economically optimum operations of electric power generation systems. The main utility target is to achieve the minimum operating cost and system stability. As well as to find the minimum operating cost using economic dispatch method. There are several kinds of methods to calculate the operating costs. Lagrange is the most commonly used to calculate the minimum cost of electrical energy generation [5]. In addition to this method there are several others that have been developed by researchers. Quantum theory has been used widely in the field of electrical energy systems. In several publications, quantum EAs are utilized to calculate economic dispatch. For example in the references [6], [7] and [8]. Quantum-Inspired Evolutionary Algorithm for Real and Reactive Power Dispatch, in this paper, QEA determines the settings of control variables, such as generator outputs, generator voltages, transformer taps and shunt VAR compensation devices for optimal P-Q dispatch considering the bid-offered cost [6]. Chaotic Quantum Evolutionary Algorithm is used to solve Environmental Economic Dispatch of Smart Microgrid Containing Distributed Generation System Problems. Quantum evolutionary algorithm is used to confirm the accuracy and validity of the mathematical model used for determining environment and economic dispatch of Smart Micro Grid, which is considered as generation cost and emission cost [9]. In this work, quantum evolutionary algorithm is used for the placement of DGs in the network and for determining the capacity required to raise the voltage on the buses, so that the voltage at each bus is in safe condition and increases the system load ability. Finally, we perform the calculation for the economic dispatch to get the cheapest cost of generation. Quantum evolutionary algorithm is also used in similar way in reference [10],[11]. 2. RESEARCH METHOD 2.1. Economic Dispatch Theory The mathematical formulation of the total cost function is formulated as follows: min 𝐶 = ∑ 𝐶𝑖(𝑃𝑖)𝑛 𝑖=1 + ∑ 𝐶𝑔(𝑃𝑔)ℎ 𝑔=1 (1) where 𝐶𝑖 is the total fuel cost for the i th generator (in $/h). Generally, the fuel cost of thermal generating unit is represented in polynomial function, 𝐶𝑖(𝑃𝑖) = 𝑎𝑖 + 𝑏𝑖 𝑃𝑖 + 𝑐𝑖 𝑃𝑖 2 (2) where 𝑎𝑖, 𝑏𝑖 and 𝑐𝑖 are cost coefficients of generator 𝑖. The DG generation cost. 𝐶𝑔(𝑃𝑔) = 𝑑 𝑔 𝐺𝑔 (3) where 𝑑 𝑔 is cost coefficients of DG Conventionally, there is no or negligible DG capacity existing in the power system. In economic dispatch, the system demand and delivery loss are served by utility generators only. With the outspread of DG's in distribution networks, the non DG system evolves into a hybrid generation environment. The DG generation capacity has to be taken into account in the new environment. To achieve this, a modification of the conventional economic dispatch. In addition, N generators are connected to the system . The power balance constraint becomes: ∑ 𝑃𝑖𝑁 + ∑ 𝑃𝑔ℎ = 𝑃𝐷 + 𝑃𝑙𝑜𝑠𝑠 (4) where ∑ 𝑃𝑖𝑖 is the total power generated by utility generators and ∑ 𝑃𝑔𝑔 is the total power from DG installed in buses, while 𝑃𝐷 is total load and 𝑃𝑙𝑜𝑠𝑠 is total losses of the system. Consequently, the generation cost consists of two parts: the power generated from existing and power from DG in load bus.](https://image.slidesharecdn.com/v095jun1725oct1613141-28227-1-ededit-201021064332/75/Economic-Dispatch-using-Quantum-Evolutionary-Algorithm-in-Electrical-Power-System-involving-Distributed-Generators-2-2048.jpg)
![IJECE ISSN: 2088-8708 Economic Dispatch using Quantum Evolutionary Algorithm in Electrical Power… (Ni Ketut Aryani) 2367 𝐶 𝑇𝑜𝑡 = ∑ 𝐶𝑖 + ∑ 𝐶𝑔ℎ𝑁 (5) 𝐶 𝑇 is obtained by economically dispatching load and delivery loss among these online generators and DGs. Some constraints for each generator must be also satisfied. Generation power of each generator should be laid between maximum and minimum limits. The constraint for each generator is 𝑃𝑖 𝑚𝑖𝑛 ≤ 𝑃𝑖 ≤ 𝑃𝑖 𝑚𝑎𝑥 (6) where 𝑃𝑖 𝑚𝑖𝑛 and 𝑃𝑖 𝑚𝑎𝑥 are the output of the minimum and maximum operation of the generating unit i (in MW), respectively. Voltage at load buses 𝑉𝑖 𝑚𝑖𝑛 < 𝑉𝑖 < 𝑉𝑖 𝑚𝑎𝑥 (7) where 𝑉𝑖 𝑚𝑖𝑛 and 𝑉𝑖 𝑚𝑎𝑥 are voltage minimum and maximum each buses. Line Power Flow Newthon Rapson (NR) is a very common method used to calculate the power flow on the system. The NR power flow is used to calculate the losses in the system and the voltage on each bus. The theory of power flow used in this paper refers to the reference [5]. Injected Power The complex power at bus 'i ' is: 𝑆𝑖 ∗ = 𝑉𝑖 ∗ ∑ 𝑌𝑖𝑘 𝑉𝑘 𝑛 𝑘=1 (8) The variables updated after k th iteration are given as: ∆𝛿𝑖 (𝑘+1) = ∆𝛿𝑖 (𝑘) + ∆𝛿𝑖 (9) |𝑉𝑖|(𝑘+1) = |𝑉𝑖|(𝑘) + ∆|𝑉𝑖| (10) Power flow from ith bus to j th bus through the line connected between these buses is given by: 𝑆𝑖𝑗 = 𝑉𝑖 𝐼𝑖𝑗 ∗ = 𝑉𝑖 ( 𝑉 𝑖−𝑉 𝑗 𝑍 𝑖𝑗 + 𝑉𝑖 𝑌𝑖𝑗0) (11) The power flow from the j th bus to ith bus is: 𝑆𝑗𝑖 = 𝑉𝑗 𝐼𝑗𝑖 ∗ = 𝑉𝑗 ( 𝑉 𝑗−𝑉 𝑗𝑖 𝑍 𝑗𝑖 + 𝑉𝑗 𝑌𝑗𝑖0) (12) Line Losses 𝑷𝒍 = ∑ ∑ (𝑺𝒊𝒋 + 𝑺𝒋𝒊)𝒃𝒖𝒔 𝒏𝒐 𝒋=𝟏 𝒃𝒖𝒔 𝒏𝒐 𝒊=𝟏 (13) = ∑ ∑ {(𝑷𝒊𝒋 + 𝒋𝑸𝒊𝒋) + (𝑷𝒋𝒊 + 𝒋𝑸𝒋𝒊)}𝒃𝒖𝒔 𝒏𝒐 𝒋=𝟏 𝒃𝒖𝒔 𝒏𝒐 𝒊=𝟏 (14) 2.2. Quantum Evolutionary Algorithm (QEA) The base theories of Quantum Evolutionary Algorithm method are the concepts of qubits and the superposition of states of quantum mechanics. Qubit is the smallest unit of information stored in a two-state quantum computer. A qubit may be in the state ‘1’ or in the state ‘0’ or in any superposition of the two. The state of a qubit can be represented as, |𝜓〉 = |𝛼|2 + |𝛽|2 (15)](https://image.slidesharecdn.com/v095jun1725oct1613141-28227-1-ededit-201021064332/75/Economic-Dispatch-using-Quantum-Evolutionary-Algorithm-in-Electrical-Power-System-involving-Distributed-Generators-3-2048.jpg)
![ ISSN: 2088-8708 IJECE Vol. 7, No. 5, October 2017 : 2365 – 2373 2368 As also ilustrated in figure 1, α and β are complex numbers specifying the probability amplitudes of the state ‘0’ and ‘1’ respectively. |𝛼|2 gives the probability that the qubit will be found in ‘0’ state and |𝛽|2 gives the probability that the qubit will be found in the ‘1’ state. Normalization of the state to unity guarantees, |𝛼|2 + |𝛽|2 = 1 (16) 2 𝑚 states can be represented at the same time by a system of m qubits. QGA is based on the concept of qubits. One qubit is defined with a pair of complex numbers (α,β) as, [ 𝛼 𝛽] (17) which is characterized by (8) and (9). And an m-qubits representation is defined as [ 𝛼1 𝛽1 | 𝛼2 𝛽2 | … … | 𝛼 𝑚 𝛽 𝑚 ] (18) where |𝛼𝑖|2 + |𝛽𝑖|2 = 1, i = 1,2,3...m The advantage of this representation is that it can represent any superposition of states. For instance, in a three qubits system with three pairs of amplitudes such as, [ 1 √2 1 √2 | √3 2 1 2 | 1.0 0 ] (19) The state of the system can be represented as, √3 2√2 |000〉 + 0 |001〉 + 1 2√2 |010〉 + 0|011〉 + √3 2√2 |100〉 + 0 |101〉 + 1 2√2 |110〉 + 0|111〉 The above result means that the probabilities to represent the state |000〉, |010〉, |100〉 and |110〉 are 3 8 , 1 8 , 3 8 and 1 8 respectively. The three qubits system of (11) has four states information at the same time. Evolutionary algorithm with qubit representation has a better characteristic of diversity than classical approaches, since it can represent superposition of states. One qubit string such as (11) is enough to represent four states. Convergence can be also obtained with the qubit representation. As |𝛼|2 or |𝛽|2 approaches to 1 or 0, the qubit string converges to a single state and the property of diversity disappears gradually. That is, simultaneously, the qubit representation has both the characteristic of exploration and the characteristic of exploitation. Rotation Gate [10] Q-gate (rotation gate) is defined as a variation operator of QEA, by which operation any updated qubit should at all time satisfy the normalization condition, |𝛼′|2 + |𝛽′|2 = 1 , where 𝛼′ and 𝛽′ are the values of the updated qubit. The following rotation gate is used as a qubit: [ 𝛼𝑗(𝑡 + 1) 𝛽𝑗(𝑡 + 1) ] = 𝑅𝑖(𝑡) × [ 𝛼𝑗(𝑡) 𝛽𝑗(𝑡) ] (𝑗 = 1,2, … , 𝑛) (20) 𝑅𝑖(𝑡) = [ cos ∆𝜃𝑖 − sin ∆𝜃𝑖 sin ∆𝜃𝑖 cos ∆𝜃𝑖 ] (𝑖 = 1, 2, … , 𝑛) (21) ∆𝜃𝑖is a rotation angle (Fig.1) of each member of the population. The rotation angle ∆𝜃𝑖is related to the normalized difference ∆𝑓𝑖 between achievement of each of member of population and the global best optimum. ∆𝜃𝑖 = ∆𝑓𝑖 × 𝑠𝑖𝑔𝑛 (𝛼 𝑏 − 𝛼𝑗) × 𝑠𝑖𝑔𝑛[𝛽𝑗 × sin ∆𝑓𝑖 − 𝛼𝑗 × (1 − cos〖∆𝑓𝑖)〗] (22) where :](https://image.slidesharecdn.com/v095jun1725oct1613141-28227-1-ededit-201021064332/75/Economic-Dispatch-using-Quantum-Evolutionary-Algorithm-in-Electrical-Power-System-involving-Distributed-Generators-4-2048.jpg)
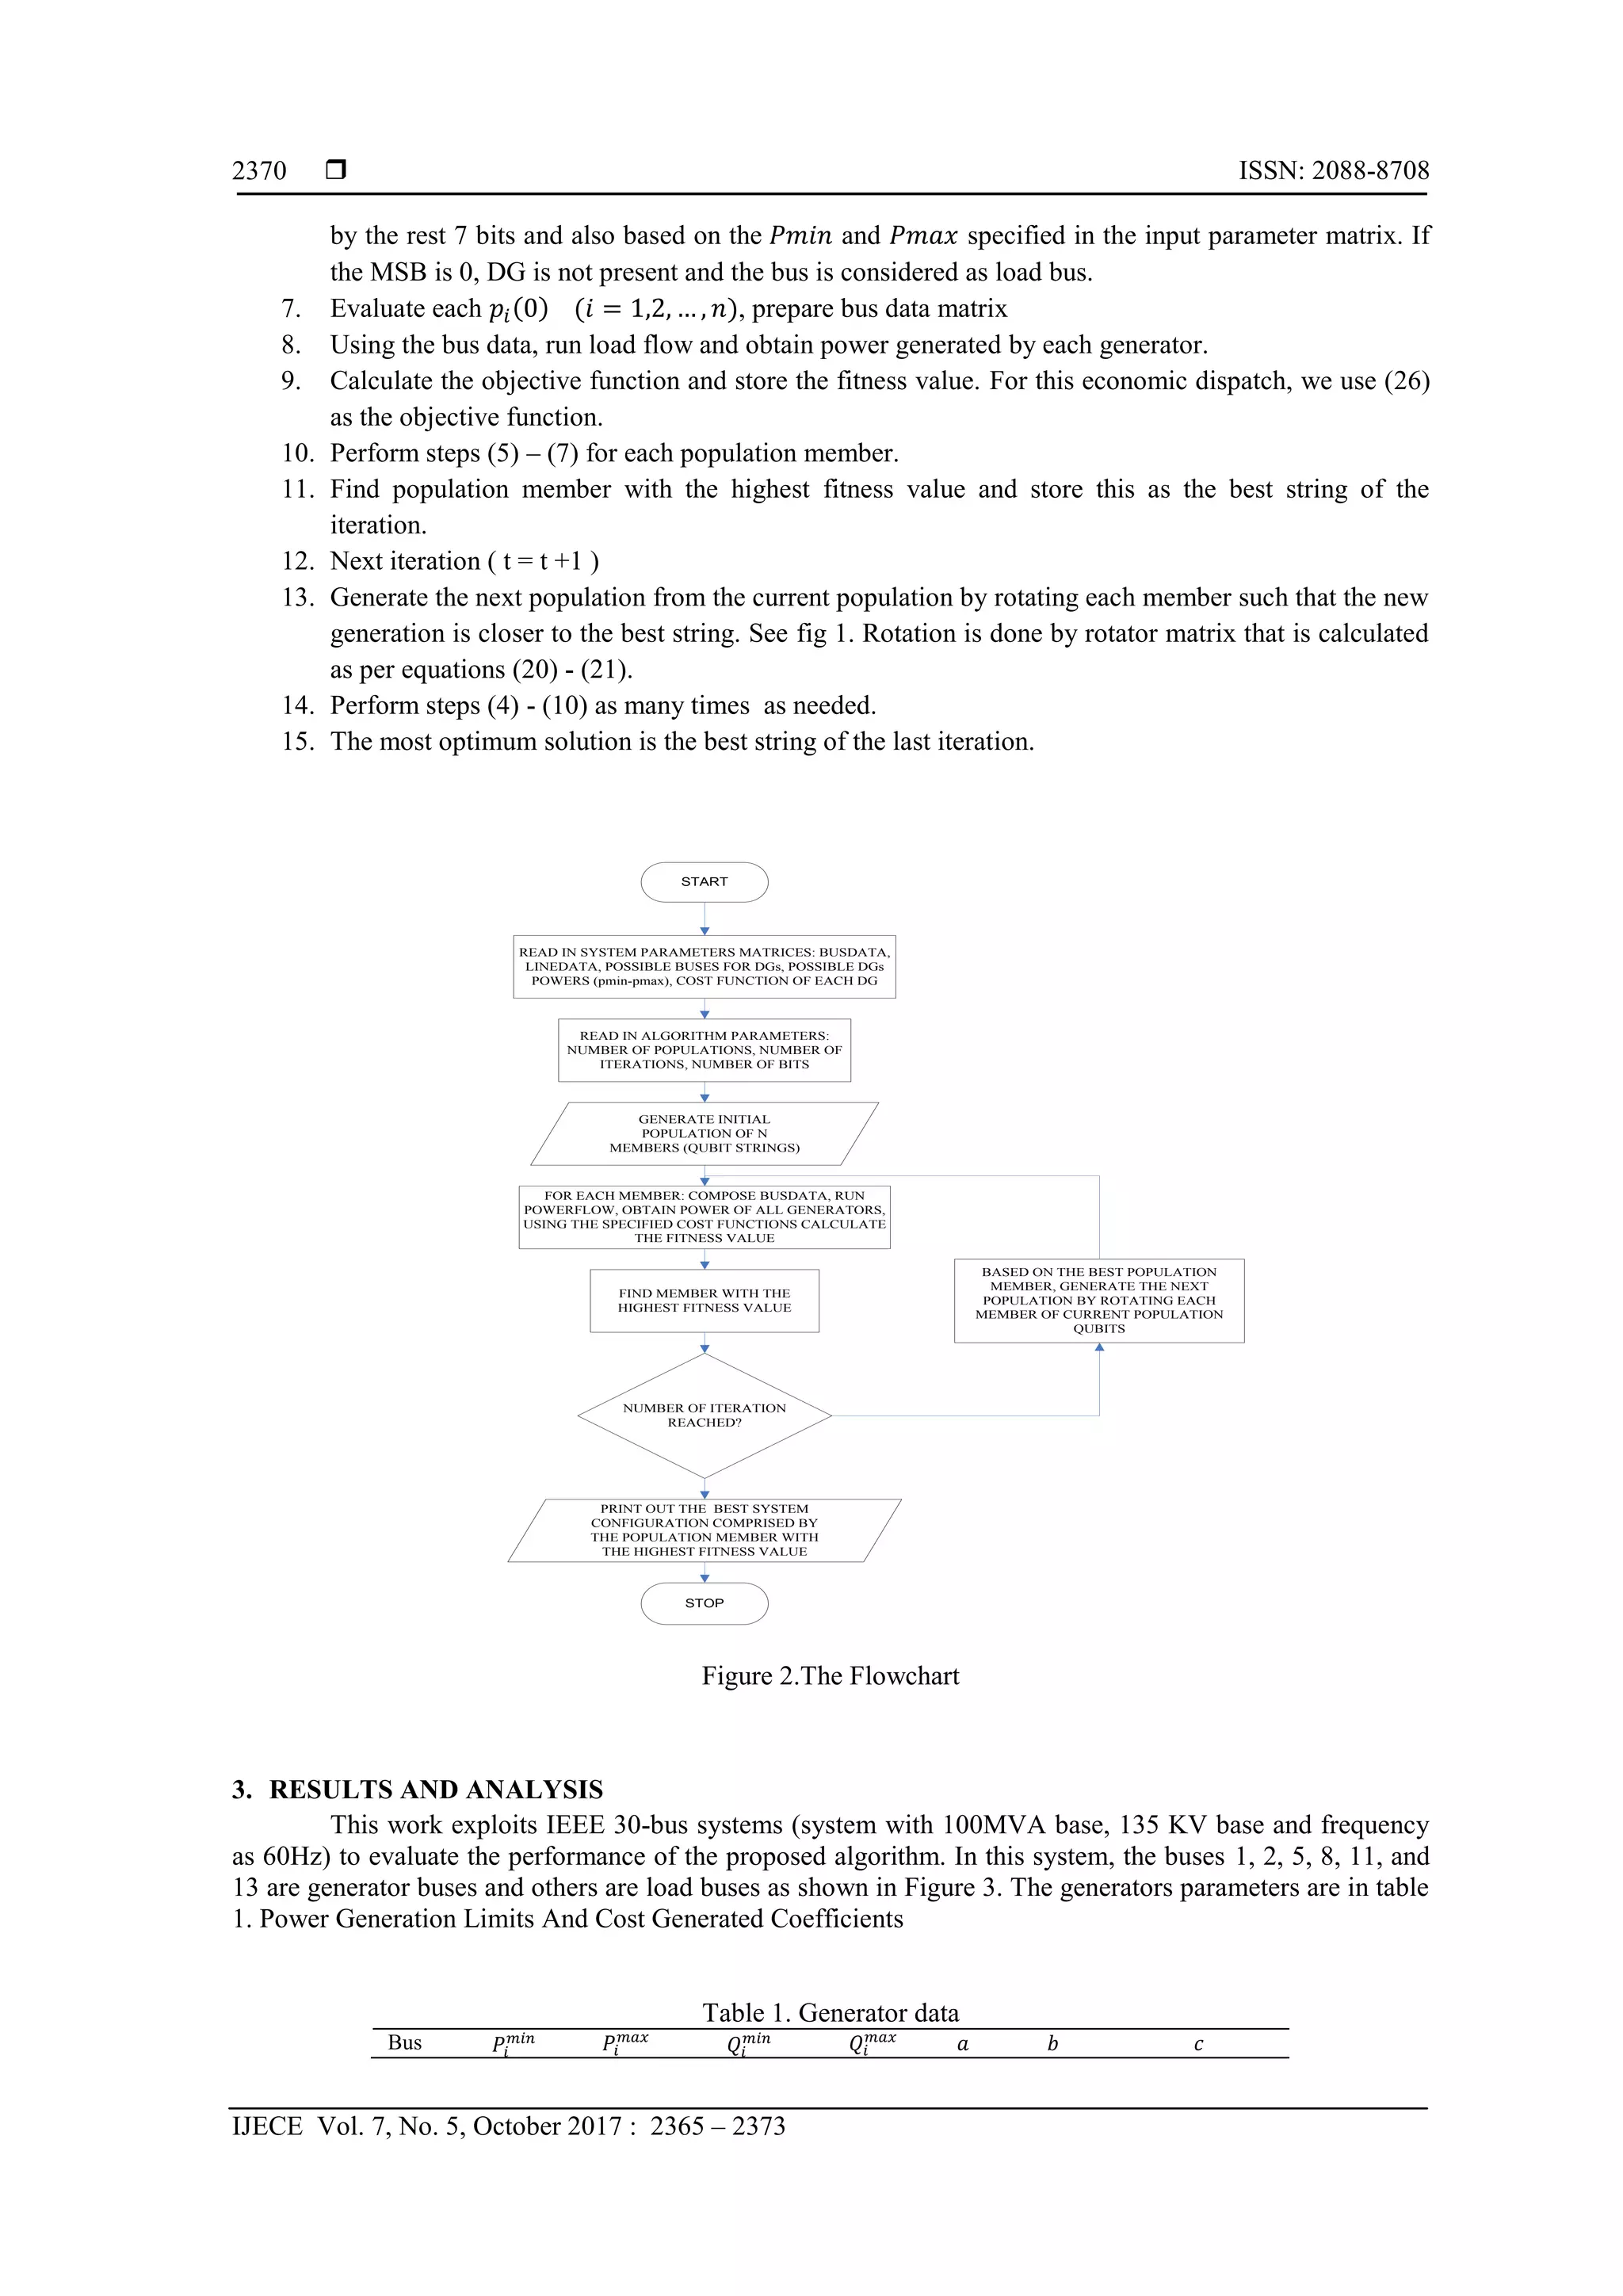
![IJECE ISSN: 2088-8708 Economic Dispatch using Quantum Evolutionary Algorithm in Electrical Power… (Ni Ketut Aryani) 2369 ∆𝑓𝑖 = 𝜋 × (1 − 𝑓(𝑏) 𝑓(𝑝 𝑖(𝑡) ) (𝑖 = 1,2, … , 𝑛) (23) 𝑠𝑖𝑔𝑛 (𝛼 𝑏 − 𝛼𝑗) = { +1 𝑖𝑓 𝛼 𝑏 ≥ 𝛼𝑗 −1 𝑖𝑓 𝛼 𝑏 < 𝛼𝑗 (24) 𝑠𝑖𝑔𝑛 [𝛽𝑗 × sin ∆𝑓𝑖 − 𝛼𝑗 × (1 − 𝑐𝑜𝑠∆𝑓𝑖)] = { +1 𝑖𝑓 𝛽𝑗 × sin ∆𝑓𝑖 ≥ 𝛼𝑗 × (1 − 𝑐𝑜𝑠∆𝑓𝑖) −1 𝑖𝑓 𝛽𝑗 × sin ∆𝑓𝑖 < 𝛼𝑗 × (1 − 𝑐𝑜𝑠∆𝑓𝑖) (25) Figure 1.Basic Quantum-bit (qubit) 2.3. Problem Formulation The objective function of this proposed method is : min 𝐶 = ∑ 𝐶𝑖(𝑃𝑖)𝑛 𝑖=1 + ∑ 𝐶𝑔(𝑃𝑔)ℎ 𝑔=1 (26) where 𝐶𝑖 is the total fuel cost for the i th thermal generator ($/h), 𝐶𝑔 is the total cost for generated power of DG ($/h). Bus voltage constrain: |𝑉𝑖 𝑚𝑖𝑛| ≤ |𝑉𝑖| ≤ |𝑉𝑖 𝑚𝑎𝑥| (27) Capacity DG constrain : 𝑃𝑔 𝑚𝑖𝑛 ≤ 𝑃𝑔 ≤ 𝑃𝑔 𝑚𝑎𝑥(28) 2.4. The Proposed Method The proposed method can be described in the following steps and the flowchart of the algorithm is in figure 2. 1. Start with t = 0 2. Initialize a population of n members (qubit string) : 𝑄 (0) = {𝑞1(0), 𝑞2(0), … , 𝑞 𝑛(0)} 3. Each qubit string is represented: 𝑞1(0) = [| 𝛼1(0) 𝛽1(0) | | 𝛼2(0) 𝛽2(0) | . . . | 𝛼 𝑚(0) 𝛽 𝑚(0) |] 4. For all qubit strings initialize the amplitude amplification at : 𝑞1(0) = | 1 √2 1 √2 … 1 √2 1 √2 … | 5. Randomly, make a set binary solution P(0) by observing Q(0) state : 𝑃(0) = {𝑝1(0), 𝑝2(0), … , 𝑝 𝑛(0) } 6. Each DG is represented by 8 bit binary number. The MSB (Most Significant Bit) signifies whether the DG is present. If this bit is 1, DG is present at the bus and this DG’s output power is determined](https://image.slidesharecdn.com/v095jun1725oct1613141-28227-1-ededit-201021064332/75/Economic-Dispatch-using-Quantum-Evolutionary-Algorithm-in-Electrical-Power-System-involving-Distributed-Generators-5-2048.jpg)
![IJECE ISSN: 2088-8708 Economic Dispatch using Quantum Evolutionary Algorithm in Electrical Power… (Ni Ketut Aryani) 2373 REFERENCES [1] Joko Pitono, Adi Soeprijanto, and Takashi Hiyama” Hybrid Optimization of Emission and Economic Dispatch by the Sigmoid Decreasing Inertia Weight Particle Swarm Optimization”, World Academy of Science, Engineering and Technology 60 2009 [2] Leandro dos Santos Coelho a,*, Chu-Sheng Lee b, “Electrical Power and Solving economic load dispatch problems in power systems using chaotic and Gaussian particle swarm optimization approaches”, Energy Systems 30 (2008) 297–307, ELSIVIER. [3] Hossein Shahinzadeh1, Sayed Mohsen Nasr-Azadani2, Nazereh Jannesari3, “Applications of Particle Swarm Optimization Algorithm to Solving the Economic Load Dispatch of Units in Power Systems with Valve-Point Effects”, International Journal of Electrical and Computer Engineering (IJECE) [4] G.Sreenivasan, Dr. C.H.Saibabu, Dr.S.Sivanagaraju, “Solution of Dynamic Economic Load Dispatch (DELD) Problem with Valve Point Loading Effects and Ramp Rate Limits Using PSO”, International Journal of Electrical and Computer Engineering (IJECE) Vol.1, No.1, September 2011, pp. xx~xx ISSN: 2088-8708 [5] Hadi Saadat, “Power System Analysis”, McGraw-Hill, International Editions 1999. [6] John G. Vlachogiannis and Kwang Y. Lee, :Quantum-Inspired Evolutionary Algorithm for Real and Reactive Power Dispatch”, IEEE TRANSACTIONS ON POWER SYSTEMS, VOL. 23, NO. 4, NOVEMBER 2008. [7] John G. Vlachogiannis and Kwang Y. Lee, “Using Chaotic Quantum Genetic Algorithm Solving Environmental Economic Dispatch of Smart Microgrid Containing Distributed Generation System Problems”, 2010 International Conference on Power System Technology. [8] Júlio Xavier Vianna Neto a, Diego Luis de Andrade Bernert b, Leandro dos Santos Coelho b,*, Improved quantum-inspired evolutionary algorithm with diversity information applied to economic dispatch problem with prohibited operating zones Energy Conversion and Management 52 (2011) 8–14, ELSIVIER. [9] Gwo-Ching Liao,”Using Chaotic Quantum Genetic Algorithm Solving Environmental Economic Dispatch of Smart Microgrid Containing Distributed Generation System Problems”, 2010 International Conference on Power System Technology. [10] John G. Vlachogiannis a,*, Jacob Østergaard,”Reactive power and voltage control based on general quantum genetic algorithms”, ELSEVIER , Expert Systems with Applications 36 (2009) 6118–6126. [11] Han, K.-H., & Kim, J.-H. (2000), “Genetic quantum algorithm and its application to combinatorial optimization problem”. Proceedings of Congress on Evolutionary Computation, 1354–1360.](https://image.slidesharecdn.com/v095jun1725oct1613141-28227-1-ededit-201021064332/75/Economic-Dispatch-using-Quantum-Evolutionary-Algorithm-in-Electrical-Power-System-involving-Distributed-Generators-9-2048.jpg)