Download to read offline
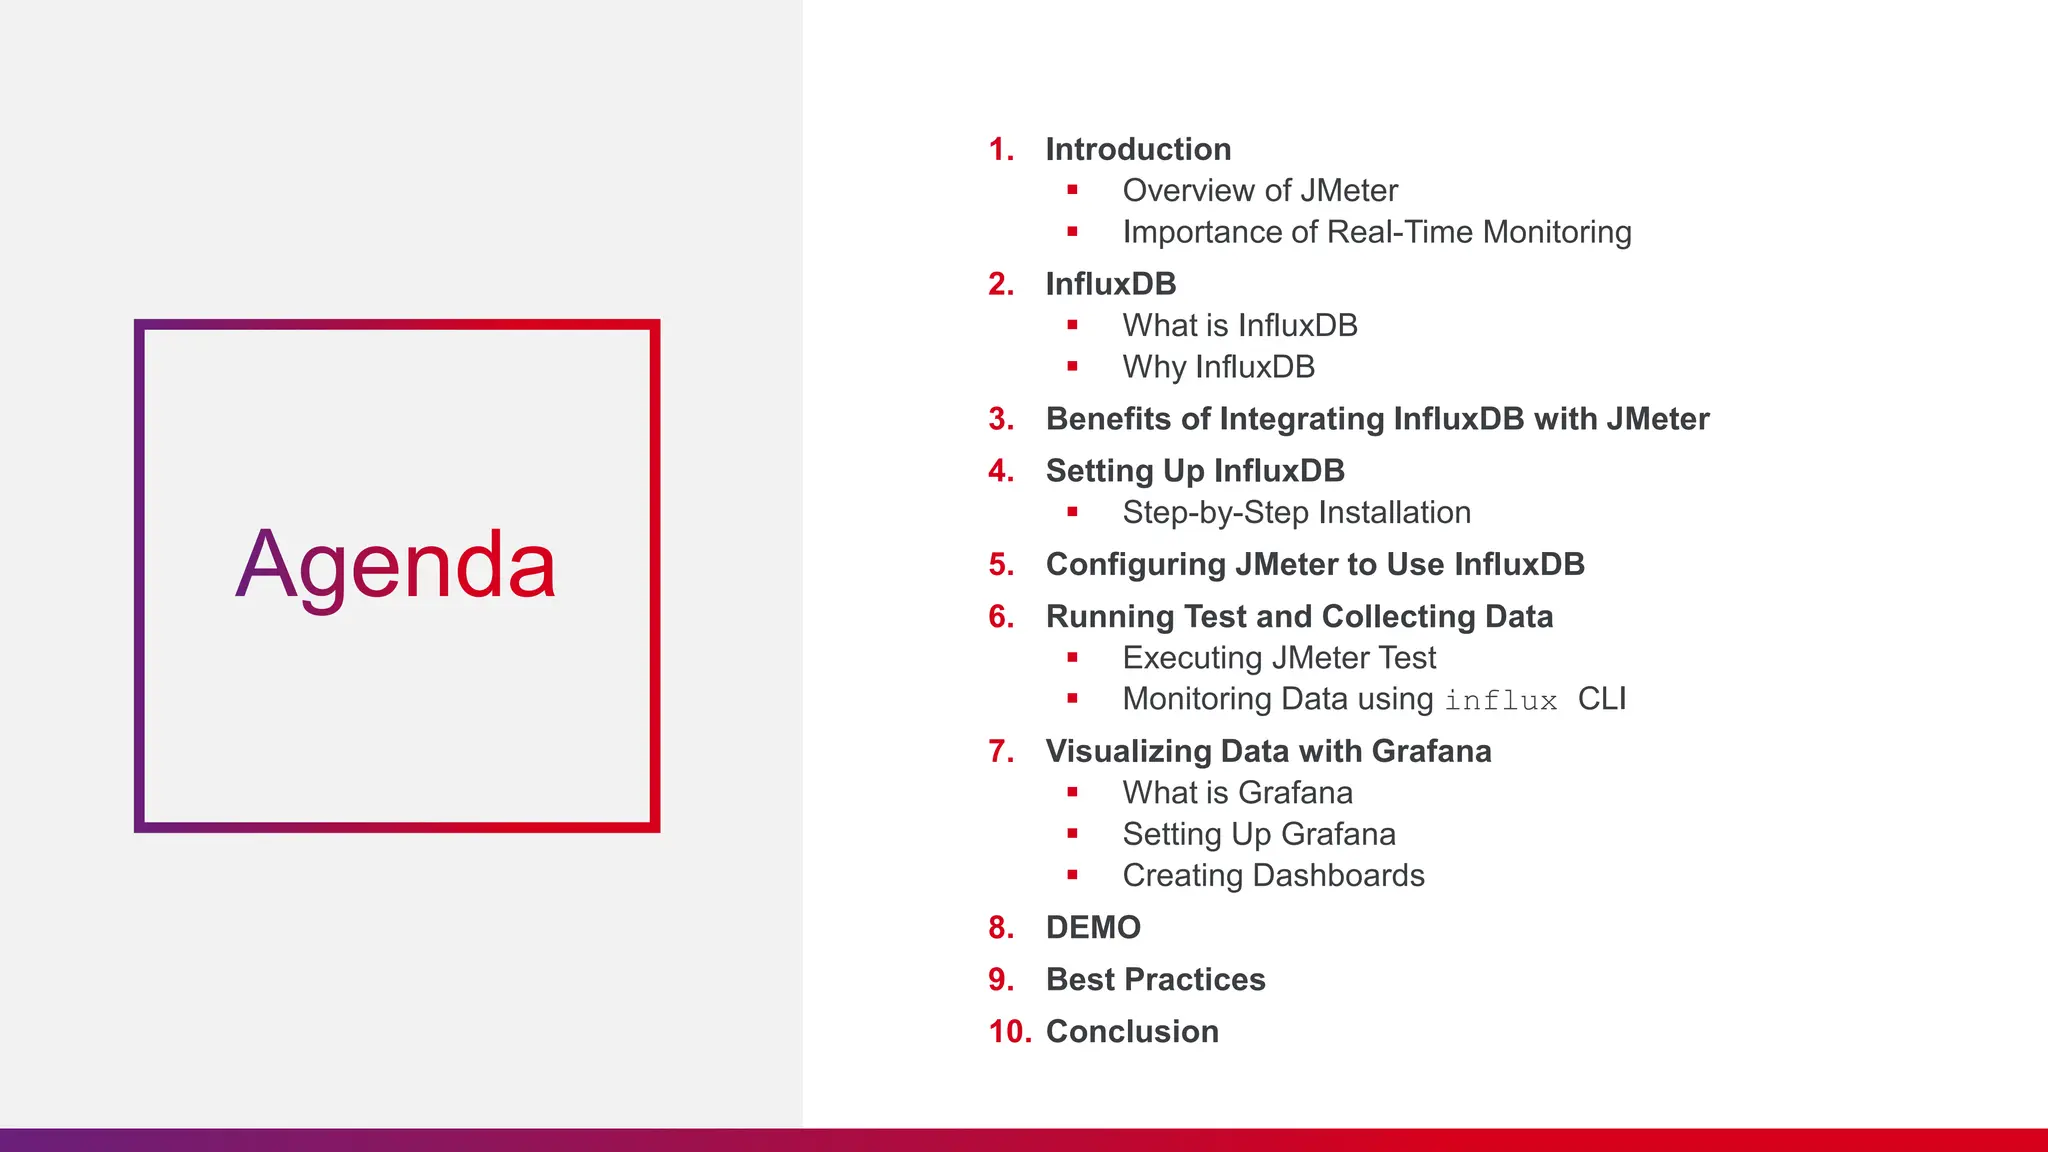
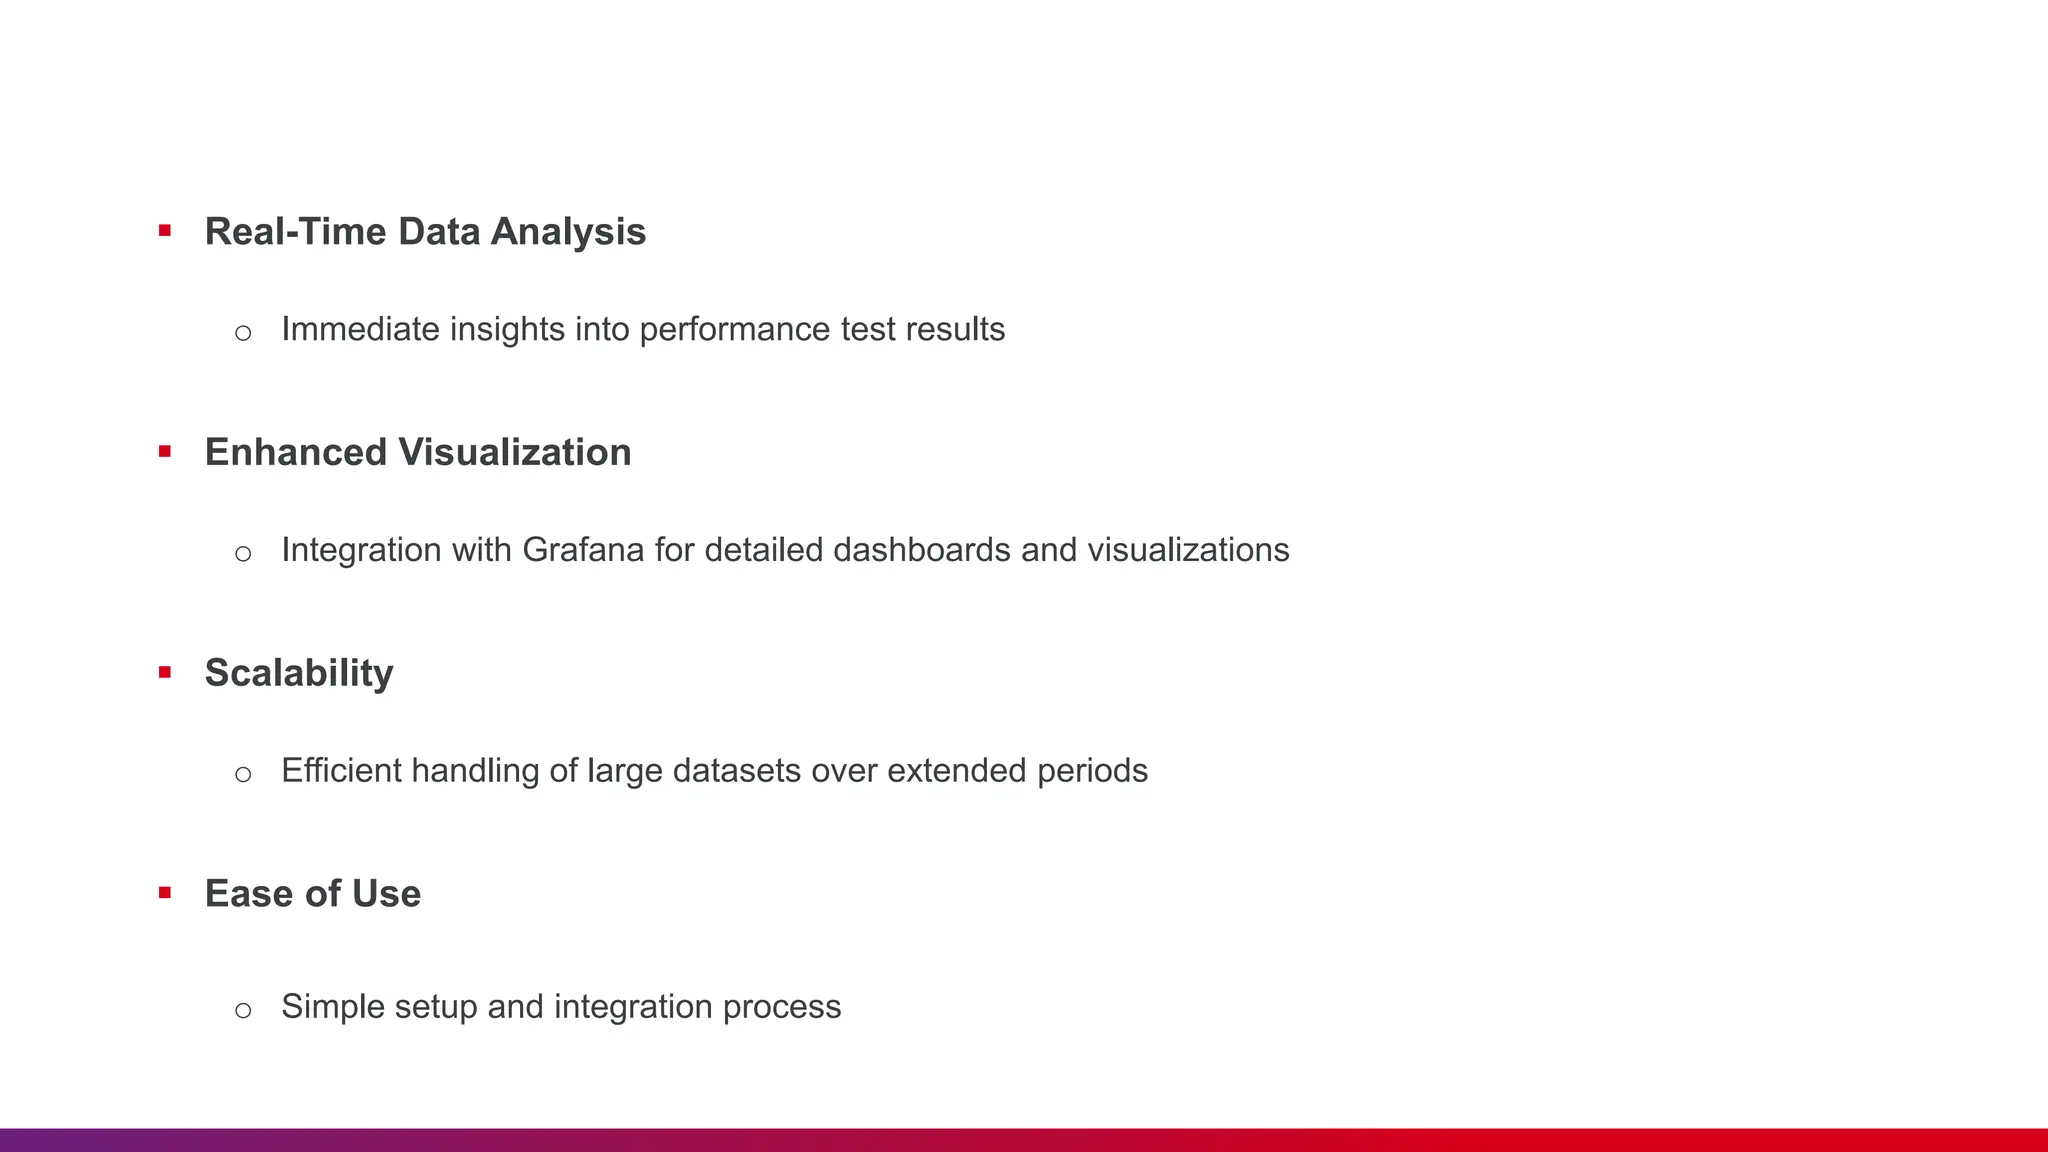

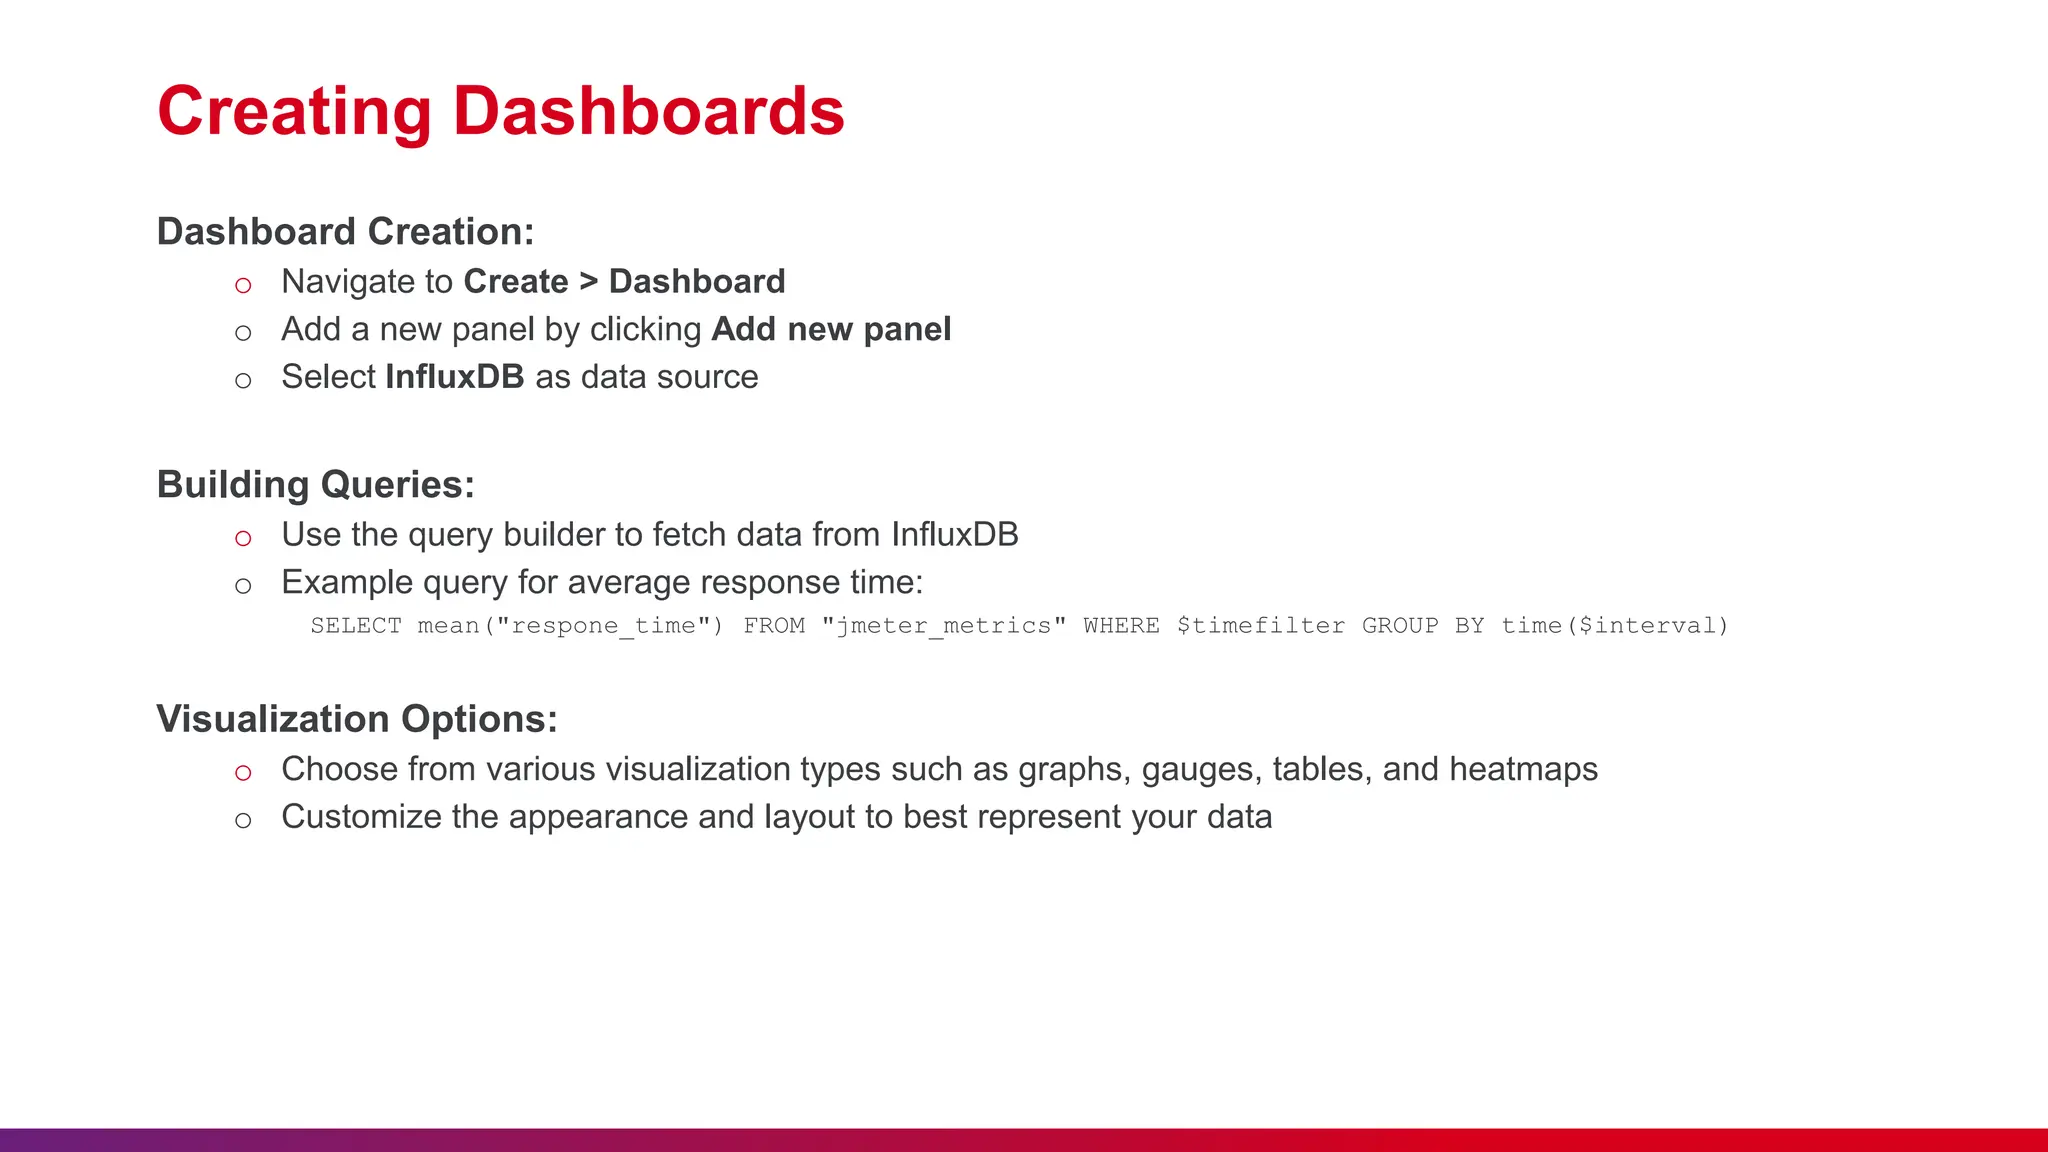
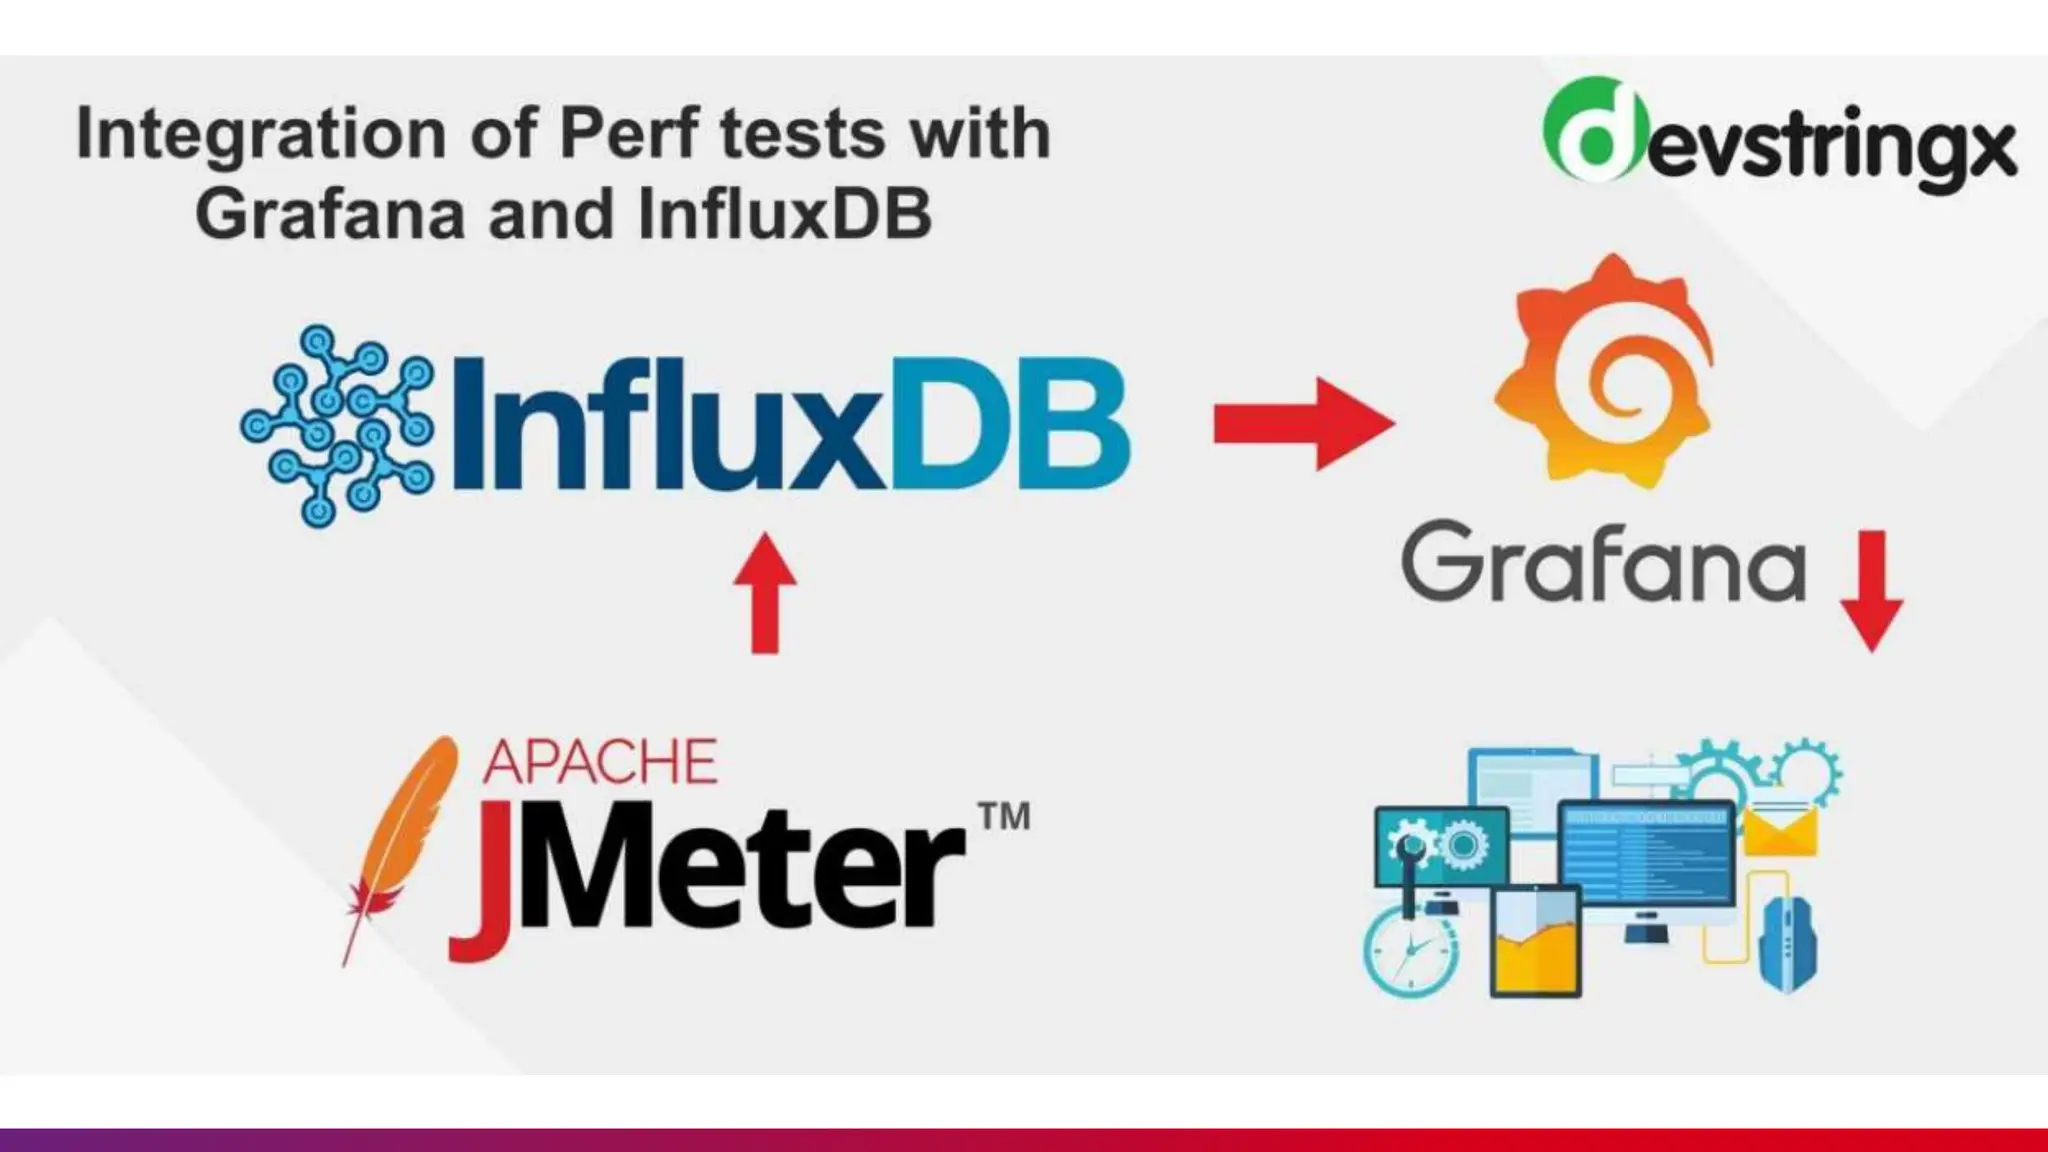

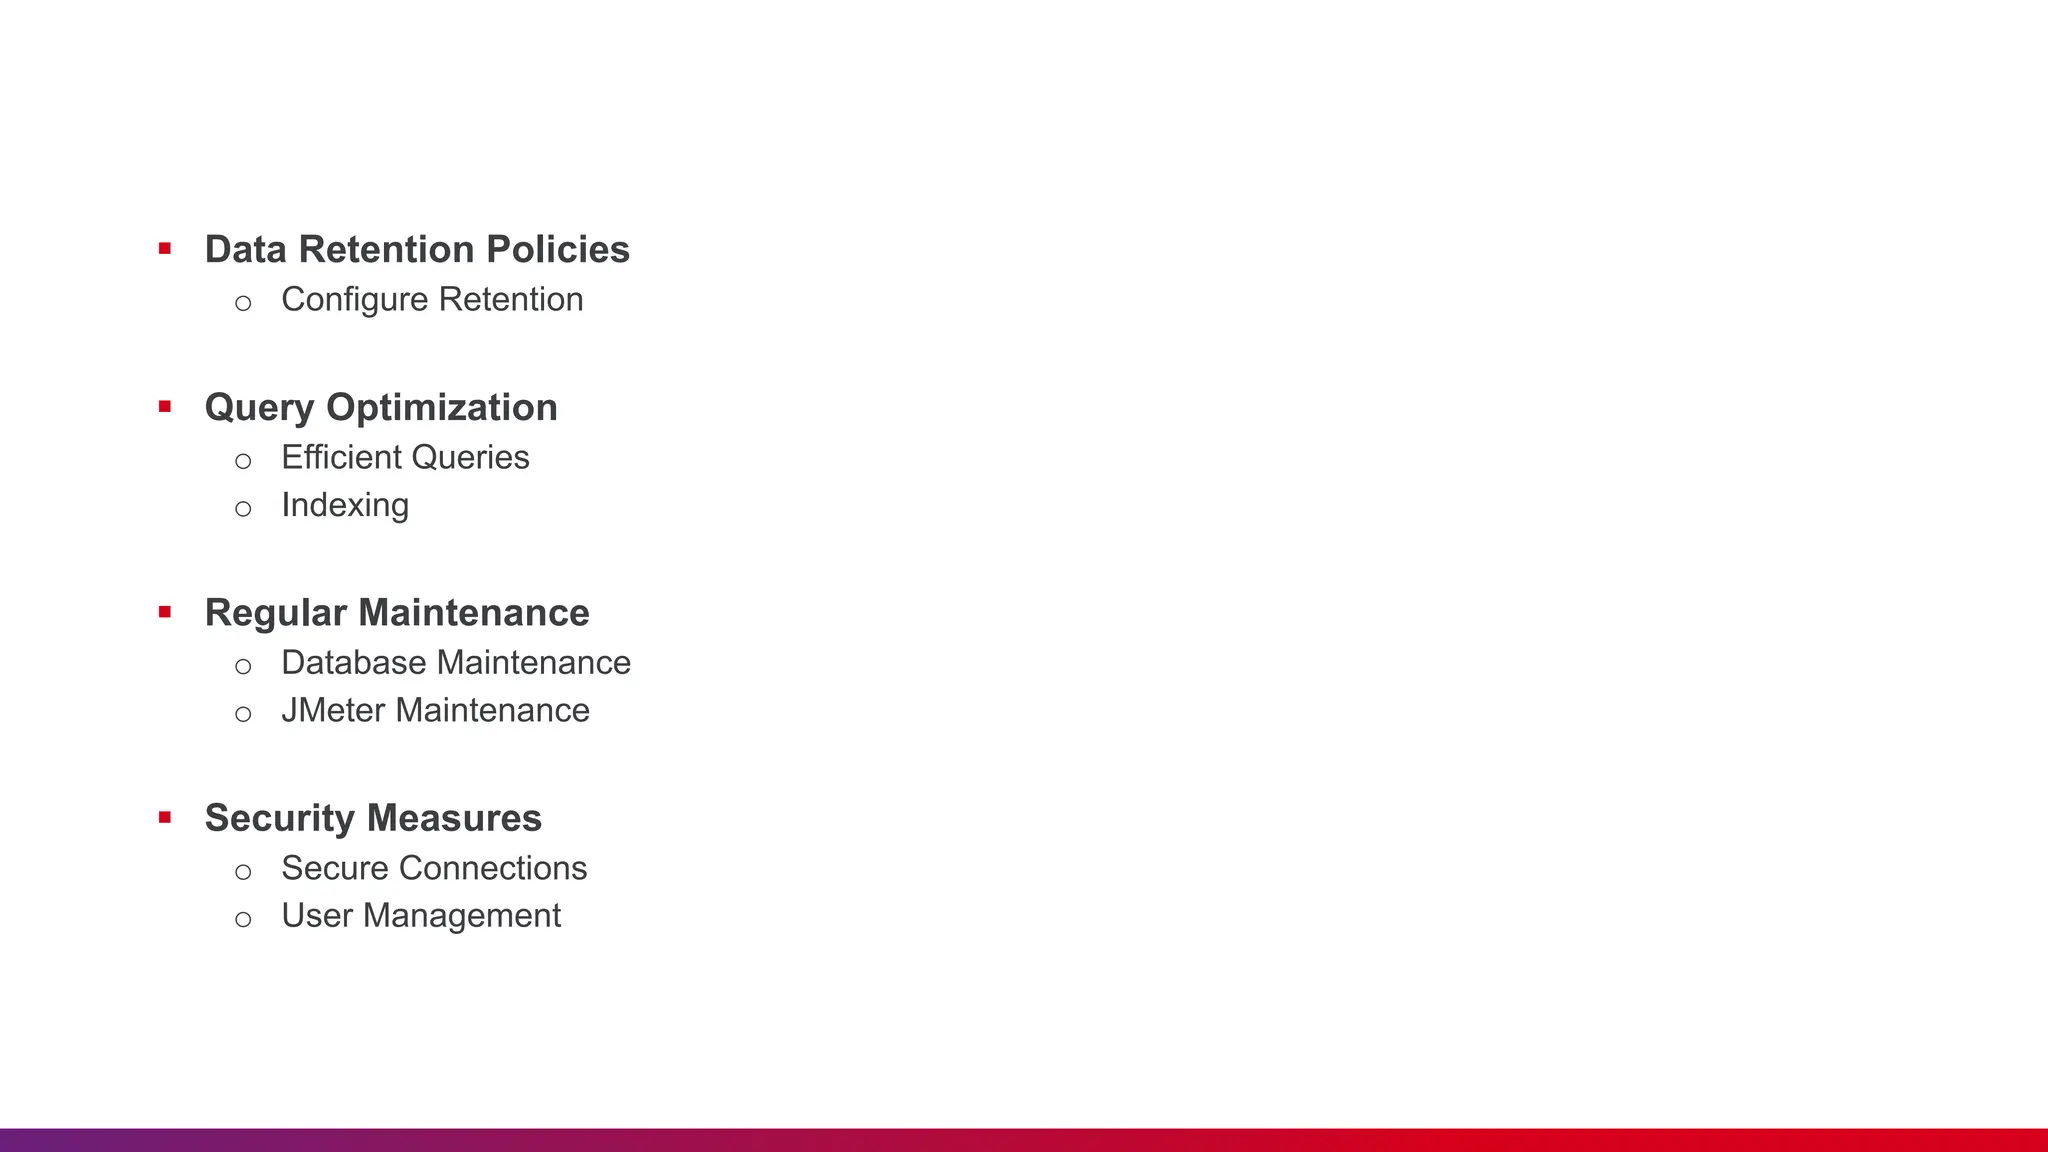


The document outlines the integration of InfluxDB with JMeter for real-time monitoring in performance testing. It covers key topics including the importance of real-time data analysis, step-by-step setup for both InfluxDB and Grafana, and best practices for efficient monitoring. Overall, it emphasizes the benefits of using these tools to enhance monitoring capabilities and facilitate actionable insights.