Download as PDF, PPTX
![© 2017 InfluxData. All rights reserved.7 Pain points solved “Out of all of the monitors there [in our office], we only have a couple that show some custom dashboards. The rest is entirely Grafana running on InfluxDB.” Jack Tench, Senior Software Engineer NewVoiceMedia “We are getting good mileage in a short time period from our investment in TICK and Grafana.” Hans Gustavson, Senior Director SRE Coupa “We also store annotation of events, curl calls from, say, Jenkins, for deployment, pushing those points into InfluxDB and then we’re able to use those for annotations with Grafana.” Robert Allen, Director of Engineering Houghton Mifflin Harcourt](https://image.slidesharecdn.com/influxdbandgrafana-nov2018-181114153051/75/Why-Open-Source-Works-for-DevOps-Monitoring-7-2048.jpg)
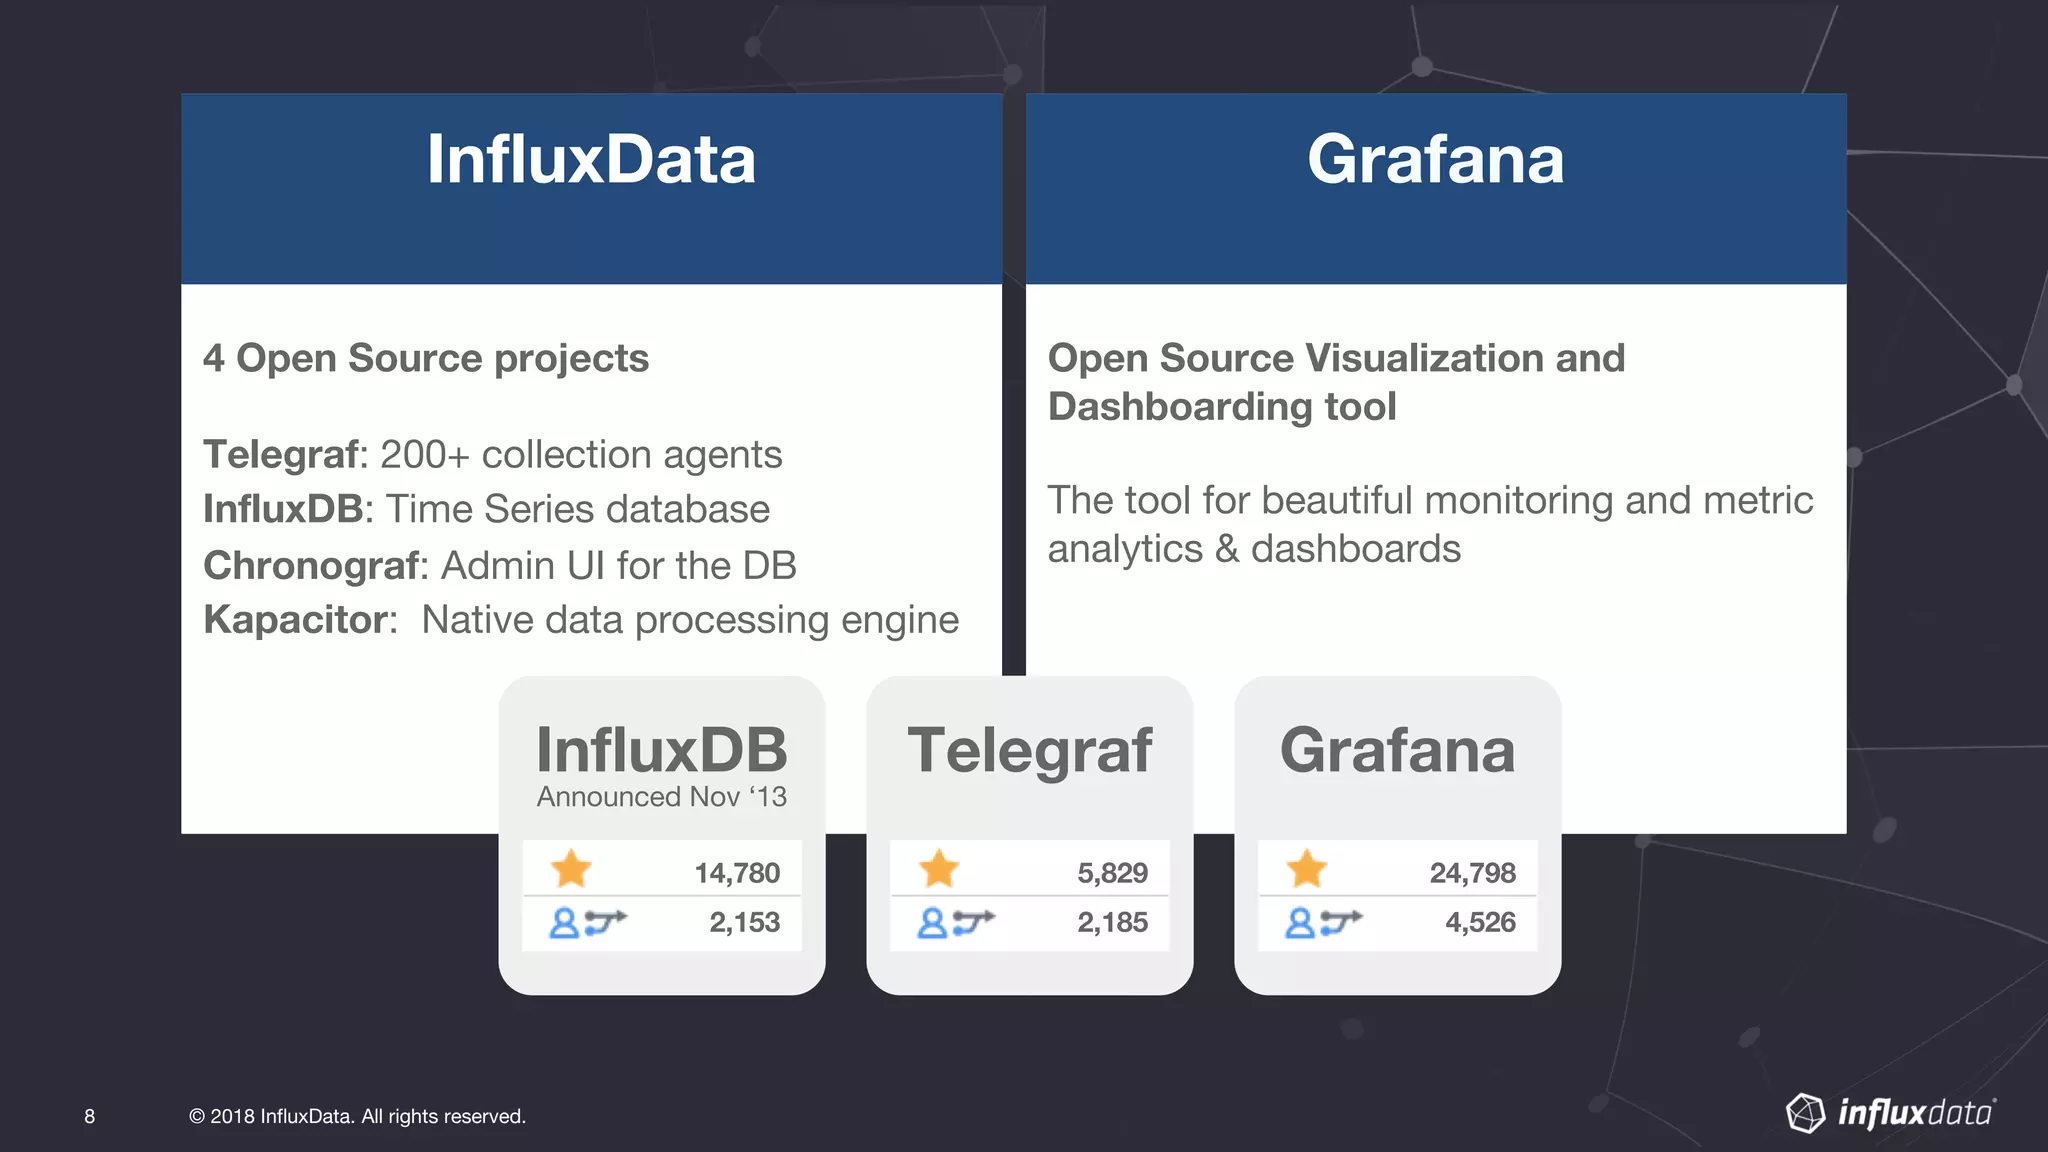
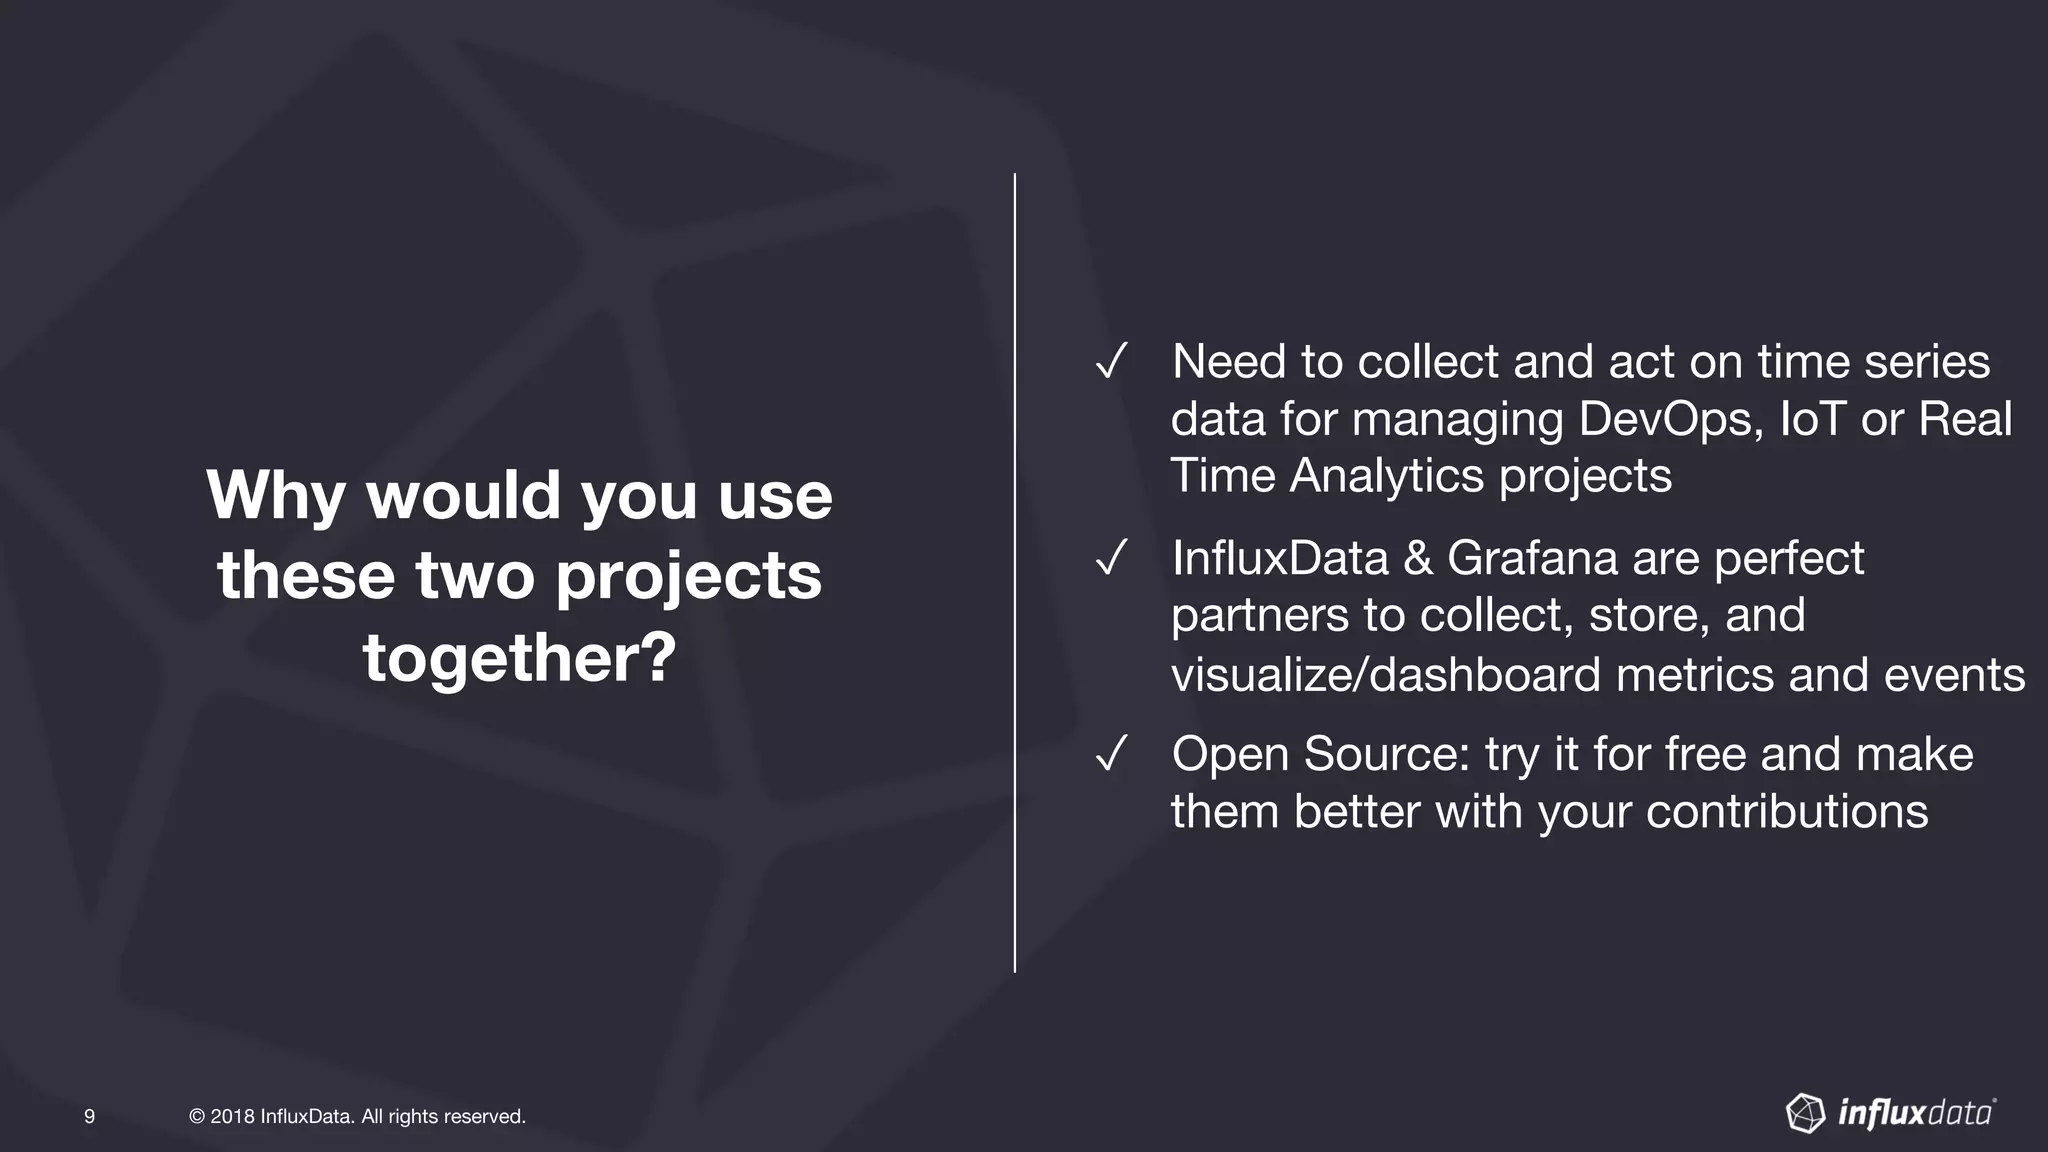
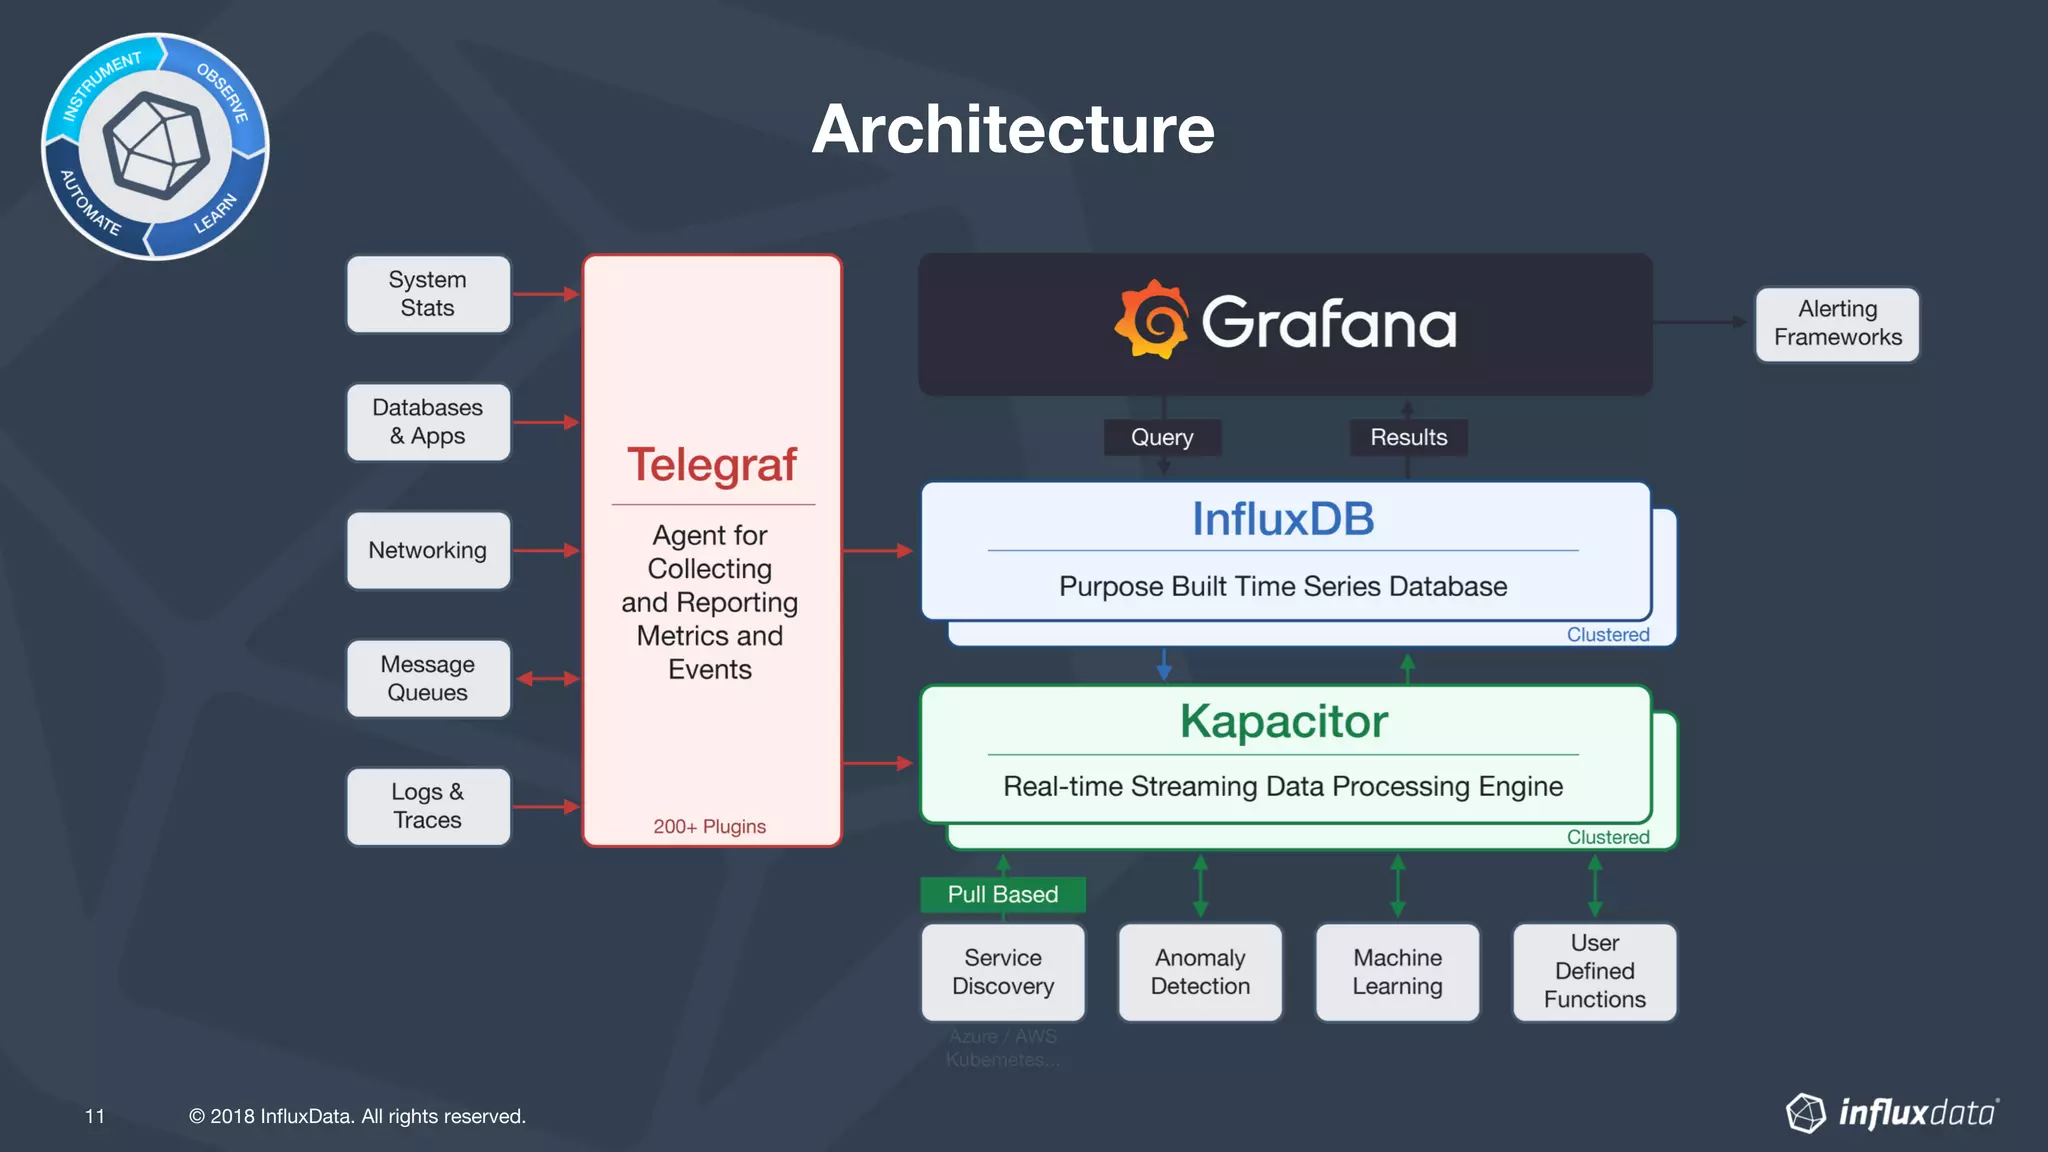
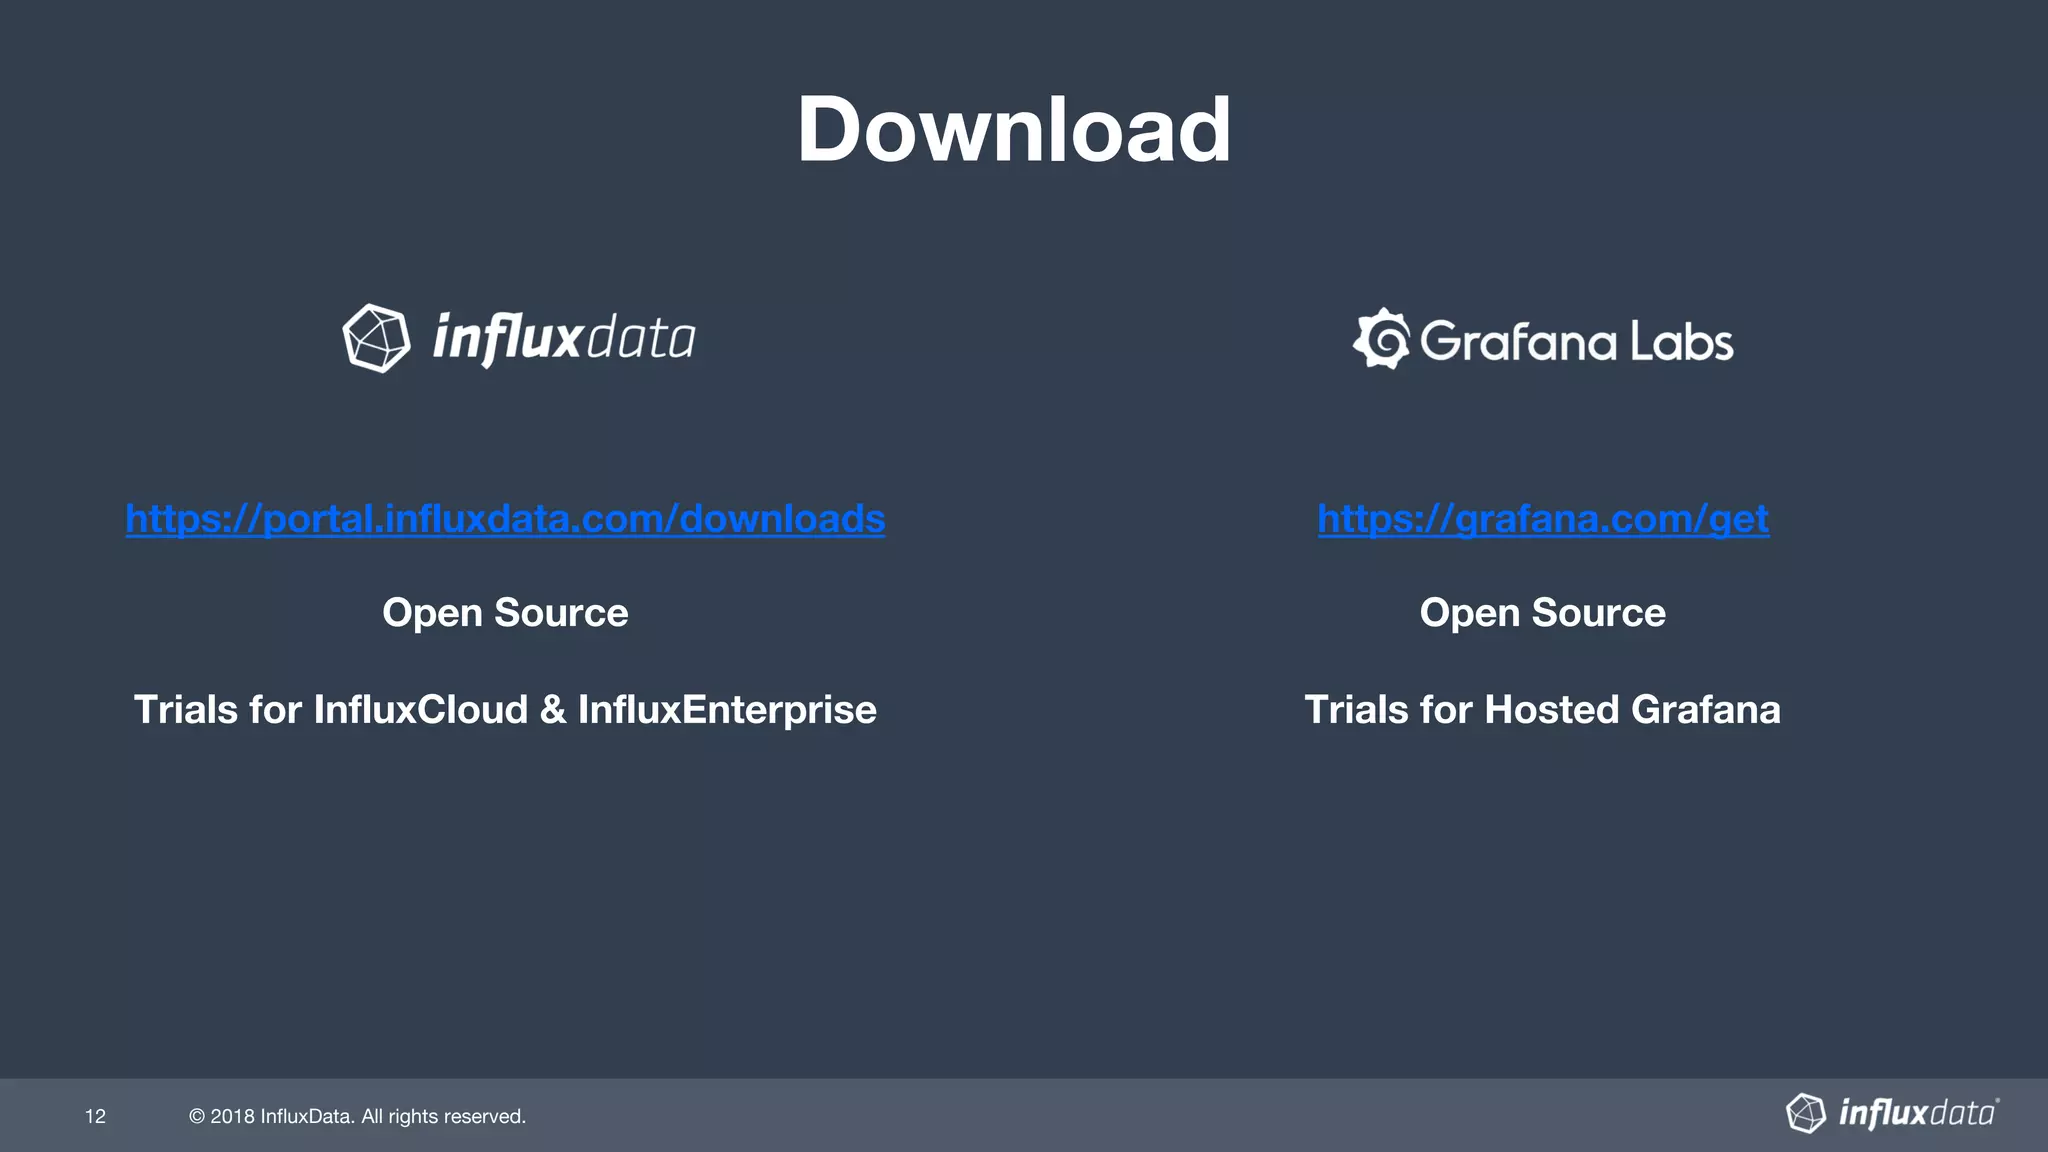
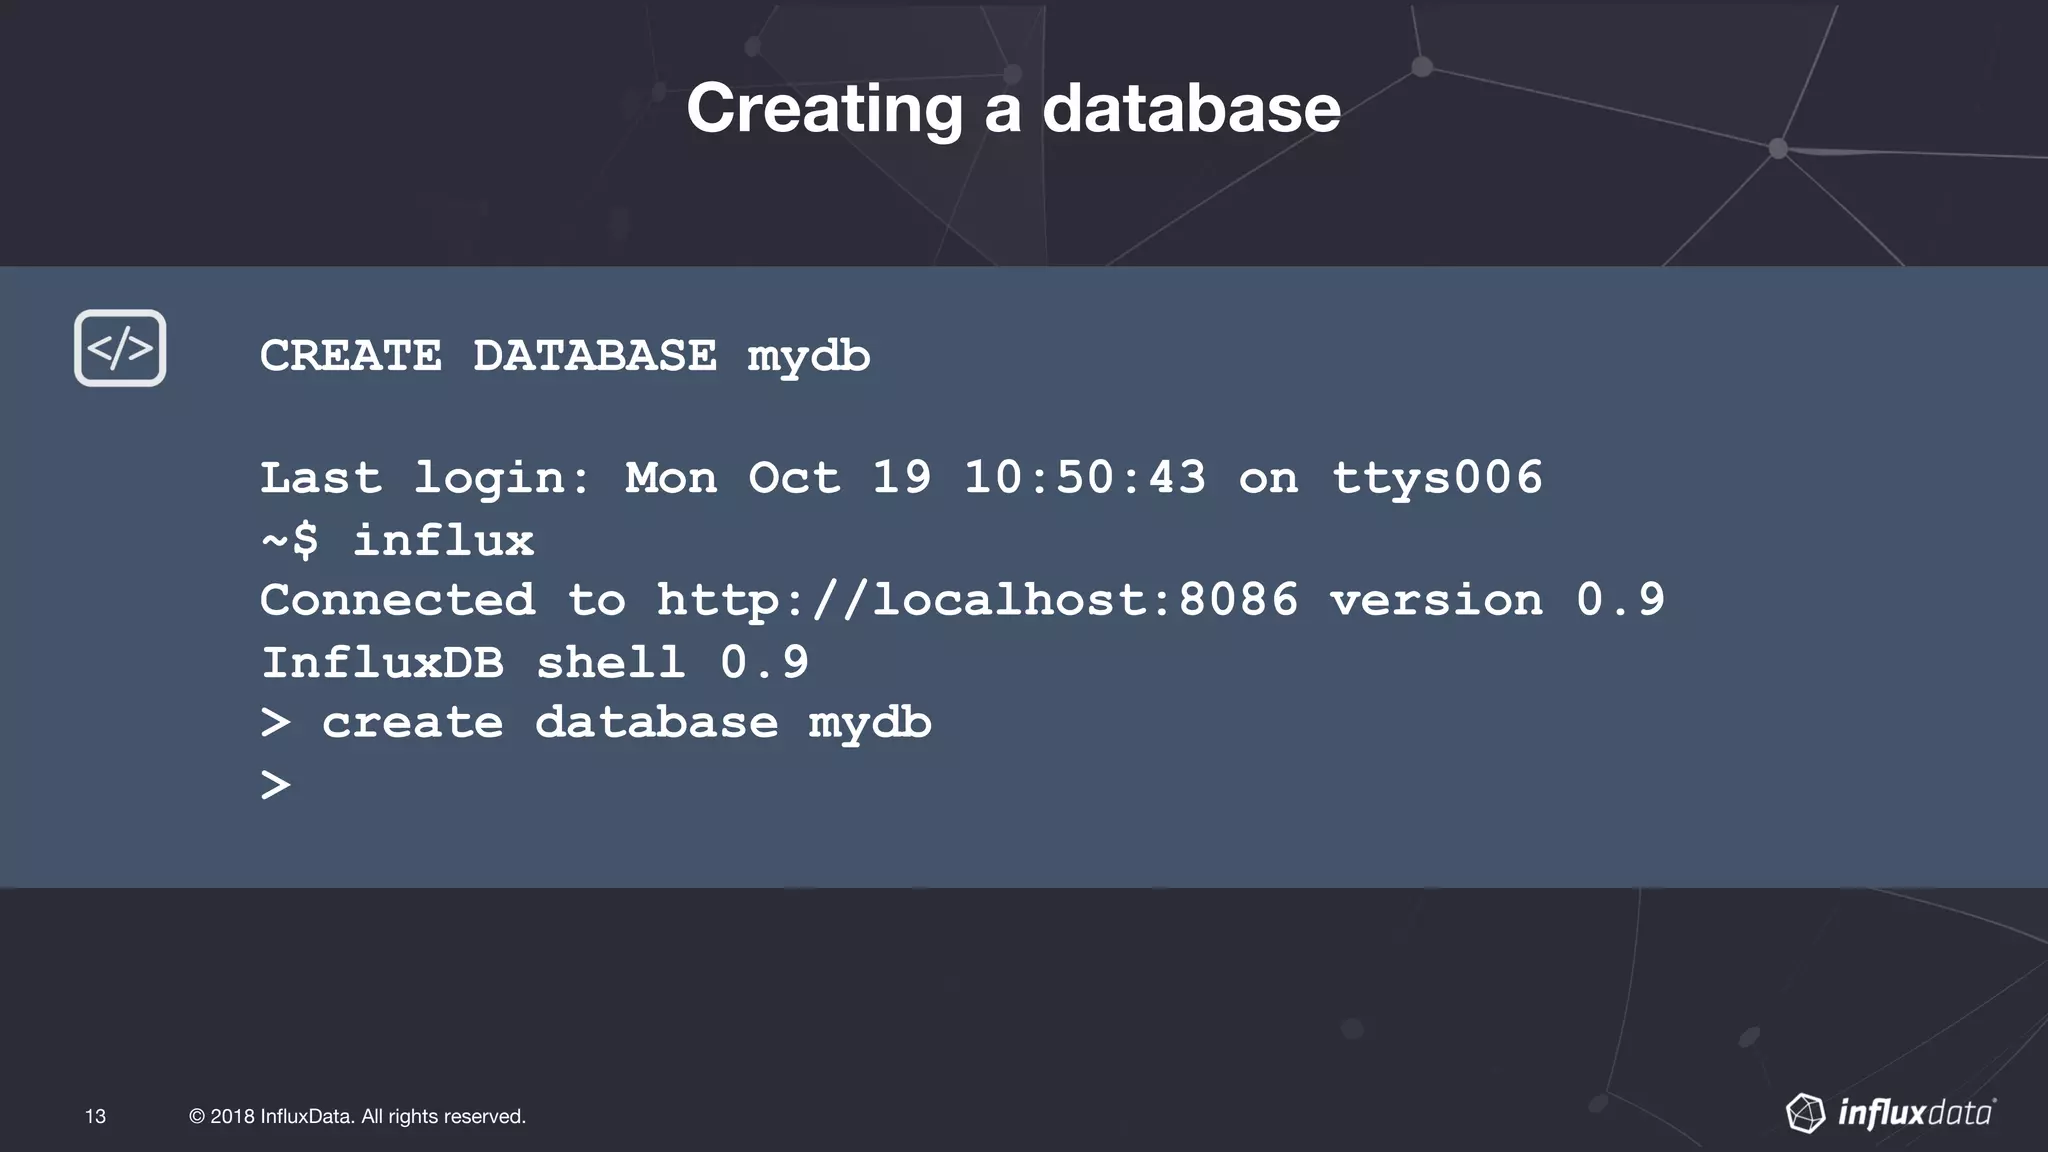
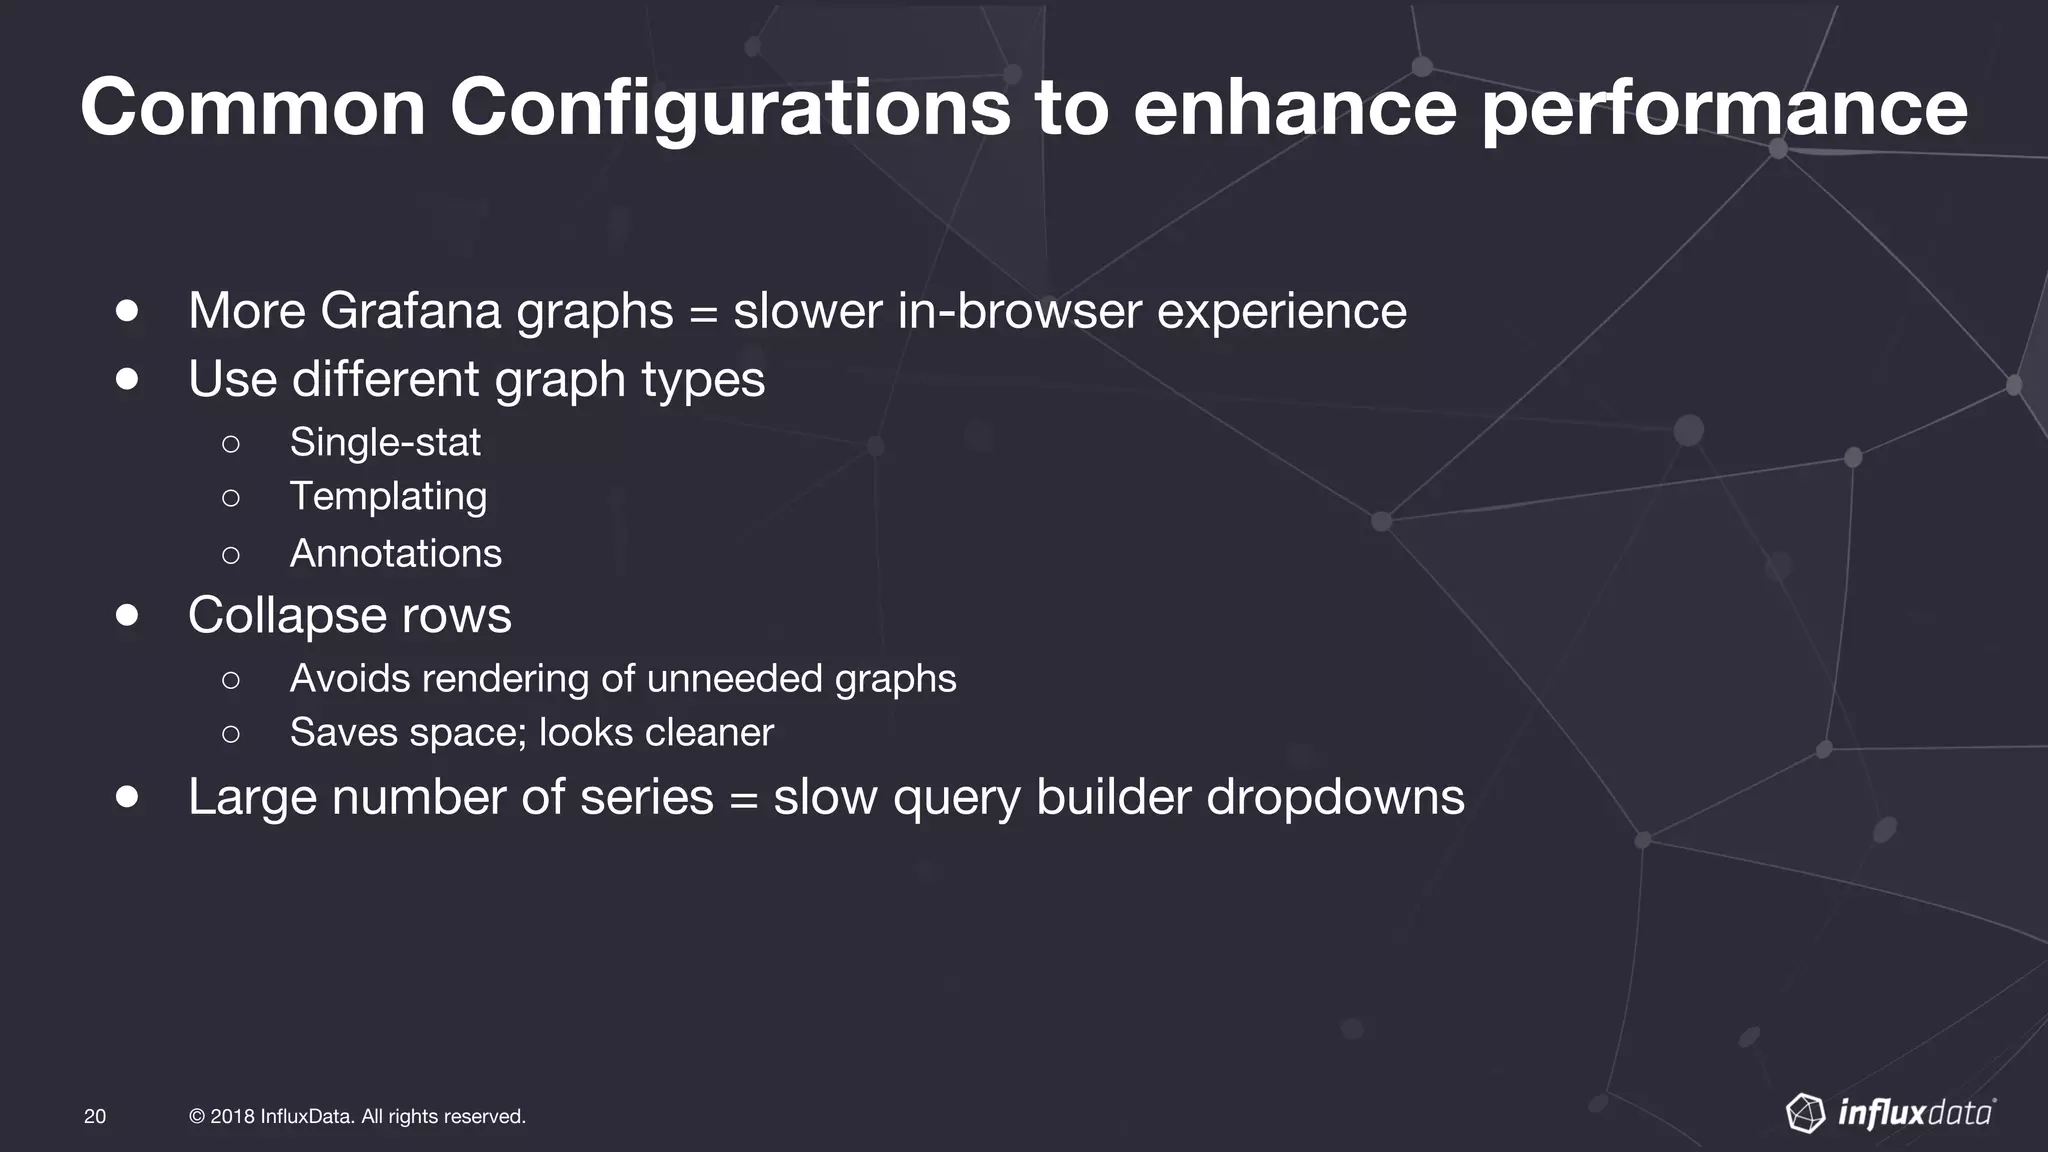
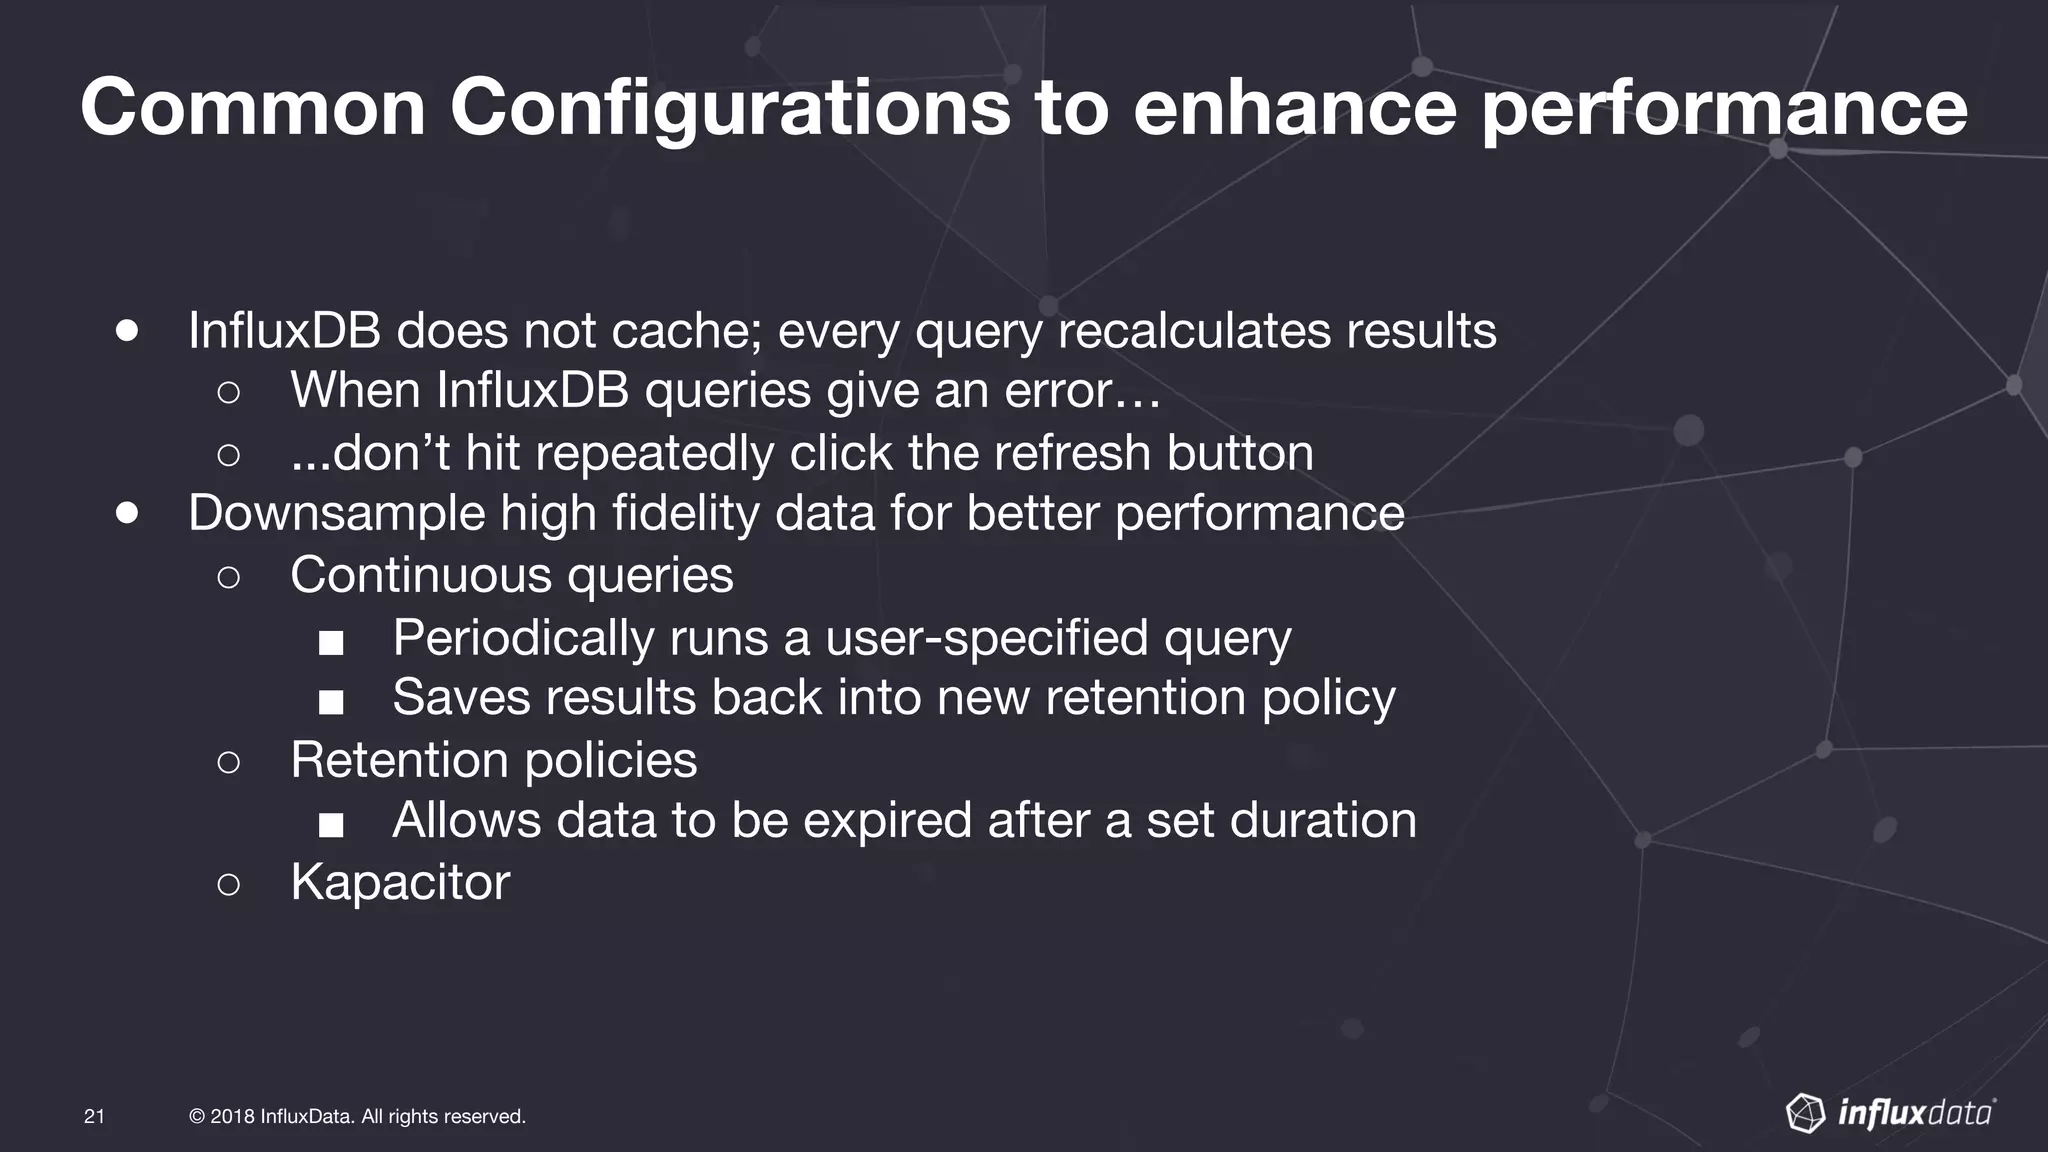


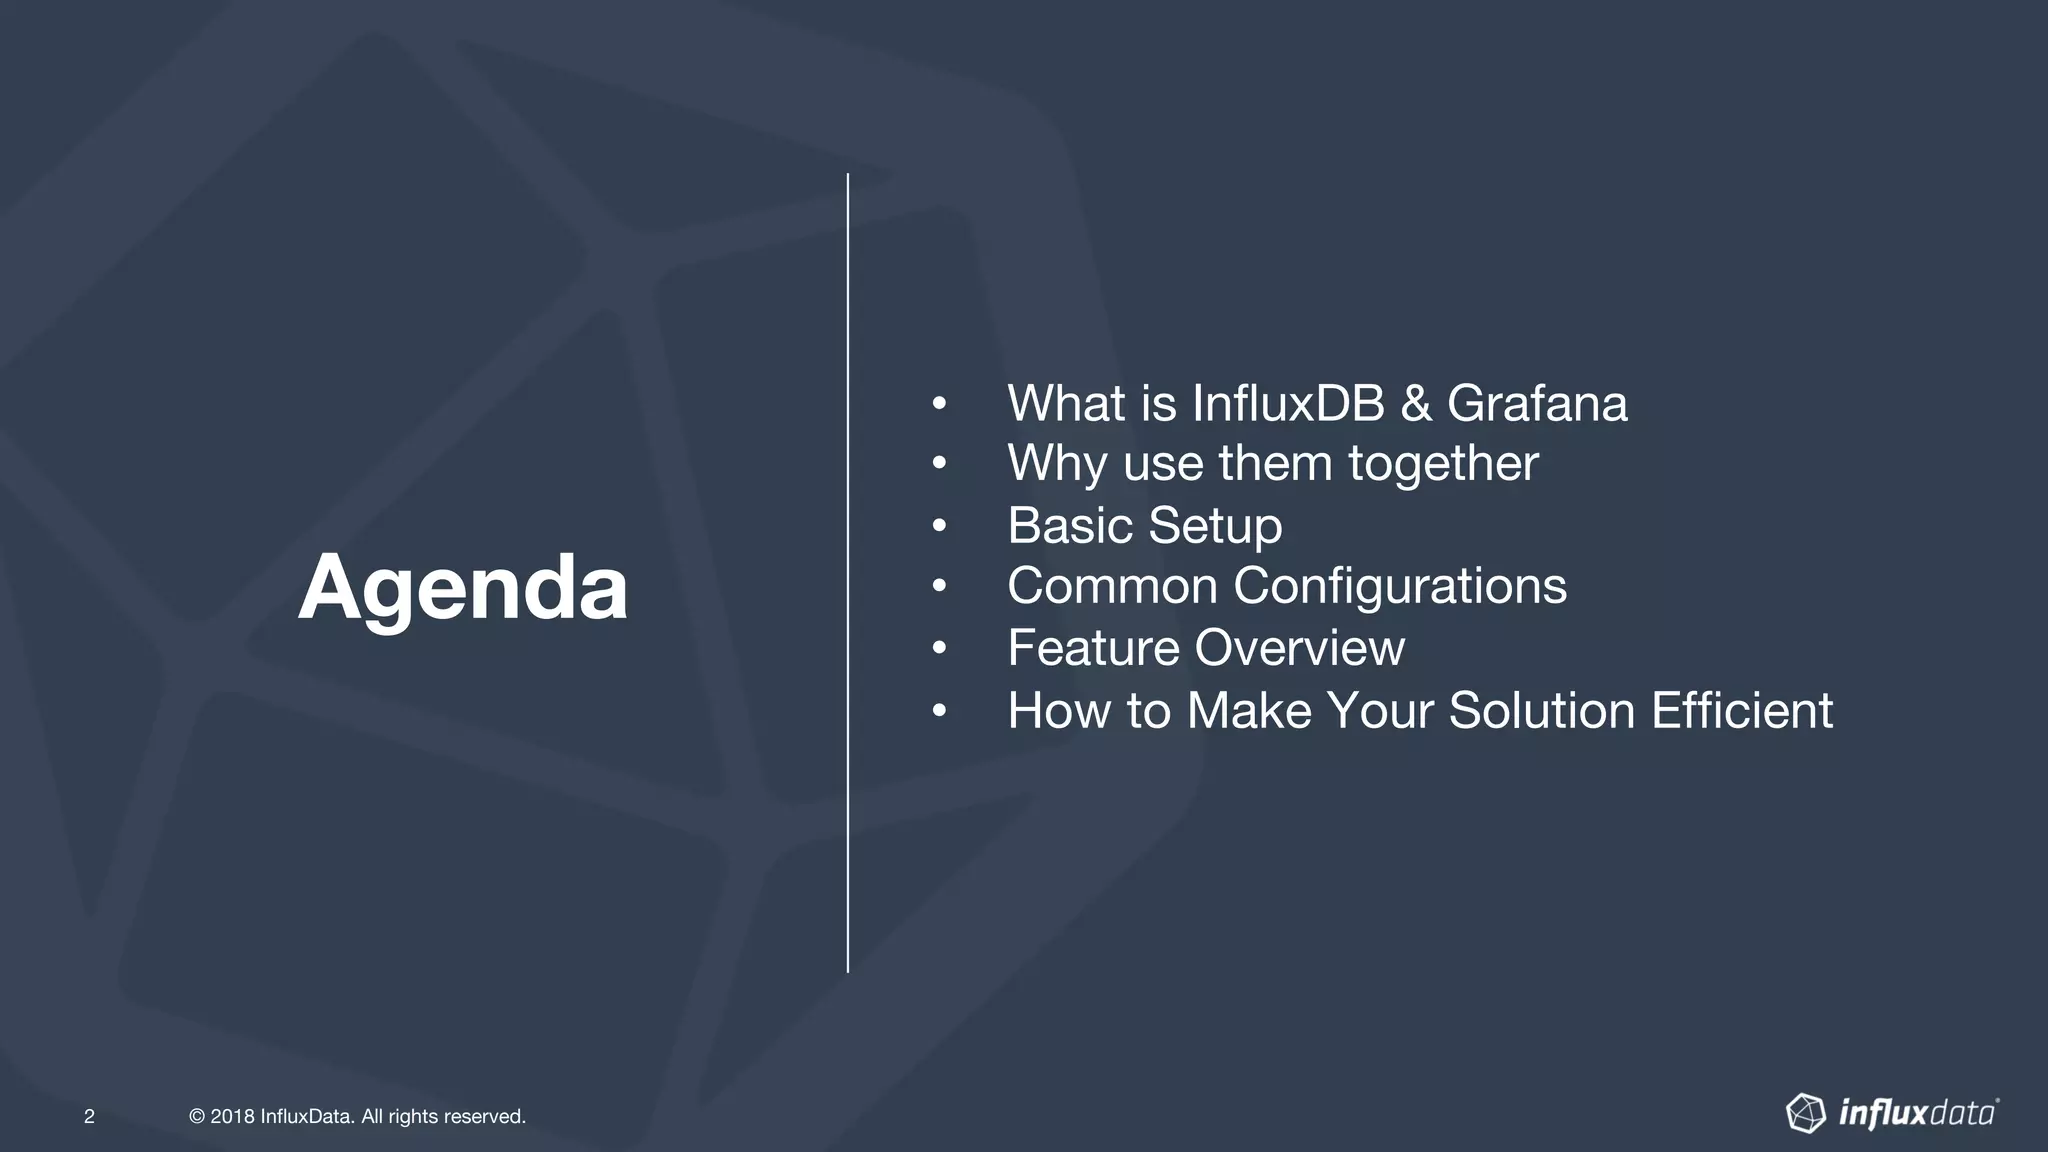
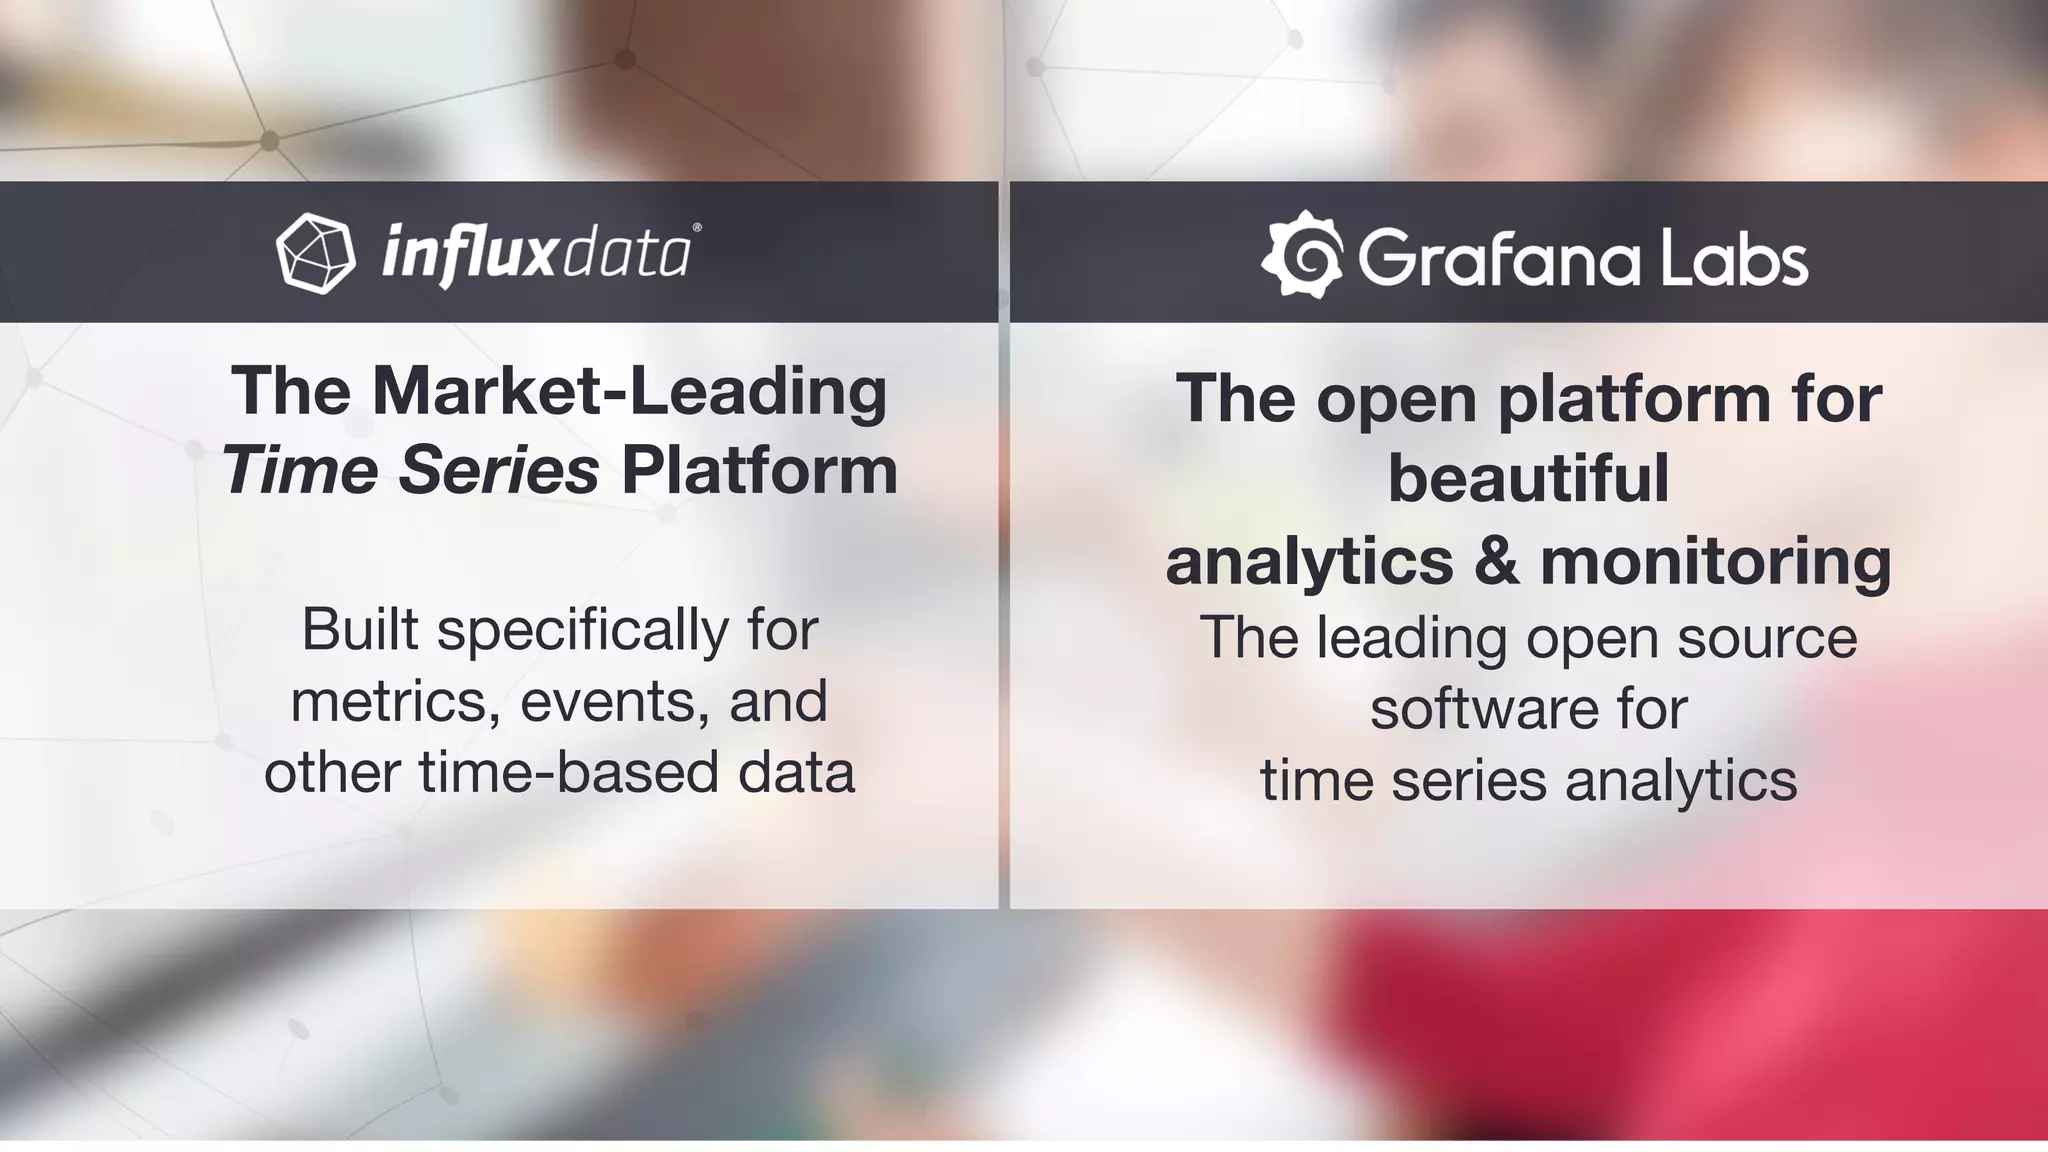
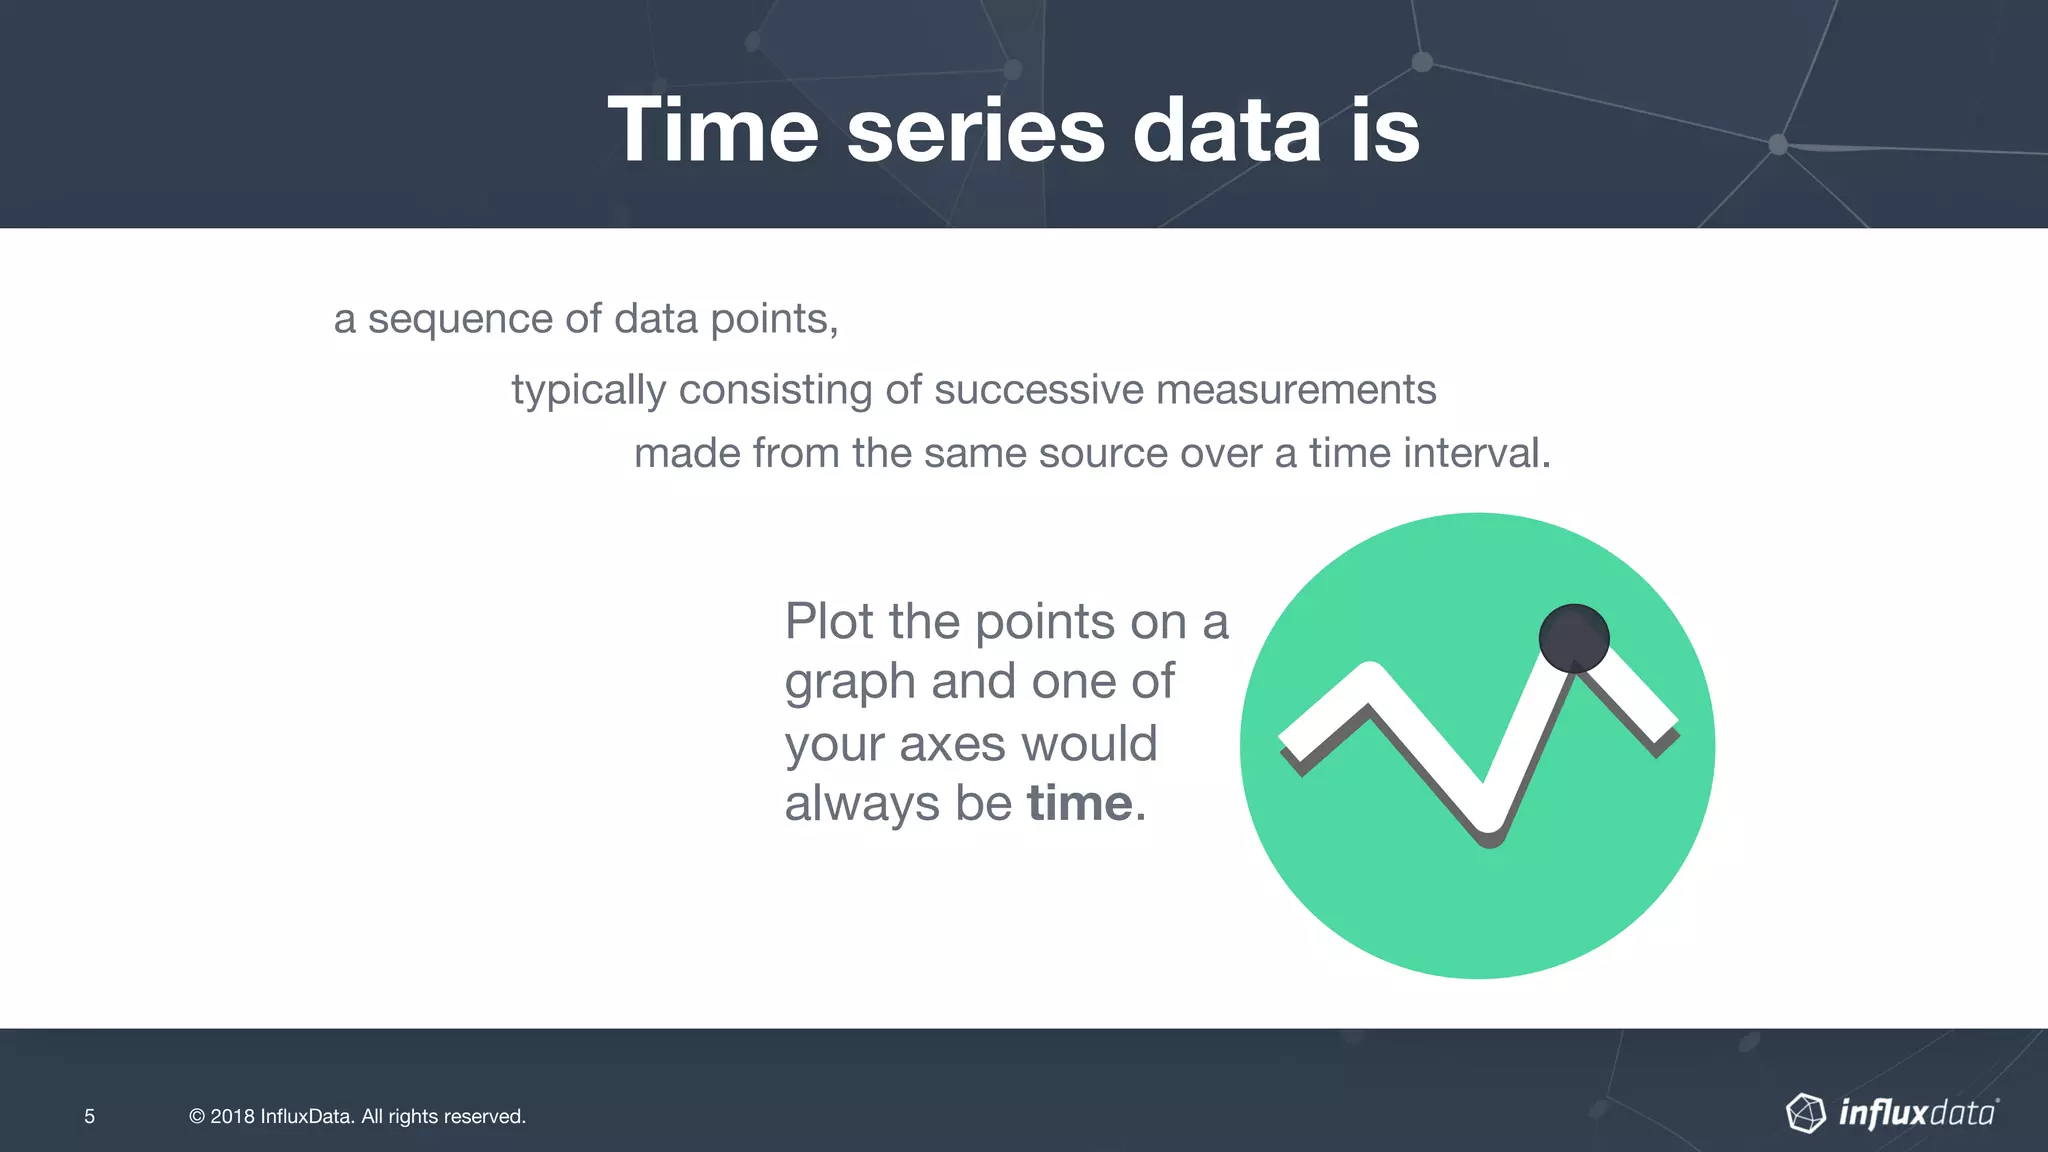
The document discusses the integration of InfluxDB and Grafana, emphasizing their utility in collecting, storing, and visualizing time series data for applications such as DevOps monitoring and real-time analytics. It outlines the basic setup, common configurations, and performance enhancement strategies for using these tools together. The document also provides links to resources for further learning and notes upcoming events related to Grafana and InfluxDB.