Download to read offline


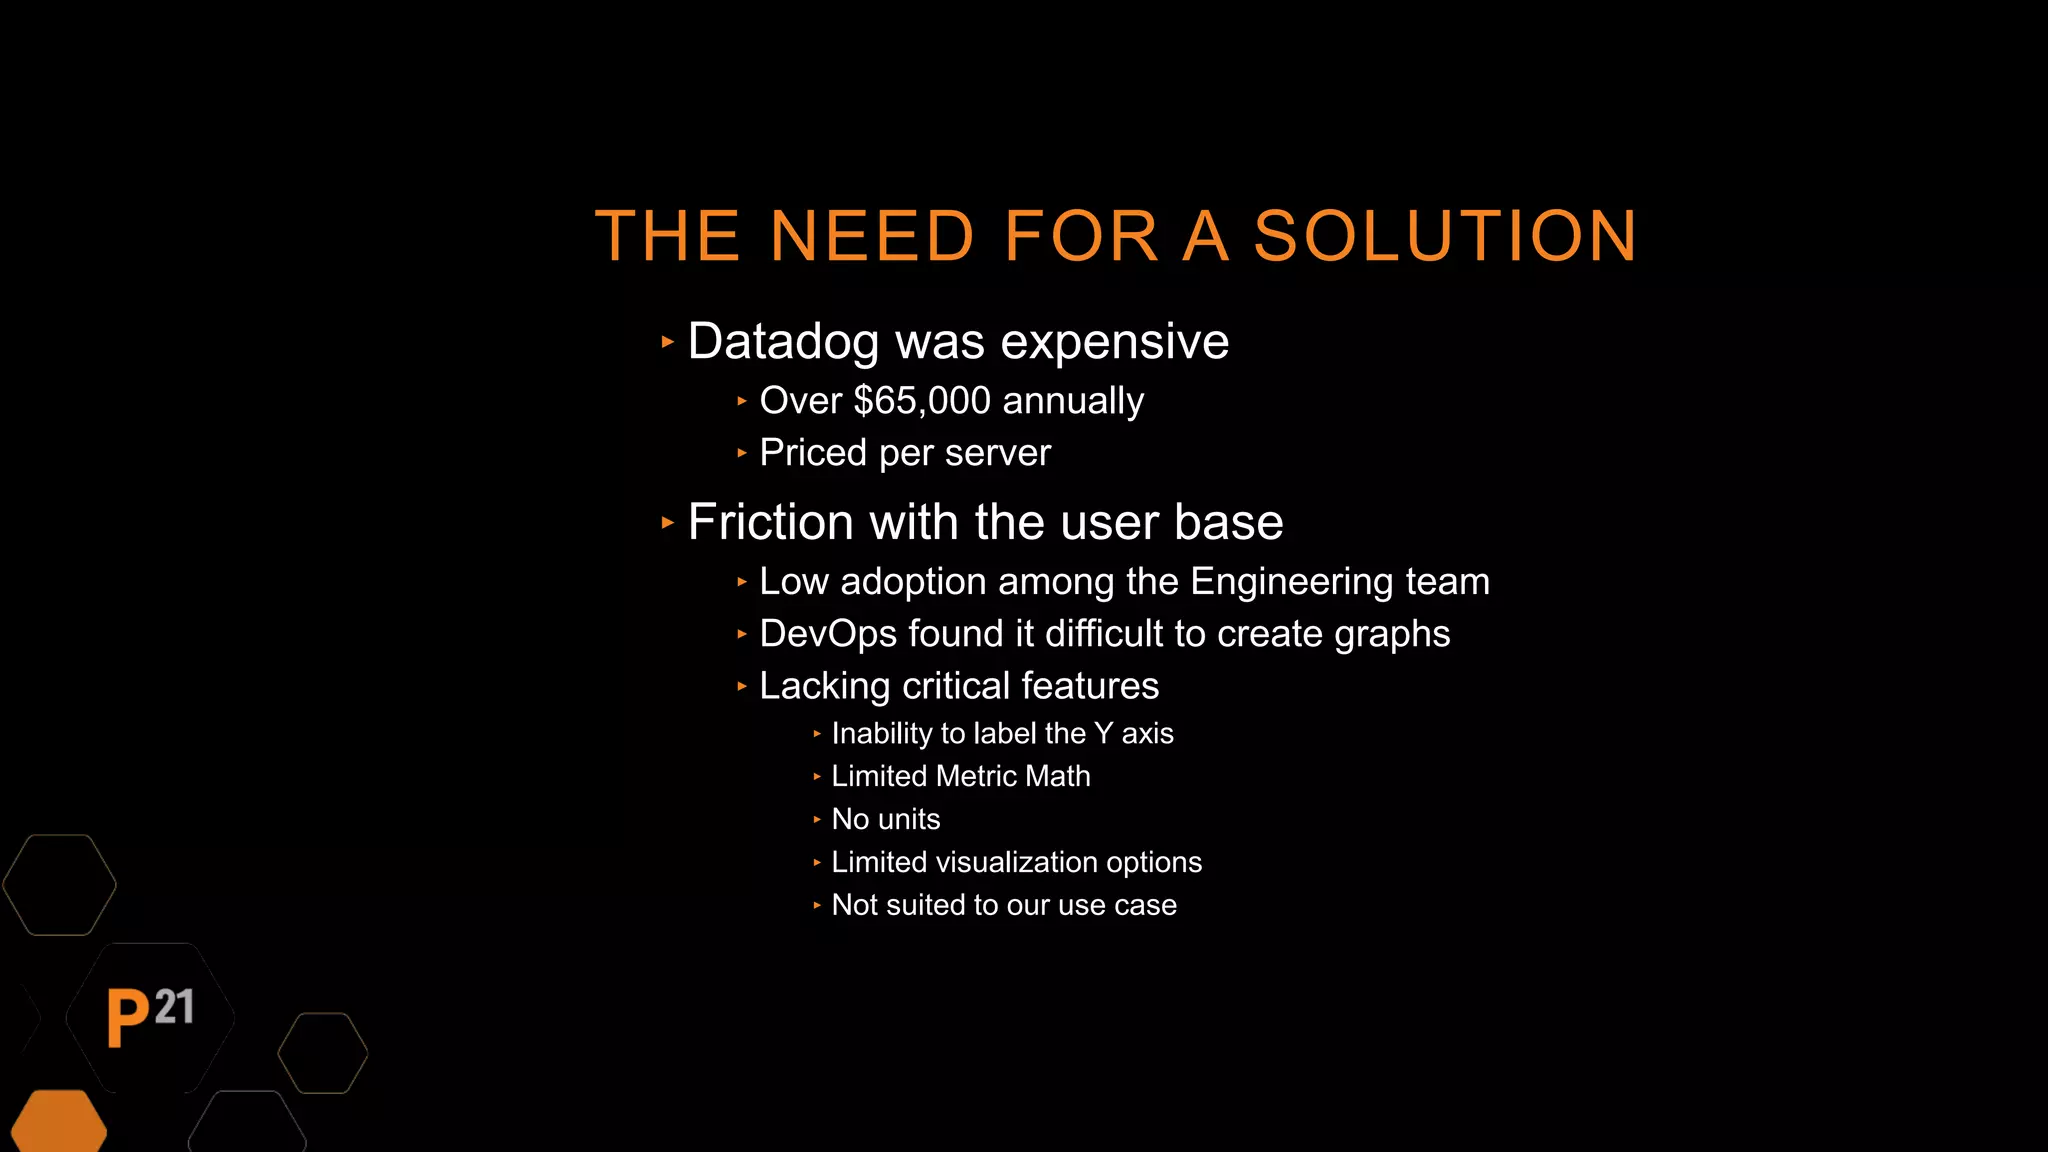
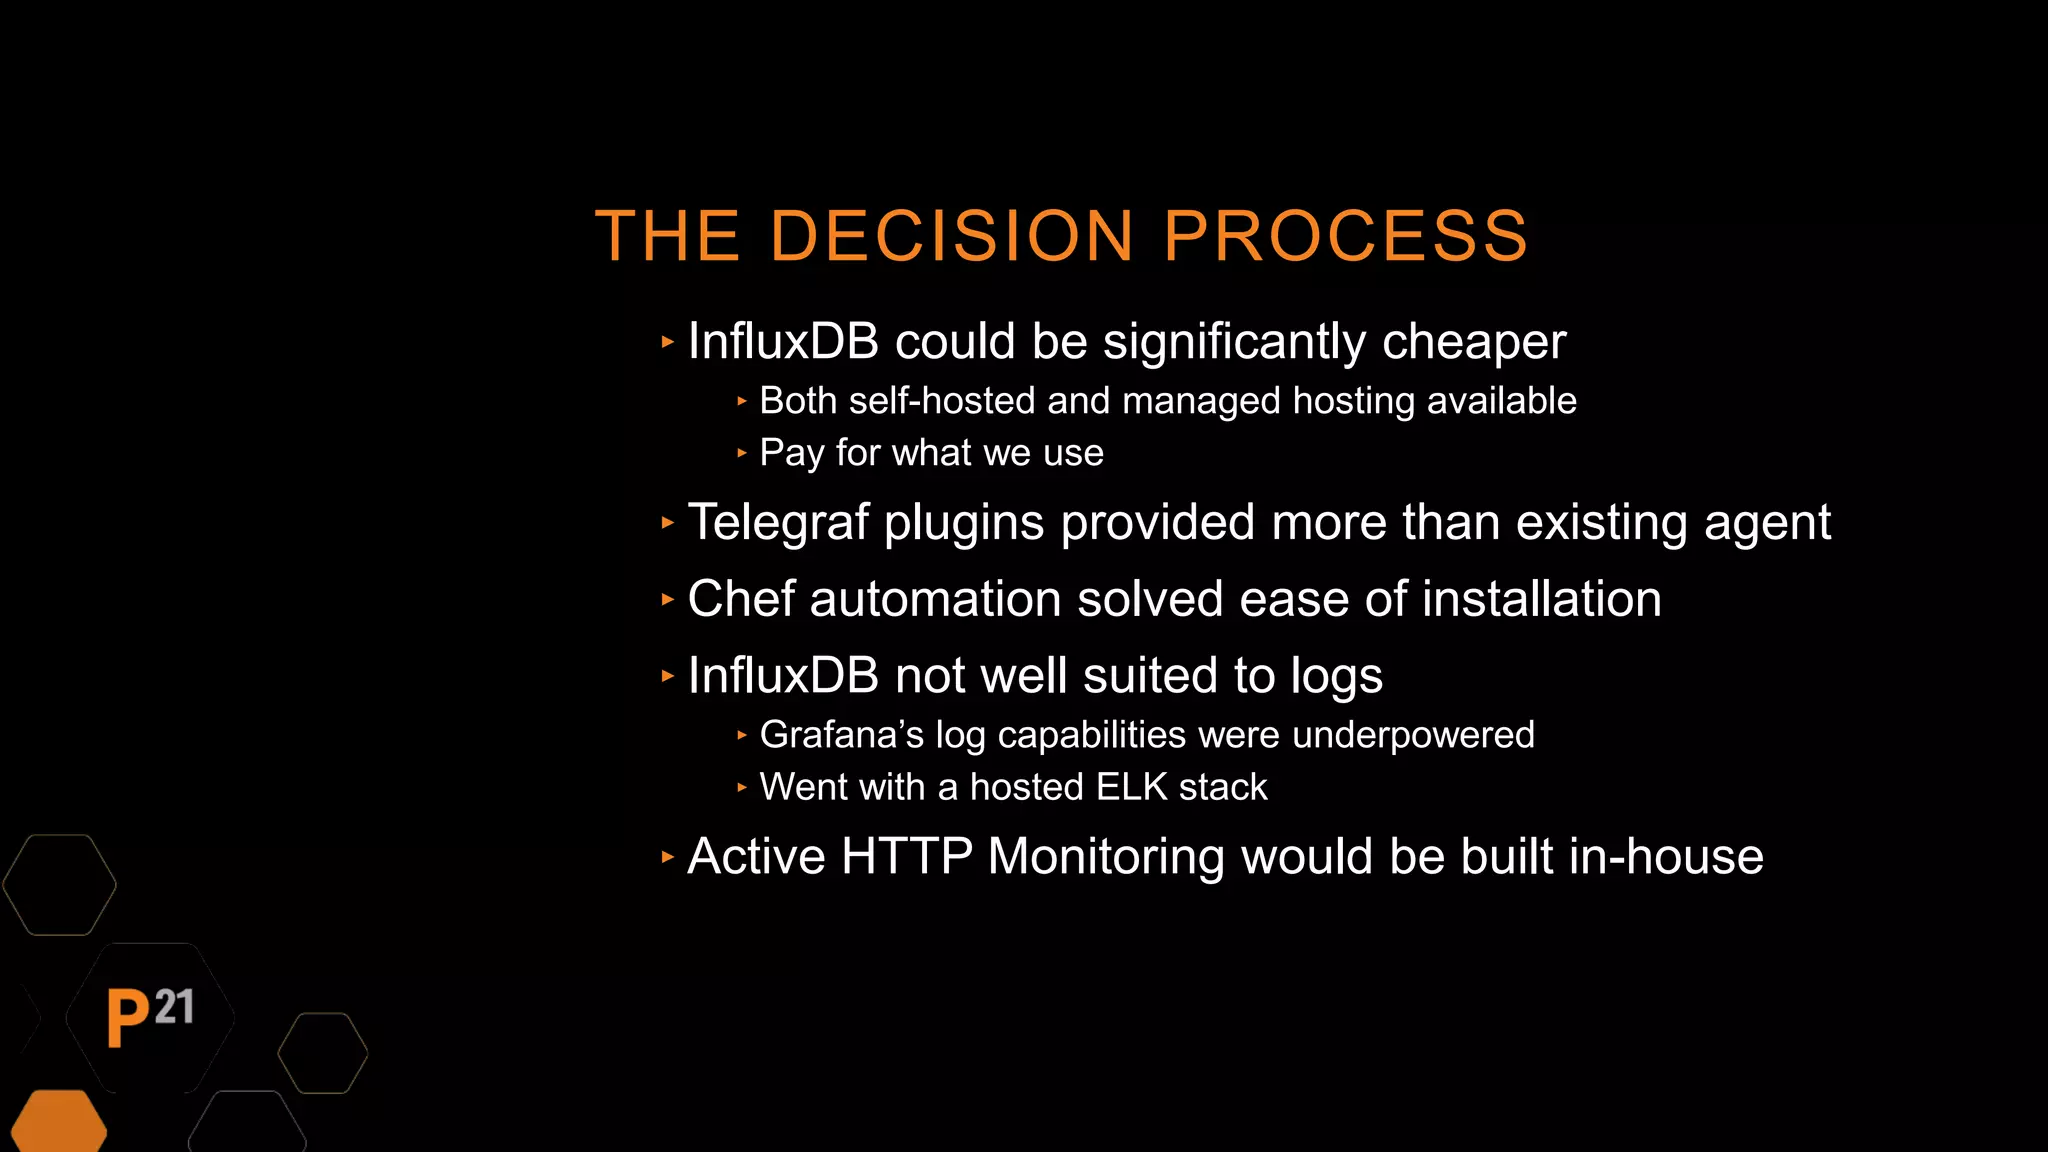


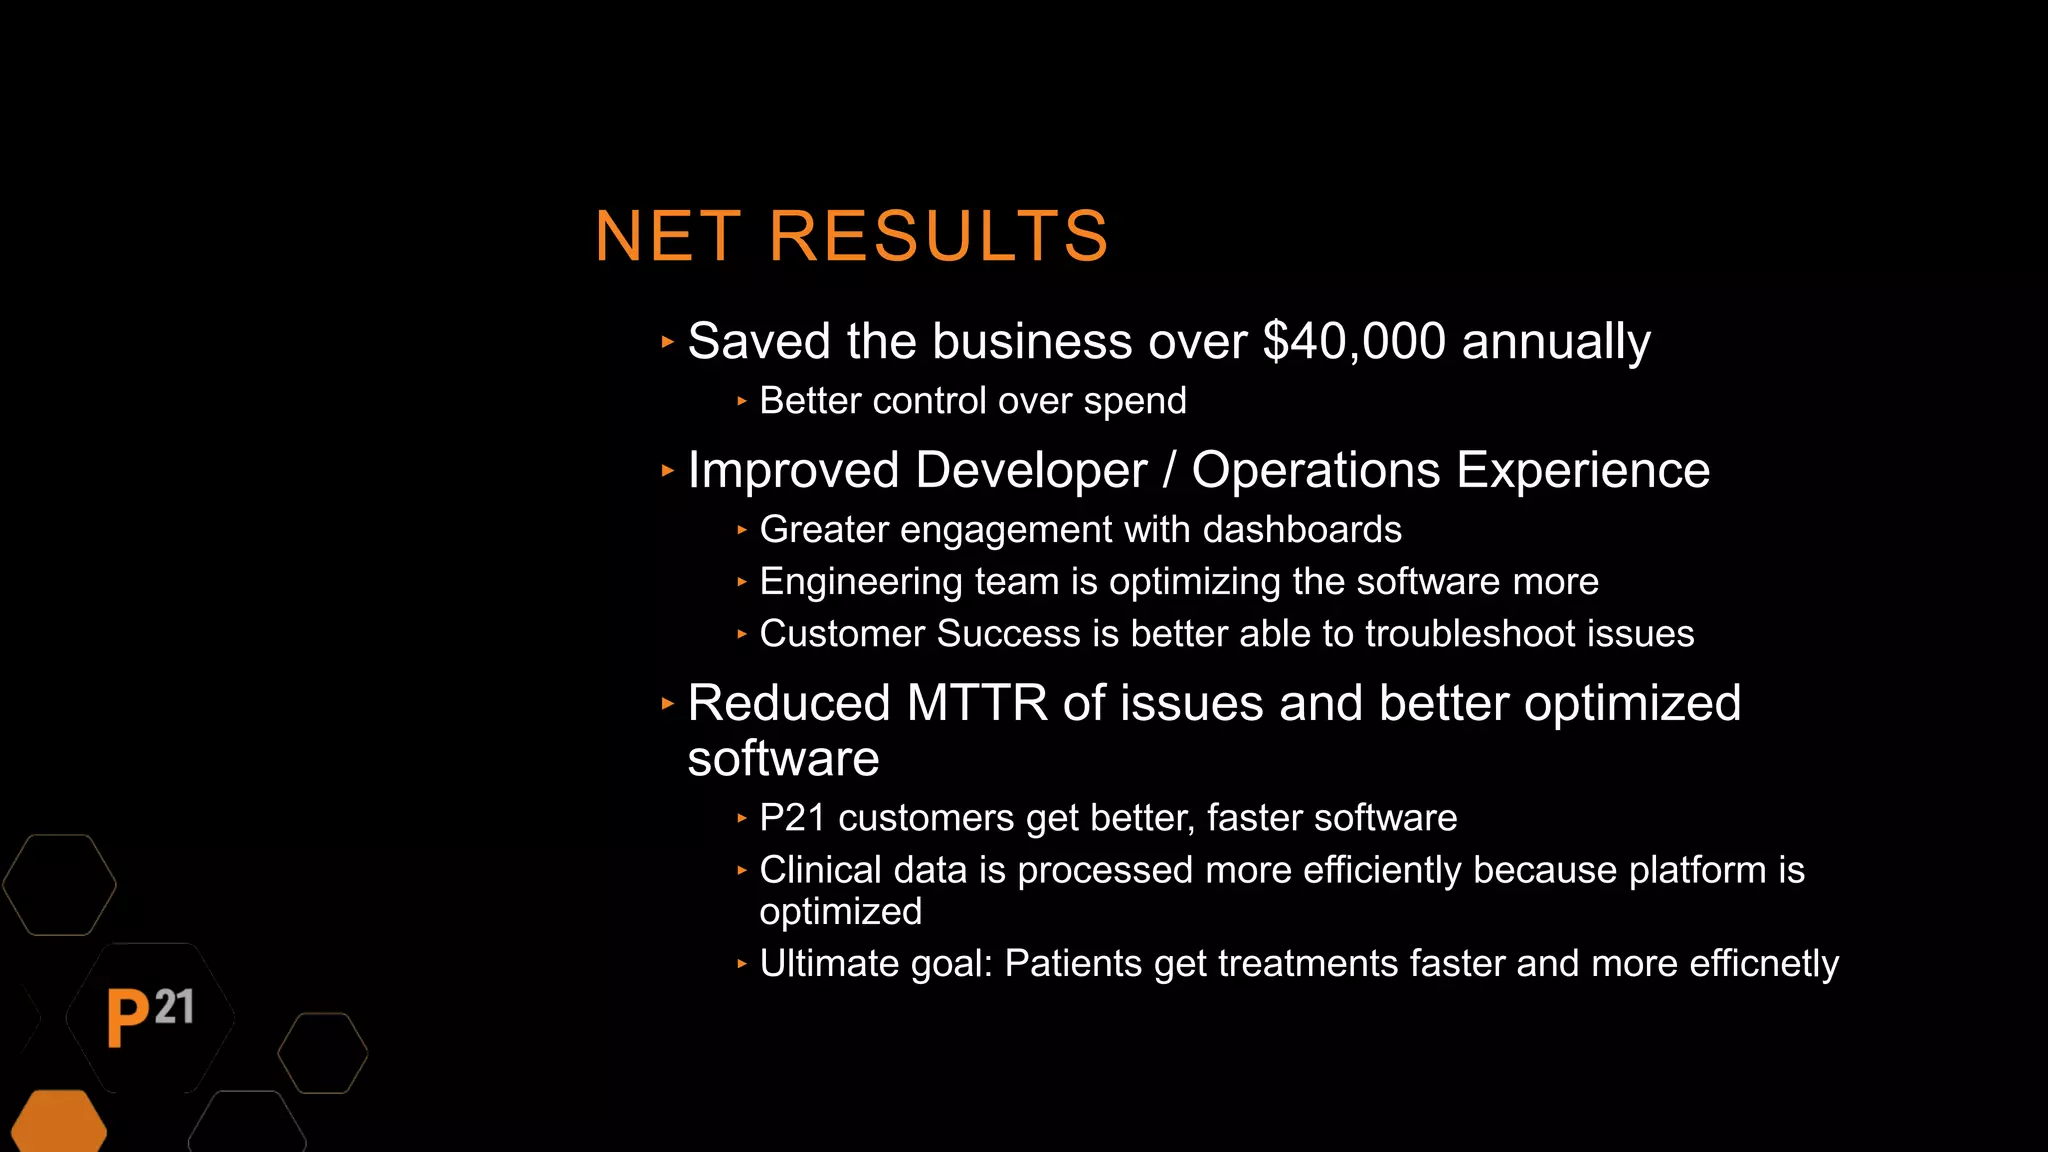


Pinnacle 21 transitioned from an expensive Datadog monitoring solution to InfluxDB and Grafana, reducing costs by over $40,000 annually while enhancing functionality. The team faced challenges like low adoption and limited features with the previous system, prompting the switch to a more customizable and efficient solution. This change led to improved monitoring capabilities, better engagement with dashboards, and faster software optimization, ultimately benefiting clinical data processing for patients.