The document provides information about algorithms and flowcharting. It defines an algorithm as a series of well-defined steps to solve a problem and lists the key parts of an algorithm as the input, output, and process. It also defines a flowchart as a diagram that represents an algorithm or process visually using standard symbols. The document then provides examples of flowcharts for various problems that require inputs, calculations, and output displays. It demonstrates the basic flowchart symbols and layout. Finally, it includes some practice problems for creating flowcharts.
Introduction of TUNASAN NATIONAL HIGH SCHOOL and Rowell L. Marquina focusing on Lesson 1: Java Programming.
Definition of algorithms, examples, and steps to create an algorithm: defining output (Slide 3), identifying input (Slide 4), and determining process (Slide 5).
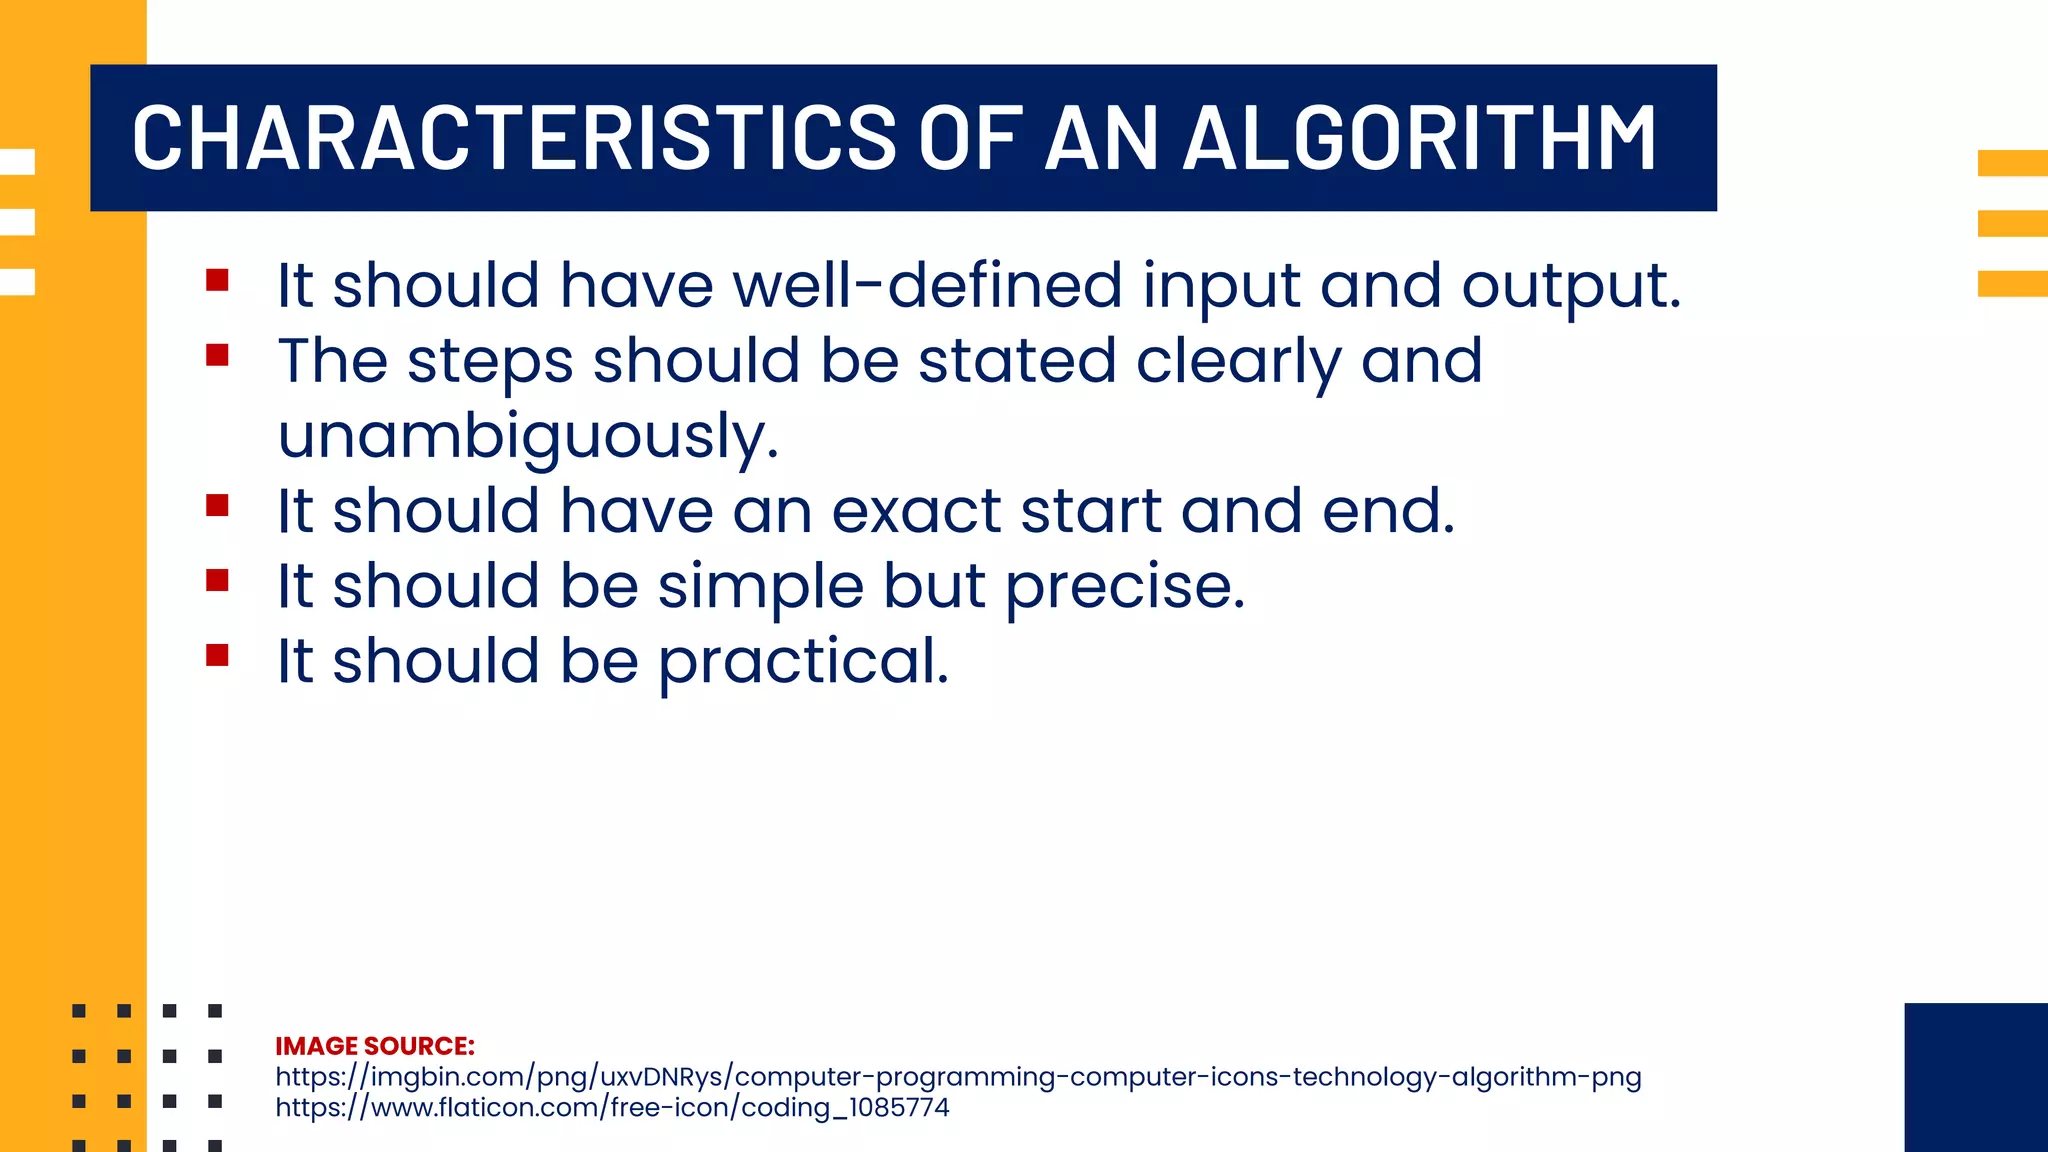
Key characteristics of algorithms outlined: well-defined input/output, clarity, precision, and practicality.
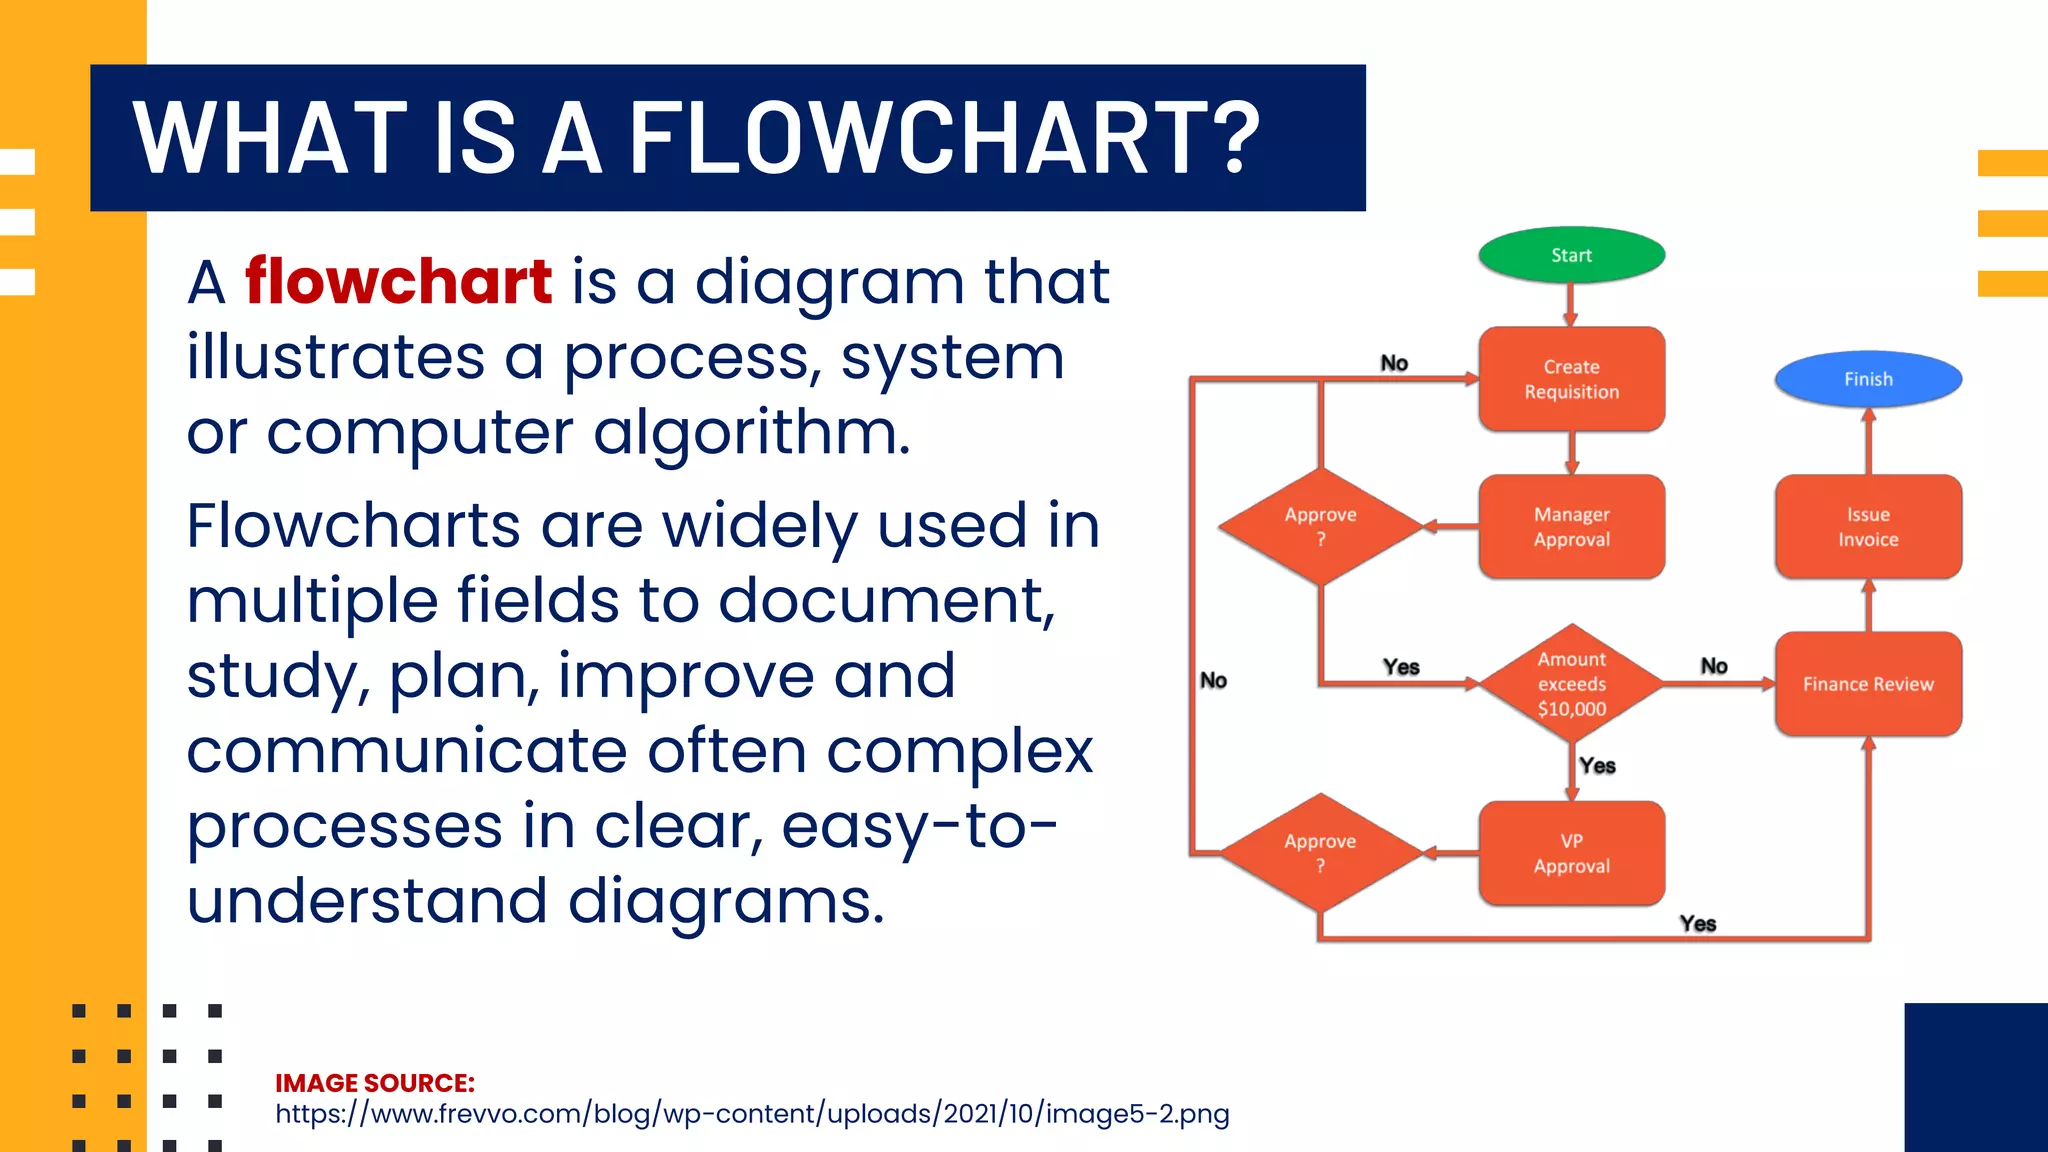
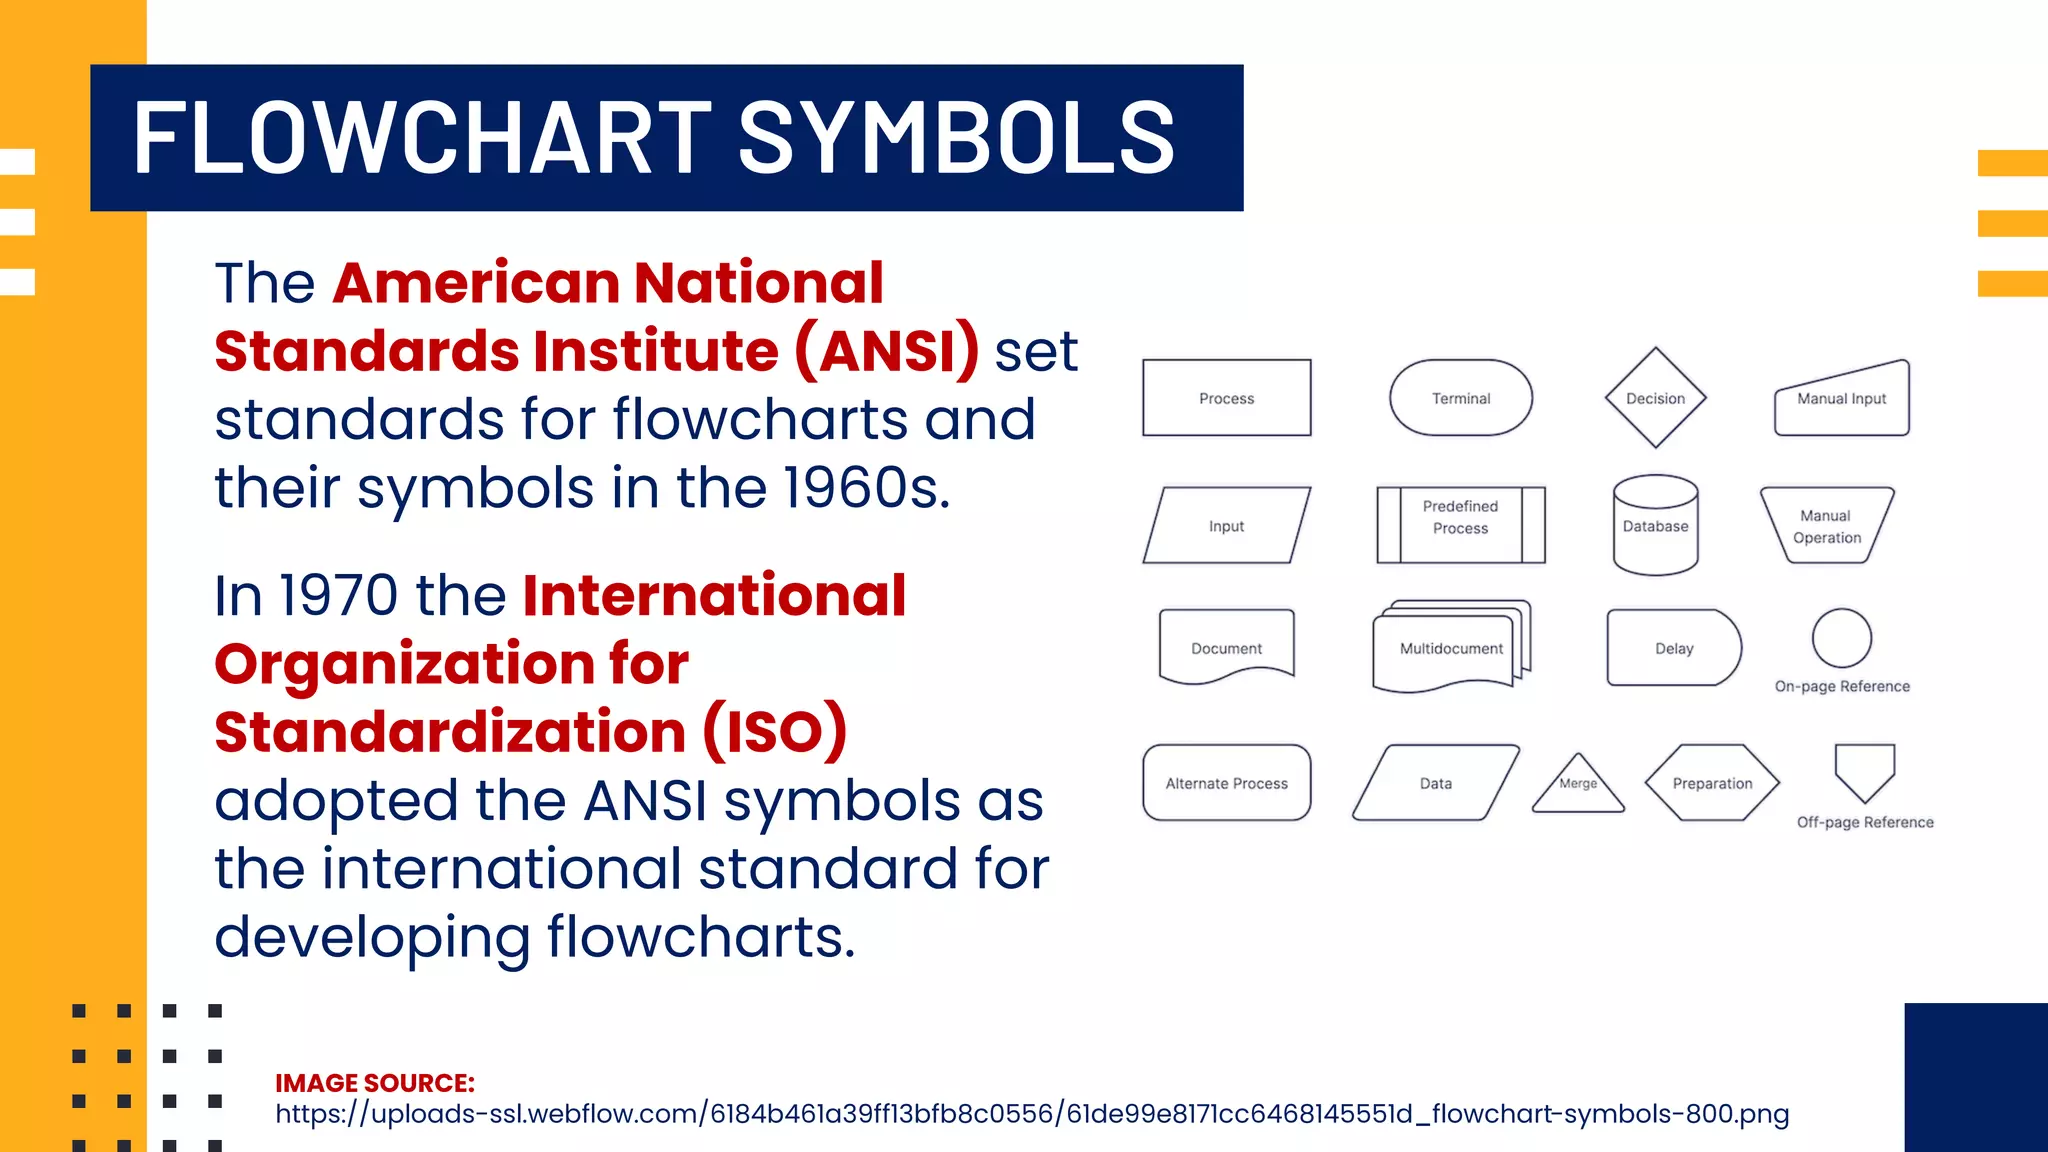
Definition of flowcharts, their usage in illustrating processes and systems, and the establishment of ANSI standards for flowchart symbols.
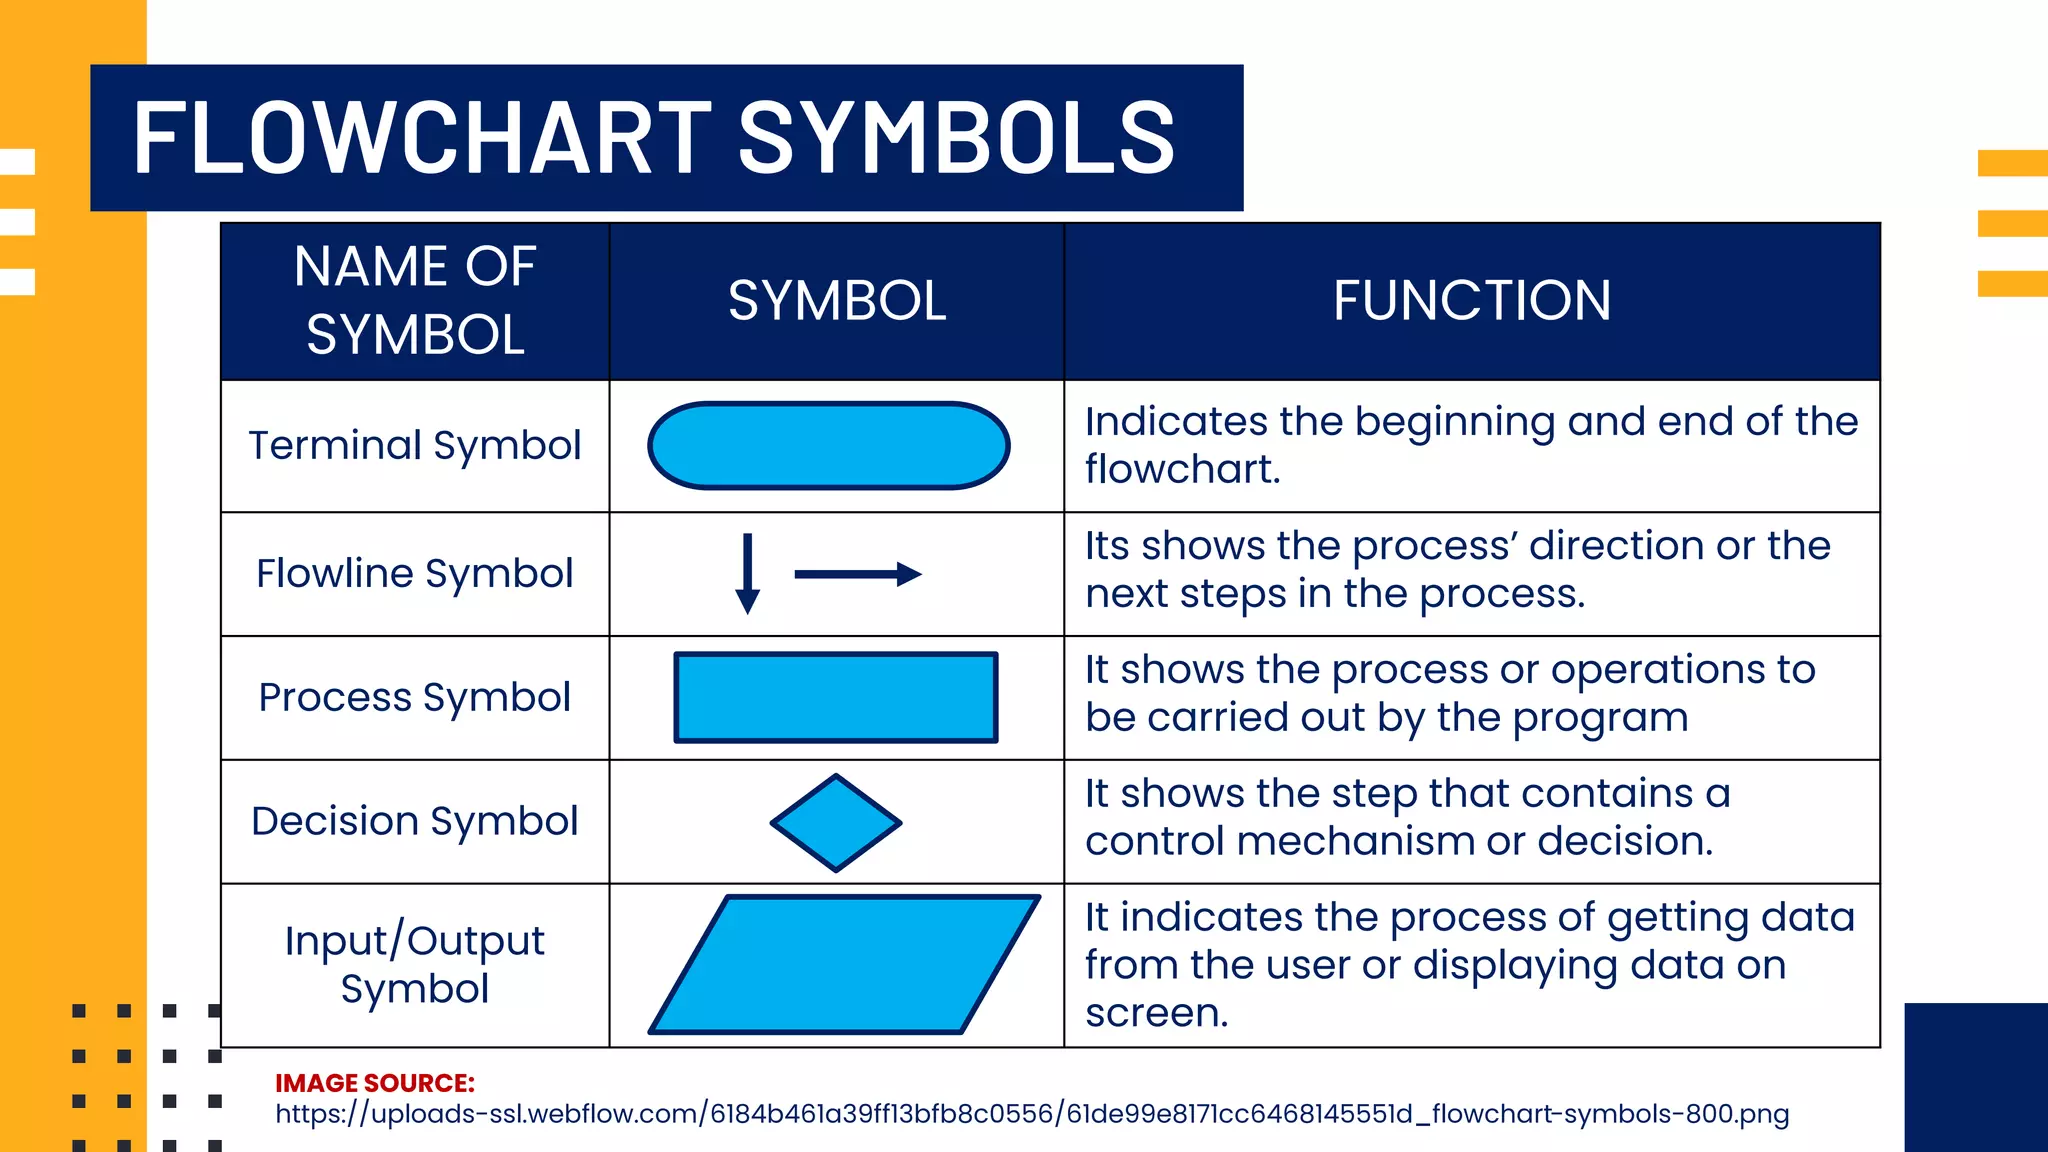
Overview of flowchart symbols: terminal, flowline, process, decision, and input/output symbol functions.
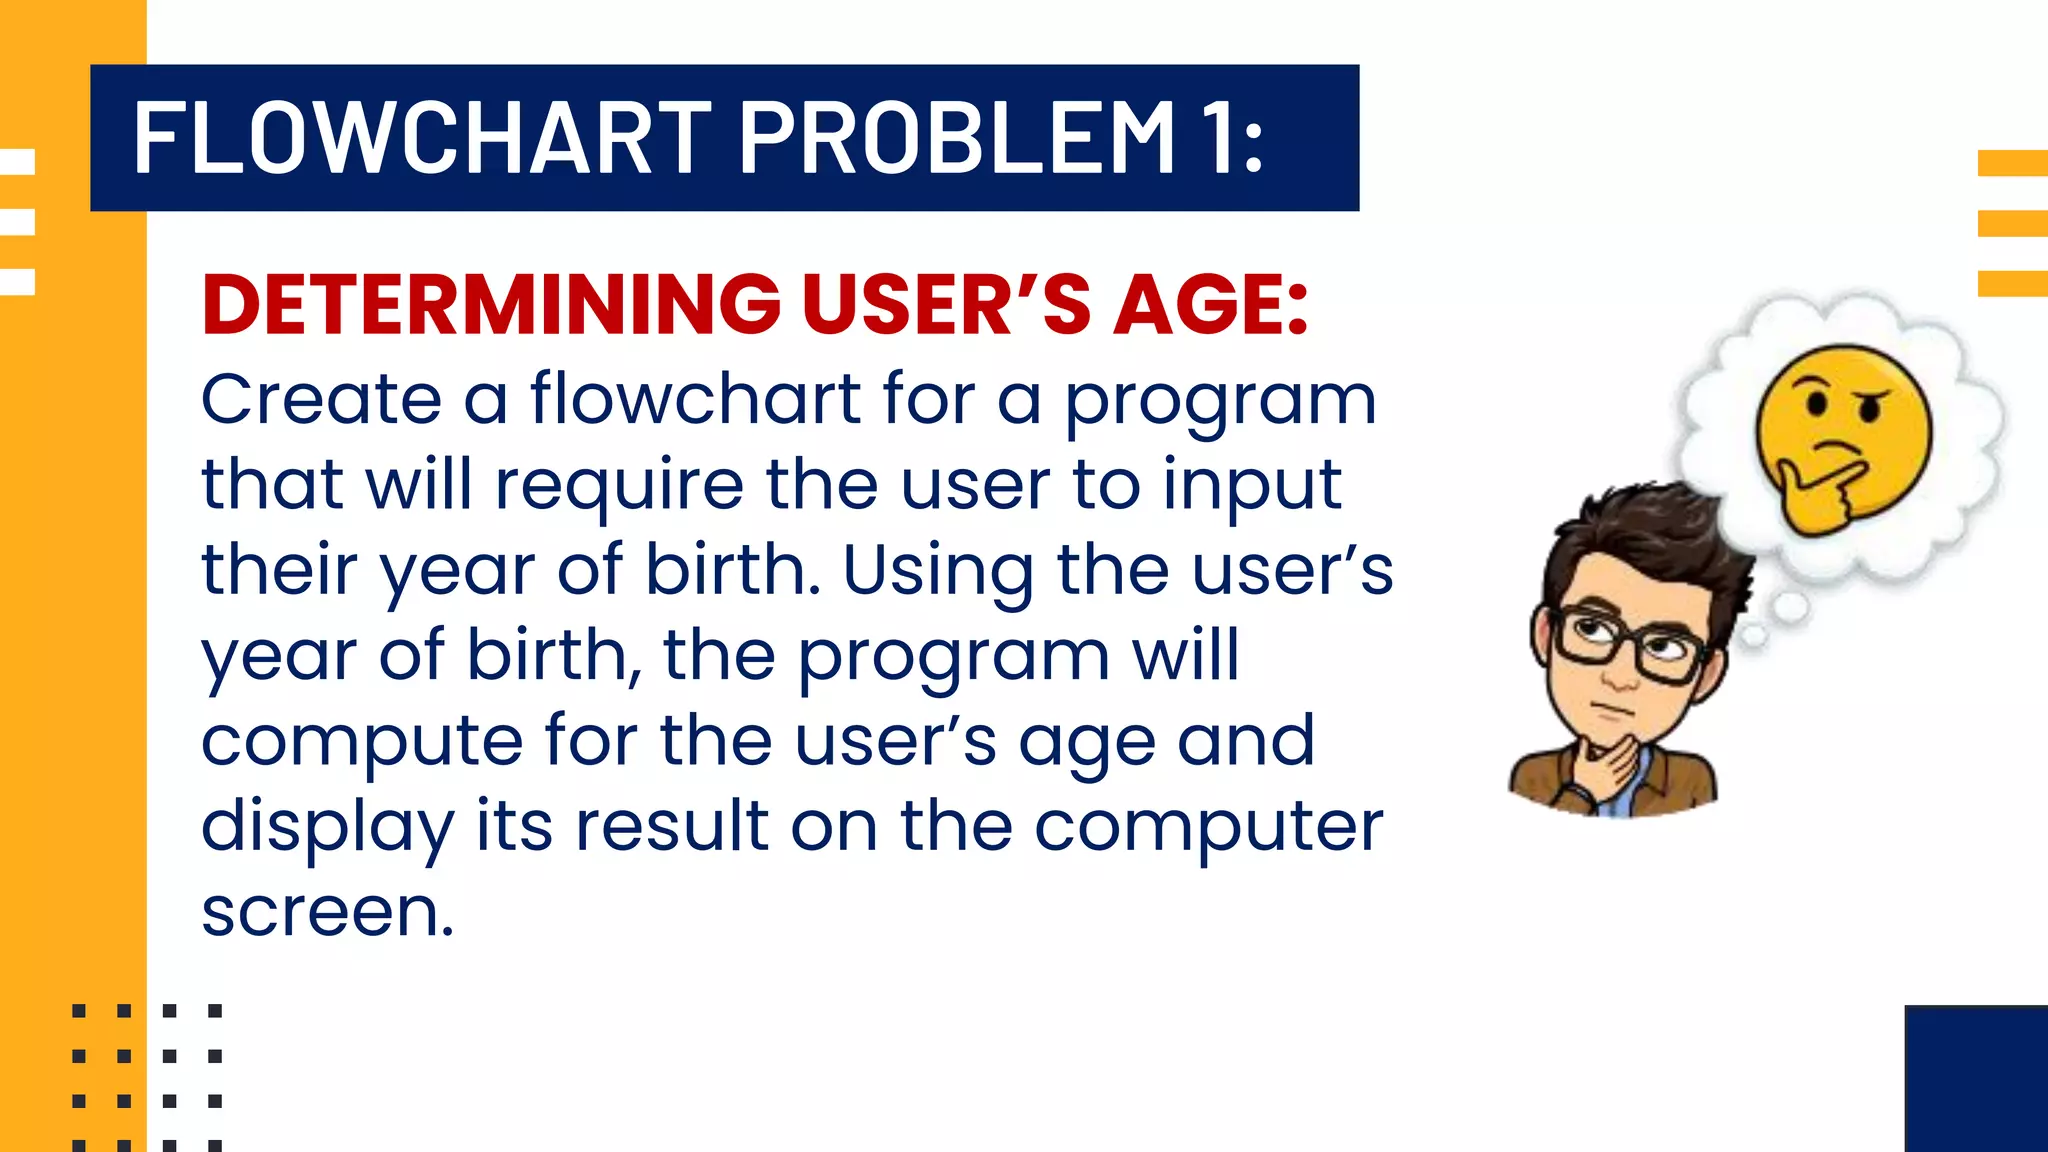
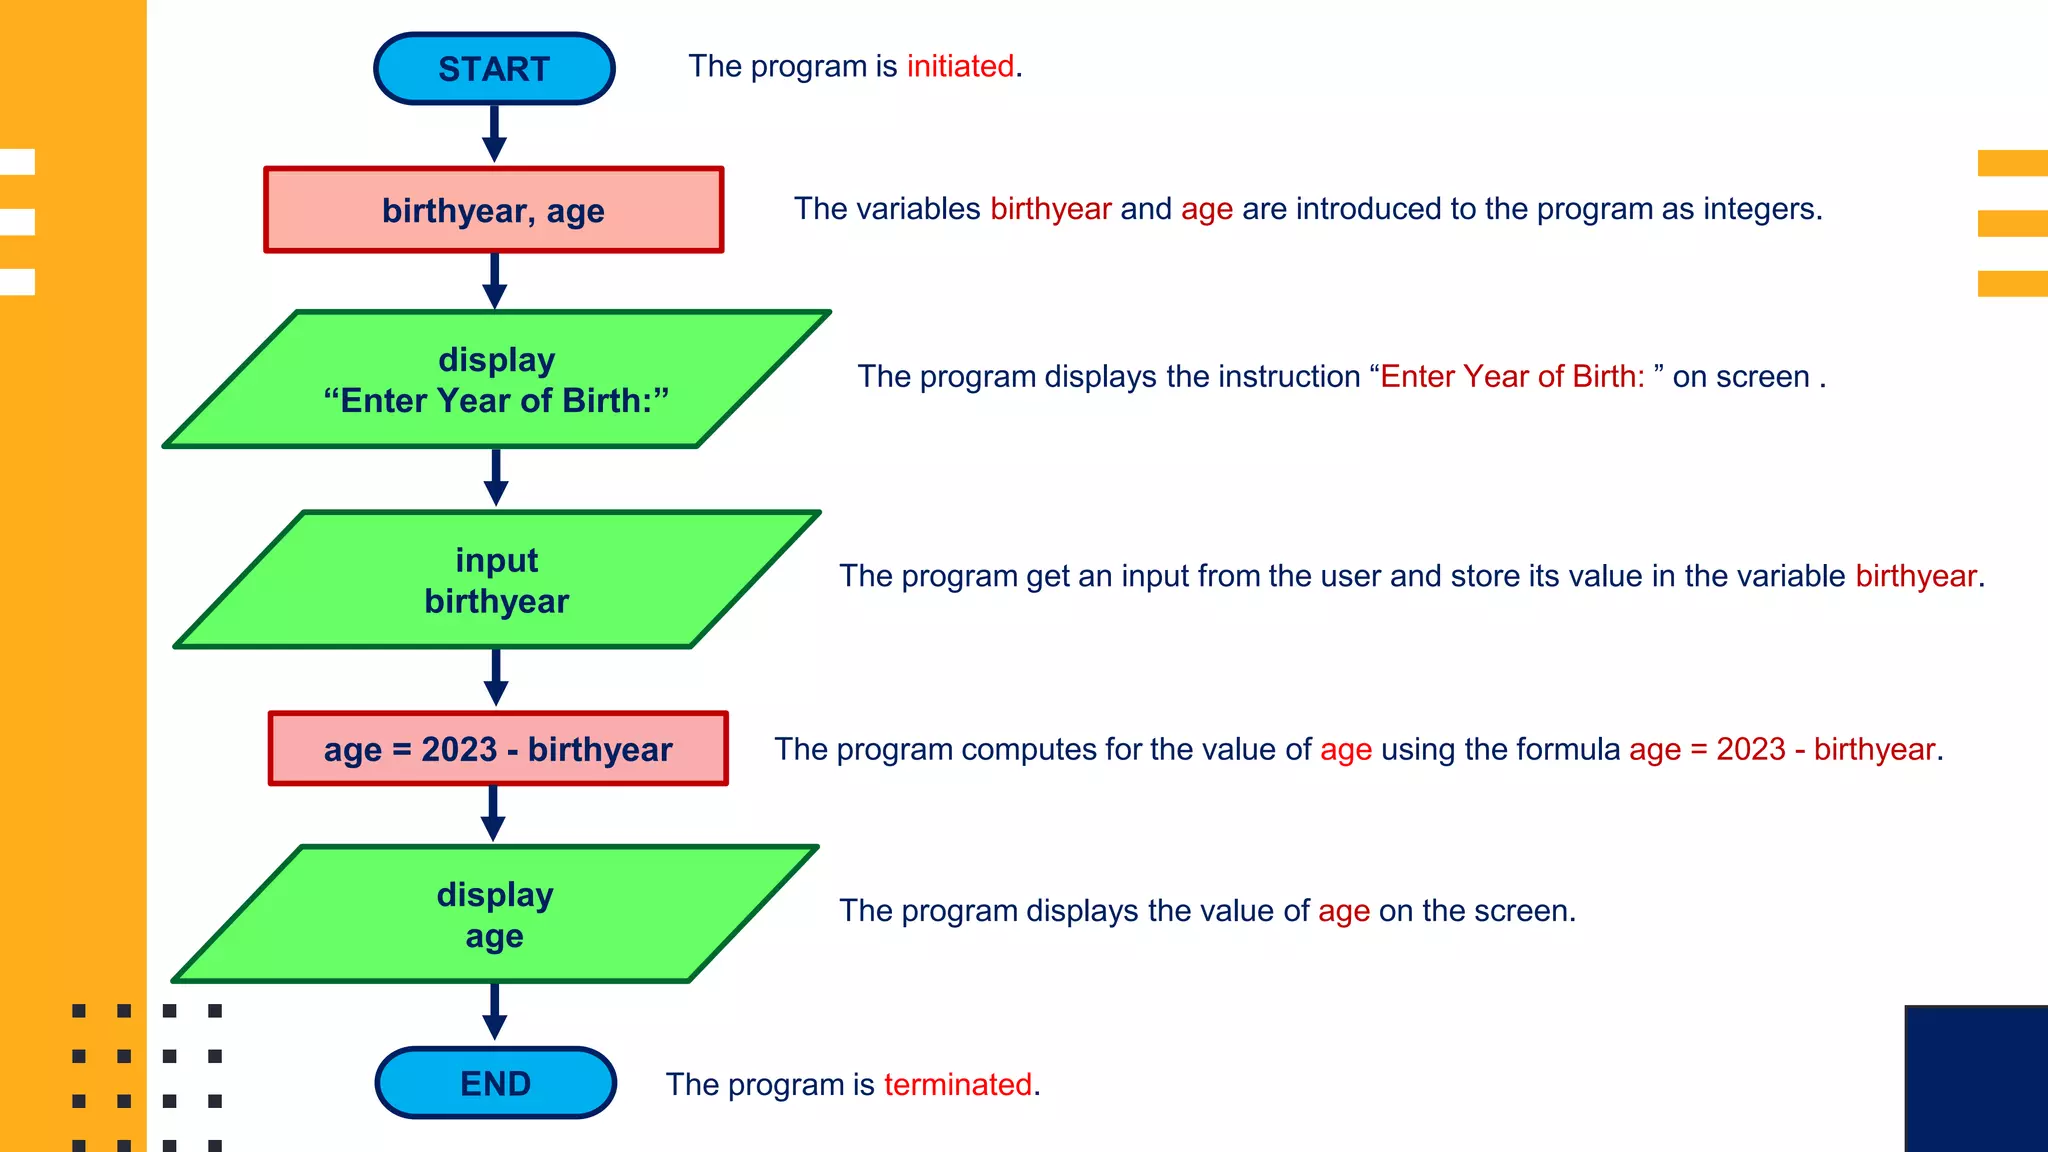
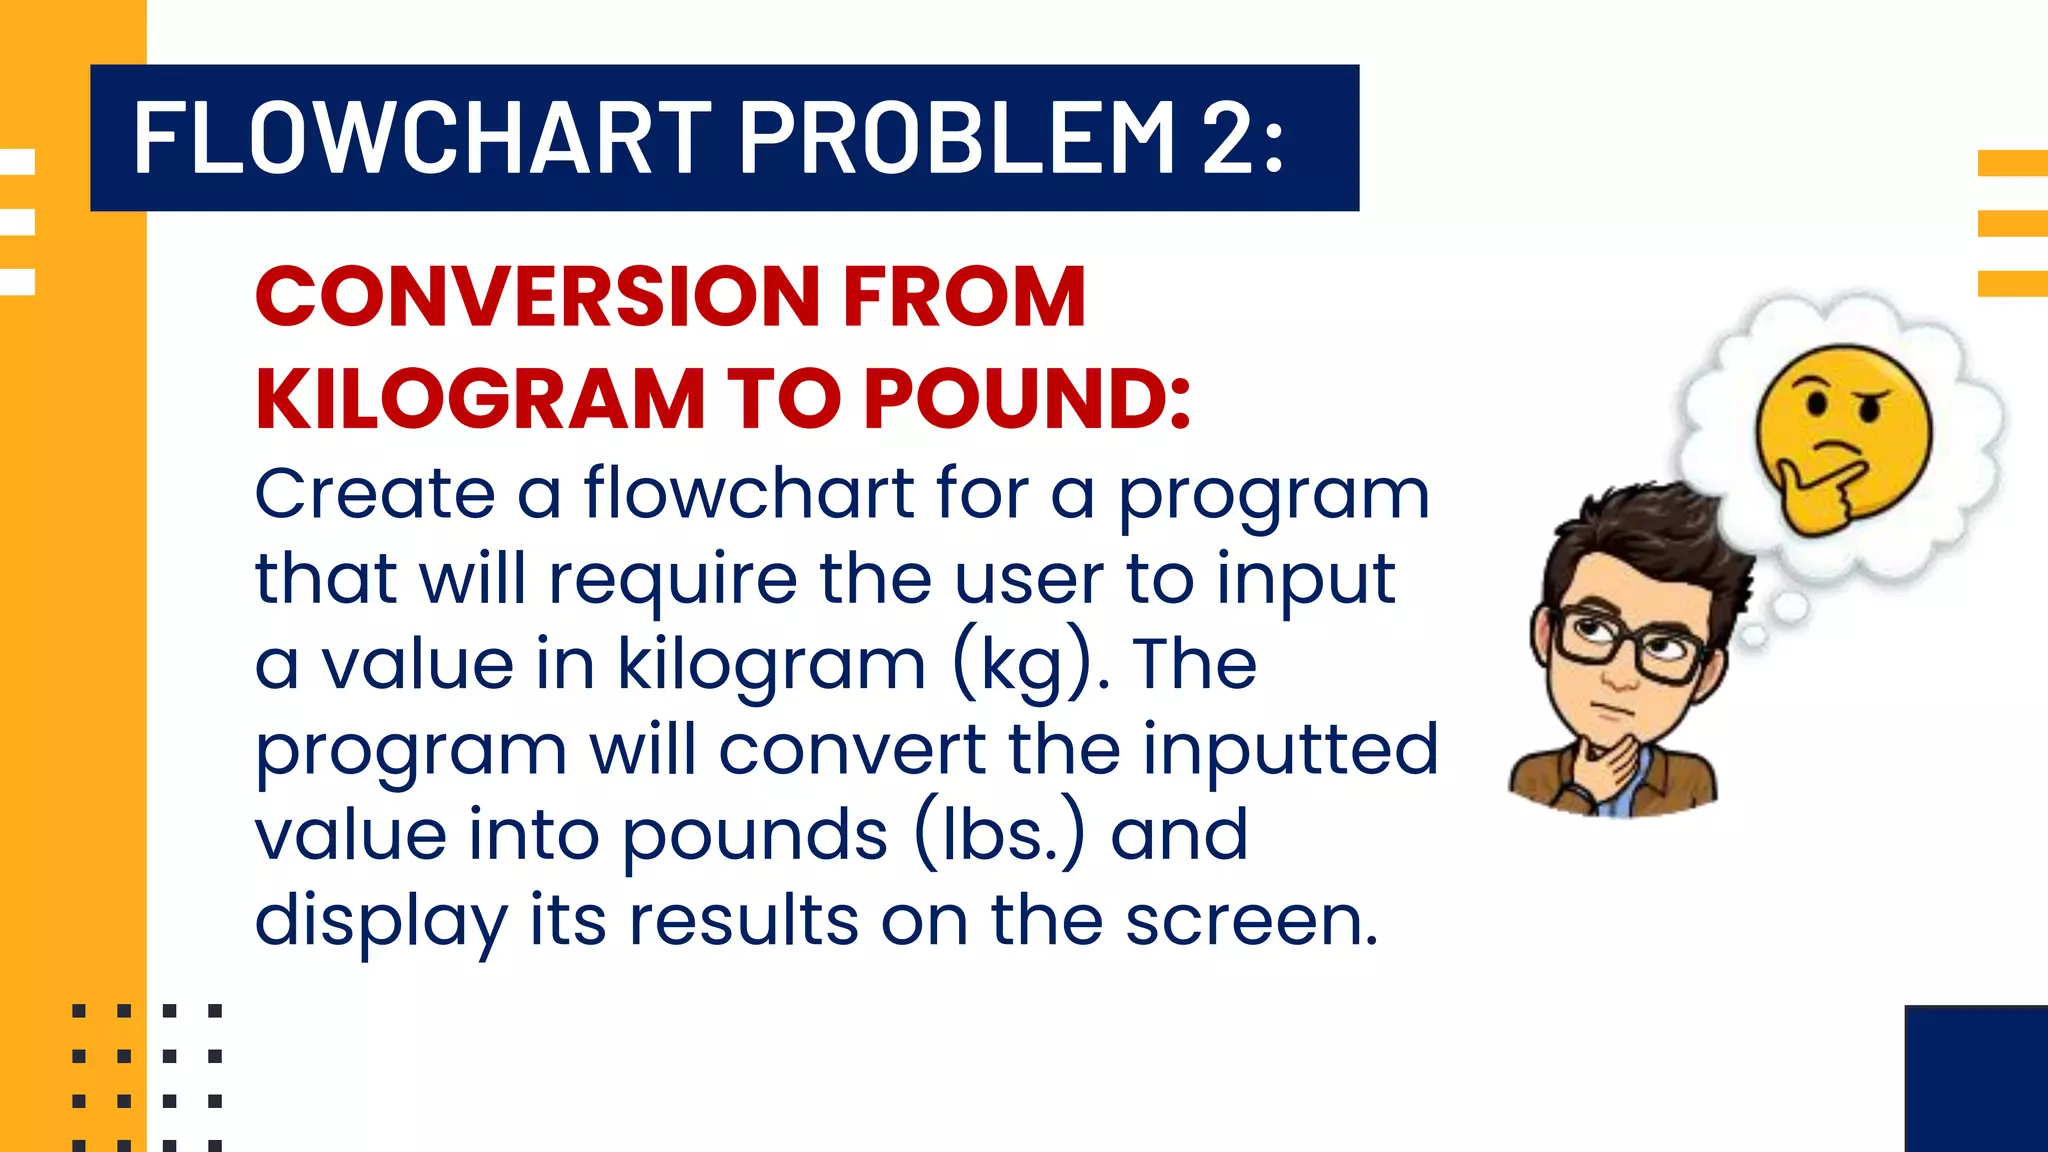
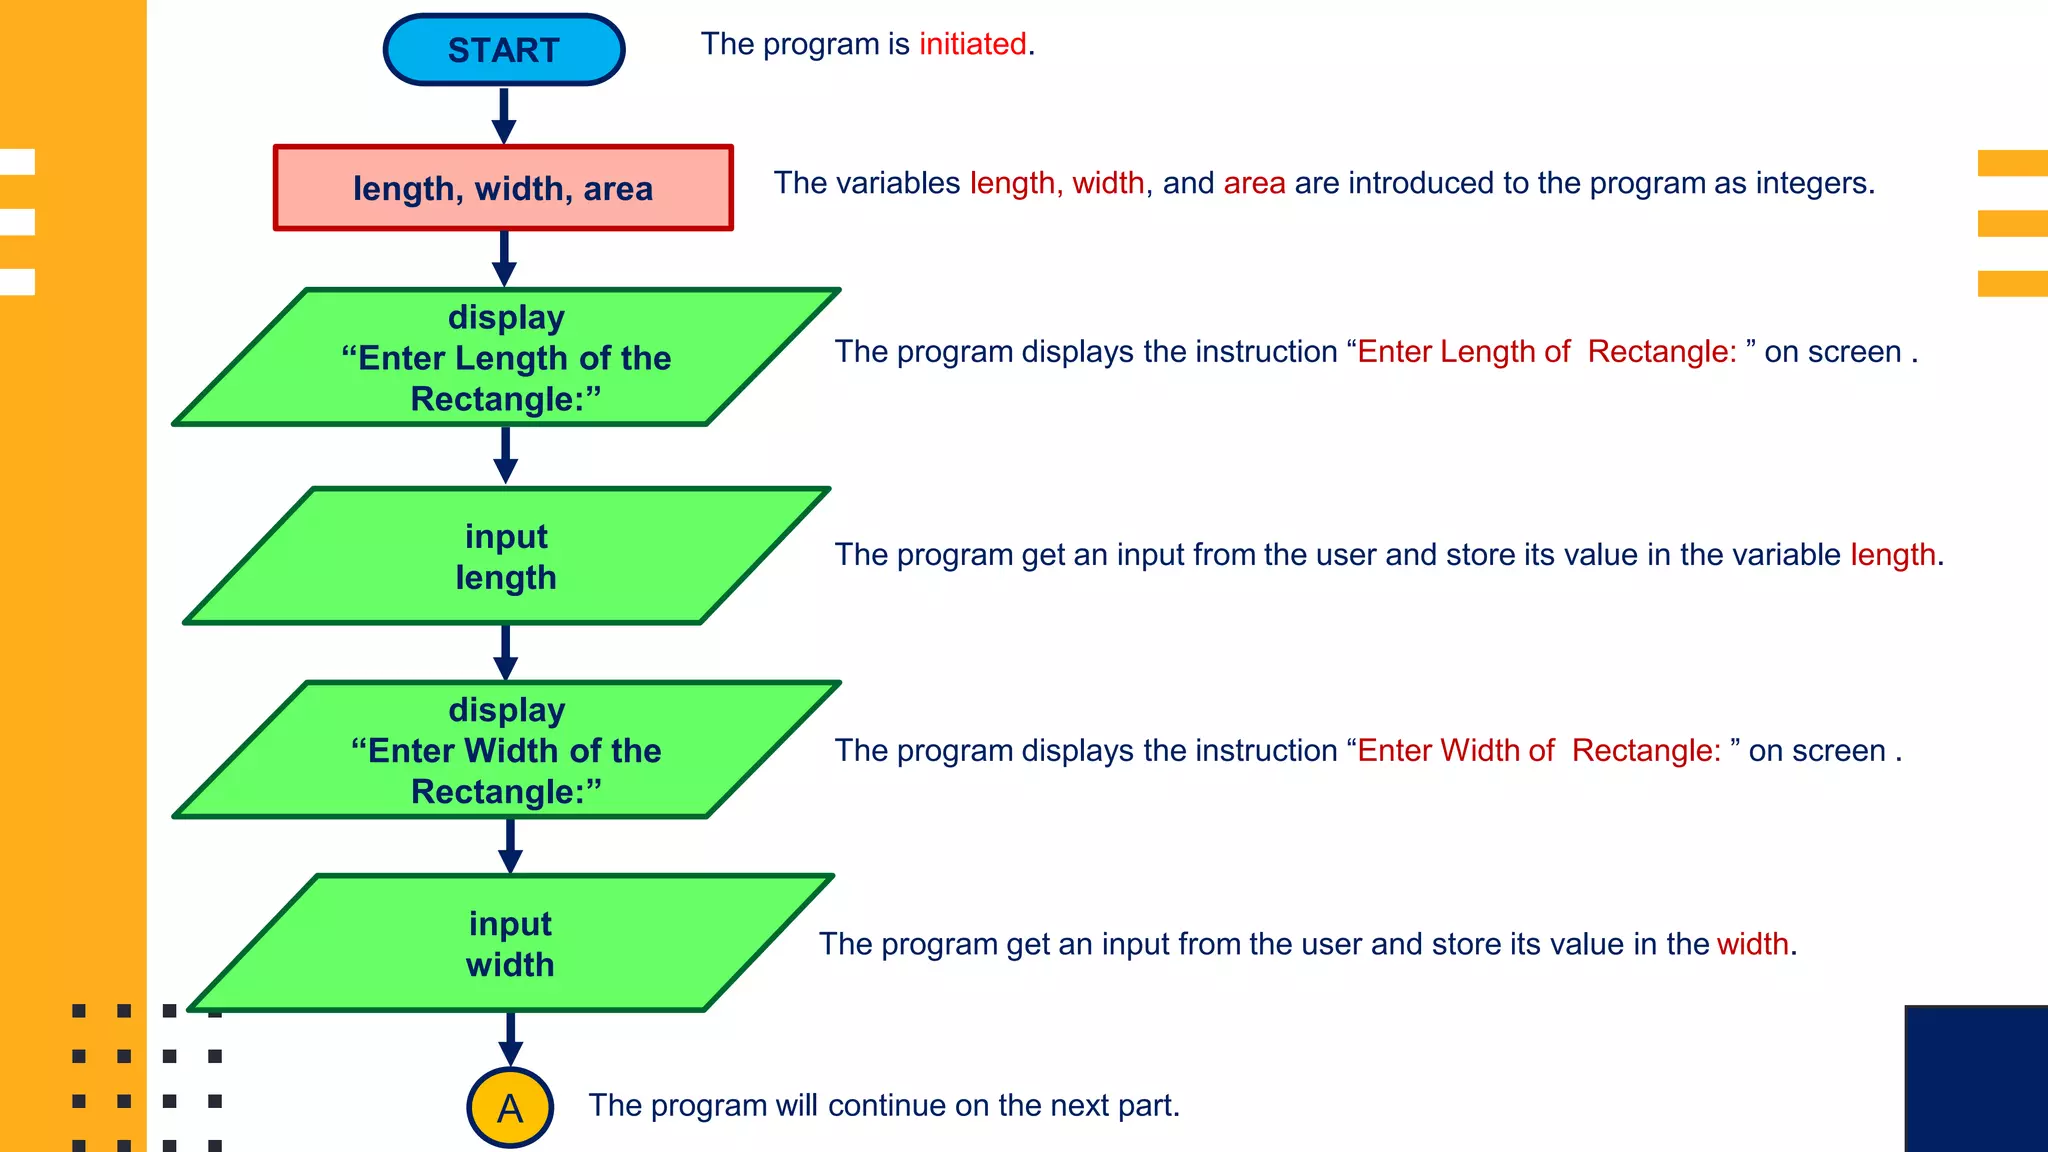
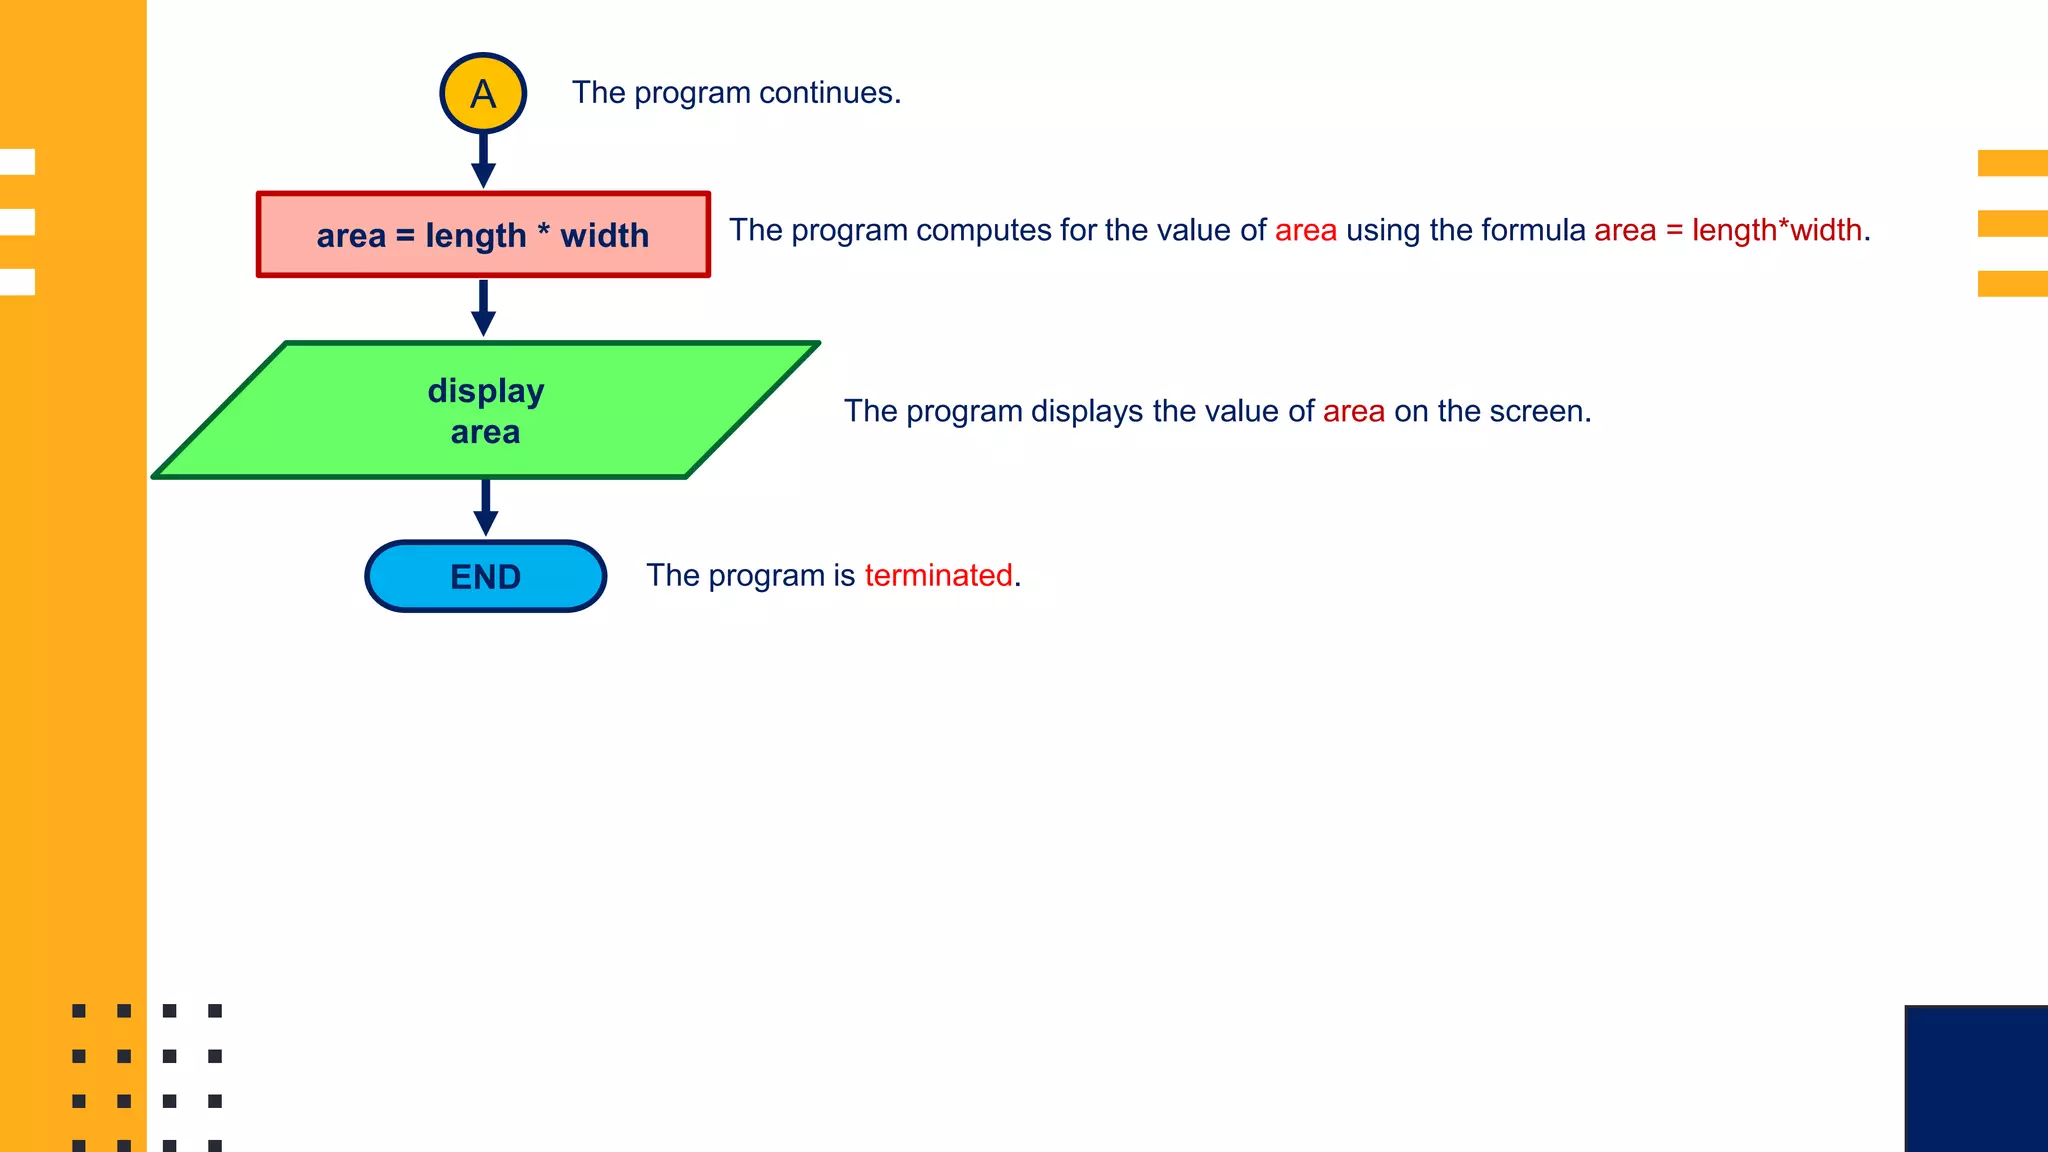
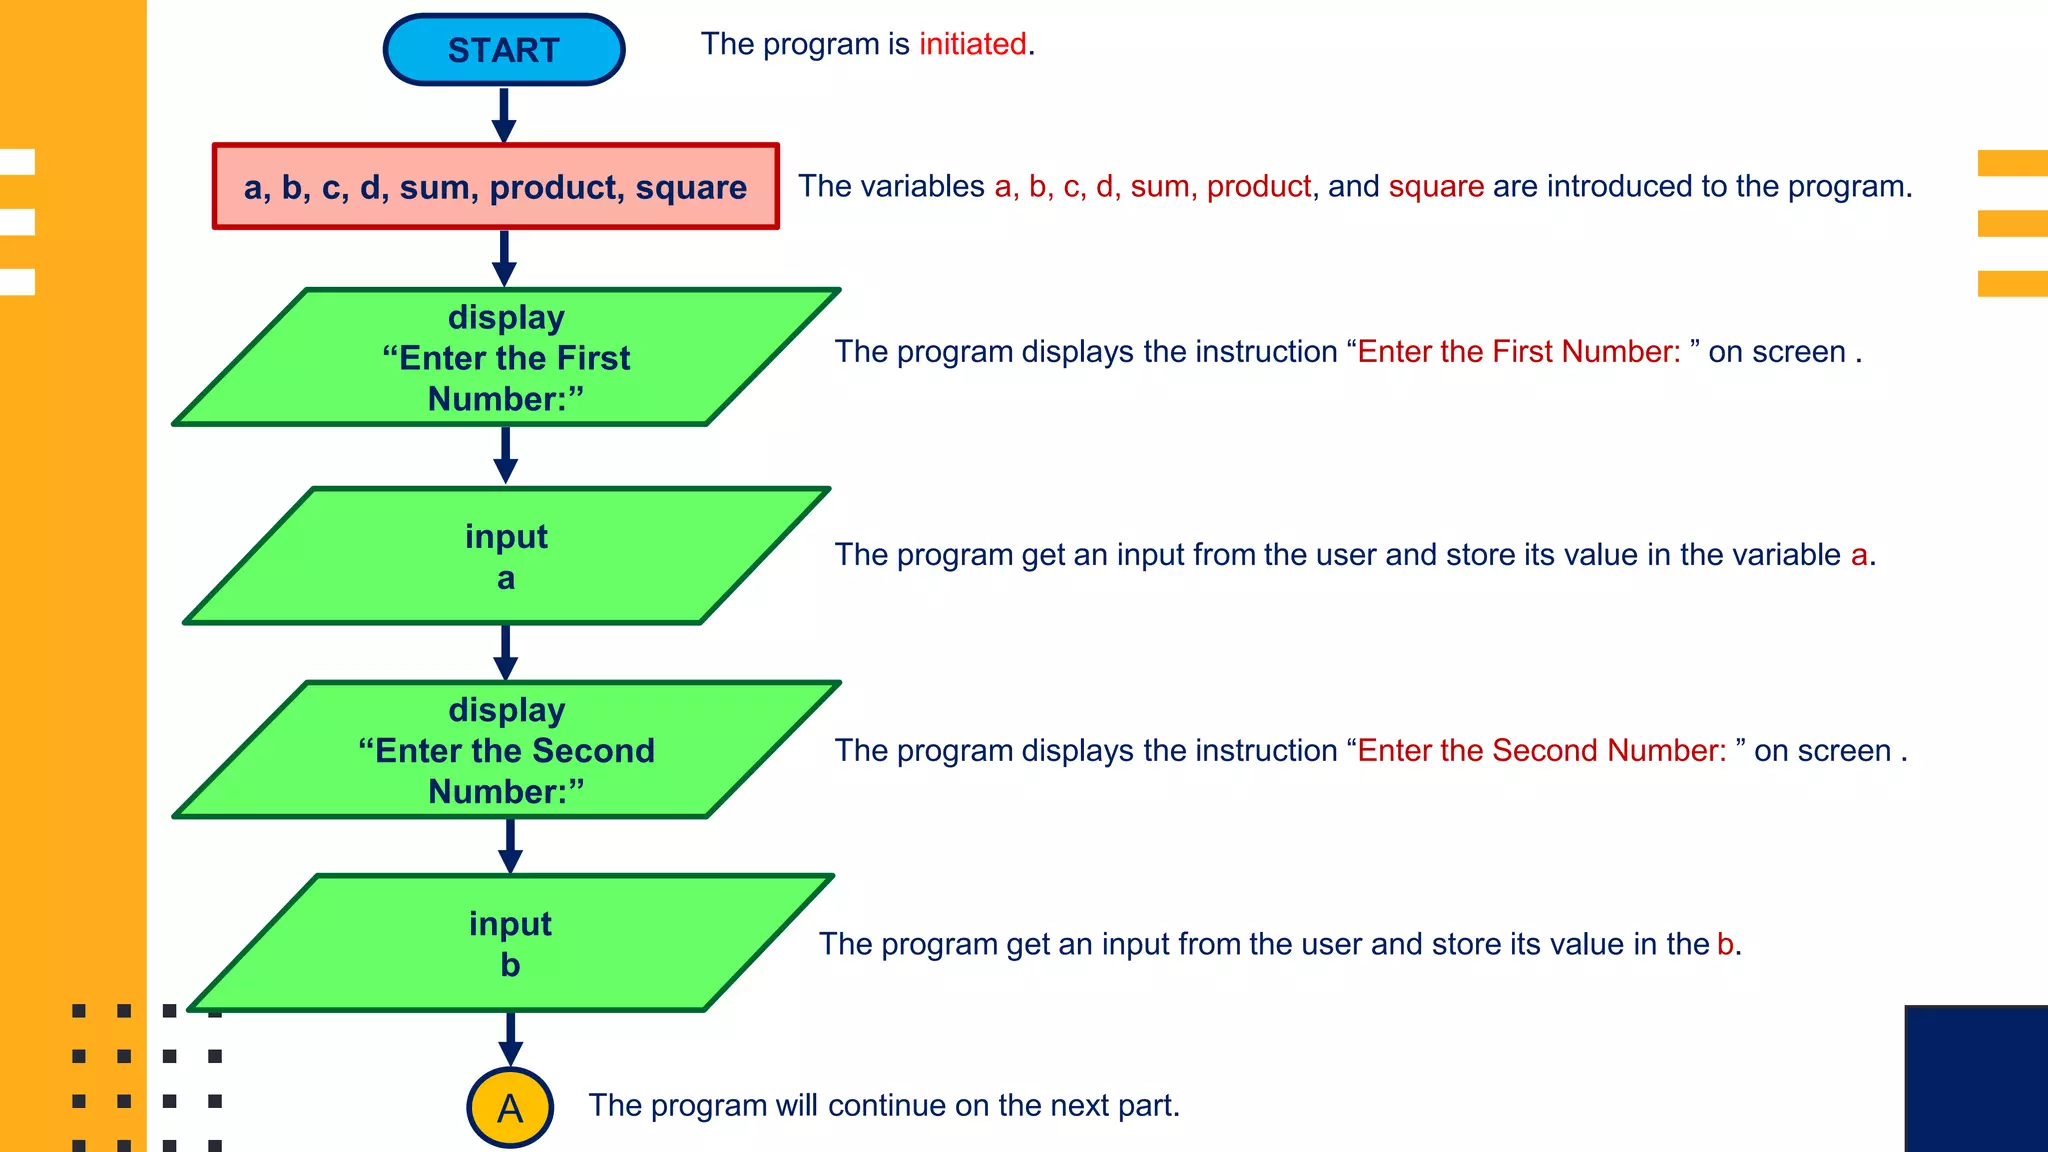
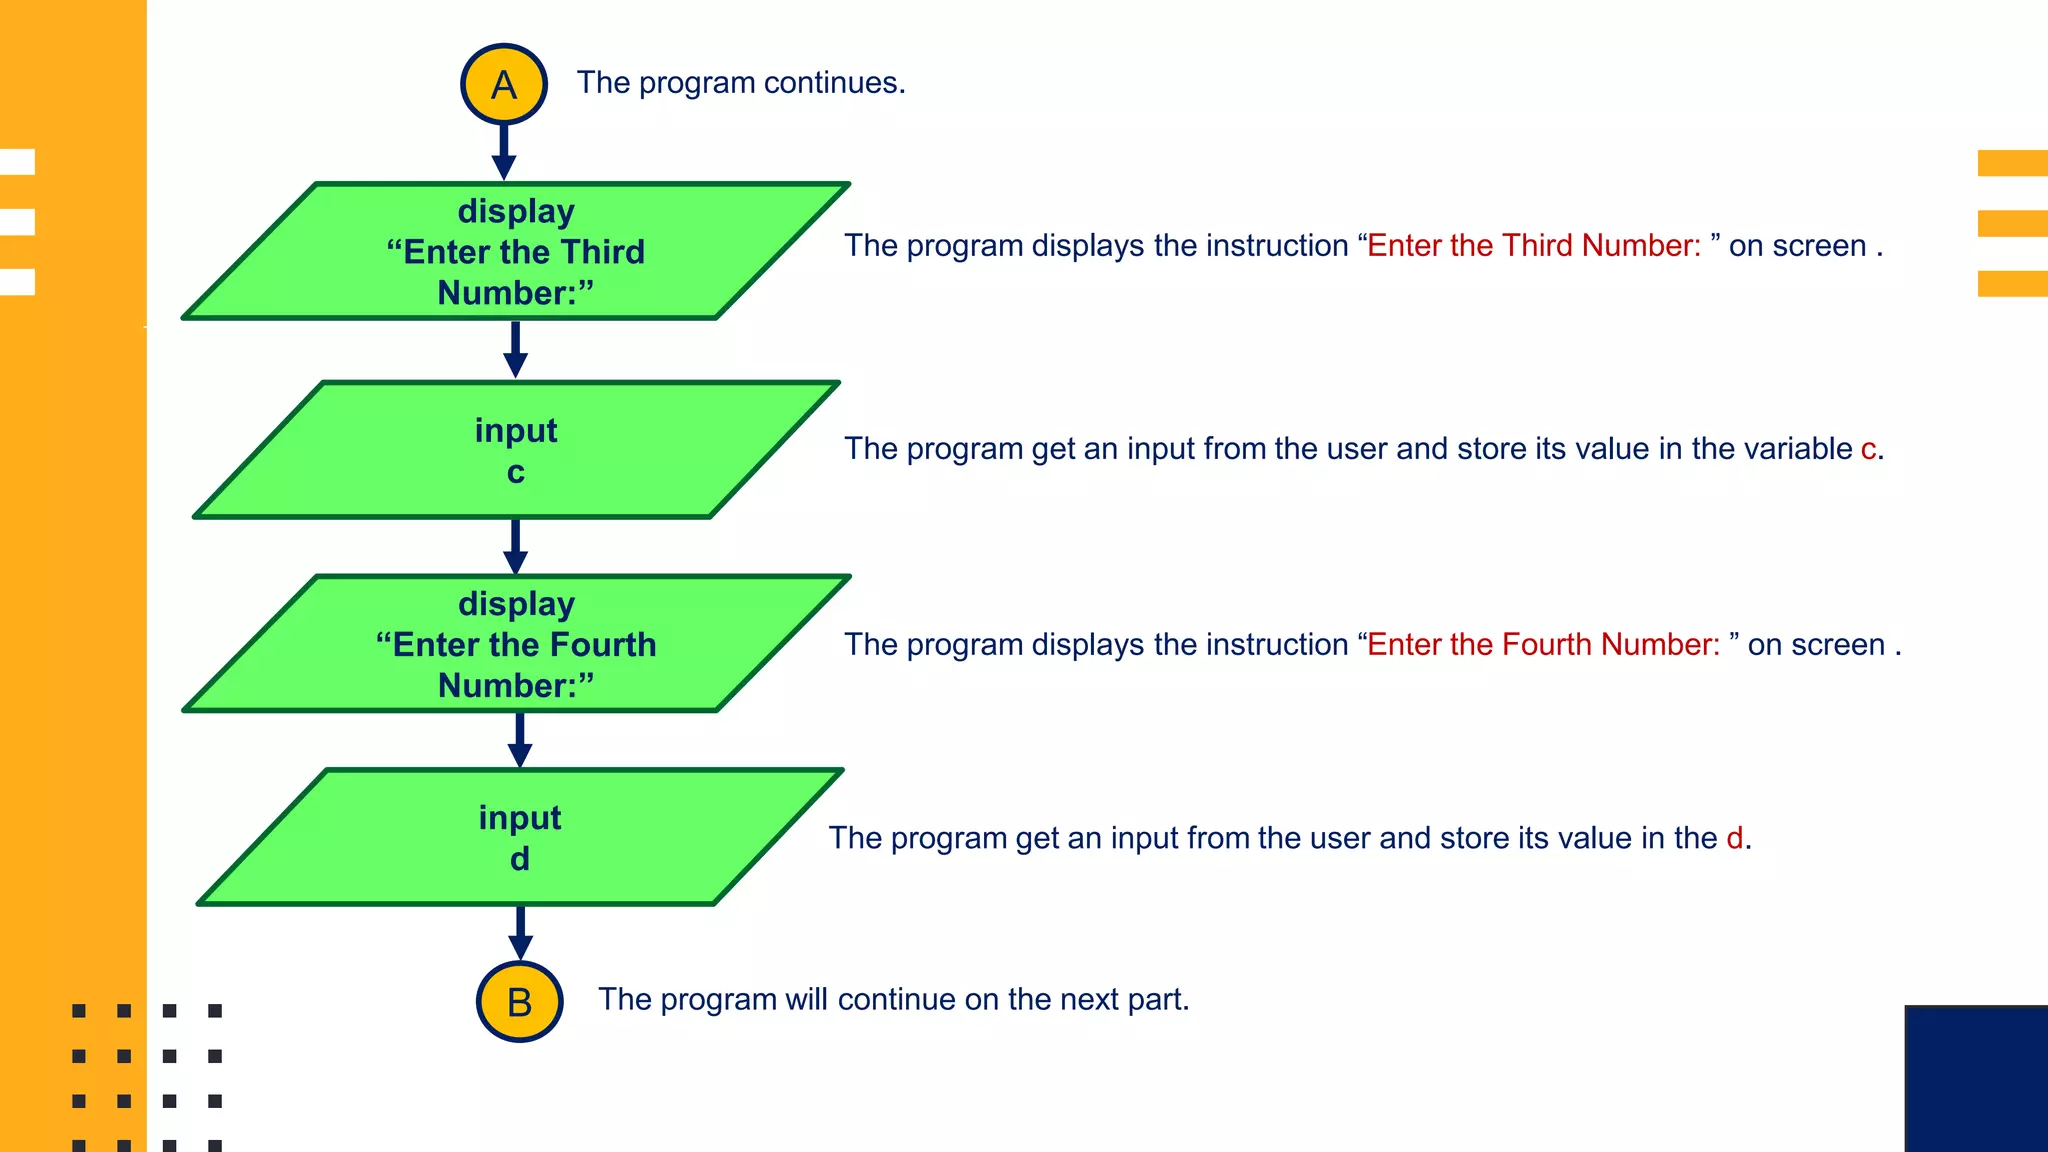
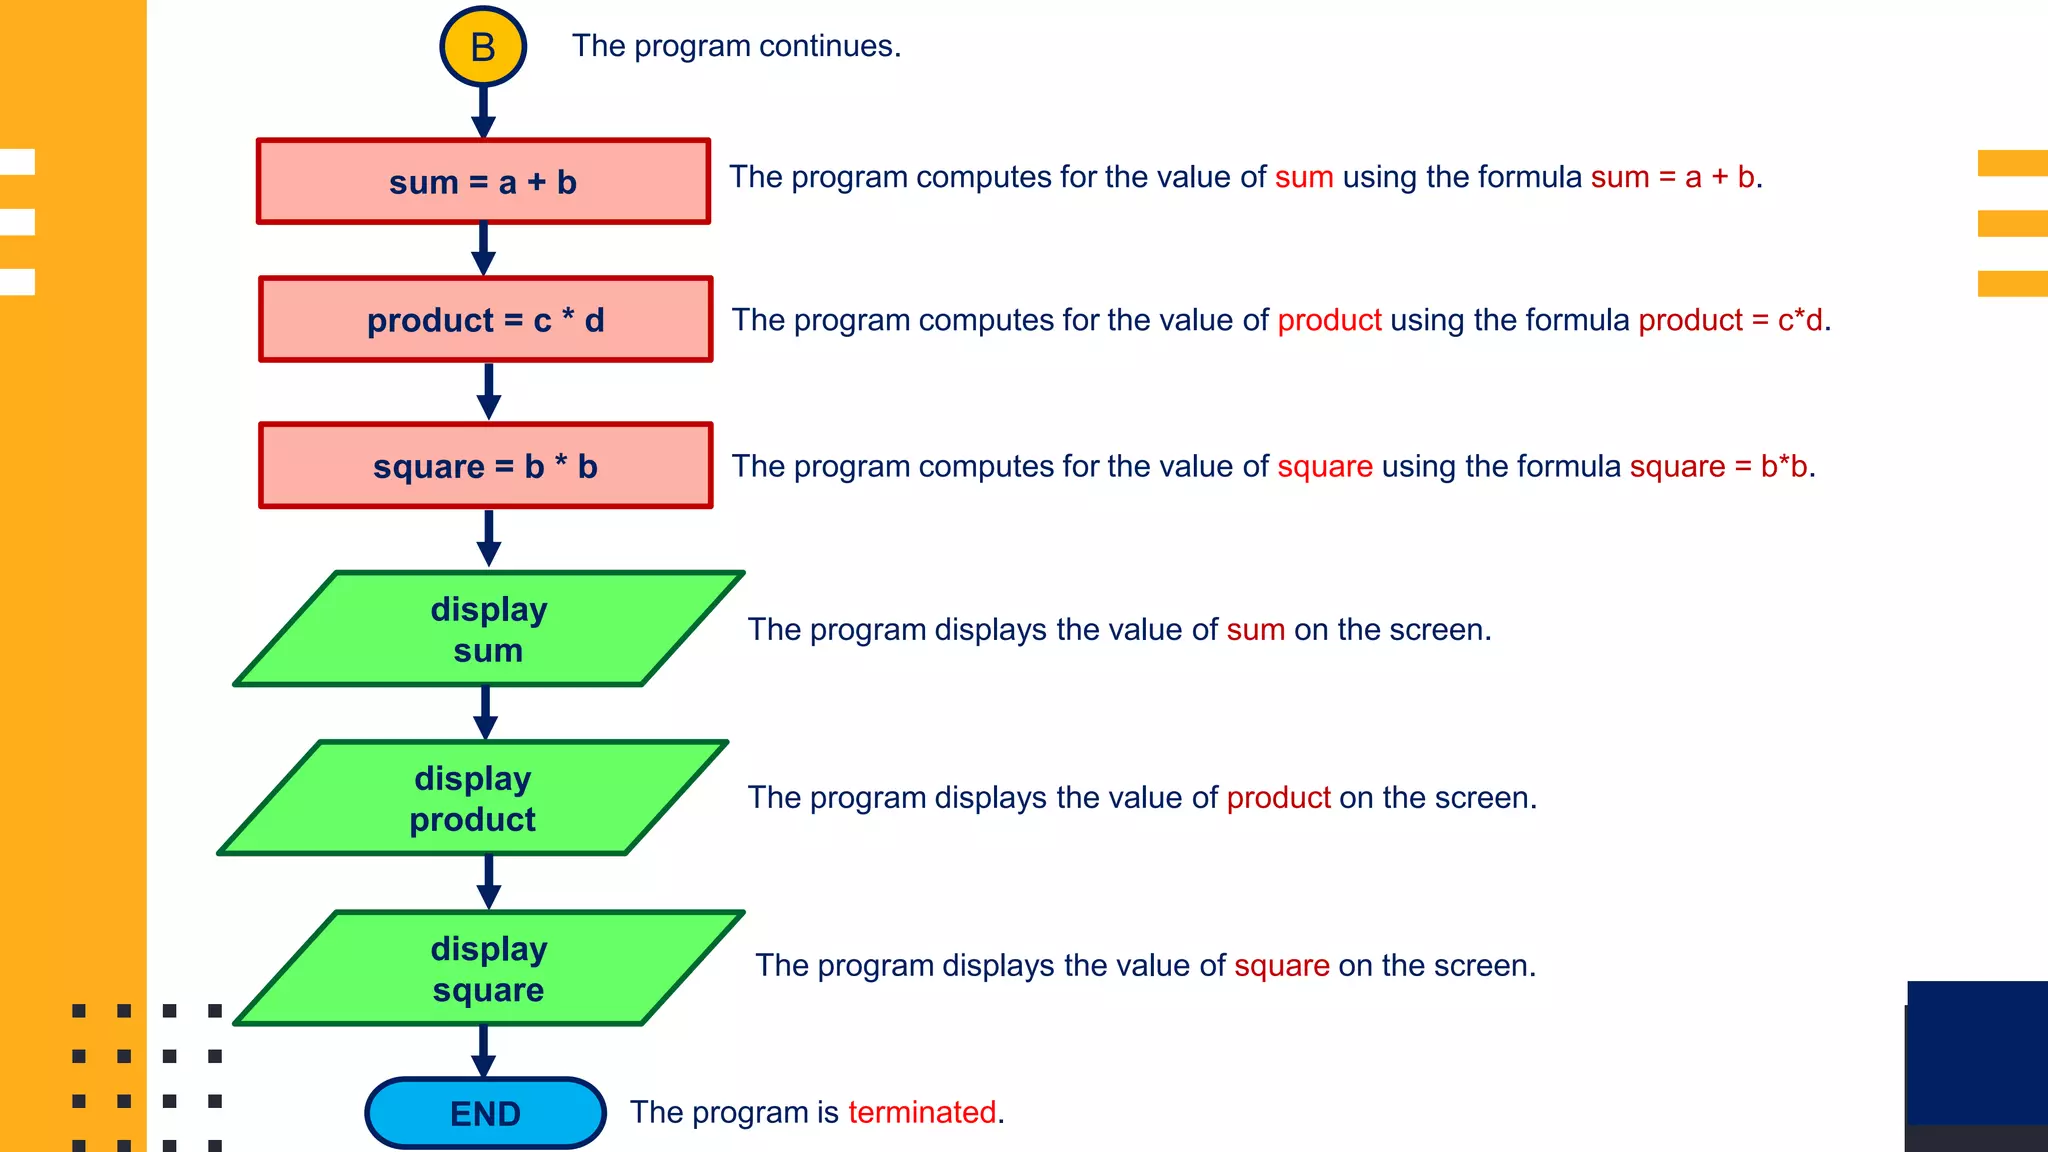
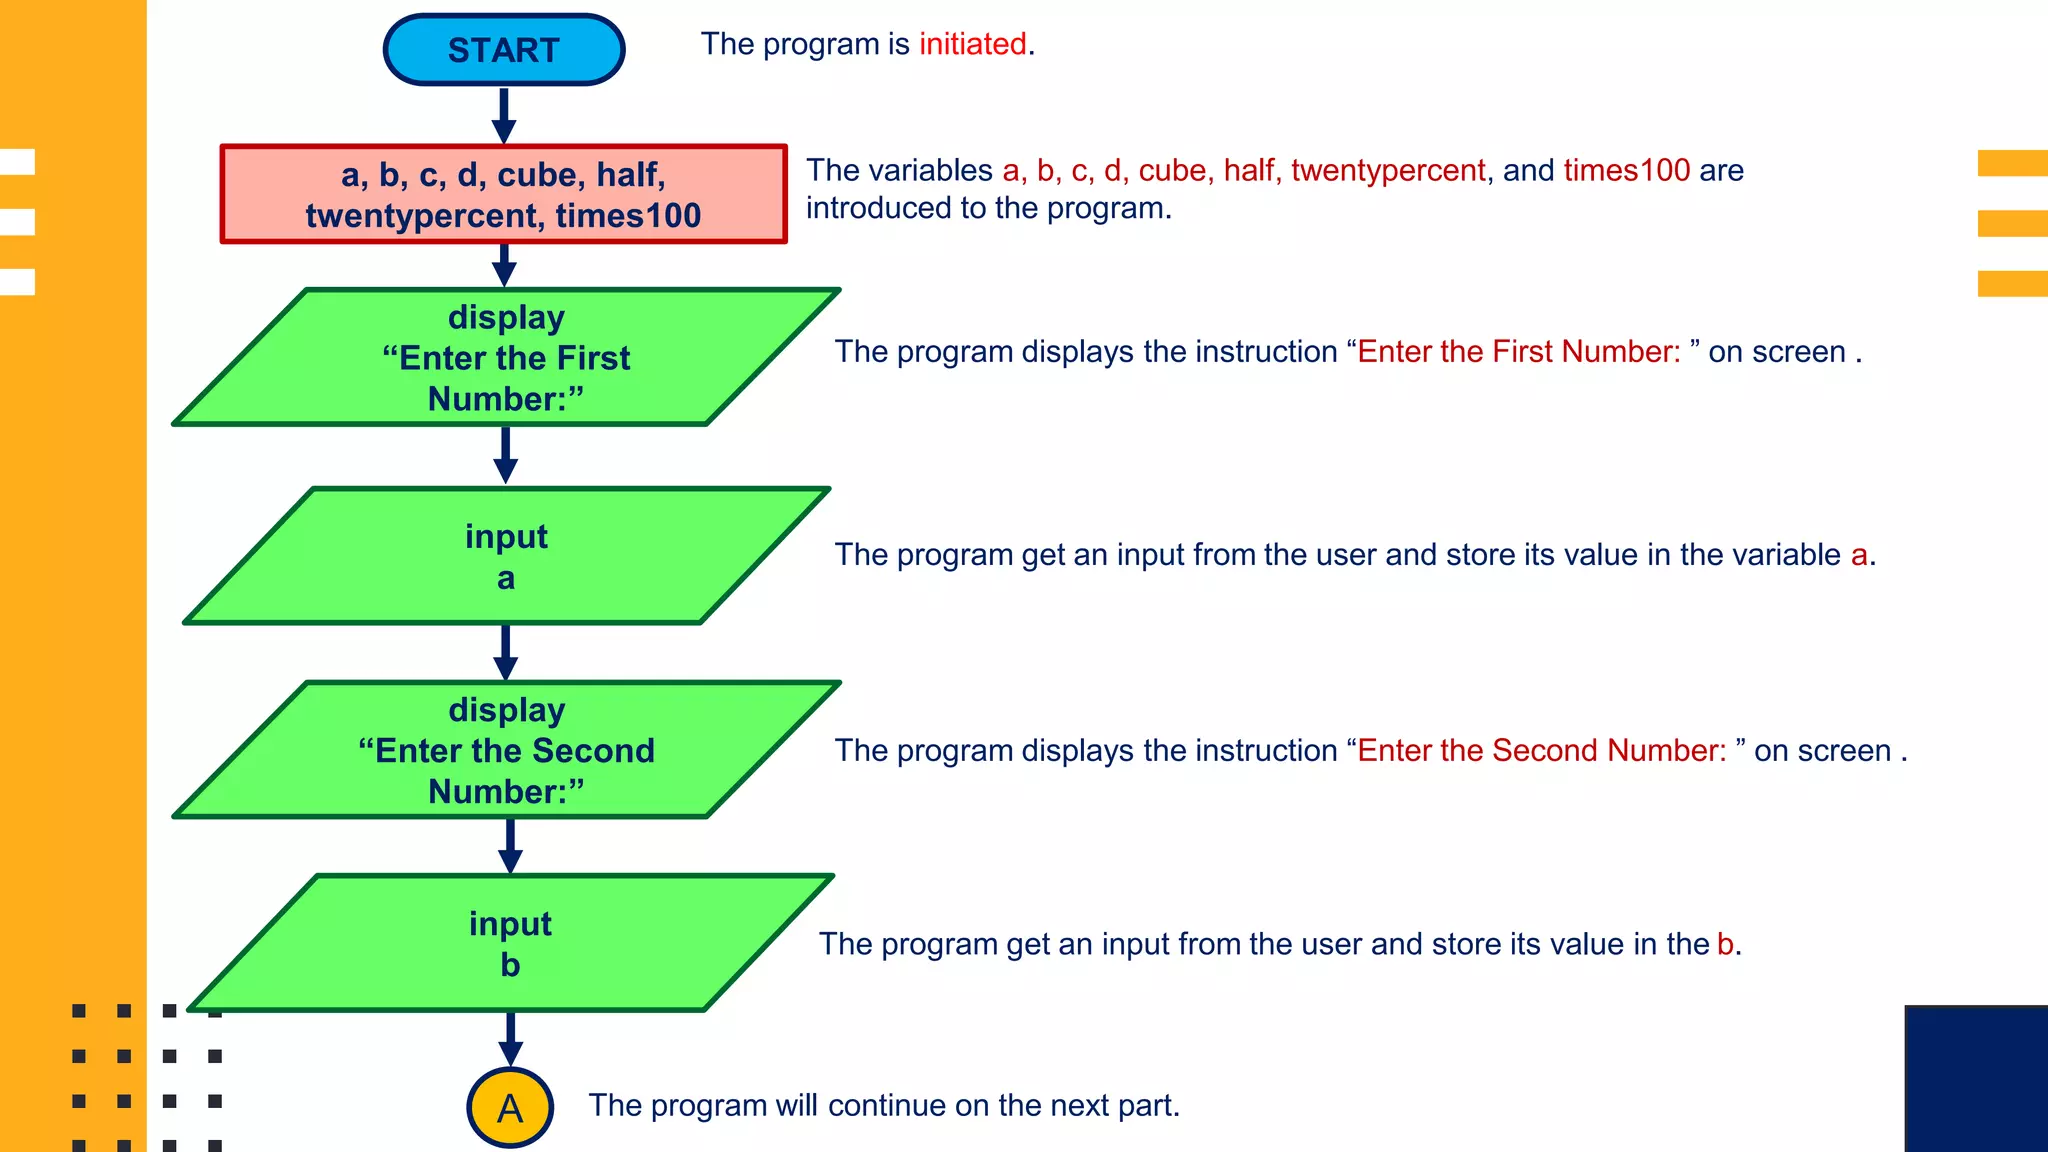
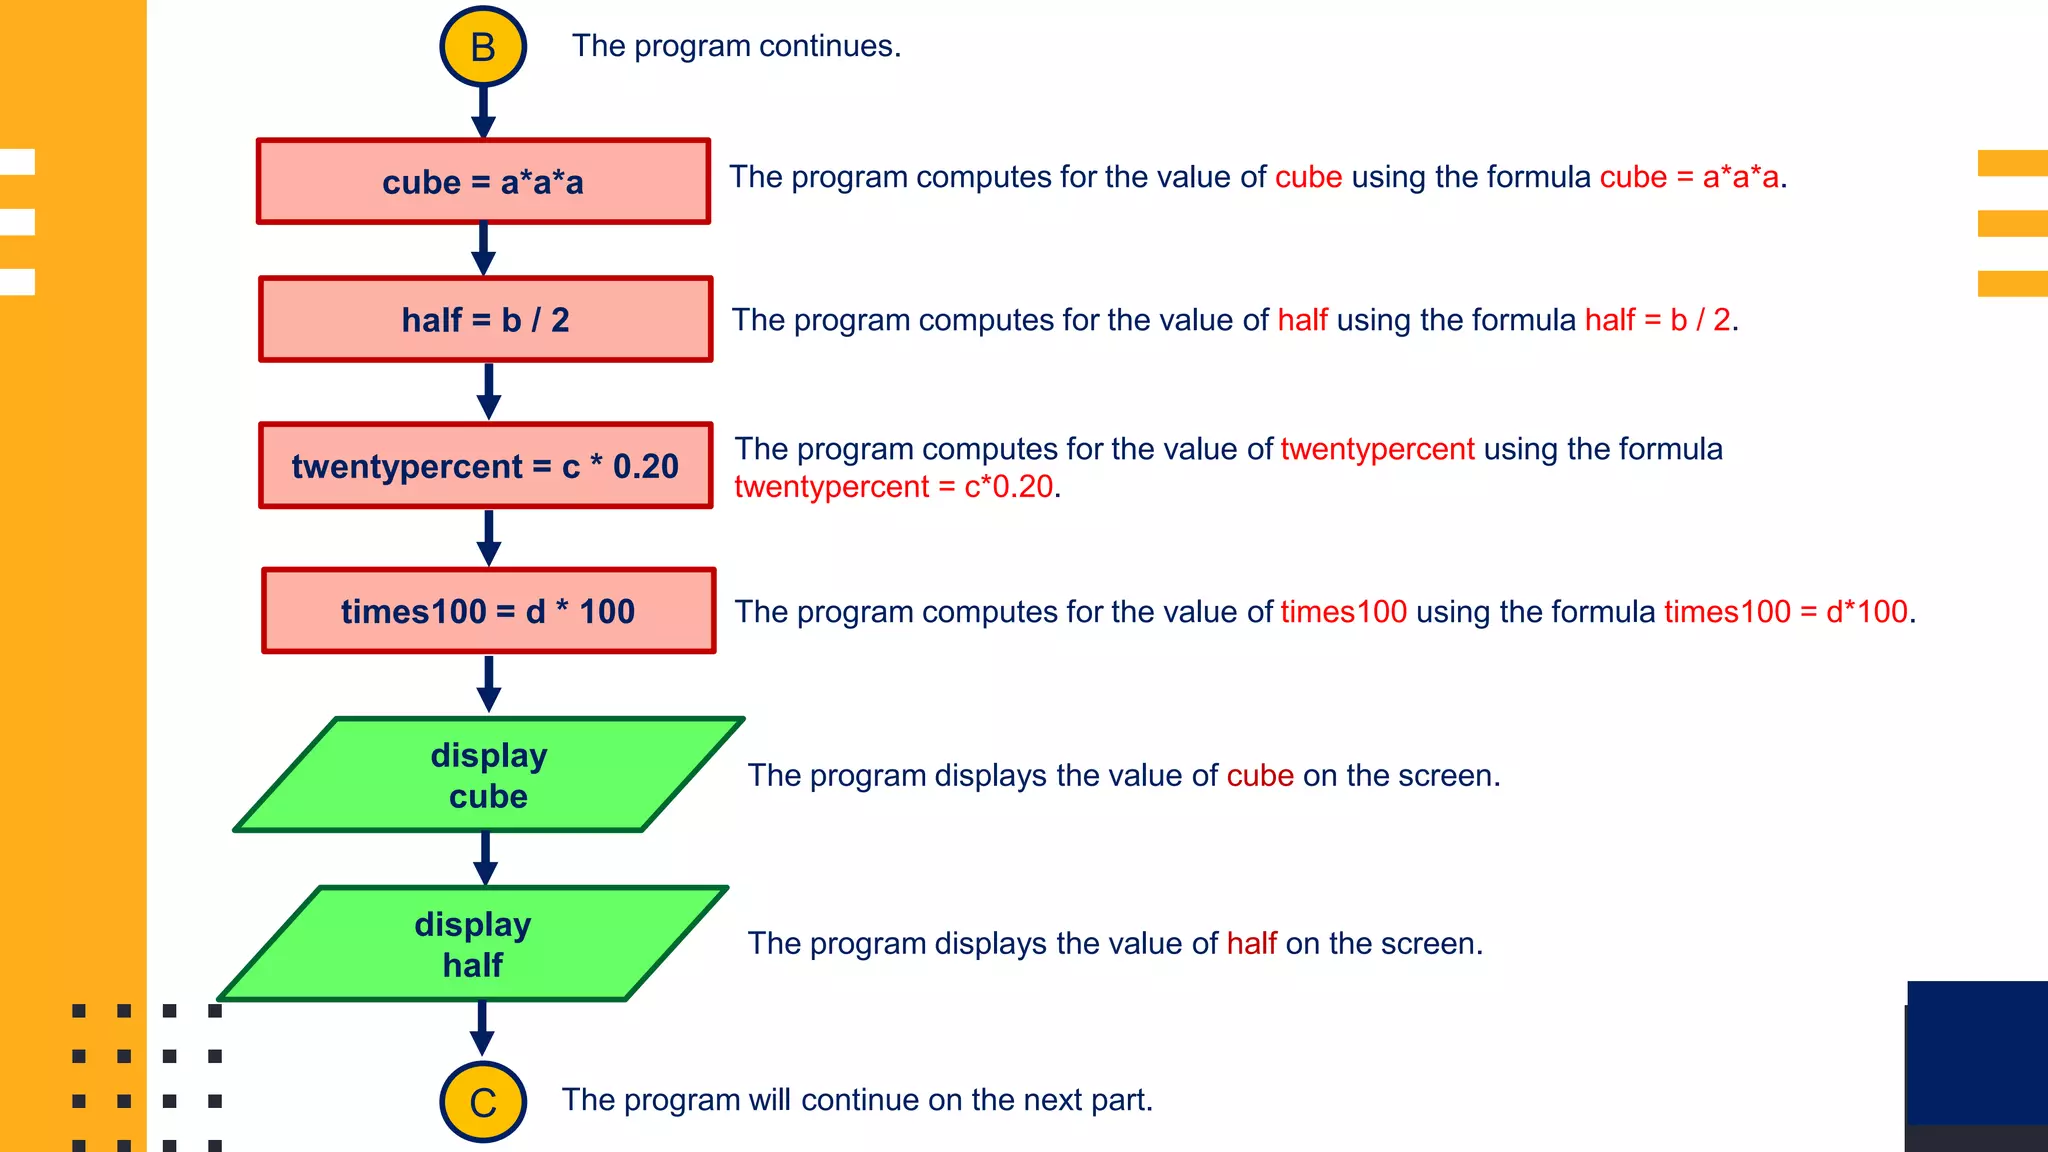
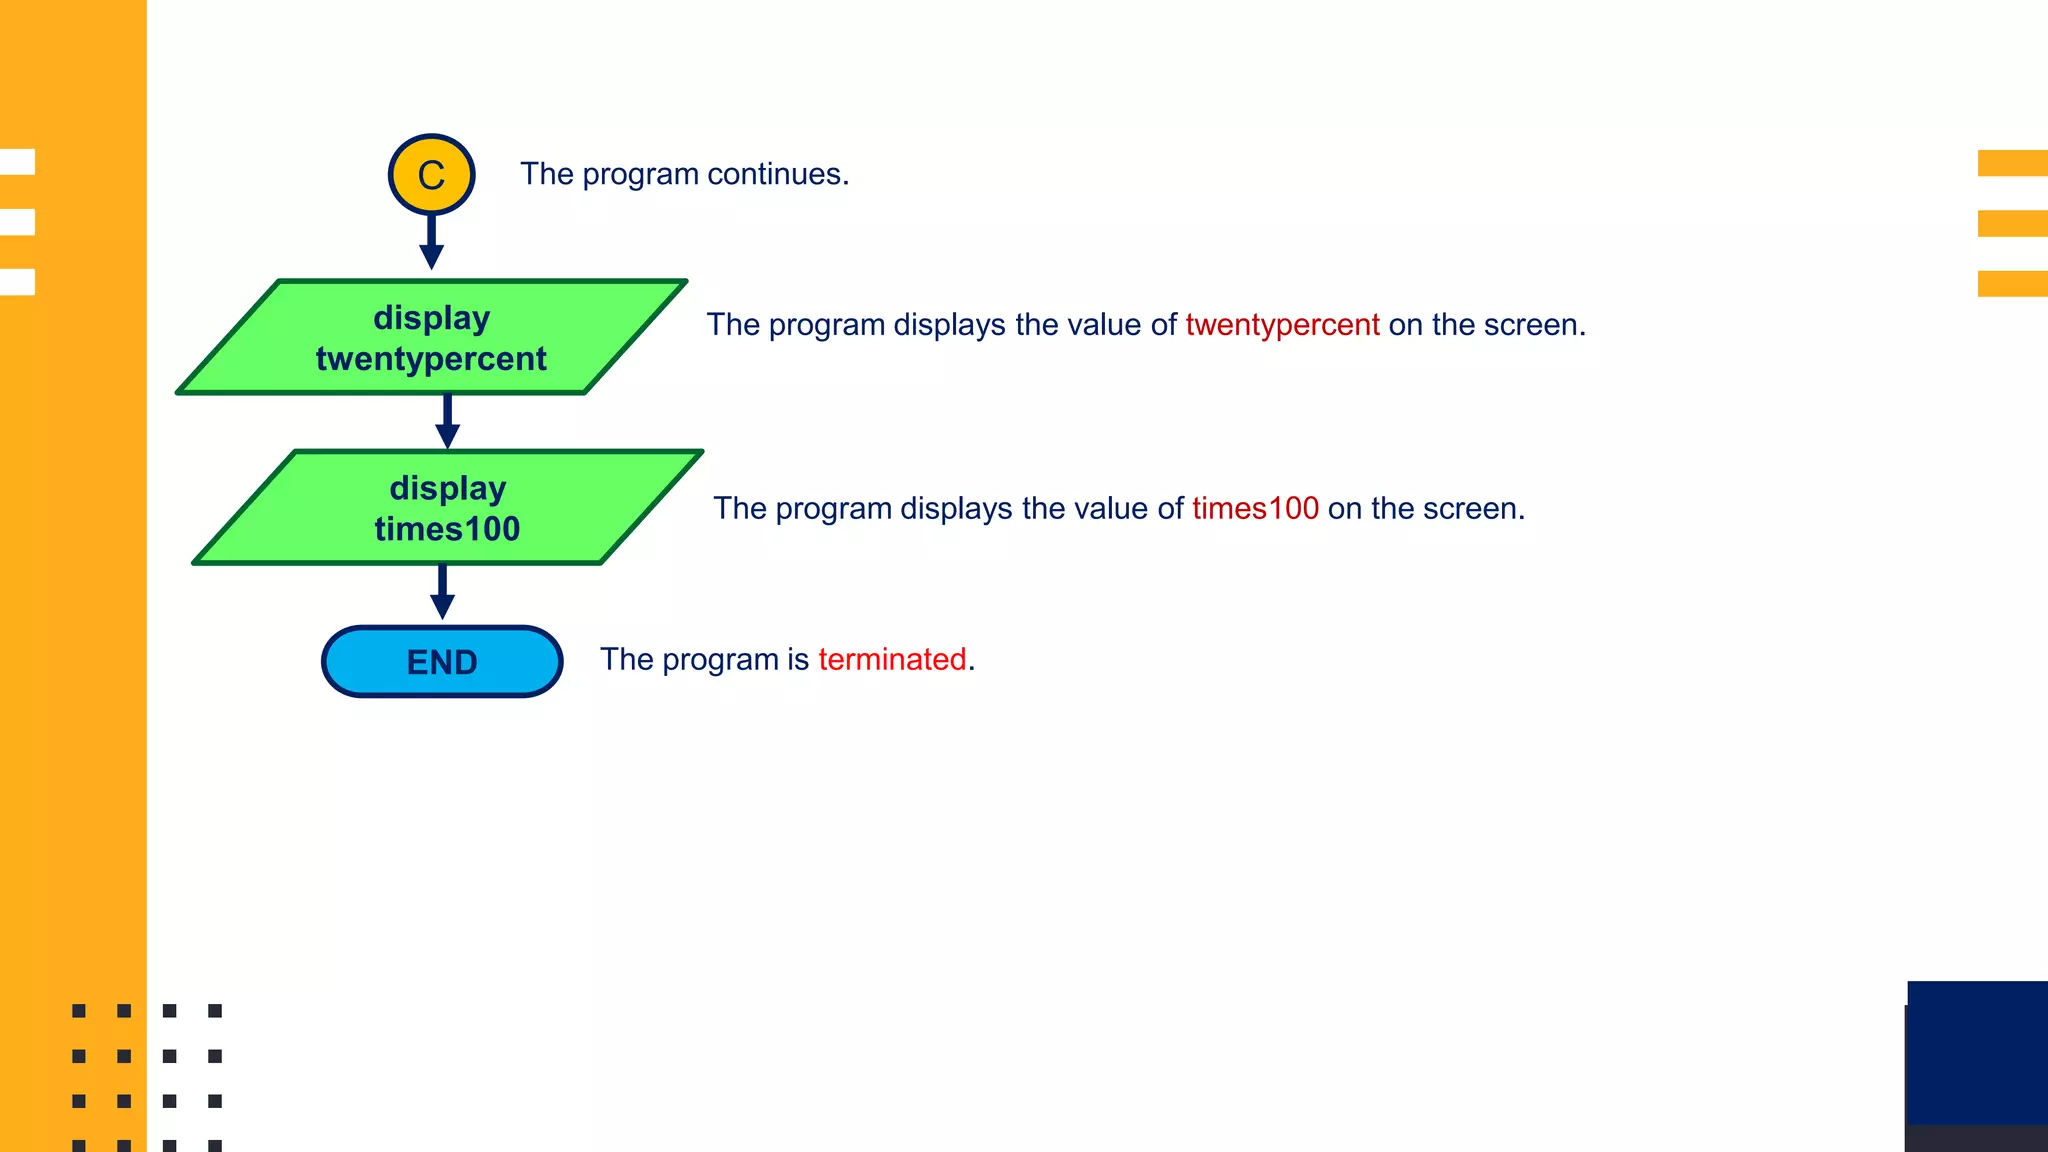
Multiple flowchart examples detailing problems like age calculation, kilogram to pound conversion, area computation, and simple calculations involving user inputs.
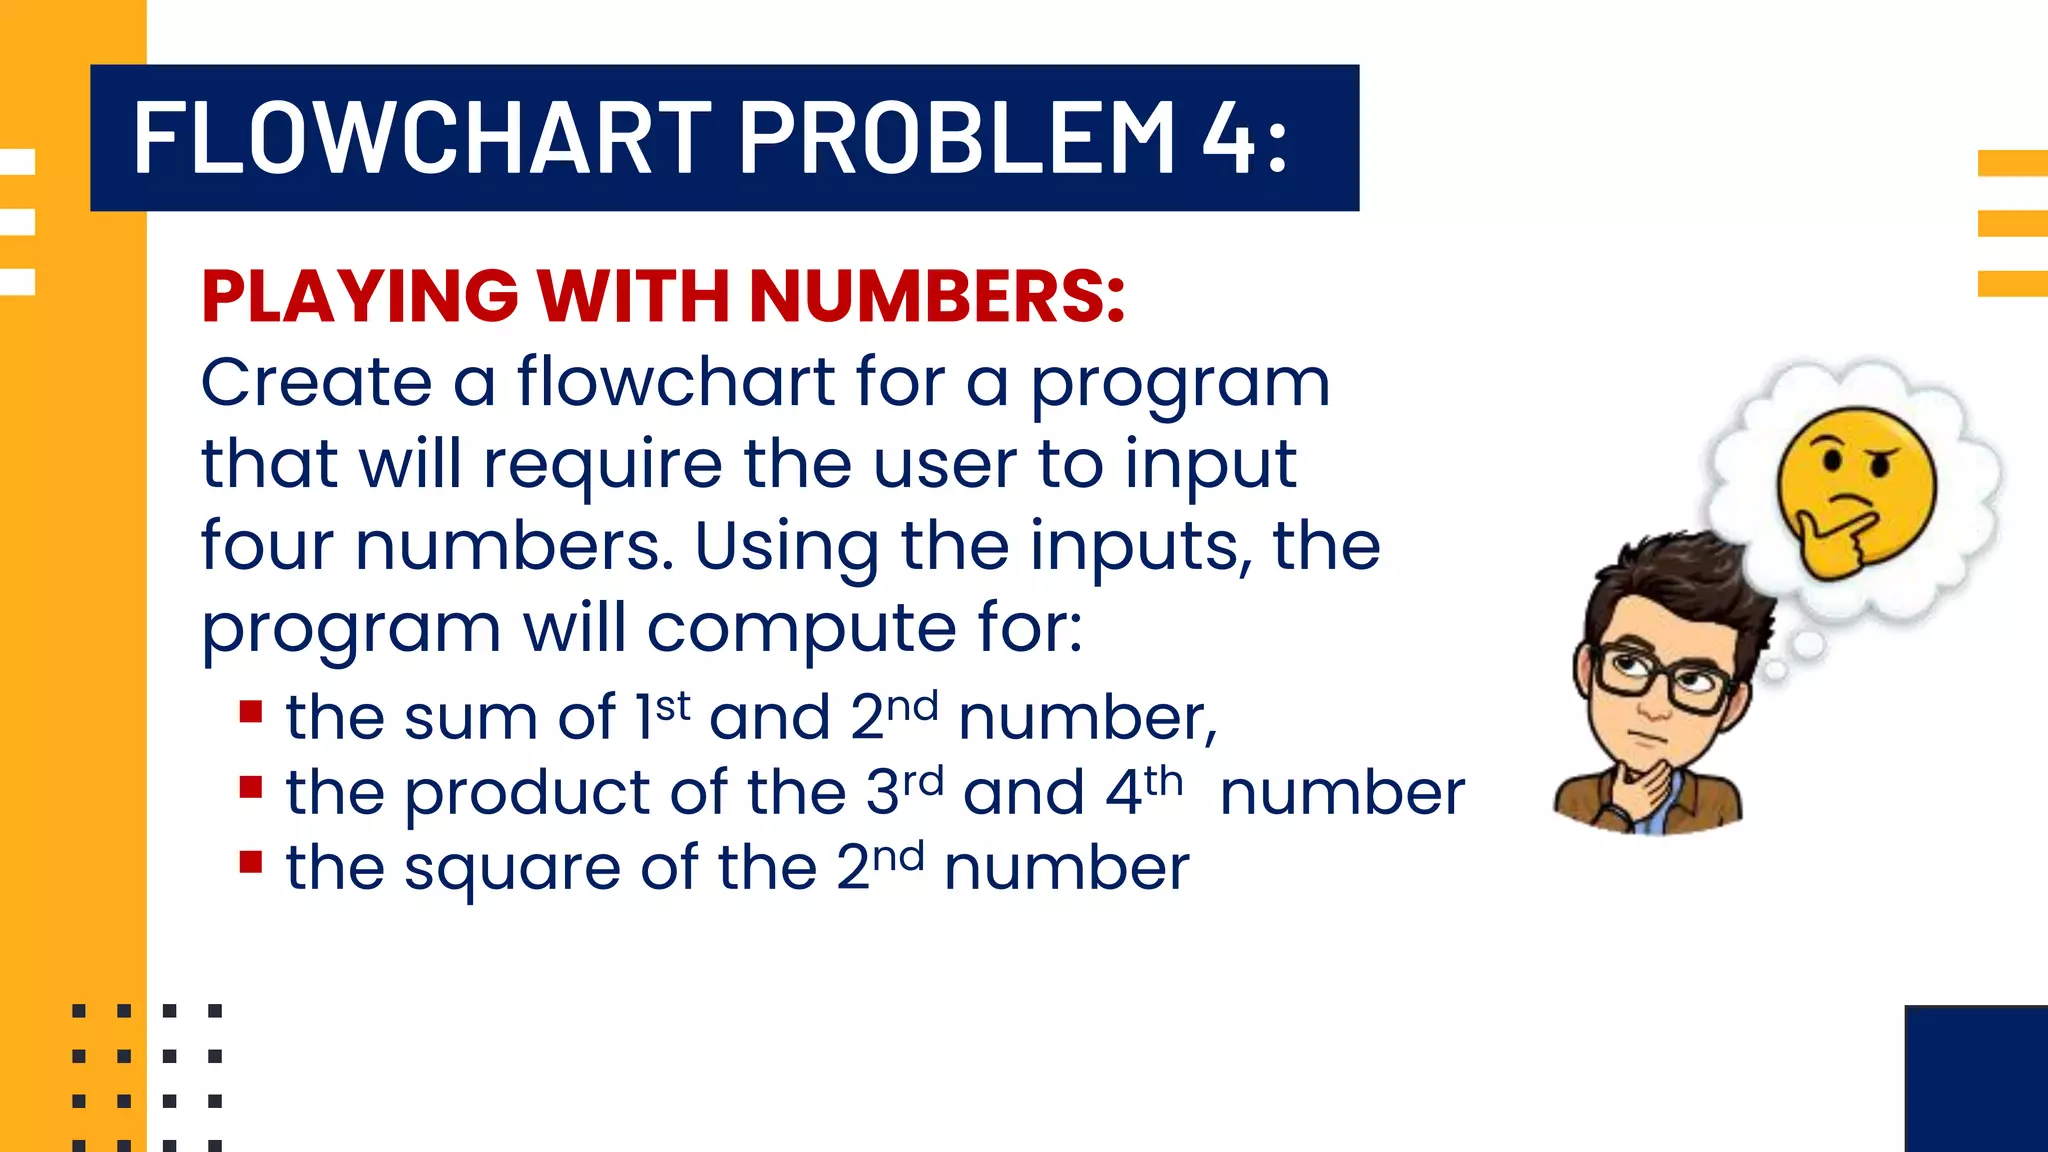
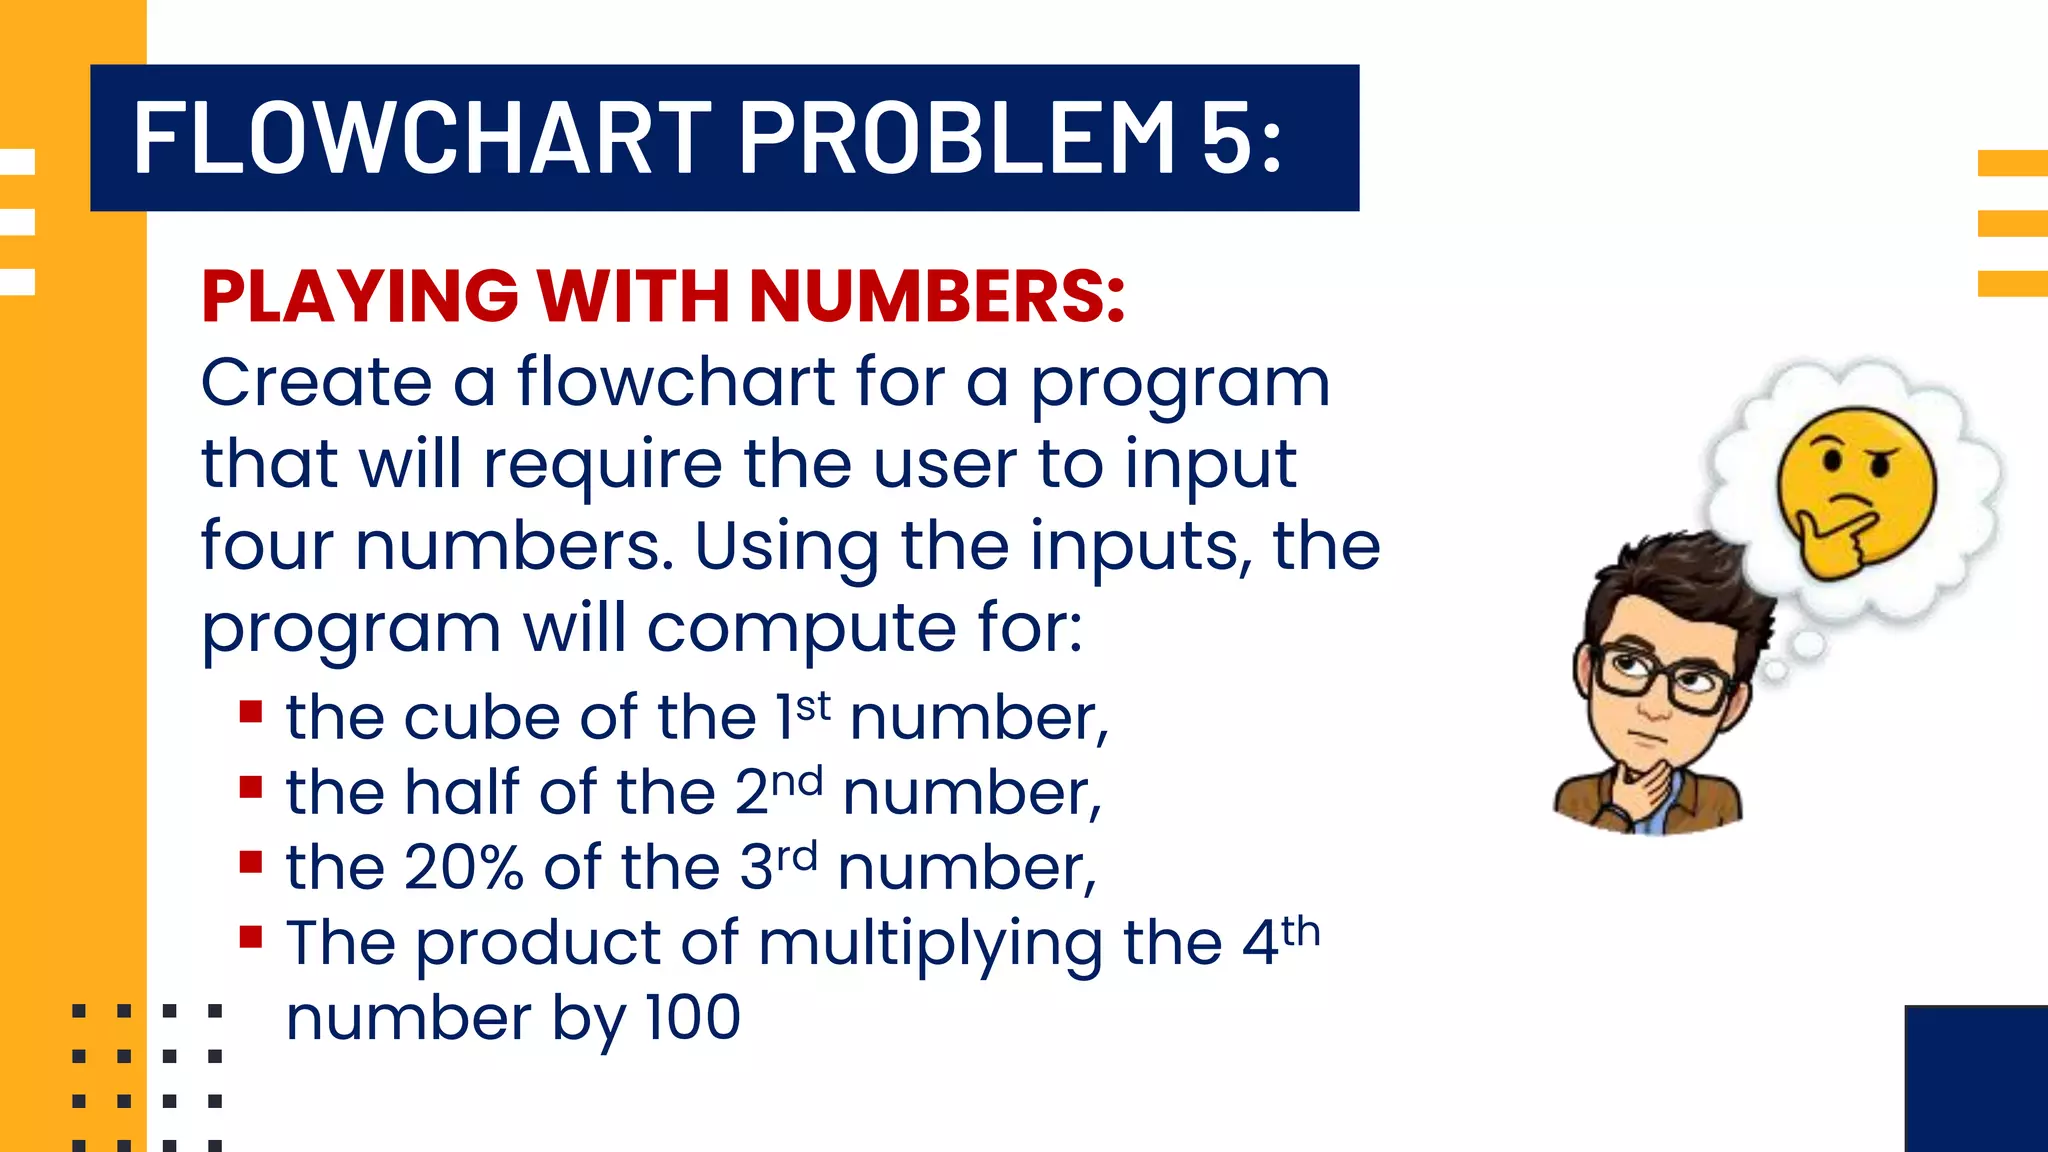
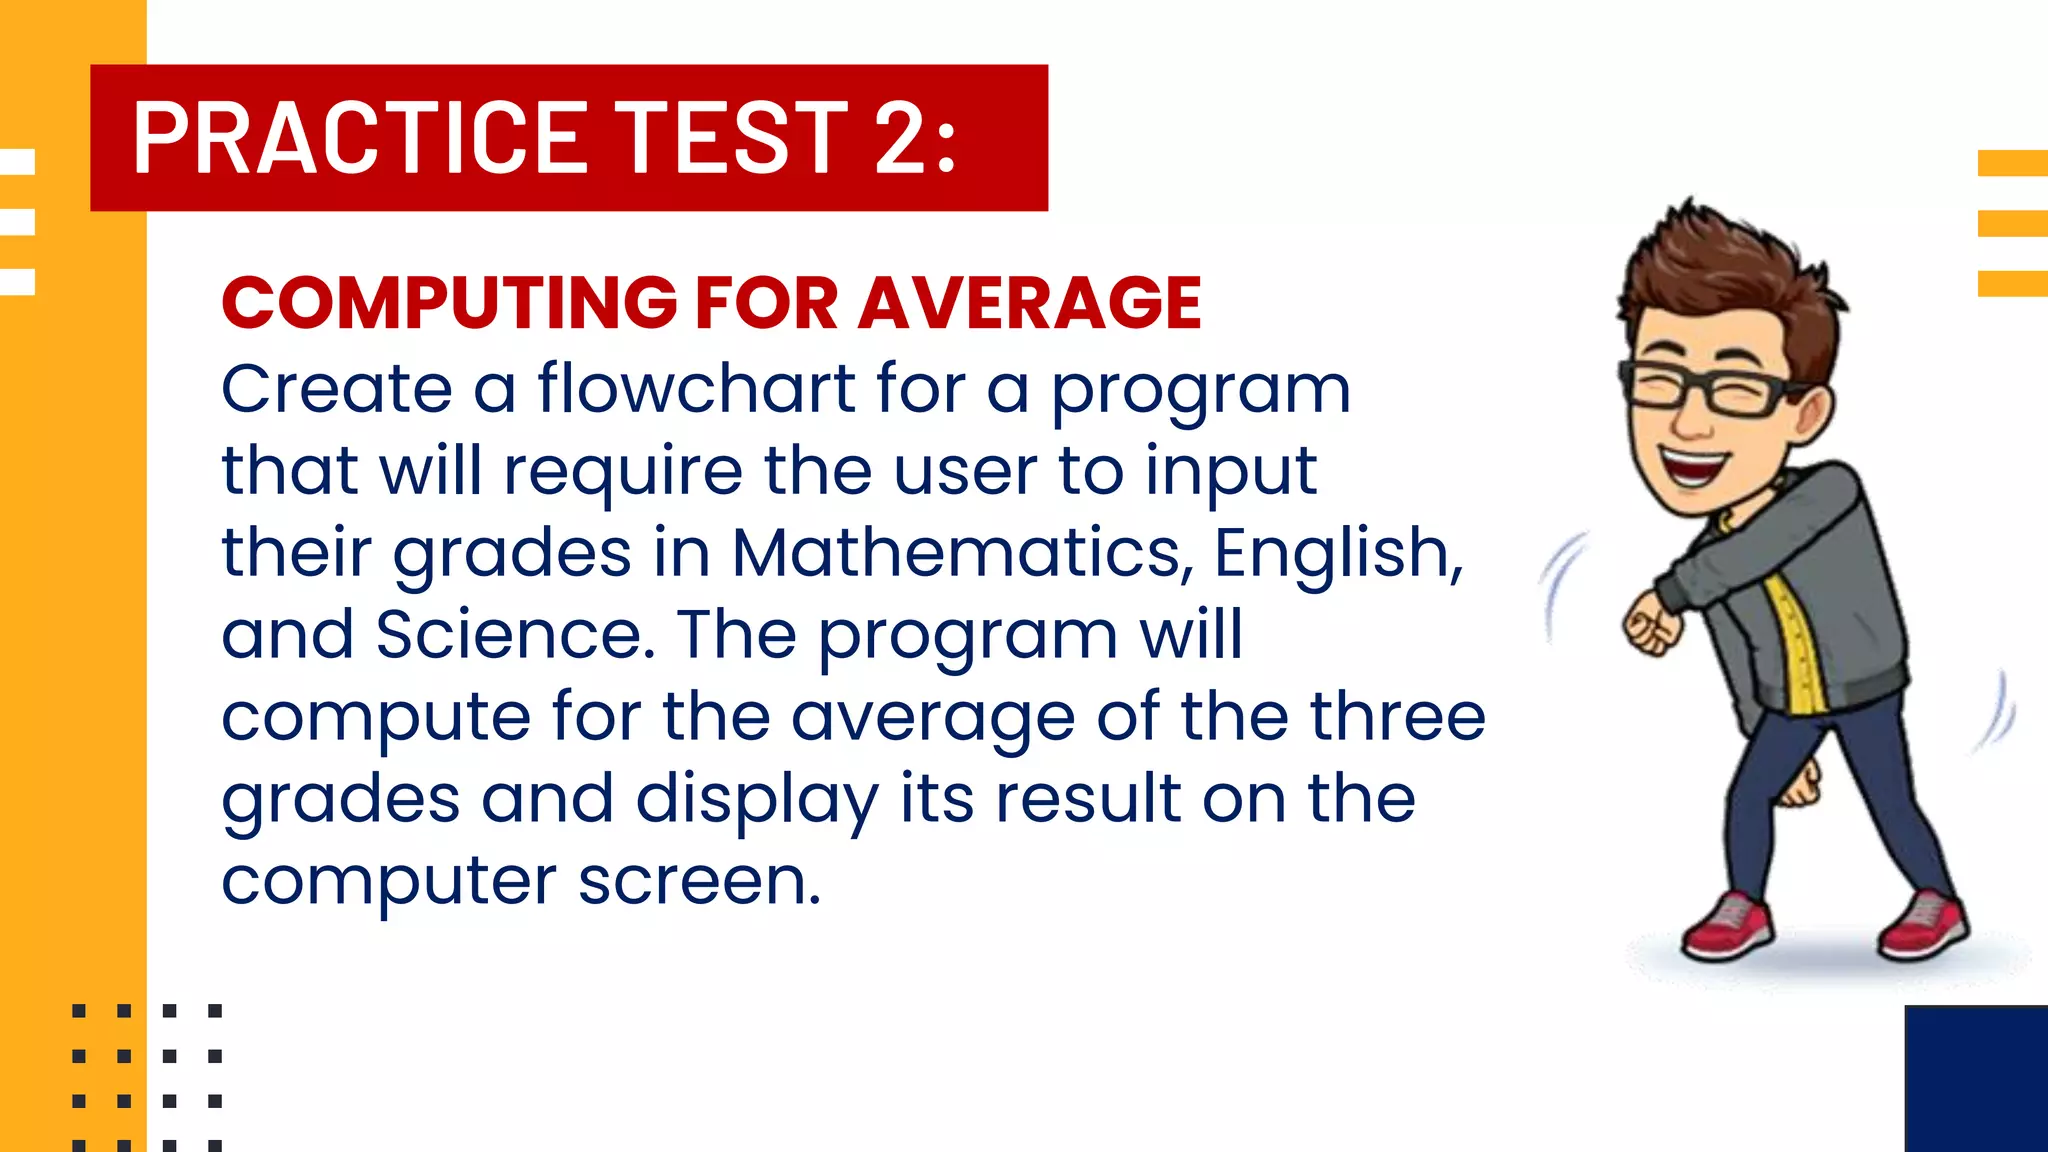
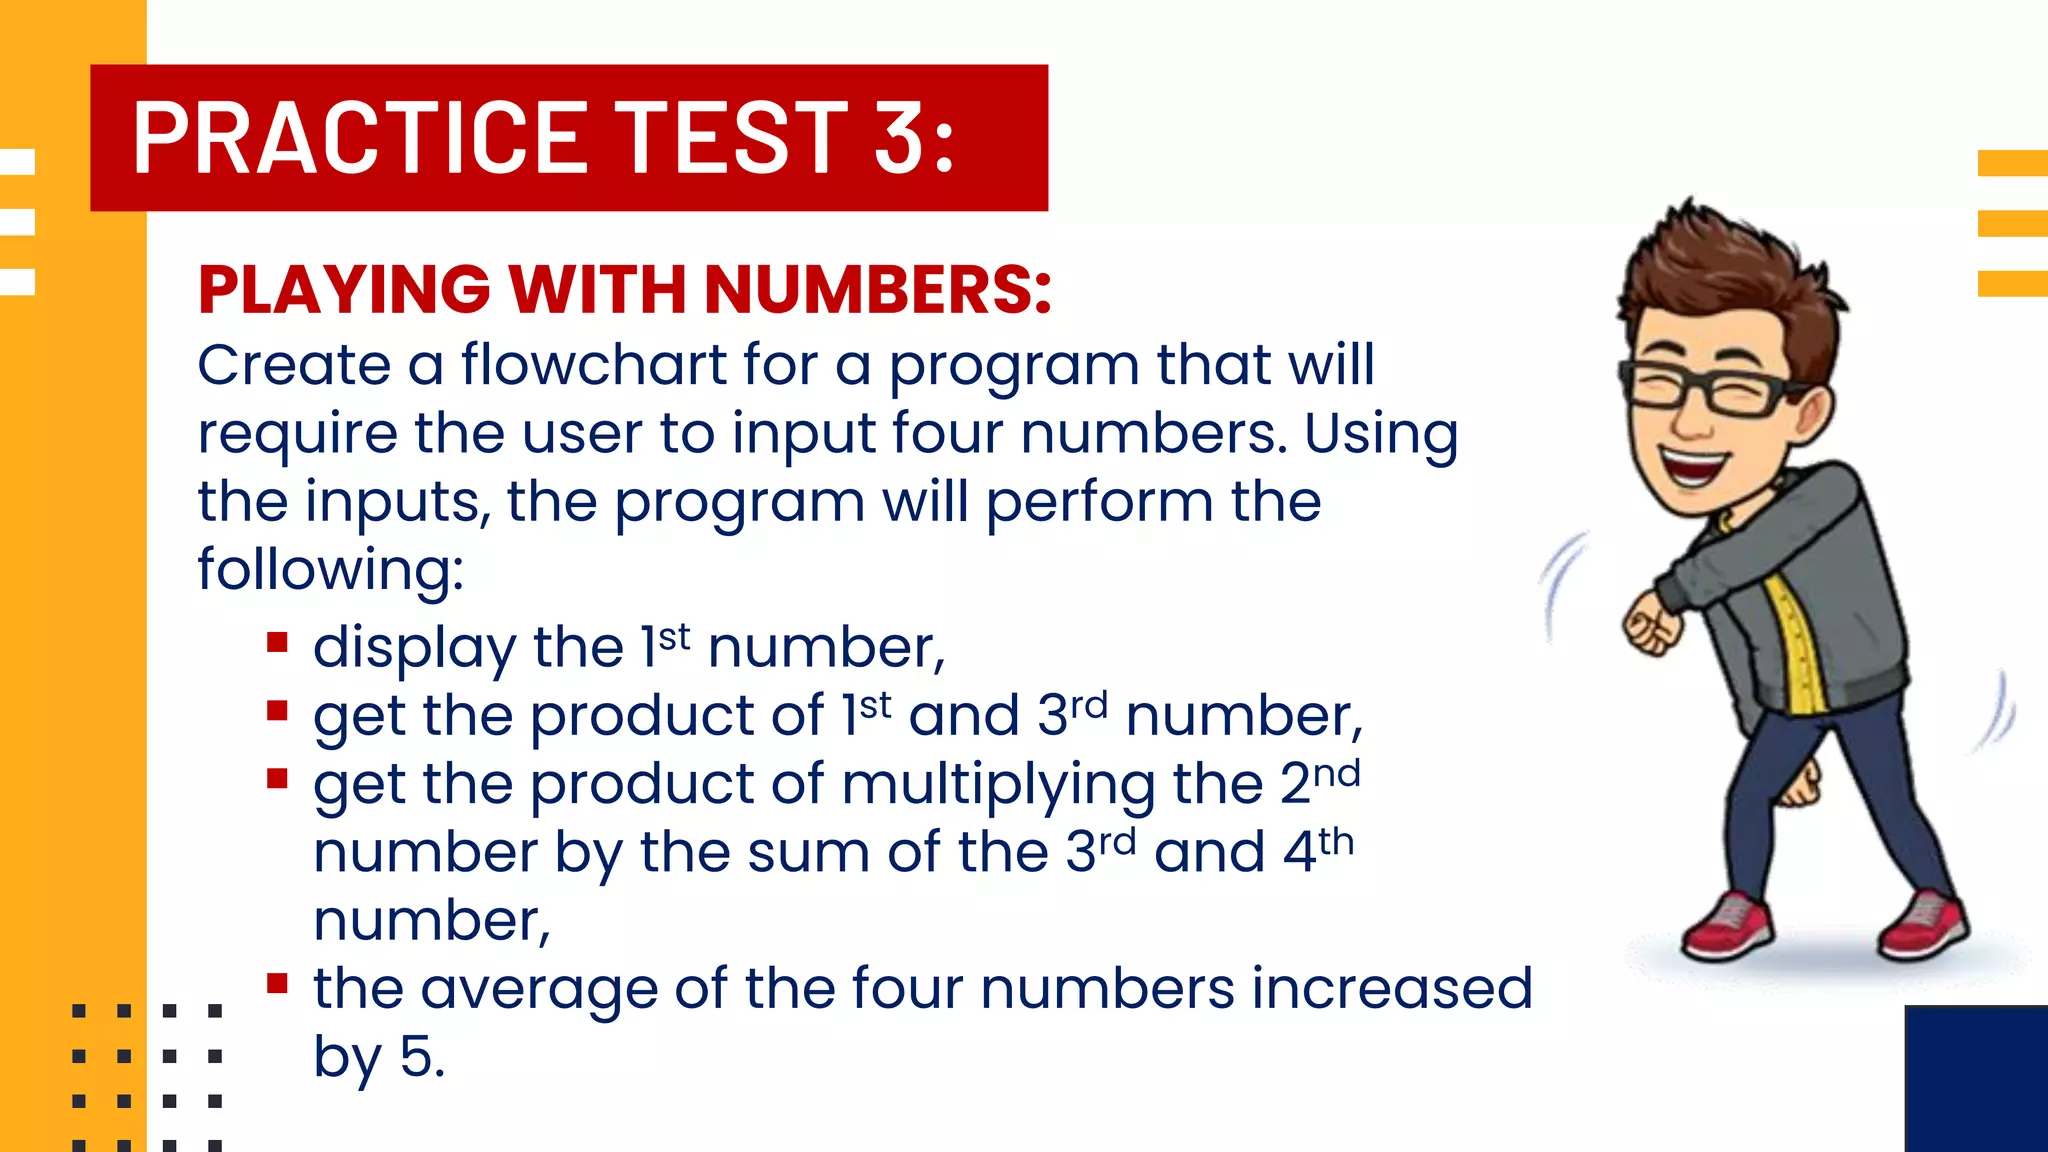
Practice problems such as converting dollar to peso, calculating average grades, and various numeric computations with user inputs.
Closure of the presentation by Mr. Rowell L. Marquina with contact emails provided for further communication.
TUNASAN NATIONAL HIGHSCHOOL SDO - Muntinlupa City ROWELL L. MARQUINA Senior High School Teacher TUNASAN NATIONAL HIGH SCHOOL Lesson 1 - Java Programming
2.
WHAT IS ANALGORITHM? An algorithm refers to a series of well-defined instructions on how to accomplish a task or solve a specific problem. ▪ Giving directions on how to get to somebody’s house is an algorithm. ▪ Following a recipe for baking a cake is an algorithm. ▪ The steps to compute the for average is also an algorithm. IMAGE SOURCE: https://imgbin.com/png/uxvDNRys/computer-programming-computer-icons-technology-algorithm-png https://www.flaticon.com/free-icon/coding_1085774
3.
STEPS IN CREATINGAN ALGORITHM In creating an algorithm, it is very important to determine the exact goal or expected product first. The goal or expected product of the algorithm is called OUTPUT. IMAGE SOURCE: https://imgbin.com/png/uxvDNRys/computer-programming-computer-icons-technology-algorithm-png https://www.flaticon.com/free-icon/coding_1085774
4.
STEPS IN CREATINGAN ALGORITHM After determining the output, the next step is to identify the necessary materials or elements needed to accomplish the task. The necessary materials or elements for the program is called INPUT. IMAGE SOURCE: https://imgbin.com/png/uxvDNRys/computer-programming-computer-icons-technology-algorithm-png https://www.flaticon.com/free-icon/coding_1085774
5.
STEPS IN CREATINGAN ALGORITHM If the input and output are already identified, it is time to list the steps needed to accomplish the task. The steps needed to accomplish the task is referred to as the PROCESS. IMAGE SOURCE: https://imgbin.com/png/uxvDNRys/computer-programming-computer-icons-technology-algorithm-png https://www.flaticon.com/free-icon/coding_1085774
7.
CHARACTERISTICS OF ANALGORITHM ▪ It should have well-defined input and output. ▪ The steps should be stated clearly and unambiguously. ▪ It should have an exact start and end. ▪ It should be simple but precise. ▪ It should be practical. IMAGE SOURCE: https://imgbin.com/png/uxvDNRys/computer-programming-computer-icons-technology-algorithm-png https://www.flaticon.com/free-icon/coding_1085774
9.
WHAT IS AFLOWCHART? A flowchart is a diagram that illustrates a process, system or computer algorithm. IMAGE SOURCE: https://www.frevvo.com/blog/wp-content/uploads/2021/10/image5-2.png Flowcharts are widely used in multiple fields to document, study, plan, improve and communicate often complex processes in clear, easy-to- understand diagrams.
11.
FLOWCHART SYMBOLS The AmericanNational Standards Institute (ANSI) set standards for flowcharts and their symbols in the 1960s. IMAGE SOURCE: https://uploads-ssl.webflow.com/6184b461a39ff13bfb8c0556/61de99e8171cc6468145551d_flowchart-symbols-800.png In 1970 the International Organization for Standardization (ISO) adopted the ANSI symbols as the international standard for developing flowcharts.
12.
FLOWCHART SYMBOLS IMAGE SOURCE: https://uploads-ssl.webflow.com/6184b461a39ff13bfb8c0556/61de99e8171cc6468145551d_flowchart-symbols-800.png NAMEOF SYMBOL SYMBOL FUNCTION Terminal Symbol Indicates the beginning and end of the flowchart. Flowline Symbol Its shows the process’ direction or the next steps in the process. Process Symbol It shows the process or operations to be carried out by the program Decision Symbol It shows the step that contains a control mechanism or decision. Input/Output Symbol It indicates the process of getting data from the user or displaying data on screen.
13.
FLOWCHART PROBLEM 1: DETERMININGUSER’S AGE: Create a flowchart for a program that will require the user to input their year of birth. Using the user’s year of birth, the program will compute for the user’s age and display its result on the computer screen.
14.
FLOWCHART SAMPLE 1: START birthyear, age display “EnterYear of Birth:” input birthyear age = 2023 - birthyear display age END The program is initiated. The variables birthyear and age are introduced to the program as integers. The program displays the instruction “Enter Year of Birth: ” on screen . The program get an input from the user and store its value in the variable birthyear. The program computes for the value of age using the formula age = 2023 - birthyear. The program displays the value of age on the screen. The program is terminated.
15.
FLOWCHART PROBLEM 2: CONVERSIONFROM KILOGRAM TO POUND: Create a flowchart for a program that will require the user to input a value in kilogram (kg). The program will convert the inputted value into pounds (lbs.) and display its results on the screen.
16.
FLOWCHART SAMPLE 1: START kilo, pound display “EnterWeight in Kilogram:” input kilo pound = kilo * 2.2 display pound END The program is initiated. The variables kilo and pound are introduced to the program. The program displays the instruction “Enter Weight in Kilogram:” on screen. The program get an input from the user and store its value in the variable kilo. The program computes for the value of pound using the formula pound = kilo*2.2. The program displays the value of pound on the screen. The program is terminated.
17.
FLOWCHART PROBLEM 3: COMPUTINGFOR AREA: Create a flowchart for a program that will require the user to input the length and width of a rectangle. The program will compute for the area of the rectangle using the inputted length and with and display its results on the screen.
18.
FLOWCHART SAMPLE 1: START length, width,area display “Enter Length of the Rectangle:” input length display “Enter Width of the Rectangle:” input width A The program is initiated. The variables length, width, and area are introduced to the program as integers. The program displays the instruction “Enter Length of Rectangle: ” on screen . The program get an input from the user and store its value in the variable length. The program displays the instruction “Enter Width of Rectangle: ” on screen . The program get an input from the user and store its value in the width. The program will continue on the next part.
19.
FLOWCHART SAMPLE 1: A area =length * width display area END The program continues. The program computes for the value of area using the formula area = length*width. The program displays the value of area on the screen. The program is terminated.
20.
FLOWCHART PROBLEM 4: PLAYINGWITH NUMBERS: Create a flowchart for a program that will require the user to input four numbers. Using the inputs, the program will compute for: ▪ the sum of 1st and 2nd number, ▪ the product of the 3rd and 4th number ▪ the square of the 2nd number
21.
FLOWCHART SAMPLE 1: START a, b,c, d, sum, product, square display “Enter the First Number:” input a display “Enter the Second Number:” input b A The program is initiated. The variables a, b, c, d, sum, product, and square are introduced to the program. The program displays the instruction “Enter the First Number: ” on screen . The program get an input from the user and store its value in the variable a. The program displays the instruction “Enter the Second Number: ” on screen . The program get an input from the user and store its value in the b. The program will continue on the next part.
22.
FLOWCHART SAMPLE 1: display “Enterthe Third Number:” input c display “Enter the Fourth Number:” input d B The program continues. The program displays the instruction “Enter the Third Number: ” on screen . The program get an input from the user and store its value in the variable c. The program displays the instruction “Enter the Fourth Number: ” on screen . The program get an input from the user and store its value in the d. The program will continue on the next part. A
23.
FLOWCHART SAMPLE 1: B sum =a + b The program continues. The program computes for the value of sum using the formula sum = a + b. product = c * d The program computes for the value of product using the formula product = c*d. square = b * b The program computes for the value of square using the formula square = b*b. display sum The program displays the value of sum on the screen. display product The program displays the value of product on the screen. display square The program displays the value of square on the screen. END The program is terminated.
24.
FLOWCHART PROBLEM 5: PLAYINGWITH NUMBERS: Create a flowchart for a program that will require the user to input four numbers. Using the inputs, the program will compute for: ▪ the cube of the 1st number, ▪ the half of the 2nd number, ▪ the 20% of the 3rd number, ▪ The product of multiplying the 4th number by 100
25.
FLOWCHART SAMPLE 1: START display “Enter theFirst Number:” input a display “Enter the Second Number:” input b A The program is initiated. The variables a, b, c, d, cube, half, twentypercent, and times100 are introduced to the program. The program displays the instruction “Enter the First Number: ” on screen . The program get an input from the user and store its value in the variable a. The program displays the instruction “Enter the Second Number: ” on screen . The program get an input from the user and store its value in the b. The program will continue on the next part. a, b, c, d, cube, half, twentypercent, times100
26.
FLOWCHART SAMPLE 1: display “Enterthe Third Number:” input c display “Enter the Fourth Number:” input d B The program continues. The program displays the instruction “Enter the Third Number: ” on screen . The program get an input from the user and store its value in the variable c. The program displays the instruction “Enter the Fourth Number: ” on screen . The program get an input from the user and store its value in the d. The program will continue on the next part. A
27.
FLOWCHART SAMPLE 1: B cube =a*a*a The program continues. The program computes for the value of cube using the formula cube = a*a*a. half = b / 2 The program computes for the value of half using the formula half = b / 2. twentypercent = c * 0.20 The program computes for the value of twentypercent using the formula twentypercent = c*0.20. times100 = d * 100 The program computes for the value of times100 using the formula times100 = d*100. display cube The program displays the value of cube on the screen. display half The program displays the value of half on the screen. C The program will continue on the next part.
28.
FLOWCHART SAMPLE 1: CThe program continues. display twentypercent The program displays the value of twentypercent on the screen. display times100 The program displays the value of times100 on the screen. END The program is terminated.
29.
PRACTICE TEST 1: DOLLARTO PESO CONVERSION: Create a flowchart for a program that will require the user to input the amount in US Dollars. Using the inputted amount, the program will convert it to its Philippine Peso value and display the answer on the screen. Note: 1 US Dollar = Php 56.78
30.
PRACTICE TEST 2: COMPUTINGFOR AVERAGE Create a flowchart for a program that will require the user to input their grades in Mathematics, English, and Science. The program will compute for the average of the three grades and display its result on the computer screen.
31.
PRACTICE TEST 3: PLAYINGWITH NUMBERS: Create a flowchart for a program that will require the user to input four numbers. Using the inputs, the program will perform the following: ▪ display the 1st number, ▪ get the product of 1st and 3rd number, ▪ get the product of multiplying the 2nd number by the sum of the 3rd and 4th number, ▪ the average of the four numbers increased by 5.
32.
ALGORITHM AND FLOWCHARTING MR.ROWELL L. MARQUINA Tunasan National High School Senior High School Department Email Address: rowell.marquina001@deped.gov.ph sirrowellmarquina@gmail.com rmarquina@mitis.edu.ph