This document discusses fuzzy clustering and fuzzy c-means partition analysis on a subset of the Citescore dataset, involving 670 journals from various domains. It evaluates the clusterability of the dataset using the Hopkins statistic, identifies the best number of clusters as three based on multiple indices, and explores the time complexity of the algorithms. The study emphasizes the advantages of fuzzy clustering methods in handling data that belong to multiple clusters and presents validation measures for the clustering results.
![International Journal of Electrical and Computer Engineering (IJECE) Vol. 9, No. 4, August 2019, pp. 2760~2770 ISSN: 2088-8708, DOI: 10.11591/ijece.v9i4.pp2760-2770 2760 Journal homepage: http://iaescore.com/journals/index.php/IJECE Fuzzy clustering and Fuzzy C-Means partition cluster analysis and validation studies on a subset of CiteScore dataset K. Varada Rajkumar1 , Adimulam Yesubabu2 , K. Subrahmanyam3 1,3 Department of Computer Science and Engineering, Koneru Lakshmaiah Education Foundation, India 2 Department of Computer Science and Engineering, Sir C R Reddy College of Engineering, India Article Info ABSTRACT Article history: Received Apr 23, 2018 Revised Dec 15, 2018 Accepted Mar 11, 2019 A hard partition clustering algorithm assigns equally distant points to one of the clusters, where each datum has the probability to appear in simultaneous assignment to further clusters. The fuzzy cluster analysis assigns membership coefficients of data points which are equidistant between two clusters so the information directs have a place toward in excess of one cluster in the meantime. For a subset of CiteScore dataset, fuzzy clustering (fanny) and fuzzy c-means (fcm) algorithms were implemented to study the data points that lie equally distant from each other. Before analysis, clusterability of the dataset was evaluated with Hopkins statistic. The optimal clusters were determined using NbClust package, where it is evidenced that 9 various indices proposed 3 cluster solutions as best clusters. Further, appropriate value of fuzziness parameter m was evaluated to determine the distribution of membership values with variation in m from 1 to 2. Coefficient of variation (CV), also known as relative variability was evaluated to study the spread of data. The time complexity of fuzzy clustering (fanny) and fuzzy c-means algorithms were evaluated by keeping data points constant and varying number of clusters. Keywords: Citescore Clustering Fanny FCM Fuzzy c-means Time complexity Validation Copyright © 201x Institute of Advanced Engineering and Science. All rights reserved. Corresponding Author: K. Varada Rajkumar, Department of Computer Science and Engineering, Sir C R Reddy College of Engineering, Eluru, W G Dt, Andhra Pradesh, India. Email: varadarajkumar18@gmail.com 1. INTRODUCTION Cluster analysis is a method to classify data for a given set of objects into a set of classes based on similar features. Main goal of clustering is to divide the dataset into clusters representing similar objects to same cluster and dissimilar objects to different clusters [1]. Gradual memberships of data points to clusters in [0, 1] can be assigned by using Fuzzy cluster analysis. Assigning data points which belong to many numbers of clusters (more than one at a given point of time) will be the result. Traditional clustering methods do not represent this feature and entails uncertainty with which data are assigned to the different classes [2]. A superior standard of detail of the data model is offered by this cluster analysis. The details about the extent of ambiguity or definiteness to which a data point belongs to a cluster can be found by this membership degree. Such membership degrees are validated by the interpretation of fuzzy sets [3] to the different clusters are calculated from the separation of the data point with the cluster centre, the degrees of membership to which a given data point belongs to can be calculated. (i.e., the dissimilarity) with respect to the shape and the size of the cluster [4]. Fuzzy sets are functions. They are the generalization of characteristic functions of classical sets. The membership of the set with ‘1’ is given by the characteristic functions, and the membership of the set is 0, if the given element is’nt a member of the set. All the degrees belonging in [0, 1] are allowed by the Fuzzy sets. The first researcher who proposed fuzzy sets usage in clustering is Ruspini [5] in the year 1969.](https://image.slidesharecdn.com/6312908-200824093725/75/Fuzzy-clustering-and-fuzzy-c-means-partition-cluster-analysis-and-validation-studies-on-a-subset-of-citescore-dataset-1-2048.jpg)
![Int J Elec & Comp Eng ISSN: 2088-8708 Fuzzy clustering and Fuzzy C-Means partition cluster analysis and validation… (K. Varada Rajkumar) 2761 In the form of an objective function, a better fuzzy partition and cluster prototypes are found by the Fuzzy methods. The clustering work can then be reformulated as a function optimization problem. The cluster prototypes and the memberships of data points are the basis for the objective function to the clusters. Many fuzzy clustering ways have been proposed due to modifications of the objective functions, which aims at improving the result with respect to noise, outliers etc [6]. Fuzzy C-Means (FCM) clustering is an unsupervised technique that classifies the image by grouping similar data points in the feature space into clusters [7]. Fuzzy c-means clustering to frame the clusters in the dataset. The optimal and equalized clusters are generated by the FCM algorithm [8]. In this task, fuzzy clustering algorithm followed by fuzzy c-means (FCM) algorithm are implemented on a subset of data which is derived from CiteScore database. A note specifying the number of clusters to search for the prior analysis has been presented. 2. RESEARCH METHOD a. Dataset A dataset of 670 journals were selected as dataset in this study. The dataset included in analysis has data regarding CiteScore, percentile, citation count, percent cited, SNIP, SJR respectively. Apart from this, publisher data was also included. Before finalizing dataset, a filtered search was performed on 22,618 journal titles for which CiteScore was evaluated. A preliminary broad search employing term such as “Computer Science”, with at least “250 documents” in any journal with inclusion of open access titles resulted in 670 journals. b. CiteScore The use of CiteScore is to measure the reference (citation) impact of the serial titles such as in journals. Serial titles publish at uniform intervals (i.e. one or more number of volumes per year). CiteScore is used to calculate the average number of references (citations) in the journal per year by comparing it with those of preceding three year CiteScore. CiteScore metrics are calculated from Scopus Data. Trade journals, journals, book series and conference proceedings are the kinds of serial data available. However, only journal titles are selected for the study. c. Assessing the clusterability - Hopkins statistic The function get_clust_tendency() in factoextra shall be used to assess whether the dataset can be clustered. Computing Hopkins statistic is a way to achieve this. The ‘clustering tendency’ of a dataset is assessed by Hopkin statistics. We can reject the null hypothesis if the value of Hopkin statistics is almost zero. We can conclude that the dataset is significantly a clusterable data. d. Determining optimal clusters A cluster validity package namely NbClust was used to estimate the number of clusters in a dataset. NbClust contains nearly 30 various validity indices. The aim of NbClust is to gather all the available indices. Different clusters of data are produced by different clustering algorithms. Sometimes, the final clustering partitions may vary greatly even with the same algorithm having a variation in the presentation order of the data or parameters. There can be any number of clusters in the range 2-8. The distance metric is set to "euclidean". Some other distance metrics are "minkowski", "maximum", "camberra", "manhattan", and "binary". The agglomeration method for hierarchical clustering is set to "ward.D2". Other methods such as "ward.D", "complete", "single", "mcquitty", "average", "median" or "centroid" can also be selected. e. Soft clustering Soft partitions of data are naturally given out as output by some clustering algorithms like as EM [9] and fuzzy cmeans [10]. The degree of relation (association) of each instance to each output cluster can be assigned a value by soft partition. Pedrycz created a milestone on “collaborative” fuzzy clustering by working on it [11]. Pedrycz considered a vertical partitioning scenario. He then represented the association of multiple partitioning via pair wise interaction coefficients. This resulted in the increase in the cost function to include the effect of association in optimization process. f. Fanny FANNY, derives its name from Fuzzy ANalYsis. Fanny aims to minimize the objective function. SUM_[v=1..k] (SUM_(i,j) u(i,v)^r u(j,v)^r d(i,j)) / (2 SUM_j u(j,v)^r) Where n is the number of observations, k is the number of clusters, r is the membership exponent memb.exp d(i,j) is the dissimilarity between observations i and j. If r -> 1 gives increasingly crisper clustering’s whereas r -> ∞ leads to complete fuzziness.](https://image.slidesharecdn.com/6312908-200824093725/75/Fuzzy-clustering-and-fuzzy-c-means-partition-cluster-analysis-and-validation-studies-on-a-subset-of-citescore-dataset-2-2048.jpg)
![ ISSN: 2088-8708 Int J Elec & Comp Eng, Vol. 9, No. 4, August 2019 : 2760 - 2770 2762 Compared to other fuzzy clustering methods, fanny has the following features: (a) It also accepts a dissimilarity matrix; (b) It is more robust to the spherical cluster assumption; (c) It provides a novel graphical display, the silhouette plot. g. Validation To assess whether fanny resulted in better clusters, validation on clusters should be carried out. Hence, clValid package was used where it offers internal and stability validation procedures. Only the clustering partition and the dataset are considered as input by internal validation. Intrinsic information in the data is used to assess the quality of clustering. The stability measures evaluate the consistency of a clustering result. It is done by comparing clustering result with the clusters obtained after each column is removed, one at a time, a leave-one-out method. h. Internal validation Internal validation is a measure of the connectedness compactness and separation of the cluster partitions. The extent to which, observations are placed in the same cluster as their nearest neighbors in the data space is referred to as connectedness [12]. Compactness, referred by Dunn index [13], assesses the homogeneity of a cluster. This is usually done by looking at the intra-cluster variance. Separation, referred by silhouette width [14], measures the degree of separation between the clusters. This is usually done by measuring the distance between the centroids of the clusters. i. Stability validation Let the total number of observations (rows) in a dataset be N and the total number of columns be M. Then the clustering results will be compared by the stability measures based on the full data to perform clustering versus based on leaving one column, one at a time [15]. The average distance between the means (ADM), the average proportion of non-overlap (APN), and the figure of merit (FOM), the average distance (AD), are the stability measures. j. Fuzzy C-Means (FCM) Fuzzy C- is a clustering method which allows one point to belong to one or more than one clusters. Dunn developed this method in 1973 and Bezdek improved it in the year 1981. It is often used in pattern recognition. A finite collection of points is partitioned into a collection of C fuzzy clusters on the basis of given criteria is done by the FCM algorithm. Thus, the points lying on the edge of a cluster, may be in the cluster to a lesser degree than points lying in the centre of cluster. Based on minimization of the following objective function the FCM algorithm is derived: 1,µaµ, 2 1 1 maxJ ij c i n j m ijm Fuzzy c-means (FCM) is the best fuzzy clustering method known [16]. Fuzzy logic is used so that each instance is associated not only with a single cluster but also has a certain degree of membership with each of the centroids that exist. The fuzziness of the solution becomes closer to 1 as m goes closer to infinity (∞). The solution becomes increasingly similar to the clustering of binary k-means [17]. Setting m=2.0 is a good choice [18]. Ruspini Fuzzy clustering theory is the base for FCM clustering algorithm. On the basis of distance between various input data points, analysis is carried out by this algorithm. Basing on the distance between data points and the cluster centres the clusters are formed. Grouping of dataset into n clusters with each and every data point in the dataset being related to every cluster is done by using the FCM data clustering technique [19]. The data point will have a high low degree of connection with the cluster whose centre of the cluster is lying far away from it and will have high degree of connection if the cluster centre is closer to it. k. Validation: Fuzzy C-Means (FCM) Cluster validity indices are objective functions. The cluster validity indices are used to obtain clustering indices, and clustering solution [20]. Validation measures such as "partition. coefficient", "gath. geva", "fukuyama. sugeno" "xie. beni", “partition entropy”,"separation. index" were obtained by running e1071 cluster package. Gath and Geva [21] adopted three measures such as average partition density (APD), fuzzy hyper volume (FHV) and partition density (PD). The Xie-Beni index (XB) [22] defined inter- cluster separation as the square of the minimum distance between the centers of the clusters. They defined the intra-cluster compactness as the square of the mean gap (distance) between each data object and its cluster center. When the minimum of XB is found the optimal cluster number is said to be reached. Two properties of clustering are computed by using Fukuyama-Sugeno index (FS). They are cohesion and separation. The aim of enhancing of this objective function is to decrease the separation between clusters of a data set and increase the compactness of a certain cluster. A good partition is proposed](https://image.slidesharecdn.com/6312908-200824093725/75/Fuzzy-clustering-and-fuzzy-c-means-partition-cluster-analysis-and-validation-studies-on-a-subset-of-citescore-dataset-3-2048.jpg)
![Int J Elec & Comp Eng ISSN: 2088-8708 Fuzzy clustering and Fuzzy C-Means partition cluster analysis and validation… (K. Varada Rajkumar) 2763 by the minimum values of this index. The fuzziness of the partition is measured by partition coefficient index but without taking into consideration the dataset itself. It is a kind of trail and error method since it has no connection to any property of the data. A good partition is implied by maximum values in the meaning of a least fuzzy clustering. Information about the membership matrix is provided by partition entropy index, without also considering the data itself. A good partition is implied by the minimum values in the meaning of a more crisp partition. Separation index (CS Index) identifies unique cluster structure with well-defined features that depend on the data and a measure of seperation. Information about the membership matrix is provided by partition entropy index, without also considering the data itself. A good partition is implied by the minimum values in the meaning of a more crisp partition. Separation index (CS Index) identifies unique cluster structure with well-defined features that depend on the data and a measure of seperation. 3. RESULTS AND ANALYSIS If a fuzzy clustering technique is to be employed in an application oriented task to significantly cluster groups of objects, then the first aspect to encounter is assessing clustering tendency. To achieve better results in cluster analysis, data has been investigated for clusterability. Hence, a method put forward by Banerjee et al [23] such as Hopkins statistic assesses clustering tendency of a dataset. This is measured by calculating the probability of uniform data distribution or otherwise the ‘spatial randomness’ of the data. A value of Hopkins statistic close to zero represents the null hypothesis being rejected and the dataset represents significant clusterability. The citescore dataset considered in the analysis resulted in Hopkins statistic of 0.4371, a value < 0.5, indicating that the data is highly clusterable. a. NBClust From NbClust analysis, the result given below signifies that around 9 various indices proposed 3 cluster solutions as best clusters and 4 proposed 2 solutions and 8 validity indices suggested 10 clusters. According to the majority rule, the best number of clusters is 3 cluster groups. ************************************************************************************** * Among all indices: * 4 proposed 2 as the best number of clusters * 9 proposed 3 as the best number of clusters * 1 proposed 4 as the best number of clusters * 1 proposed 5 as the best number of clusters * 2 proposed 7 as the best number of clusters * 1 proposed 8 as the best number of clusters * 1 proposed 9 as the best number of clusters * 8 proposed 10 as the best number of clusters * According to the majority rule, the best number of clusters is 3 ************************************************************************************** b. Hubert index The Hubert index is a graphical method of determining the number of clusters. In the plot of Hubert index, a significant knee was observed at 3rd cluster that corresponds to a significant increase of the value of the measure i.e the significant peak in Hubert index second differences plot as shown in Figure 1. Figure 1. Hubert index c. D-index The D index is a graphical method of determining the number of clusters. In the plot of D index, a significant knee (the significant peak in Dindex second differences plot) observed at 3rd cluster that corresponds to a significant increase of the value of the measure as shown in Figure 2. From the Figure 3 and](https://image.slidesharecdn.com/6312908-200824093725/75/Fuzzy-clustering-and-fuzzy-c-means-partition-cluster-analysis-and-validation-studies-on-a-subset-of-citescore-dataset-4-2048.jpg)
![ ISSN: 2088-8708 Int J Elec & Comp Eng, Vol. 9, No. 4, August 2019 : 2760 - 2770 2764 NbClust output in Table 1, it can be concluded that the optimal number of clusters, for the dataset comprising of citescore bibliometric dataset was found to be 3 cluster solutions. Therefore, initial value of k=3 was used to perform fuzzy clustering analysis. Figure 2. D-index Figure 3. Consensus on optimal number of clusters obtained from NbClust package Table 1. NBCLUST Output d. Fanny A subset data comprising of 26 objects were subjected to fuzzy clustering (fanny) algorithm and the data was scaled to convert into a data frame, provided k=3 as desired number of clusters. The run resulted in cluster as well as silhouette plots. As per Ruspini [5], the data points in the centre of the cluster can have a degree equal to 1 and are associated with the membership degrees to the nearby clusters. Certain points near the boundary of the cluster were identified among clusters 1 and 2 respectively. From Figure 4, point 16 of cluster 1 and point 4 of cluster 2 have a chance to appear in either of the clusters. From the membership coefficient data given below, it can be found that only point 16 lies between cluster 1 and 2 (with coefficients 43 and 39) sharing 50% characteristics whereas point 4 has more cluster-2 significance than cluster 1 which is found from coefficients being 73 for cluster-2 and 20 for cluster-1. Membership coefficients (in %, rounded) as shown in Table 2.](https://image.slidesharecdn.com/6312908-200824093725/75/Fuzzy-clustering-and-fuzzy-c-means-partition-cluster-analysis-and-validation-studies-on-a-subset-of-citescore-dataset-5-2048.jpg)
![Int J Elec & Comp Eng ISSN: 2088-8708 Fuzzy clustering and Fuzzy C-Means partition cluster analysis and validation… (K. Varada Rajkumar) 2765 Figure 4. Fanny output showing 3 clusters Table 2. Membership coefficients [,1] [,2] [,3] [,1] [,2] [,3] [1,] 73 19 8 [14,] 60 19 21 [2,] 85 10 5 [15,] 11 69 20 [3,] 18 71 10 [16,] 43 39 19 [4,] 20 73 7 [17,] 10 68 22 [5,] 12 79 9 [18,] 6 8 86 [6,] 68 20 12 [19,] 2 4 93 [7,] 11 82 8 [20,] 7 19 75 [8,] 9 83 8 [21,] 5 15 80 [9,] 76 15 9 [22,] 2 3 95 [10,] 7 89 5 [23,] 1 3 96 [11,] 6 89 5 [24,] 2 4 94 [12,] 26 57 17 [25,] 2 5 93 [13,] 10 56 33 [26,] 4 6 90 e. Fanny output Tables 3-6 presents about Fanny output. Table 3. Fuzzy clustering objects of class ‘fanny’ Fuzzy Clustering Objects of Class ‘fanny’ m.ship.expon 2 Objective 10.15785 Tolerance 1e-15 Iterations 299 Converged 1 Maxit 500 n 26 Table 4. Fuzzyness coefficients dunn_coeff Normalized 0.4324369 0.1486554 Table 5. ATTR (“SCALED:CENTER) CiteScore Count SNIP SJR 18.631538 10066.576923 6.313346 10.740308 Table 6. ATTR (,"SCALED:SCALE") CiteScore Count SNIP SJR 9.687746 15622.344869 3.314119 7.473616 f. Fuzzy C-Means The fuzzy c-means program written in R was run using default parameters with maximum number of iterations fixed to 100, distance measure being euclidean, k=3 as initial centroids, and data frame as input. However, the fuzziness parameter, m depends on the dataset and variations of objects within the dataset. In literature, many works fixed m=2, which allowed computation of µij. Therefore, we intended to evaluate the appropriate value of m for citescore subset dataset starting from m=1, which resulted in failure of FCM to extract any clustering solution. Further, gradual increase from m=1.1 till 1.5 resulted in relatively low membership values suggesting that FCM failed to associate any citescore value to any cluster with k=3. Appropriate value of m It was reported by Bezdek, [17] that when m goes to infinity, value of µij attains 1/K, which suggests that for a given dataset, at a particular value of m and above which the membership values obtained from fuzzy c-means equals to 1/K. It should be noted that the membership values µij depend on the distances between citescore objects and cluster centroids. For a complex dataset, it is approximated that the cluster centroids appear close to the objects of a dataset. This raises probability that when m varies, the FCM membership values and coefficient of variation (CV) of the set of distances between objects also vary [24]. Therefore, FCM algorithm was run to determine the distribution of membership values with variation in m from 1 to 2. The program iteratively updates the cluster centres and the membership values for each data point, which moves the cluster centres to an appropriate location within a data set. The iteration minimizes the objective function which represents the distance from any given data point to the cluster centre. The obtained data is given in Table 7 and the membership plots are given in Figure 5. The coefficient of variation (CV), also known as relative variability, equals the standard deviation divided by the mean. It is a measure of spread that describes the amount of variability relative to the mean. In general, the lower the ratio](https://image.slidesharecdn.com/6312908-200824093725/75/Fuzzy-clustering-and-fuzzy-c-means-partition-cluster-analysis-and-validation-studies-on-a-subset-of-citescore-dataset-6-2048.jpg)
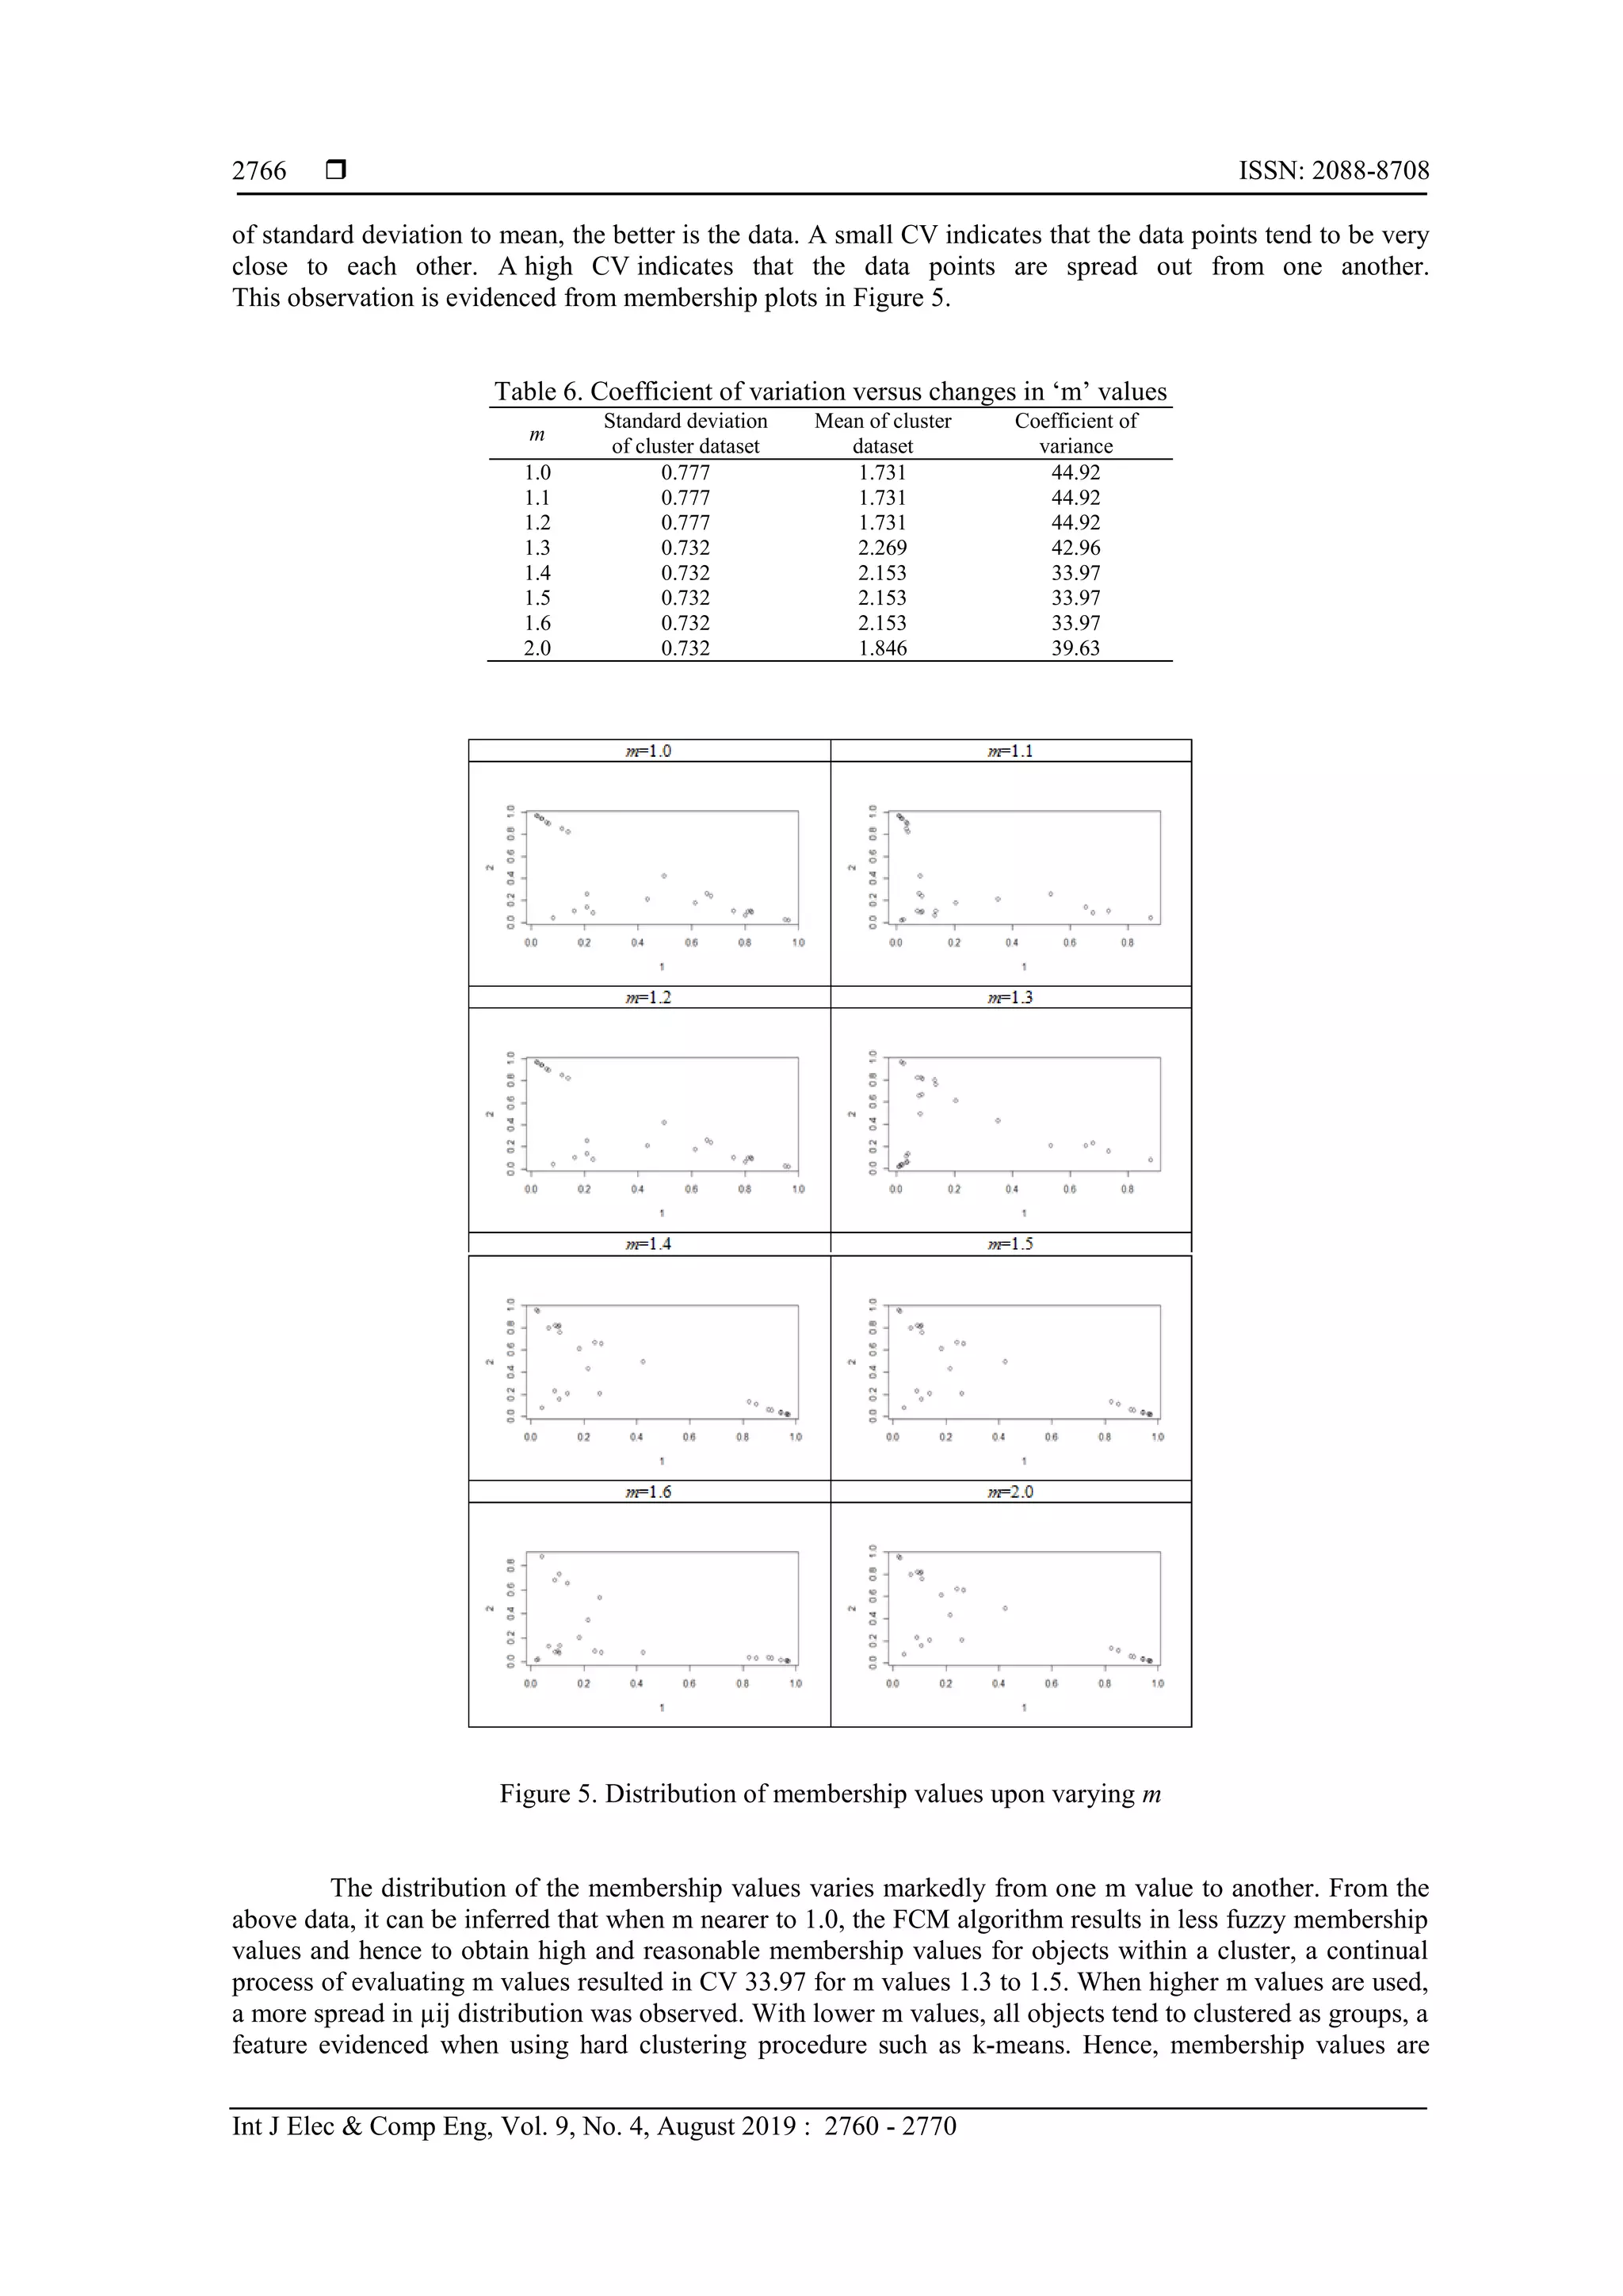
![Int J Elec & Comp Eng ISSN: 2088-8708 Fuzzy clustering and Fuzzy C-Means partition cluster analysis and validation… (K. Varada Rajkumar) 2767 plotted for clusters obtained from FCM algorithm and observation of plots in Fig. 3 suggests that a fine distribution of data was evidenced when m=1.6 and m=2.0. Thus, the selected value for m=2.0 showed more distribution of data. Nearly 5 runs of FCM algorithm for each m was performed, and the membership values and centroids corresponding to the lowest value was reported, which allowed to scan the entire data space for best outcome. g. FCM output Fuzzy c-means clustering with 3 clusters as shown in Table 8 and 9. From the output of membership coefficients and Fig. 6, it is observed that point 13 appears to be associated with the equi membership vector (0.42 and 0.49) between cluster 1 and cluster2 respectively. Comparison of output clusters from fanny and fuzzy c-means reported in Fig. 4 and 6 suggest that FCM outperforms the method. It should be noted that object 16 belongs to cluster1 in fanny whereas it appeared under cluster-2. Table 8. Cluster centres Citescore Count SNIP SJR 1 0.4351629 -0.4594609 0.6589130 0.2602495 2 1.1223955 1.7159599 0.1394195 0.9156109 3 -0.9677277 -0.3844464 -0.8681554 -0.8074940 Table 9. Memberships 1 2 3 1 2 3 [1,] 0.08975023 0.680169994 0.23007978 [14,] 0.25828359 0.534040262 0.20767615 [2,] 0.04052149 0.879051443 0.08042707 [15,] 0.24099783 0.087734834 0.67126734 [3,] 0.10766629 0.135105057 0.75722865 [16,] 0.21537091 0.350244051 0.43438504 [4,] 0.06713259 0.131599971 0.80126744 [17,] 0.26534923 0.077211872 0.65743890 [5,] 0.10105010 0.089192260 0.80975764 [18,] 0.89729461 0.037845149 0.06486024 [6,] 0.13783684 0.654451299 0.20771186 [19,] 0.97268473 0.007618149 0.01969712 [7,] 0.09094683 0.084667884 0.82438529 [20,] 0.82357384 0.040067803 0.13635836 [8,] 0.10525986 0.073075931 0.82166421 [21,] 0.85187495 0.033754744 0.11437030 [9,] 0.10639560 0.732322982 0.16128142 [22,] 0.96482567 0.011124273 0.02405005 [10,] 0.02687498 0.023996248 0.94912877 [23,] 0.96780975 0.009855446 0.02233481 [11,] 0.02078841 0.016760549 0.96245104 [24,] 0.94393379 0.019411553 0.03665465 [12,] 0.18145613 0.205332635 0.61321123 [25,] 0.94339514 0.017418952 0.03918591 [13,] 0.42270327 0.081091918 0.49620481 [26,] 0.91062372 0.033043802 0.05633248 Figure 6. Image showing FCM output h. Time complexity The time complexity [25] of fuzzy clustering (fanny) and fuzzy c-means algorithms were evaluated by keeping data point’s constant and varying number of clusters. The details were presented in Table 10. Table 10. Time complexity analysis of fanny and FCM algorithms Algorithm Number of clusters (k) Executed time in secs Algorithm Number of clusters (k) Executed time in secs Fanny 1 0.74 FCM 1 0.72 2 0.79 2 0.76 3 0.81 3 0.76 4 0.82 4 0.79](https://image.slidesharecdn.com/6312908-200824093725/75/Fuzzy-clustering-and-fuzzy-c-means-partition-cluster-analysis-and-validation-studies-on-a-subset-of-citescore-dataset-8-2048.jpg)
![ ISSN: 2088-8708 Int J Elec & Comp Eng, Vol. 9, No. 4, August 2019 : 2760 - 2770 2768 i. Assessing quality of clusters On the other hand, validity of fuzzy clustering was proposed by Gath and Geva (1989) [21] in applications to mixtures of normal distributions. Distributed hierarchical cluster validity was proposed by Xie and Beni [26]. In general, the clusters are not crisp in nature, for example, an object in one cluster may not absolutely belong to a particular cluster and however, it may contain the property of other cluster. Hence, introduction of fuzziness concept would generate soft clustering of objects rather employing hard clustering methods such as k-means, PAM etc. Here, we employed two fuzzy clustering models such as fanny [27], fuzzy c-means (FCM) [28] techniques to cluster and find out the variability among these methods. j. Validation 1. Fanny – internal validation Internal validation measures include, compactness, connectedness and separation of the cluster partitions. They are otherwise referred as Connectivity, Silhouette width and Dunn index. The program resulted in the following output where all the three measures are within the specified limits as shown in Table 11. Table 11. Internal validation data and their values output from the program CL valid Internal Validation Indexes Value Connectivity 12.6222 Dunn 0.1843 Silhouette 0.4210 2. Fanny – stability valdation The stability measures are calculated using APN, AD, ADM, and FOM. All measures should result in minimum values. These methods take computation time due to the fact that the program re-clusters a dataset by omitting single column. The output of the program is given in Table 12. It can be observed from the output data as shown in Tables 11 and 12 that all internal and stability measures are within the limits. Table 12. Stability validation methods and respective scores of each method signifying acceptable limits Validation method Score APN 0.1182984 AD 1.5048444 ADM 0.3834056 FOM 0.8069575 3. Validation: fuzzy c-means (FCM) The values of the indexes can be independently used in order to evaluate and compare clustering partitions or even to determine the number of clusters existing in a data set as shown in Tables 13 and 14. It is therefore understood that all validation parameters are within the limits. Table 13. Estimated GATH and GEVA cluster validity measures of citescore subset data set with K=2,3,4 and M=2 Cluster size FHV DPA DP 2 0.7455 15.744 11.165 3 1.0943 15.805 6.819 4 1.326 14.003 6.578 Table 14. Estimated cluster validity indexes of citescore subset data set with K=2,3,4 and M=2 Cluster size XB FS PC PE SI 2 0.011 -23.894 0.719 0.437 0.193 3 0.006 -44.194 0.687 0.570 0.221 4 0.033 -40.116 0.568 0.814 0.221](https://image.slidesharecdn.com/6312908-200824093725/75/Fuzzy-clustering-and-fuzzy-c-means-partition-cluster-analysis-and-validation-studies-on-a-subset-of-citescore-dataset-9-2048.jpg)
![Int J Elec & Comp Eng ISSN: 2088-8708 Fuzzy clustering and Fuzzy C-Means partition cluster analysis and validation… (K. Varada Rajkumar) 2769 4. CONCLUSION Cluster analysis initiated on a subset of citescore dataset using fuzzy clustering and fuzzy c-means algorithm resulted in appearance of equidistant points in the boundary of clusters which is evidenced from membership degrees of each cluster data point. Time complexity analysis revealed that FCM performs much faster than fuzzy method. Further, all internal and stability measure procedures of fuzzy clustering and all validity indexes of FCM are found to be within the limits. REFERENCES [1] Babu, G.P., Murty, M.N, “Clustering with evolution strategies,” Pattern Recognition, Vol. 27, pp.321–329, 1994. [2] Bezdek, J.C., Keller, J., Krishnapuram, R., Pal, N.R, “Fuzzy Models and Algorithms for Pattern Recognition and Image Processing,” The Hand books of Fuzzy Sets, Vol. 4 Kluwer, Boston and London, 1999. [3] Zadeh. L.A, “Fuzzy sets,” Information and Control, Vol. 8, Iss. 3, pp.338–353, 1965. [4] Döring, C., Borgelt, C., Kruse R, “Fuzzy clustering of quantitative and qualitative data,” Fuzzy Information, Processing NAFIPS ‘04, IEEE, PP.84-89. [5] Ruspini, E.H, “A new approach to clustering,” Information and Control, Vol. 15 Issue 1, pp.22–32, 1969. [6] Davé, R, “Characterization and detection of noise in clustering,” Pattern Recognition Letters, Vol. 12, pp.657–664, 1991. [7] Joonsung Park, Doo Heon Song, Hosung Nho, Hyun-Min Choi, Kyung-Ae Kim, Hyun Jun Park, Kwang Baek Kim, “Automatic Segmentation of Brachial Artery based on Fuzzy C-Means Pixel Clustering from Ultrasound Images,” International Journal of Electrical and Computer Engineering (IJECE) Vol. 8, No. 2, pp. 638-643, 2018. [8] Amit Kr. Kaushik, “A Hybrid Approach of Fuzzy C-Means Clustering and Neural Network to Make Energy Efficient Heterogeneous Wireless Sensor Network,” International Journal of Electrical and Computer Engineering (IJECE) Vol. 6, No. 2, pp. 674-681, 2016. [9] Dempster A, Laird N and Rubin D, “Maximum likelihood from incomplete data via the em algorithm,” Journal of the Royal Statistical Society, Vol. 39 Series B, pp.1–38, 1977. [10] Dunn JC, “A fuzzy relative of the iso-data process and its use in detecting compact well-separated clusters,” Journal of Cybernetics, Vol- 3, pp.32–57, 1973. [11] Pedrycz W, “Collaborative fuzzy clustering,” Pattern Recognition Letters, Vol. 23, Issue 14, pp.1675–86, 2002. [12] Handl J, Knowles J, Kell DB, “Computational Cluster Validation inPost-Genomic Data Analysis,” Bioinformatics, Vol. 21 Issue 15, pp.3201–12, 2005. [13] Dunn JC, “Well Separated Clusters and Fuzzy Partitions,” Journal on Cybernetics, Vol. 4, pp.95–104, 1974. [14] Rousseeuw PJ, “Silhouettes: A Graphical Aid to the Interpretation and Validation of Cluster Analysis,” Journal of Computational and Applied Mathematics, 20, pp.53–65, 1987. [15] Yeung KY, Haynor DR, Ruzzo WL, “Validating Clustering for GeneExpression Data,” Bioinformatics, Vol. 17 Issue 4, pp.309–18, 2001. [16] Zadeh.L.A, “Fuzzy sets and systems,” International Journal of General Systems, Vol. 17, pp.129-138, 1965. [17] Bezdek.J.C, “Pattern Recognition with Fuzzy Objective Function Algorithms,” Plenum Press, New York, 1981. [18] Nikhil R. Pal, James C. Bezdek, and Richard J. Hathaway, “Sequential Competitive Learning and the Fuzzy c-Means Clustering Algorithms,” Neural Networks, Vol. 9, No. 5, pp. 787-796, 1996. [19] Chen.S, Zhang.D, “Robust image segmentation using FCM withspatial constraints based on new kernel-induced distance measure,” IEEE Transactions on Systems, Man and Cybernetics, Vol. 34, pp.1907-1916, 1998. [20] Sengupta.S, S. De, Konar.A and Janarthanan.R, “An improved fuzzy clustering method using modified Fukuyama- Sugeno cluster validity index,” Internationa Conference on Recent Trends in Information Systems, Kolkata, pp. 269-274, 2011. [21] Gath, I., Geva, A.B, “Unsupervised optimal fuzzy clustering,” IEEETransactions on Pattern Analysis and Machine Intelligence, Vol. 11, pp.773–781, 1989. [22] Xie. X.L., Beni.G, “A validity measure for fuzzy clustering,” IEEE PAMI, Vol. 13, No. 8, pp. 841–847, 1991. [23] Banerjee A, Dave RN, “Validating clusters using the Hopkins Statistic,” Fuzzy Systems, Proceedings 2004 IEEE international conference, Vol. 1, pp.149-153, 2004. [24] Doulaye Dembel, Philippe Kastner, “Fuzzy C-means method for clustering microarray data,” Bioinformatis, 19(8), pp.973-980, 2003. [25] Lim, A., Tjhi, W, “R High Performance Programming,” Packet Publishing Ltd, 2015. [26] Xie. X.L., Beni.G, “Distributed hierarchical decision fusion with cluster validity,” in Proceedings IEEE International Conference, Syst. Man Cybern, pp. 689-694, 1990. [27] Kaufman, L., Rousseeuw, P.J, “Finding Groups in Data: An Introduction to Cluster Analysis,” Wiley, New York, 1990. [28] Bezdek, James C., Robert Ehrlich, and William Full, “FCM: The fuzzyc-means clustering algorithm,” Computers & Geosciences, Vol. 10, No. 2-3, pp.191-203, 1984.](https://image.slidesharecdn.com/6312908-200824093725/75/Fuzzy-clustering-and-fuzzy-c-means-partition-cluster-analysis-and-validation-studies-on-a-subset-of-citescore-dataset-10-2048.jpg)