
Table of Contents
15 为 VMware 创建自定义性能计数器名称
概述
VMware 性能计数器路径具有 group/counter[rollup] 格式:
group- 性能计数器组,例如 cpucounter- 性能计数器名称,例如 usagemhzrollup- 性能计数器汇总类型,例如 average
所以上面的例子会给出以下计数器路径: cpu/usagemhz[average]
性能计数器组描述、计数器名称和汇总类型可以在 VMware 文档中找到。
可以通过使用 Zabbix 中的脚本监控项来获取内部名称并创建自定义性能计数器名称。
配置
- 使用以下参数在主要的VMware主机(存在 eventlog[] 监控项的地方)上创建禁用的脚本监控项:
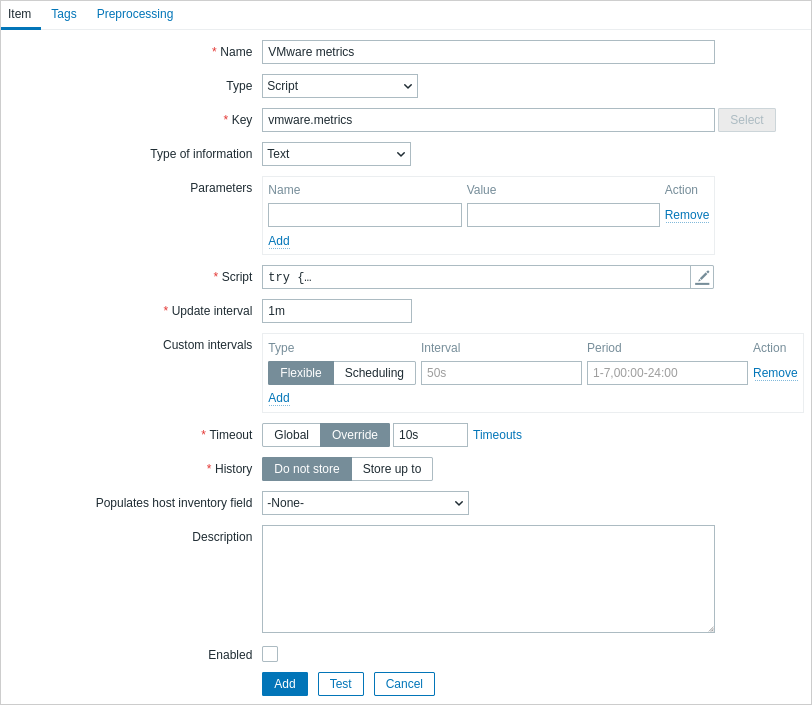
- Name: VMware 指标
- Type: 脚本
- Key: vmware.metrics
- Type of information: 文本
- Script: 复制并粘贴下面提供的 脚本
- Timeout: 10
- History: 不存储
- Enabled: 未标记
脚本
try { Zabbix.log(4, 'vmware metrics script'); var result, resp, req = new HttpRequest(); req.addHeader('Content-Type: application/xml'); req.addHeader('SOAPAction: "urn:vim25/6.0"'); login = '<soapenv:Envelope xmlns:soapenv="http://schemas.xmlsoap.org/soap/envelope/" xmlns:urn="urn:vim25">\ <soapenv:Header/>\ <soapenv:Body>\ <urn:Login>\ <urn:_this type="SessionManager">SessionManager</urn:_this>\ <urn:userName>{$VMWARE.USERNAME}</urn:userName>\ <urn:password>{$VMWARE.PASSWORD}</urn:password>\ </urn:Login>\ </soapenv:Body>\ </soapenv:Envelope>' resp = req.post("{$VMWARE.URL}", login); if (req.getStatus() != 200) { throw 'Response code: '+req.getStatus(); } query = '<soapenv:Envelope xmlns:soapenv="http://schemas.xmlsoap.org/soap/envelope/" xmlns:urn="urn:vim25">\ <soapenv:Header/>\ <soapenv:Body>\ <urn:RetrieveProperties>\ <urn:_this type="PropertyCollector">propertyCollector</urn:_this>\ <urn:specSet>\ <urn:propSet>\ <urn:type>PerformanceManager</urn:type>\ <urn:pathSet>perfCounter</urn:pathSet>\ </urn:propSet>\ <urn:objectSet>\ <urn:obj type="PerformanceManager">PerfMgr</urn:obj>\ </urn:objectSet>\ </urn:specSet>\ </urn:RetrieveProperties>\ </soapenv:Body>\ </soapenv:Envelope>' resp = req.post("{$VMWARE.URL}", query); if (req.getStatus() != 200) { throw 'Response code: '+req.getStatus(); } Zabbix.log(4, 'vmware metrics=' + resp); result = resp; logout = '<soapenv:Envelope xmlns:soapenv="http://schemas.xmlsoap.org/soap/envelope/" xmlns:urn="urn:vim25">\ <soapenv:Header/>\ <soapenv:Body>\ <urn:Logout>\ <urn:_this type="SessionManager">SessionManager</urn:_this>\ </urn:Logout>\ </soapenv:Body>\ </soapenv:Envelope>' resp = req.post("{$VMWARE.URL}",logout); if (req.getStatus() != 200) { throw 'Response code: '+req.getStatus(); } } catch (error) { Zabbix.log(4, 'vmware call failed : '+error); result = {}; } return result;配置监控项后,点击 Test 按钮,然后点击 Get value。
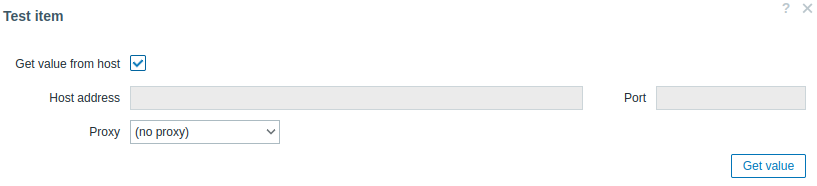
将收到的 XML 复制到任何 XML 格式化程序并找到所需的指标。
一个指标的 XML 示例:
<PerfCounterInfo xsi:type="PerfCounterInfo"> <key>6</key> <nameInfo> <label>Usage in MHz</label> <summary>CPU usage in megahertz during the interval</summary> <key>usagemhz</key> </nameInfo> <groupInfo> <label>CPU</label> <summary>CPU</summary> <key>cpu</key> </groupInfo> <unitInfo> <label>MHz</label> <summary>Megahertz</summary> <key>megaHertz</key> </unitInfo> <rollupType>average</rollupType> <statsType>rate</statsType> <level>1</level> <perDeviceLevel>3</perDeviceLevel> </PerfCounterInfo>使用 XPath 从收到的 XML 中提取计数器路径。对于上面的示例,XPath 将是:
| 字段 | xPath | 值 |
|---|---|---|
| group | //groupInfo[../key=6]/key | cpu |
| counter | //nameInfo[../key=6]/key | usagemhz |
| rollup | //rollupType[../key=6] | average |
在这个例子中性能计数器路径是: cpu/usagemhz[average]