
Table of Contents
创建一个 widget (tutorial)
这是一个分步教程,展示如何create一个简单的仪表板小部件。 您可以下载此小部件的所有文件作为ZIP存档:lesson_gauge_chart.zip。
你将构建的内容
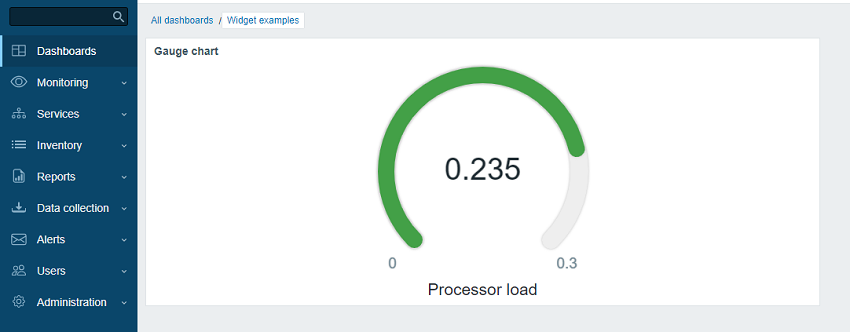
在本教程中,您将首先构建一个基础版 "Hello, world!" 小部件,然后将其转换为进阶版小部件,该部件将以监控项值作为仪表盘图表显示。 以下是完成后的部件效果:
Part I - "Hello, world!"
在本节中,您将学习如何create所需的最小部件元素并将新部件添加到Zabbix前端。
向 Zabbix 前端添加空白小部件
- 在Zabbix前端安装目录的modules文件夹下创建lesson_gauge_chart目录(例如zabbix/ui/modules)。
所有自定义小部件都被视为外部模块,必须添加到Zabbix前端安装目录的modules文件夹中(例如zabbix/ui/modules)。 zabbix/ui/widgets目录专用于Zabbix内置小部件,会随Zabbix UI一起更新。
- 创建包含基础小部件元数据的manifest.json file(参见支持的parameters描述)。
ui/modules/lesson_gauge_chart/manifest.json
{ "manifest_version": 2.0, "id": "lesson_gauge_chart", "type": "widget", "name": "Gauge chart", "namespace": "LessonGaugeChart", "version": "1.1", "author": "Zabbix" }- 在Zabbix前端,进入管理 → 常规 → 模块部分,点击扫描目录按钮。
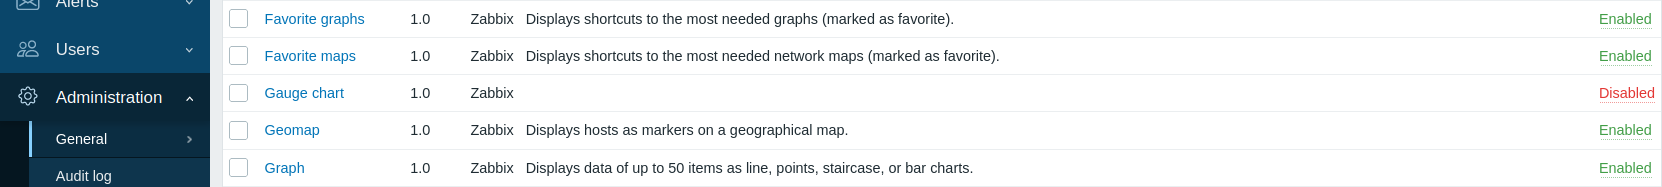
- 在列表中找到新模块仪表盘图表,点击"禁用"超链接将模块状态从"禁用"改为"启用"(如果模块未列出,请参阅安装部分)。
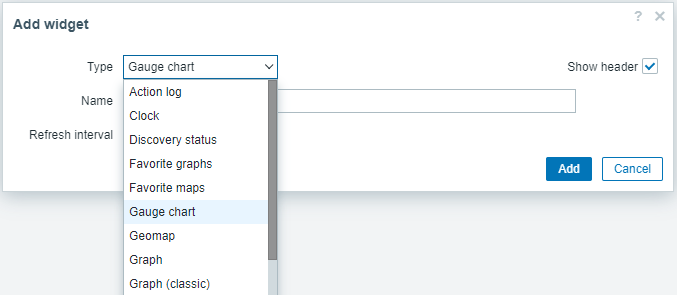
- 打开仪表盘,切换到编辑模式并添加新部件。在类型字段中选择"仪表盘图表"。
- 此时仪表盘图表部件配置仅包含通用部件字段名称和刷新间隔。 点击添加将部件加入仪表盘。
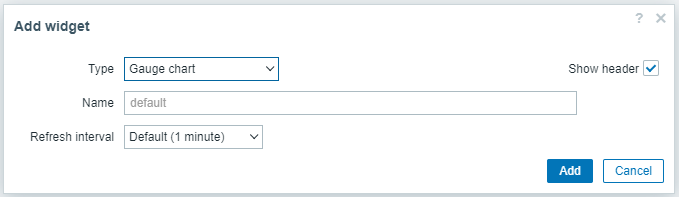
- 仪表盘上将显示空白部件。点击右上角的保存更改以保存仪表盘。
![]()
添加小部件视图
该小部件的视图 file应位于views目录中(本教程中为ui/modules/lesson_gauge_chart/views/)。 如果file使用默认名称widget.view.php,则无需在manifest.json file中注册。 如果file使用其他名称,请在manifest.json file的actions/widget.lesson_gauge_chart.view部分指定。
在lesson_gauge_chart目录中创建views目录。
在views目录中创建widget.view.php file。
ui/modules/lesson_gauge_chart/views/widget.view.php
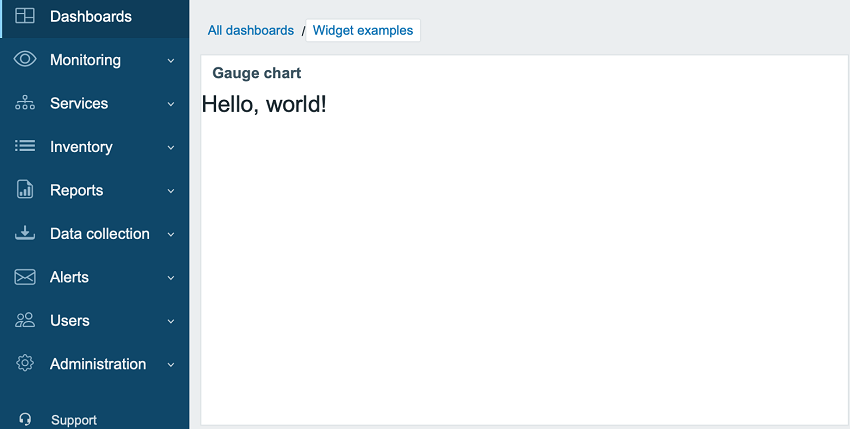
<?php /** * Gauge chart widget view. * * @var CView $this * @var array $data */ (new CWidgetView($data)) ->addItem( new CTag('h1', true, 'Hello, world!') ) ->show();- 刷新仪表盘。此时Gauge chart小部件将显示"Hello, world!"。
第二部分 - 仪表图
向配置视图添加设置,并在小部件视图中使用这些设置
在本节中,您将学习如何添加小部件配置字段并在小部件视图中以文本形式显示输入的值。
小部件配置由表单(Zabbix\Widgets\CWidgetForm)和小部件表单视图(widget.edit.php)组成。 要添加字段(Zabbix\Widgets\CWidgetField),您需要create一个WidgetForm类,该类将继承Zabbix\Widgets\CWidgetForm。
表单包含各种类型的字段集合(Zabbix\Widgets\CWidgetField),用于验证用户输入的值。 每种输入元素类型的表单字段(Zabbix\Widgets\CWidgetField)将值转换为单一格式以存储到数据库中。
小部件的表单file应位于includes目录中(本教程中为ui/modules/lesson_gauge_chart/includes/)。 如果file使用默认名称WidgetForm.php,则无需在manifest.jsonfile中注册。 如果file使用不同名称,请在manifest.jsonfile的widget/form_class部分中指定。
在lesson_gauge_chart目录中创建新目录includes。
在includes目录中创建WidgetForm.phpfile。
ui/modules/lesson_gauge_chart/includes/WidgetForm.php
<?php namespace Modules\LessonGaugeChart\Includes; use Zabbix\Widgets\CWidgetForm; class WidgetForm extends CWidgetForm { }- 向小部件配置表单添加Description字段。 这是一个常规文本字段,用户可以输入任何字符集。 您可以使用CWidgetFieldTextBox类来实现。
ui/modules/lesson_gauge_chart/includes/WidgetForm.php
<?php namespace Modules\LessonGaugeChart\Includes; use Zabbix\Widgets\CWidgetForm; use Zabbix\Widgets\Fields\CWidgetFieldTextBox; class WidgetForm extends CWidgetForm { public function addFields(): self { return $this ->addField( new CWidgetFieldTextBox('description', _('Description')) ); } }- 在views目录中,create小部件配置视图filewidget.edit.php并为新的Description字段添加视图。 对于CWidgetFieldTextBox字段类,视图为CWidgetFieldTextBoxView。
ui/modules/lesson_gauge_chart/views/widget.edit.php
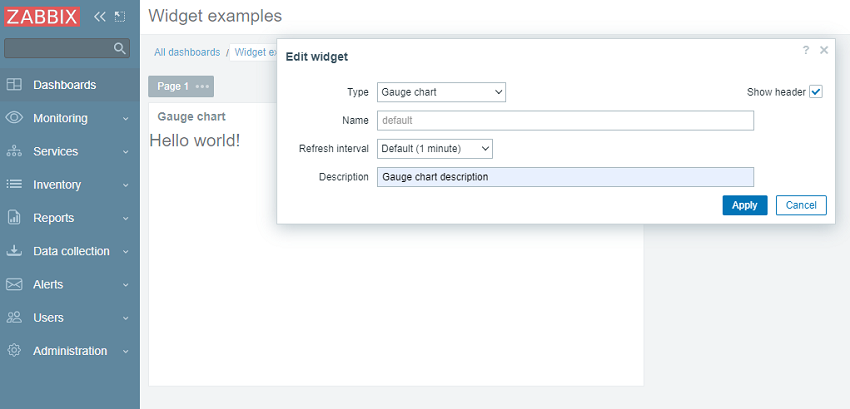
<?php /** * Gauge chart widget form view. * * @var CView $this * @var array $data */ (new CWidgetFormView($data)) ->addField( new CWidgetFieldTextBoxView($data['fields']['description']) ) ->show();转到仪表板并点击小部件中的齿轮图标以打开小部件配置表单。
小部件配置表单现在包含一个新的Description文本字段。 输入任意值,例如Gauge chart description。
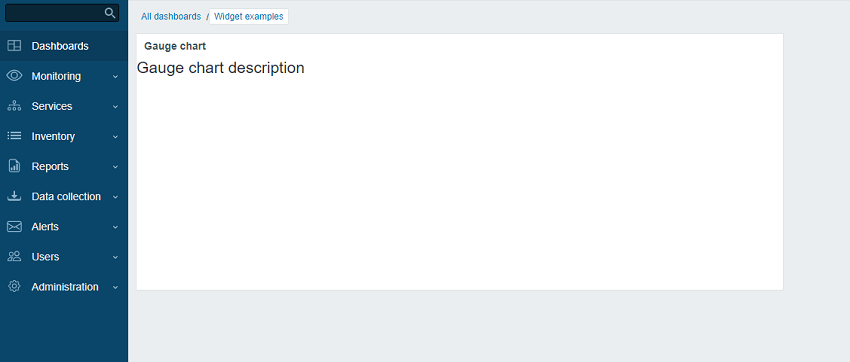
- 在小部件配置表单中点击Apply。然后点击右上角的Save changes保存仪表板。 请注意,新描述不会显示在任何地方,小部件仍显示"Hello, world!"。
要使新描述显示在小部件中,需要从数据库中检索Description字段值并传递给小部件视图。 为此,您需要create一个动作类。
在lesson_gauge_chart目录中创建新目录actions。
在actions目录中创建WidgetView.phpfile。 WidgetView动作类将继承CControllerDashboardWidgetView类。
小部件配置字段的值存储在动作类的$fields_values属性中。
ui/modules/lesson_gauge_chart/actions/WidgetView.php
<?php namespace Modules\LessonGaugeChart\Actions; use CControllerDashboardWidgetView, CControllerResponseData; class WidgetView extends CControllerDashboardWidgetView { protected function doAction(): void { $this->setResponse(new CControllerResponseData([ 'name' => $this->getInput('name', $this->widget->getName()), 'description' => $this->fields_values['description'], 'user' => [ 'debug_mode' => $this->getDebugMode() ] ])); } }- 打开manifest.json并在actions/widget.lesson_gauge_chart.view部分注册WidgetView作为动作类。
ui/modules/lesson_gauge_chart/manifest.json
{ "manifest_version": 2.0, "id": "lesson_gauge_chart", "type": "widget", "name": "Gauge chart", "namespace": "LessonGaugeChart", "version": "1.0", "author": "Zabbix", "actions": { "widget.lesson_gauge_chart.view": { "class": "WidgetView" } } }- 现在您可以在小部件视图中使用包含在$data['描述']中的描述字段值。 打开views/widget.view.php并将静态文本"Hello, world!"替换为$data['描述']。
ui/modules/lesson_gauge_chart/views/widget.view.php
<?php /** * Gauge chart widget view. * * @var CView $this * @var array $data */ (new CWidgetView($data)) ->addItem( new CTag('h1', true, $data['description']) ) ->show();- 刷新仪表板页面。您现在应该看到小部件描述文本而不是"Hello, world!"。
通过API检索监控项值
该部件应显示用户选择的监控项的最后一个值. 为此,您需要在部件配置中添加选择监控项的功能.
在本节中,您将学习如何向部件表单添加监控项选择字段,以及如何将此字段的可视部分添加到配置视图中. 然后,部件控制器将能够通过API请求获取监控项数据及其值. 获取后,该值可以显示在部件视图中.
- 打开includes/WidgetForm.php并添加CWidgetFieldMultiSelectItem字段. 这将允许在配置表单中选择监控项.
ui/modules/lesson_gauge_chart/includes/WidgetForm.php
<?php namespace Modules\LessonGaugeChart\Includes; use Zabbix\Widgets\{ CWidgetField, CWidgetForm }; use Zabbix\Widgets\Fields\{ CWidgetFieldMultiSelectItem, CWidgetFieldTextBox }; /** * Gauge chart widget form. */ class WidgetForm extends CWidgetForm { public function addFields(): self { return $this ->addField( (new CWidgetFieldMultiSelectItem('itemid', _('Item'))) ->setFlags(CWidgetField::FLAG_NOT_EMPTY | CWidgetField::FLAG_LABEL_ASTERISK) ->setMultiple(false) ) ->addField( new CWidgetFieldTextBox('description', _('Description')) ); } }- 打开views/widget.edit.php并将字段可视化组件添加到配置视图.
ui/modules/lesson_gauge_chart/views/widget.edit.php
<?php /** * Gauge chart widget form view. * * @var CView $this * @var array $data */ (new CWidgetFormView($data)) ->addField( new CWidgetFieldMultiSelectItemView($data['fields']['itemid']) ) ->addField( new CWidgetFieldTextBoxView($data['fields']['description']) ) ->show();返回仪表板并点击部件中的齿轮图标以打开部件配置表单.
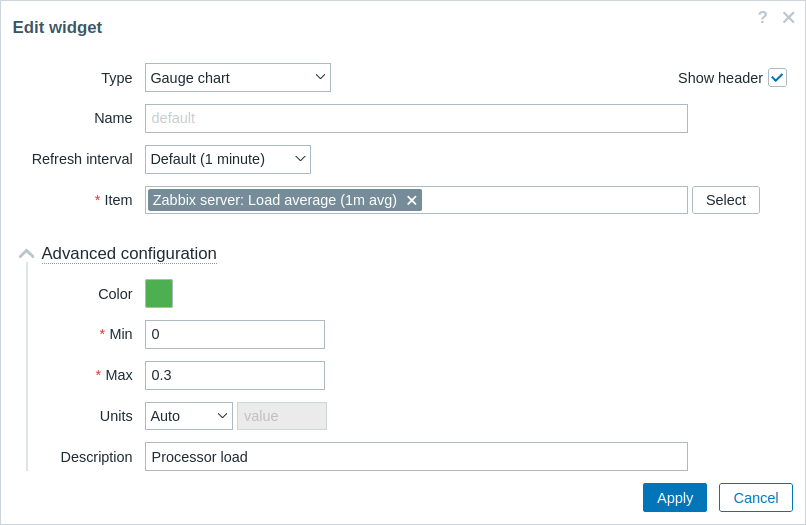
部件配置表单现在包含一个新的输入字段监控项. 选择主机"Zabbix server"和监控项"Load average (1m avg)".
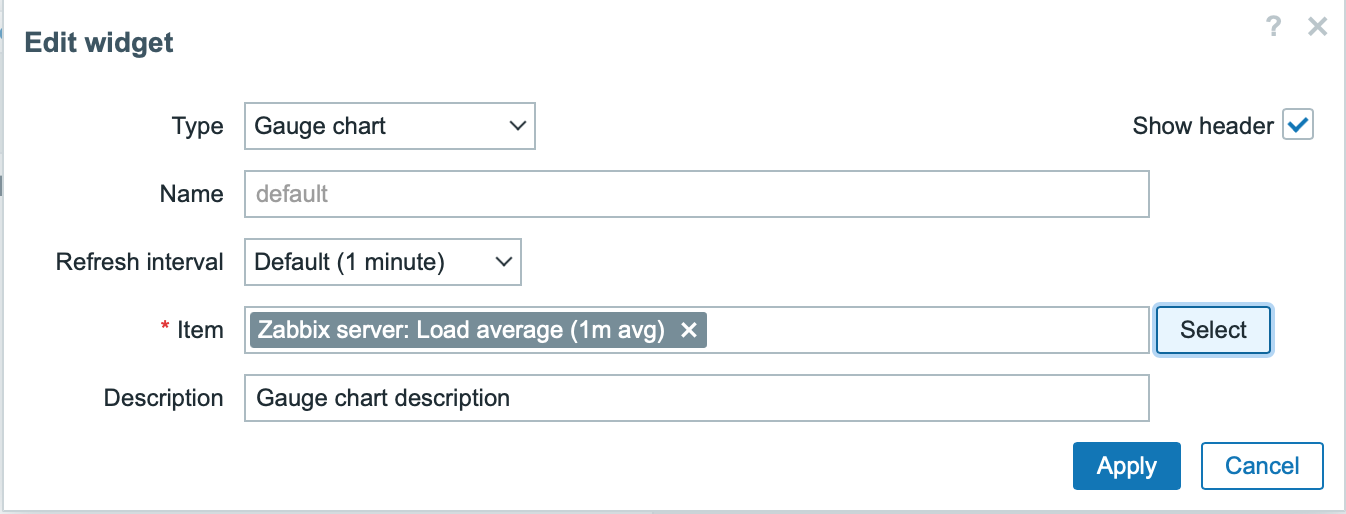
在部件配置表单中点击Apply.然后点击右上角的Save changes以保存仪表板.
打开并修改actions/WidgetView.php.
从现在开始,监控项 ID将在部件控制器的$this->fields_values['itemid']中可用. doAction()控制器方法使用API方法item.get收集监控项数据(名称,值类型,单位),并使用API方法history.get收集监控项的最后一个值.
ui/modules/lesson_gauge_chart/actions/WidgetView.php
<?php namespace Modules\LessonGaugeChart\Actions; use API, CControllerDashboardWidgetView, CControllerResponseData; class WidgetView extends CControllerDashboardWidgetView { protected function doAction(): void { $db_items = API::Item()->get([ 'output' => ['itemid', 'value_type', 'name', 'units'], 'itemids' => $this->fields_values['itemid'], 'webitems' => true, 'filter' => [ 'value_type' => [ITEM_VALUE_TYPE_UINT64, ITEM_VALUE_TYPE_FLOAT] ] ]); $value = null; if ($db_items) { $item = $db_items[0]; $history = API::History()->get([ 'output' => API_OUTPUT_EXTEND, 'itemids' => $item['itemid'], 'history' => $item['value_type'], 'sortfield' => 'clock', 'sortorder' => ZBX_SORT_DOWN, 'limit' => 1 ]); if ($history) { $value = convertUnitsRaw([ 'value' => $history[0]['value'], 'units' => $item['units'] ]); } } $this->setResponse(new CControllerResponseData([ 'name' => $this->getInput('name', $this->widget->getName()), 'value' => $value, 'description' => $this->fields_values['description'], 'user' => [ 'debug_mode' => $this->getDebugMode() ] ])); } }- 打开views/widget.view.php并将监控项值添加到部件视图.
ui/modules/lesson_gauge_chart/views/widget.view.php
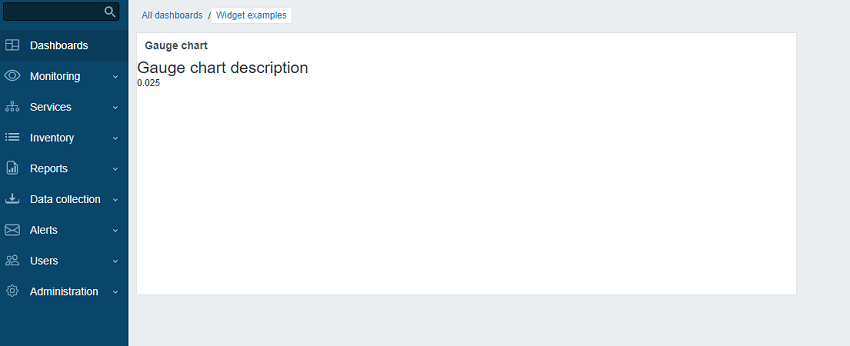
<?php /** * Gauge chart widget view. * * @var CView $this * @var array $data */ (new CWidgetView($data)) ->addItem([ new CTag('h1', true, $data['description']), new CDiv($data['value'] !== null ? $data['value']['value'] : _('No data')) ]) ->show();- 刷新仪表板页面.部件将显示最新的监控项值.
向配置视图添加高级配置设置
在本节中,您将学习如何添加一个可展开/折叠的高级配置部分,其中包含可选参数,例如颜色、最小值和最大值、单位以及之前创建的描述字段。
- 在主部件目录lesson_gauge_chart中创建一个Widget.php file,用于create一个新的Widget类。
Widget类将继承CWidget基类,以添加/覆盖默认部件设置(在本例中为翻译)。 下面提供的JavaScript会在数据缺失时显示string“无数据”。 “无数据”string存在于Zabbix UI翻译文件中。
如果有任何部件常量,建议也在Widget类中指定它们。
ui/modules/lesson_gauge_chart/Widget.php
<?php namespace Modules\LessonGaugeChart; use Zabbix\Core\CWidget; class Widget extends CWidget { public const UNIT_AUTO = 0; public const UNIT_STATIC = 1; public function getTranslationStrings(): array { return [ 'class.widget.js' => [ 'No data' => _('No data') ] ]; } }- 打开includes/WidgetForm.php并添加新字段颜色(颜色选择器)、最小值(数字字段)、最大值(数字字段)和单位(选择框),并为颜色选择器定义默认调色板,以便在后续步骤中使用。
ui/modules/lesson_gauge_chart/includes/WidgetForm.php
<?php namespace Modules\LessonGaugeChart\Includes; use Modules\LessonGaugeChart\Widget; use Zabbix\Widgets\{ CWidgetField, CWidgetForm }; use Zabbix\Widgets\Fields\{ CWidgetFieldColor, CWidgetFieldMultiSelectItem, CWidgetFieldNumericBox, CWidgetFieldSelect, CWidgetFieldTextBox }; /** * Gauge chart widget form. */ class WidgetForm extends CWidgetForm { public const DEFAULT_COLOR_PALETTE = [ 'FF465C', 'B0AF07', '0EC9AC', '524BBC', 'ED1248', 'D1E754', '2AB5FF', '385CC7', 'EC1594', 'BAE37D', '6AC8FF', 'EE2B29', '3CA20D', '6F4BBC', '00A1FF', 'F3601B', '1CAE59', '45CFDB', '894BBC', '6D6D6D' ]; public function addFields(): self { return $this ->addField( (new CWidgetFieldMultiSelectItem('itemid', _('Item'))) ->setFlags(CWidgetField::FLAG_NOT_EMPTY | CWidgetField::FLAG_LABEL_ASTERISK) ->setMultiple(false) ) ->addField( (new CWidgetFieldColor('chart_color', _('Color')))->setDefault('FF0000') ) ->addField( (new CWidgetFieldNumericBox('value_min', _('Min'))) ->setDefault(0) ->setFlags(CWidgetField::FLAG_NOT_EMPTY | CWidgetField::FLAG_LABEL_ASTERISK) ) ->addField( (new CWidgetFieldNumericBox('value_max', _('Max'))) ->setDefault(100) ->setFlags(CWidgetField::FLAG_NOT_EMPTY | CWidgetField::FLAG_LABEL_ASTERISK) ) ->addField( (new CWidgetFieldSelect('value_units', _('Units'), [ Widget::UNIT_AUTO => _x('Auto', 'history source selection method'), Widget::UNIT_STATIC => _x('Static', 'history source selection method') ]))->setDefault(Widget::UNIT_AUTO) ) ->addField( (new CWidgetFieldTextBox('value_static_units')) ) ->addField( new CWidgetFieldTextBox('description', _('Description')) ); } }- 打开views/widget.edit.php并将字段可视化组件添加到配置视图中。
ui/modules/lesson_gauge_chart/views/widget.edit.php
<?php /** * Gauge chart widget form view. * * @var CView $this * @var array $data */ $lefty_units = new CWidgetFieldSelectView($data['fields']['value_units']); $lefty_static_units = (new CWidgetFieldTextBoxView($data['fields']['value_static_units'])) ->setPlaceholder(_('value')) ->setWidth(ZBX_TEXTAREA_TINY_WIDTH); (new CWidgetFormView($data)) ->addField( (new CWidgetFieldMultiSelectItemView($data['fields']['itemid'])) ->setPopupParameter('numeric', true) ) ->addFieldset( (new CWidgetFormFieldsetCollapsibleView(_('Advanced configuration'))) ->addField( new CWidgetFieldColorView($data['fields']['chart_color']) ) ->addField( new CWidgetFieldNumericBoxView($data['fields']['value_min']) ) ->addField( new CWidgetFieldNumericBoxView($data['fields']['value_max']) ) ->addItem([ $lefty_units->getLabel(), (new CFormField([ $lefty_units->getView()->addClass(ZBX_STYLE_FORM_INPUT_MARGIN), $lefty_static_units->getView() ])) ]) ->addField( new CWidgetFieldTextBoxView($data['fields']['description']) ) ) ->show();CWidgetFormView类的addField()方法将CSS类string作为第二个参数。
- 返回仪表板,切换到编辑模式并点击部件中的齿轮图标以打开部件配置表单。 部件配置表单现在包含一个新的可展开/折叠部分高级配置。
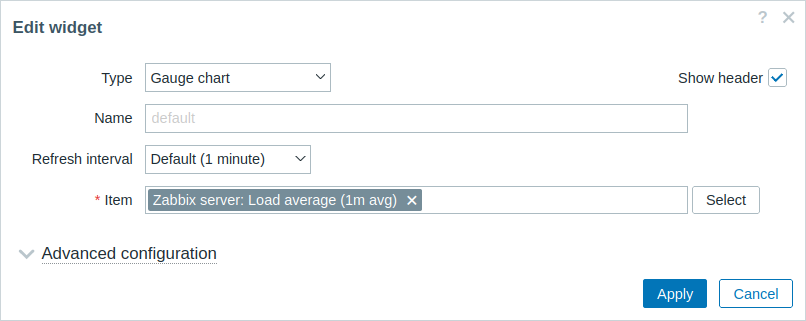
- 展开高级配置部分以查看其他部件配置字段。 请注意,颜色字段尚未包含颜色选择器。 这是因为颜色选择器必须通过JavaScript初始化,这将在下一节为部件添加JavaScript中添加。
向小部件添加 JavaScript
在本节中,您将学习如何添加一个使用JavaScript制作的仪表盘图表,用于显示最新值是正常、过高还是过低。
- 在views目录中创建widget.edit.js.php file。
JavaScript将负责在配置视图中初始化颜色选择器。
ui/modules/lesson_gauge_chart/views/widget.edit.js.php
<?php use Modules\LessonGaugeChart\Widget; ?> window.widget_lesson_gauge_chart_form = new class { init({color_palette}) { this._unit_select = document.getElementById('value_units'); this._unit_value = document.getElementById('value_static_units'); this._unit_select.addEventListener('change', () => this.updateForm()); colorPalette.setThemeColors(color_palette); for (const colorpicker of jQuery('.<?= ZBX_STYLE_COLOR_PICKER ?> input')) { jQuery(colorpicker).colorpicker(); } const overlay = overlays_stack.getById('widget_properties'); for (const event of ['overlay.reload', 'overlay.close']) { overlay.$dialogue[0].addEventListener(event, () => { jQuery.colorpicker('hide'); }); } this.updateForm(); } updateForm() { this._unit_value.disabled = this._unit_select.value == <?= Widget::UNIT_AUTO ?>; } };- 打开views/widget.edit.php并将包含JavaScript的widget.edit.js.php file添加到配置视图。 为此,使用includeJsFile()方法。要添加内联JavaScript,使用addJavaScript()方法。
ui/modules/lesson_gauge_chart/views/widget.edit.php
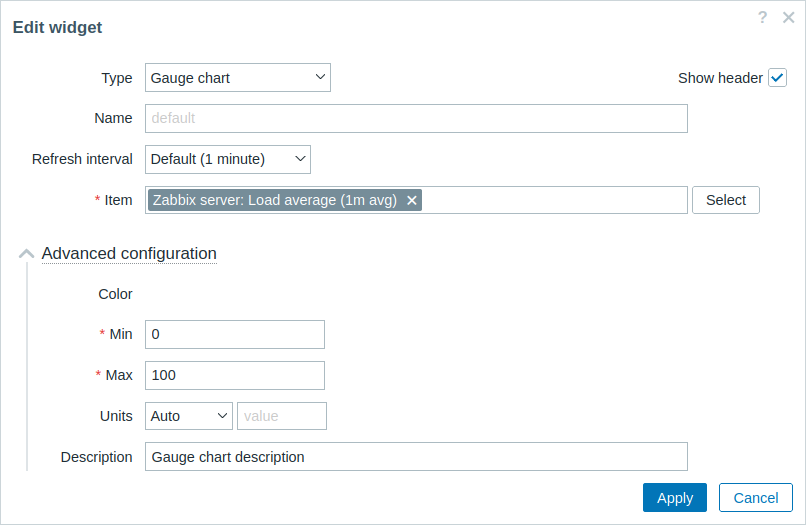
<?php /** * Gauge chart widget form view. * * @var CView $this * @var array $data */ use Modules\LessonGaugeChart\Includes\WidgetForm; $lefty_units = new CWidgetFieldSelectView($data['fields']['value_units']); $lefty_static_units = (new CWidgetFieldTextBoxView($data['fields']['value_static_units'])) ->setPlaceholder(_('value')) ->setWidth(ZBX_TEXTAREA_TINY_WIDTH); (new CWidgetFormView($data)) ->addField( (new CWidgetFieldMultiSelectItemView($data['fields']['itemid'])) ->setPopupParameter('numeric', true) ) ->addFieldset( (new CWidgetFormFieldsetCollapsibleView(_('Advanced configuration'))) ->addField( new CWidgetFieldColorView($data['fields']['chart_color']) ) ->addField( new CWidgetFieldNumericBoxView($data['fields']['value_min']) ) ->addField( new CWidgetFieldNumericBoxView($data['fields']['value_max']) ) ->addItem([ $lefty_units->getLabel(), (new CFormField([ $lefty_units->getView()->addClass(ZBX_STYLE_FORM_INPUT_MARGIN), $lefty_static_units->getView() ])) ]) ->addField( new CWidgetFieldTextBoxView($data['fields']['description']) ) ) ->includeJsFile('widget.edit.js.php') ->addJavaScript('widget_lesson_gauge_chart_form.init('.json_encode([ 'color_palette' => WidgetForm::DEFAULT_COLOR_PALETTE ], JSON_THROW_ON_ERROR).');') ->show();- 返回仪表盘,点击部件中的齿轮图标打开部件配置表单。 现在,展开高级配置部分以查看初始化的颜色选择器。 填写字段值并为仪表盘图表选择颜色。
在部件配置表单中点击应用。然后点击右上角的保存更改以保存仪表盘。
打开actions/WidgetView.php并update控制器。
$this->fields_values属性现在包含所有高级配置字段的值。 完成控制器以允许将配置和选定的监控项值传递给部件视图。
ui/modules/lesson_gauge_chart/actions/WidgetView.php
<?php namespace Modules\LessonGaugeChart\Actions; use API, CControllerDashboardWidgetView, CControllerResponseData; class WidgetView extends CControllerDashboardWidgetView { protected function doAction(): void { $db_items = API::Item()->get([ 'output' => ['itemid', 'value_type', 'name', 'units'], 'itemids' => $this->fields_values['itemid'], 'webitems' => true, 'filter' => [ 'value_type' => [ITEM_VALUE_TYPE_UINT64, ITEM_VALUE_TYPE_FLOAT] ] ]); $history_value = null; if ($db_items) { $item = $db_items[0]; $history = API::History()->get([ 'output' => API_OUTPUT_EXTEND, 'itemids' => $item['itemid'], 'history' => $item['value_type'], 'sortfield' => 'clock', 'sortorder' => ZBX_SORT_DOWN, 'limit' => 1 ]); if ($history) { $history_value = convertUnitsRaw([ 'value' => $history[0]['value'], 'units' => $item['units'] ]); } } $this->setResponse(new CControllerResponseData([ 'name' => $this->getInput('name', $this->widget->getName()), 'history' => $history_value, 'fields_values' => $this->fields_values, 'user' => [ 'debug_mode' => $this->getDebugMode() ] ])); } }- 打开并修改views/widget.view.php。
您需要create一个用于仪表盘图表的容器(将在后续步骤中绘制)和一个用于描述的容器。
要将值作为JSON object传递给JavaScript,使用setVar()方法。
ui/modules/lesson_gauge_chart/views/widget.view.php
<?php /** * Gauge chart widget view. * * @var CView $this * @var array $data */ (new CWidgetView($data)) ->addItem([ (new CDiv())->addClass('chart'), $data['fields_values']['description'] ? (new CDiv($data['fields_values']['description']))->addClass('description') : null ]) ->setVar('history', $data['history']) ->setVar('fields_values', $data['fields_values']) ->show();在lesson_gauge_chart目录中创建一个新目录assets。 此目录将用于存储JavaScript、CSS以及可能的其他资源,如字体或图像。
对于部件视图JavaScript,在assets目录中create一个js目录。
在assets/js目录中创建class.widget.js file。
此JavaScript部件类将扩展所有仪表盘部件的基础JavaScript类 - CWidget。
仪表盘依赖于部件的正确实现,并通过调用相应的JavaScript方法与部件通信任何相关信息。 仪表盘还期望部件在发生某些交互时generate事件。 因此,CWidget类包含一组具有默认部件行为实现的方法,可以通过扩展类来自定义。
在本例中,需要一些自定义,因此将为以下部件行为实现自定义逻辑:
- 部件初始化,负责定义部件的初始状态(参见onInitialize()方法);
- 如果部件update过程成功且无错误,则显示部件内容(即绘制仪表盘图表)(参见processUpdateResponse(response)方法及相关的_resizeChart()和_updatedChart()方法)
- 调整部件大小(参见onResize()方法及相关的_resizeChart()方法)
对于仪表盘图表部件的其他方面,将使用部件行为的默认实现。 要了解更多关于CWidget类的JavaScript方法,请参阅:JavaScript。
由于此JavaScript是部件视图所必需的,它应随仪表盘页面加载。 要启用JavaScript加载,您需要在manifest.json file中updateassets/js和js_class参数,如步骤10所示。
ui/modules/lesson_gauge_chart/assets/js/class.widget.js
class WidgetLessonGaugeChart extends CWidget { static UNIT_AUTO = 0; static UNIT_STATIC = 1; onInitialize() { super.onInitialize(); this._refresh_frame = null; this._chart_container = null; this._canvas = null; this._chart_color = null; this._min = null; this._max = null; this._value = null; this._last_value = null; this._units = ''; } processUpdateResponse(response) { if (response.history === null) { this._value = null; this._units = ''; } else { this._value = Number(response.history.value); this._units = response.fields_values.value_units == WidgetLessonGaugeChart.UNIT_AUTO ? response.history.units : response.fields_values.value_static_units; } this._chart_color = response.fields_values.chart_color; this._min = Number(response.fields_values.value_min); this._max = Number(response.fields_values.value_max); super.processUpdateResponse(response); } setContents(response) { if (this._canvas === null) { super.setContents(response); this._chart_container = this._body.querySelector('.chart'); this._chart_container.style.height = `${this._getContentsSize().height - this._body.querySelector('.description').clientHeight}px`; this._canvas = document.createElement('canvas'); this._chart_container.appendChild(this._canvas); this._resizeChart(); } this._updatedChart(); } onResize() { super.onResize(); if (this._state === WIDGET_STATE_ACTIVE) { this._resizeChart(); } } _resizeChart() { const ctx = this._canvas.getContext('2d'); const dpr = window.devicePixelRatio; this._canvas.style.display = 'none'; const size = Math.min(this._chart_container.offsetWidth, this._chart_container.offsetHeight); this._canvas.style.display = ''; this._canvas.width = size * dpr; this._canvas.height = size * dpr; ctx.scale(dpr, dpr); this._canvas.style.width = `${size}px`; this._canvas.style.height = `${size}px`; this._refresh_frame = null; this._updatedChart(); } _updatedChart() { if (this._last_value === null) { this._last_value = this._min; } const start_time = Date.now(); const end_time = start_time + 400; const animate = () => { const time = Date.now(); if (time <= end_time) { const progress = (time - start_time) / (end_time - start_time); const smooth_progress = 0.5 + Math.sin(Math.PI * (progress - 0.5)) / 2; let value = this._value !== null ? this._value : this._min; value = (this._last_value + (value - this._last_value) * smooth_progress - this._min) / (this._max - this._min); const ctx = this._canvas.getContext('2d'); const size = this._canvas.width; const char_weight = size / 12; const char_shadow = 3; const char_x = size / 2; const char_y = size / 2; const char_radius = (size - char_weight) / 2 - char_shadow; const font_ratio = 32 / 100; ctx.clearRect(0, 0, size, size); ctx.beginPath(); ctx.shadowBlur = char_shadow; ctx.shadowColor = '#bbb'; ctx.strokeStyle = '#eee'; ctx.lineWidth = char_weight; ctx.lineCap = 'round'; ctx.arc(char_x, char_y, char_radius, Math.PI * 0.749, Math.PI * 2.251, false); ctx.stroke(); ctx.beginPath(); ctx.strokeStyle = `#${this._chart_color}`; ctx.lineWidth = char_weight - 2; ctx.lineCap = 'round'; ctx.arc(char_x, char_y, char_radius, Math.PI * 0.75, Math.PI * (0.75 + (1.5 * Math.min(1, Math.max(0, value)))), false ); ctx.stroke(); ctx.shadowBlur = 2; ctx.fillStyle = '#1f2c33'; ctx.font = `${(char_radius * font_ratio)|0}px Arial`; ctx.textAlign = 'center'; ctx.textBaseline = 'middle'; ctx.fillText(`${this._value !== null ? this._value : t('No data')}${this._units}`, char_x, char_y, size - char_shadow * 4 - char_weight * 2 ); ctx.fillStyle = '#768d99'; ctx.font = `${(char_radius * font_ratio * .5)|0}px Arial`; ctx.textBaseline = 'top'; ctx.textAlign = 'left'; ctx.fillText(`${this._min}${this._min != '' ? this._units : ''}`, char_weight * .75, size - char_weight * 1.25, size / 2 - char_weight ); ctx.textAlign = 'right'; ctx.fillText(`${this._max}${this._max != '' ? this._units : ''}`, size - char_weight * .75, size - char_weight * 1.25, size / 2 - char_weight ); requestAnimationFrame(animate); } else { this._last_value = this._value; } }; requestAnimationFrame(animate); } }- 打开manifest.json并添加:
- file名称(class.widget.js)到assets/js部分中的array;
- 类名(WidgetLessonGaugeChart)到widget部分中的js_class参数。
WidgetLessonGaugeChart类现在将随仪表盘自动加载。
ui/modules/lesson_gauge_chart/manifest.json
{ "manifest_version": 2.0, "id": "lesson_gauge_chart", "type": "widget", "name": "Gauge chart", "namespace": "LessonGaugeChart", "version": "1.0", "author": "Zabbix", "actions": { "widget.lesson_gauge_chart.view": { "class": "WidgetView" } }, "widget": { "js_class": "WidgetLessonGaugeChart" }, "assets": { "js": ["class.widget.js"] } }向小部件添加 CSS 样式
在本节中,您将学习如何添加自定义CSS样式以使小部件看起来更具吸引力。
对于小部件样式,create在assets目录中创建一个新的css目录。
在assets/css目录中创建一个widget.css file。 要为小部件元素设置样式,请使用选择器div.dashboard-widget-{widget id}。 要为整个小部件配置CSS,请使用选择器form.dashboard-widget-{widget id}
ui/modules/lesson_gauge_chart/assets/css/widget.css
div.dashboard-widget-lesson_gauge_chart { display: grid; grid-template-rows: 1fr; padding: 0; } div.dashboard-widget-lesson_gauge_chart .chart { display: grid; align-items: center; justify-items: center; } div.dashboard-widget-lesson_gauge_chart .chart canvas { background: white; } div.dashboard-widget-lesson_gauge_chart .description { padding-bottom: 8px; font-size: 1.750em; line-height: 1.2; text-align: center; } .dashboard-grid-widget-hidden-header div.dashboard-widget-lesson_gauge_chart .chart { margin-top: 8px; }- 打开manifest.json并将CSS file名称(widget.css)添加到assets/css部分中的array。 这将允许widget.css中定义的CSS样式随仪表板页面加载。
ui/modules/lesson_gauge_chart/manifest.json
{ "manifest_version": 2.0, "id": "lesson_gauge_chart", "type": "widget", "name": "Gauge chart", "namespace": "LessonGaugeChart", "version": "1.0", "author": "Zabbix", "actions": { "widget.lesson_gauge_chart.view": { "class": "WidgetView" } }, "widget": { "js_class": "WidgetLessonGaugeChart" }, "assets": { "css": ["widget.css"], "js": ["class.widget.js"] } }- 刷新仪表板页面以查看小部件的最终version。