Download as PDF, PPTX


![Improvements Expected in Spark 3.1 and WIP ▪ [SPARK-27142] New SQL REST API ▪ [SPARK-32119] Plugins can be distributed with –-jars and –packages on YARN, this adds support for K8S and Standalone ▪ [SPARK-33088] Enhance Executor Plugin API to include callbacks on task start and end events ▪ [SPARK-23431] Expose stage level peak executor metrics via REST API ▪ [SPARK-30985] Support propagating SPARK_CONF_DIR files to driver and executor pods ▪ [SPARK-31711] Executor metrics in local mode ▪ WIP [SPARK-30306] Python execution time instrumentation ▪ WIP on Hadoop (targeting Hadoop 3.4) ▪ [HADOOP-16830] Add public IOStatistics API](https://image.slidesharecdn.com/118lucacanali-201129183621/75/What-is-New-with-Apache-Spark-Performance-Monitoring-in-Spark-3-0-38-2048.jpg)
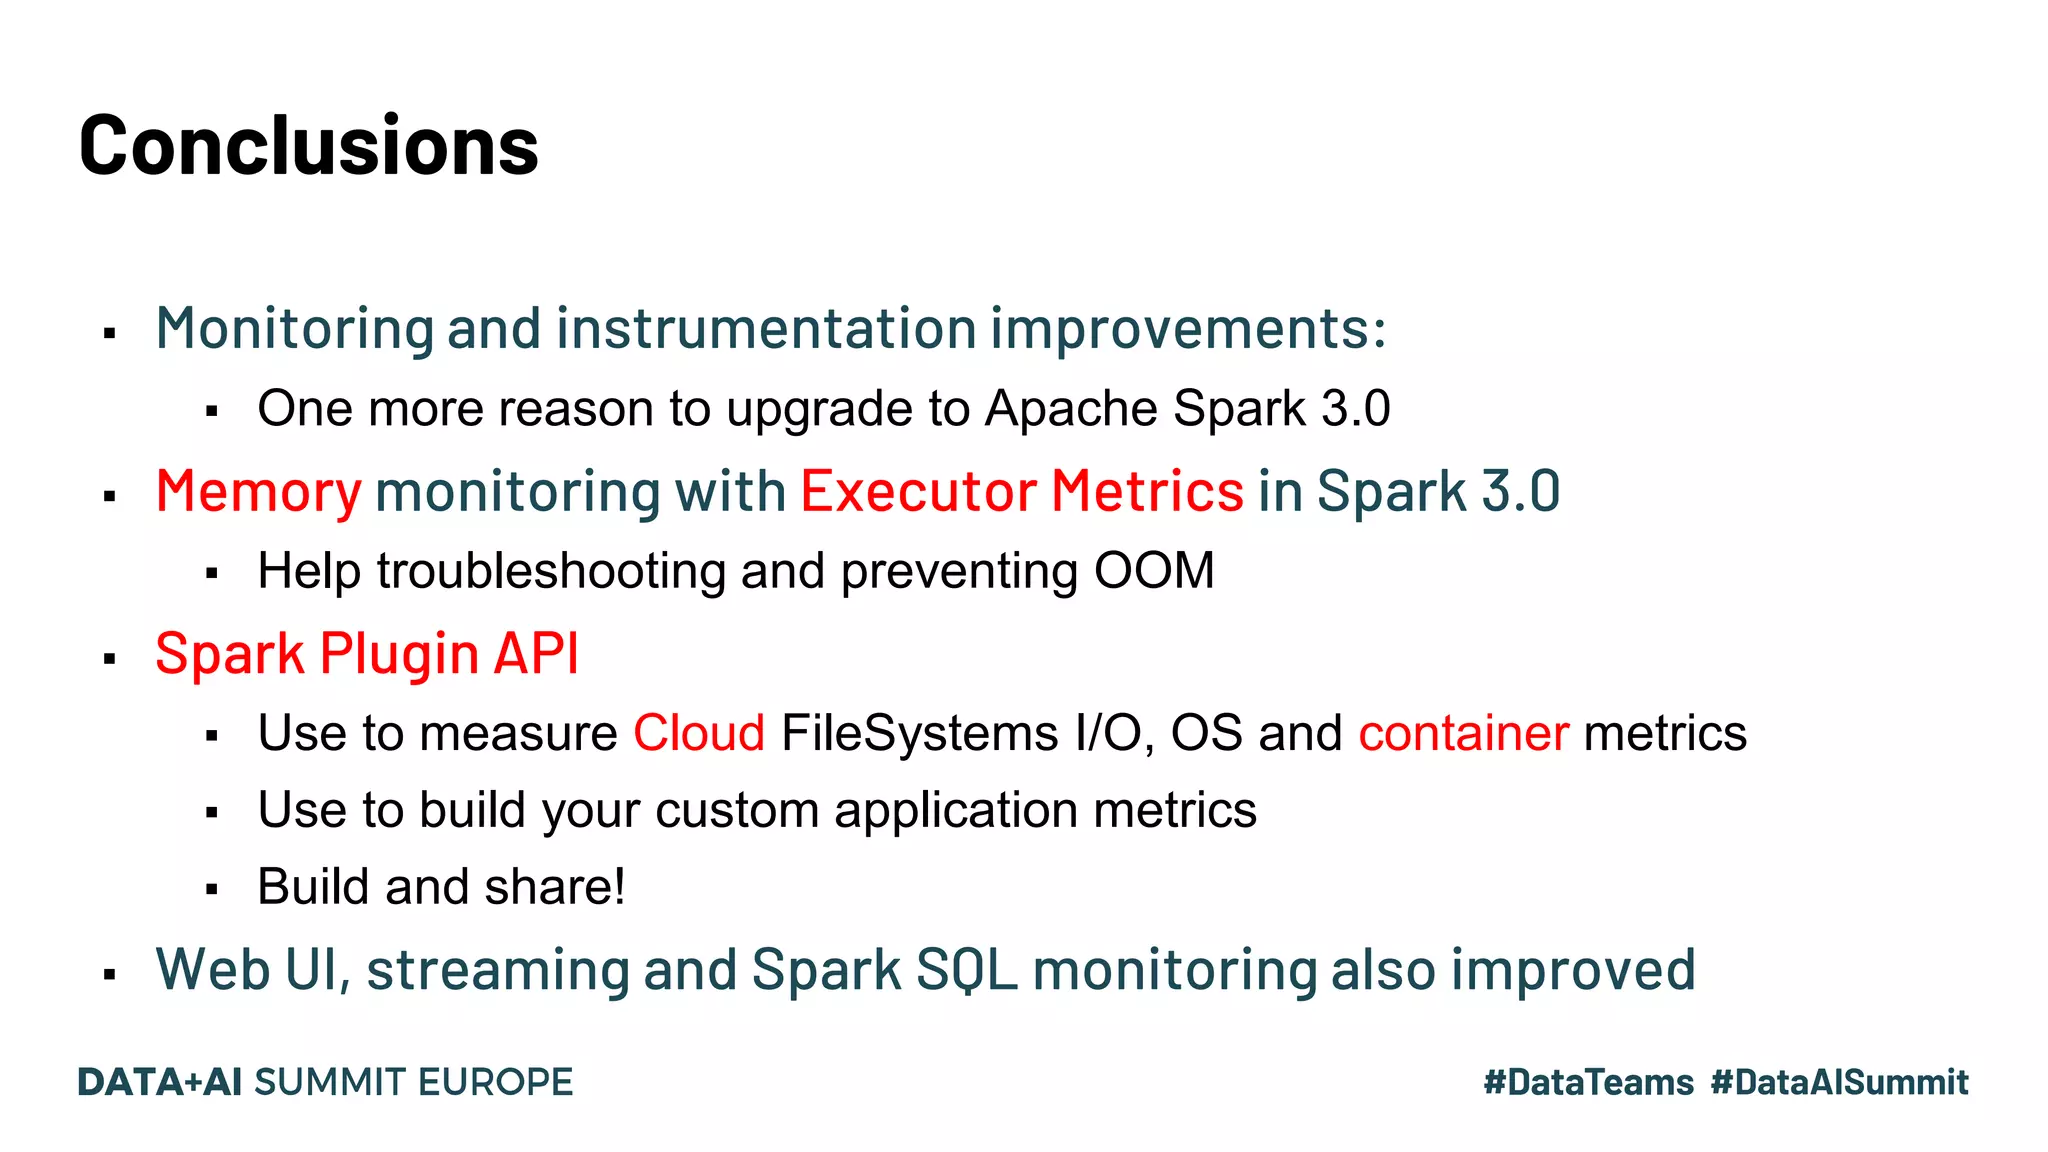


The document outlines the new features and improvements in Apache Spark 3.0 related to performance monitoring, including enhanced memory monitoring, SQL metrics, and custom plugins for monitoring various data sources. It emphasizes the importance of memory allocation for performance stability and introduces tools and frameworks for troubleshooting and visualizing metrics. The document also discusses community efforts for further enhancing Spark monitoring capabilities and provides insights on upcoming enhancements in Spark 3.1.
Introduction to Apache Spark 3.0 performance monitoring improvements by Luca Canali from CERN.
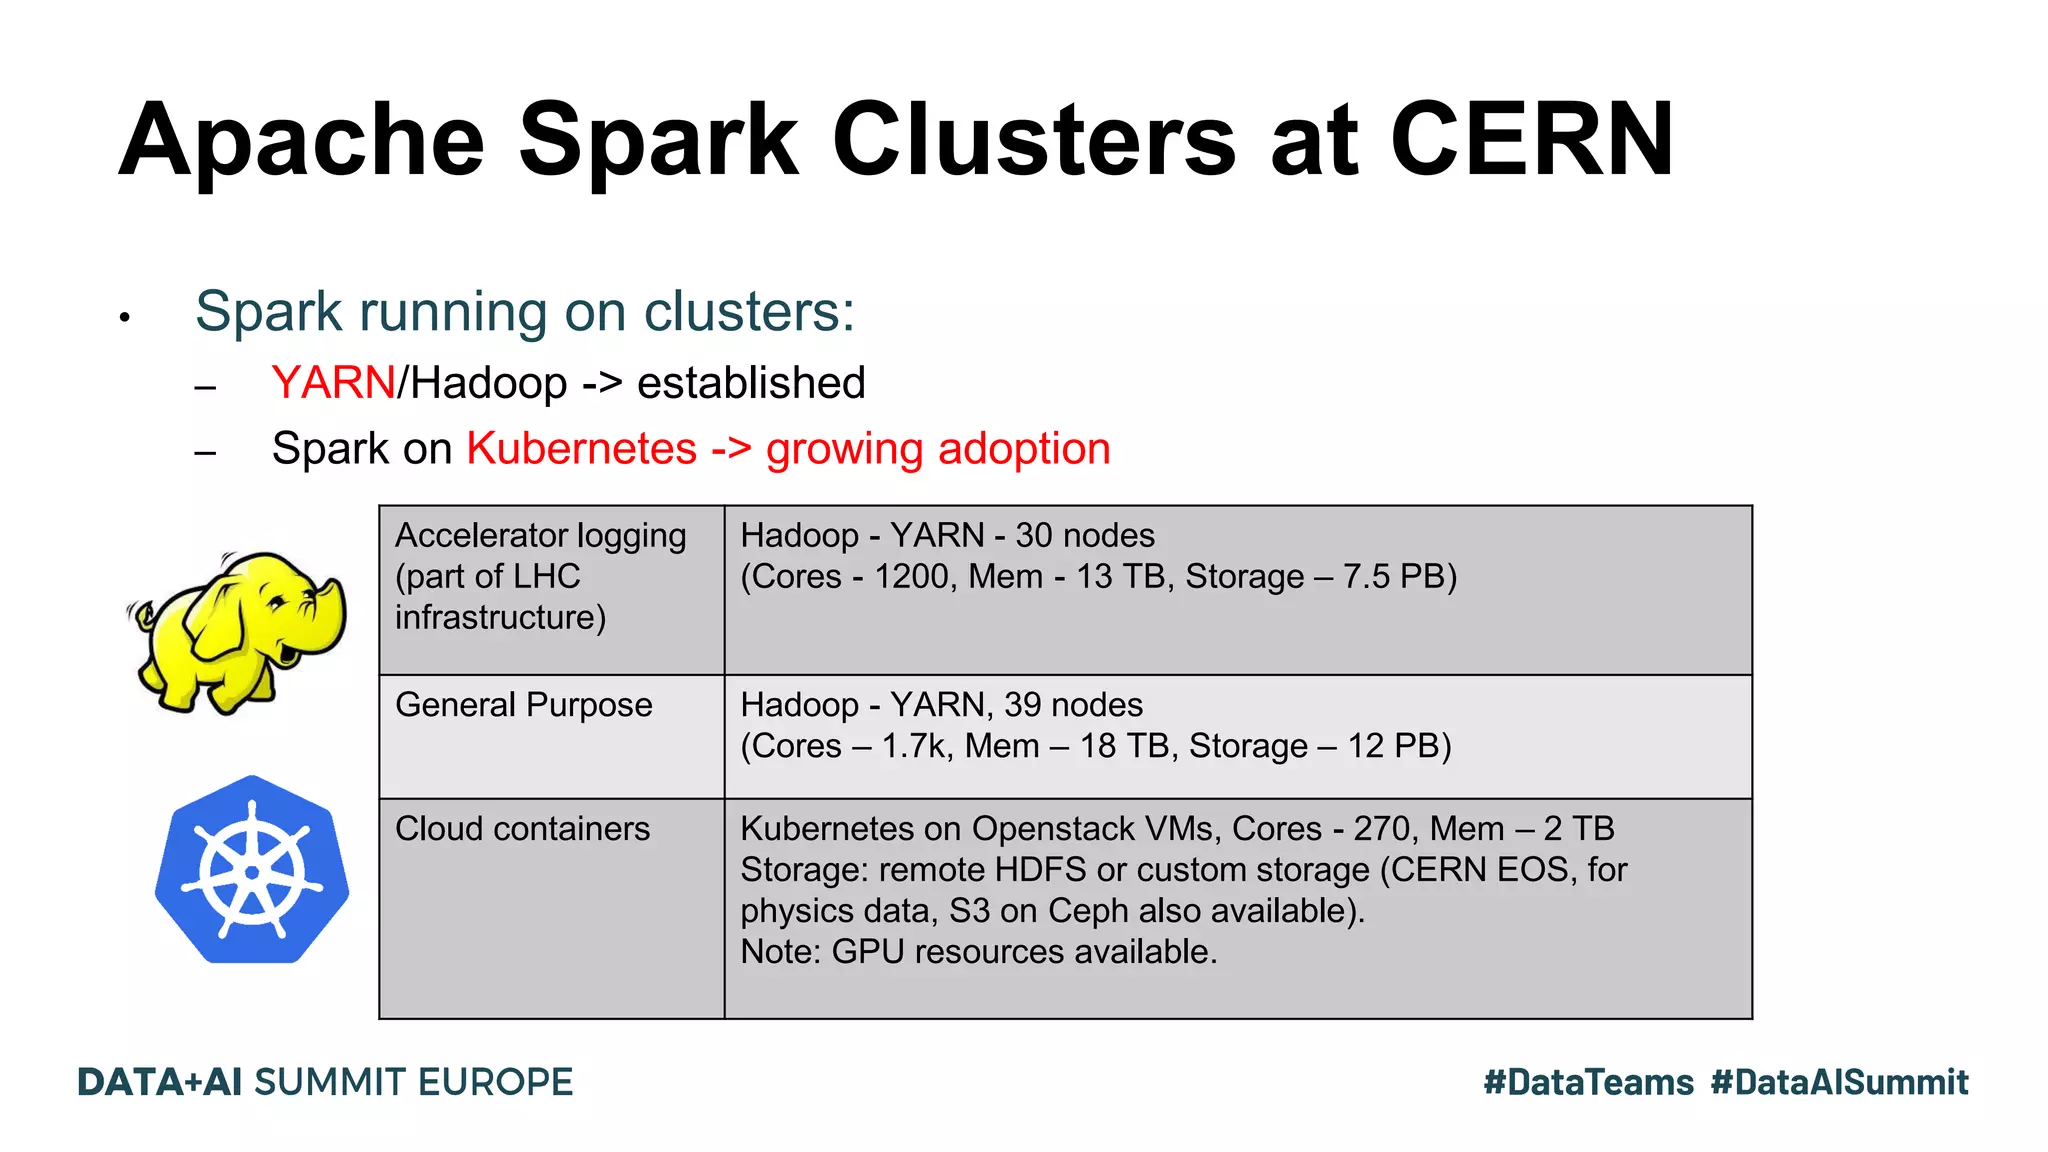
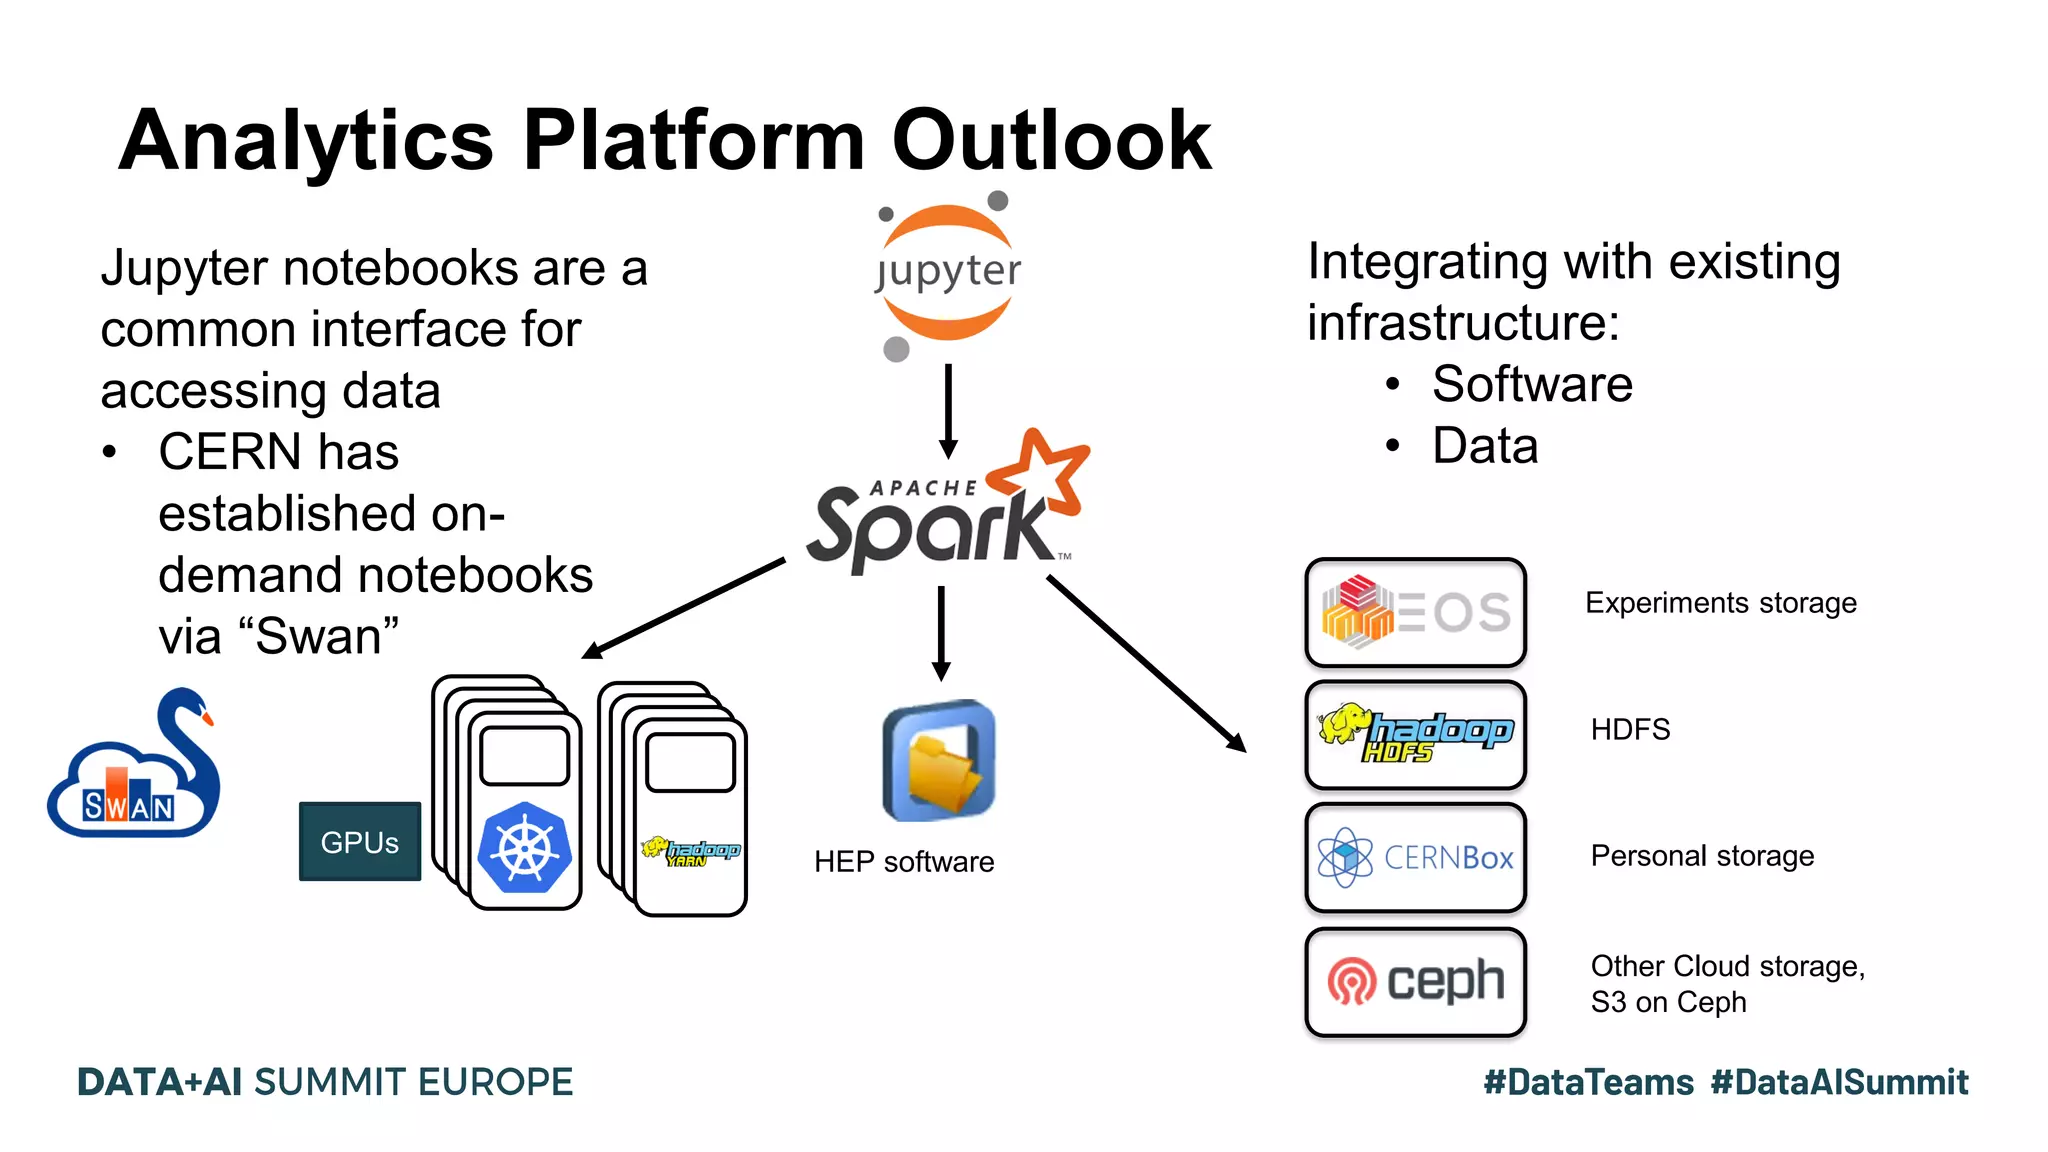
Huge data scales at CERN (300 PB), Spark on YARN and Kubernetes clusters, utilizing various configurations.
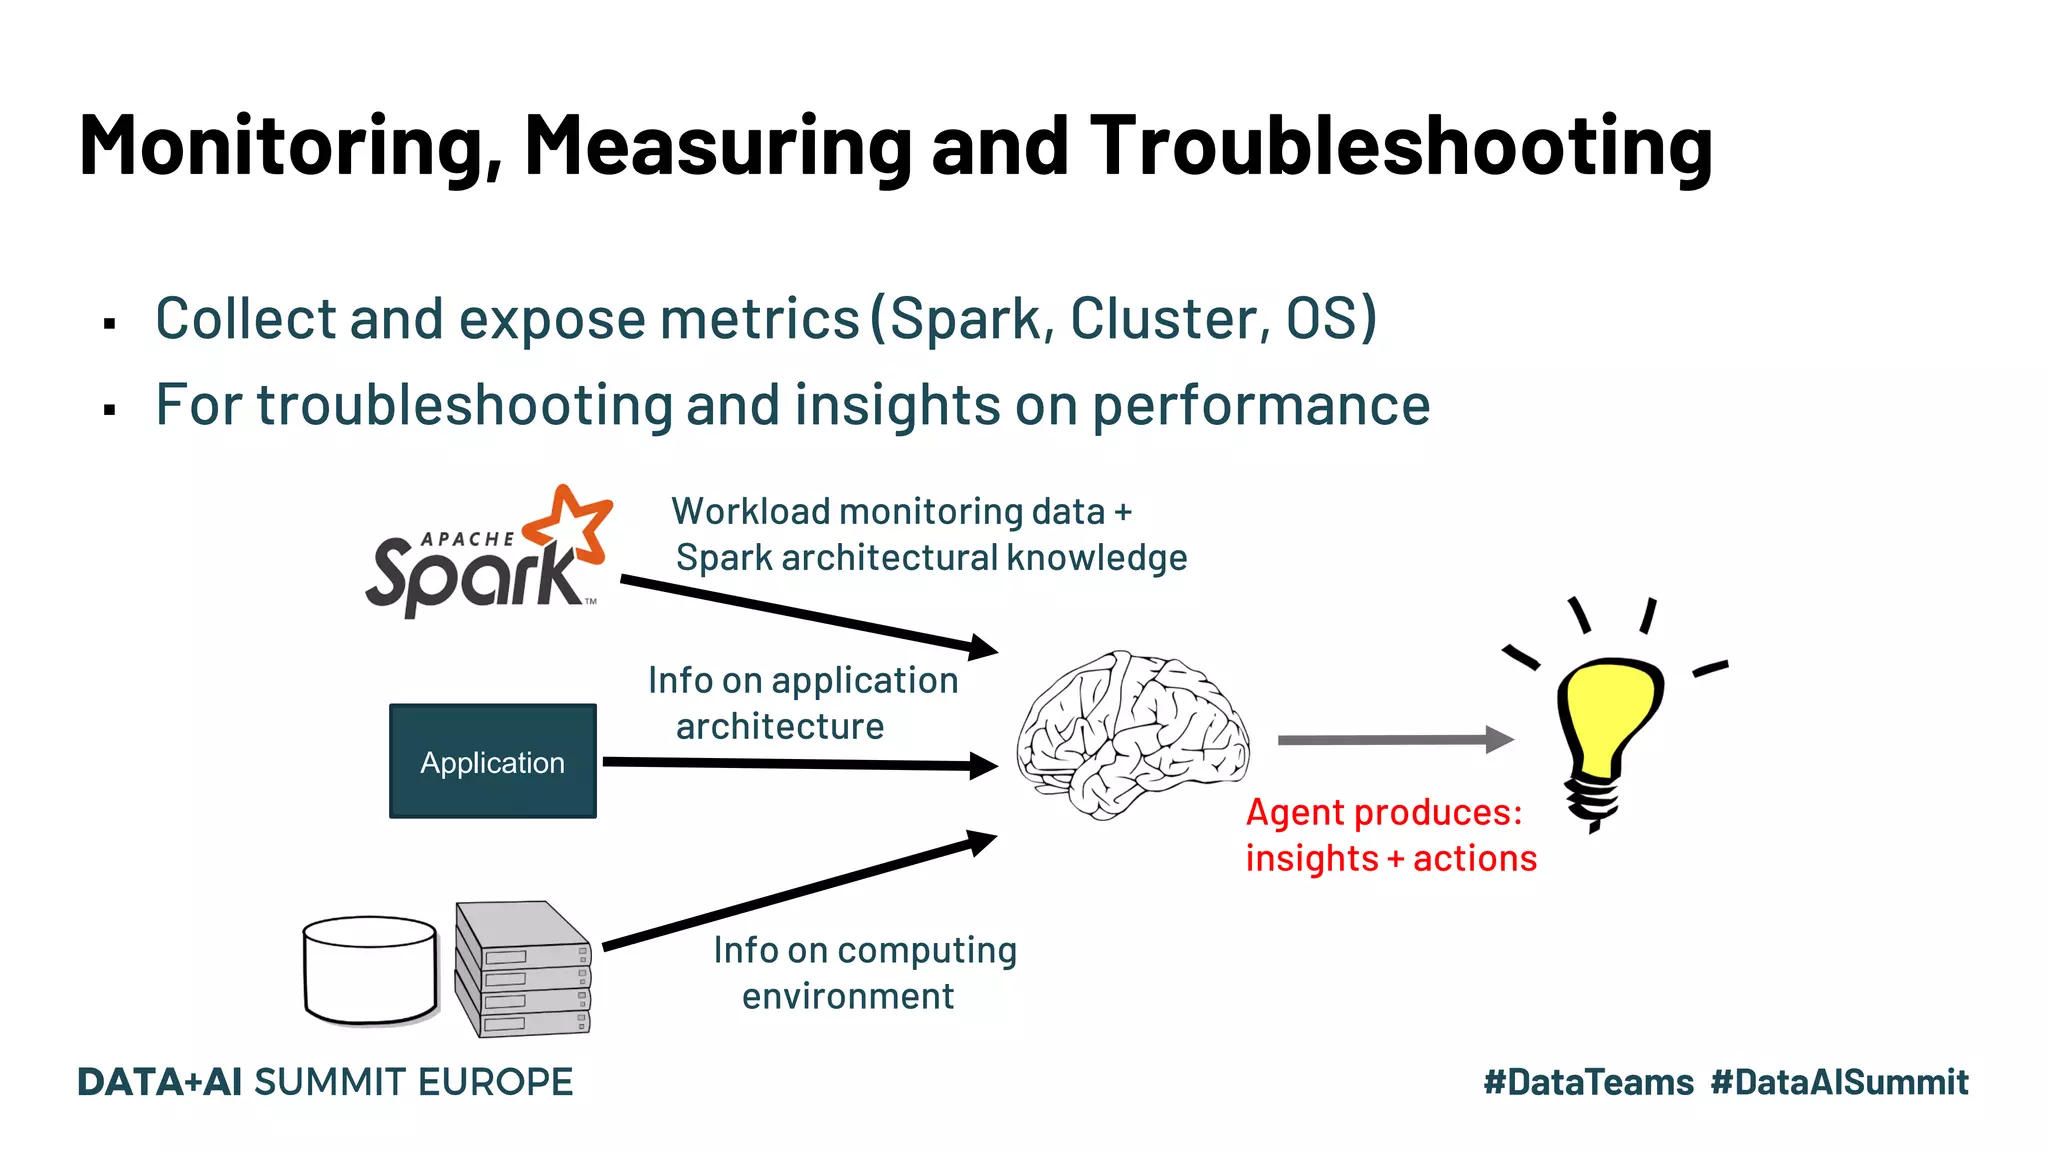
Key concepts in Spark monitoring include metrics collection, UI access for monitoring applications.
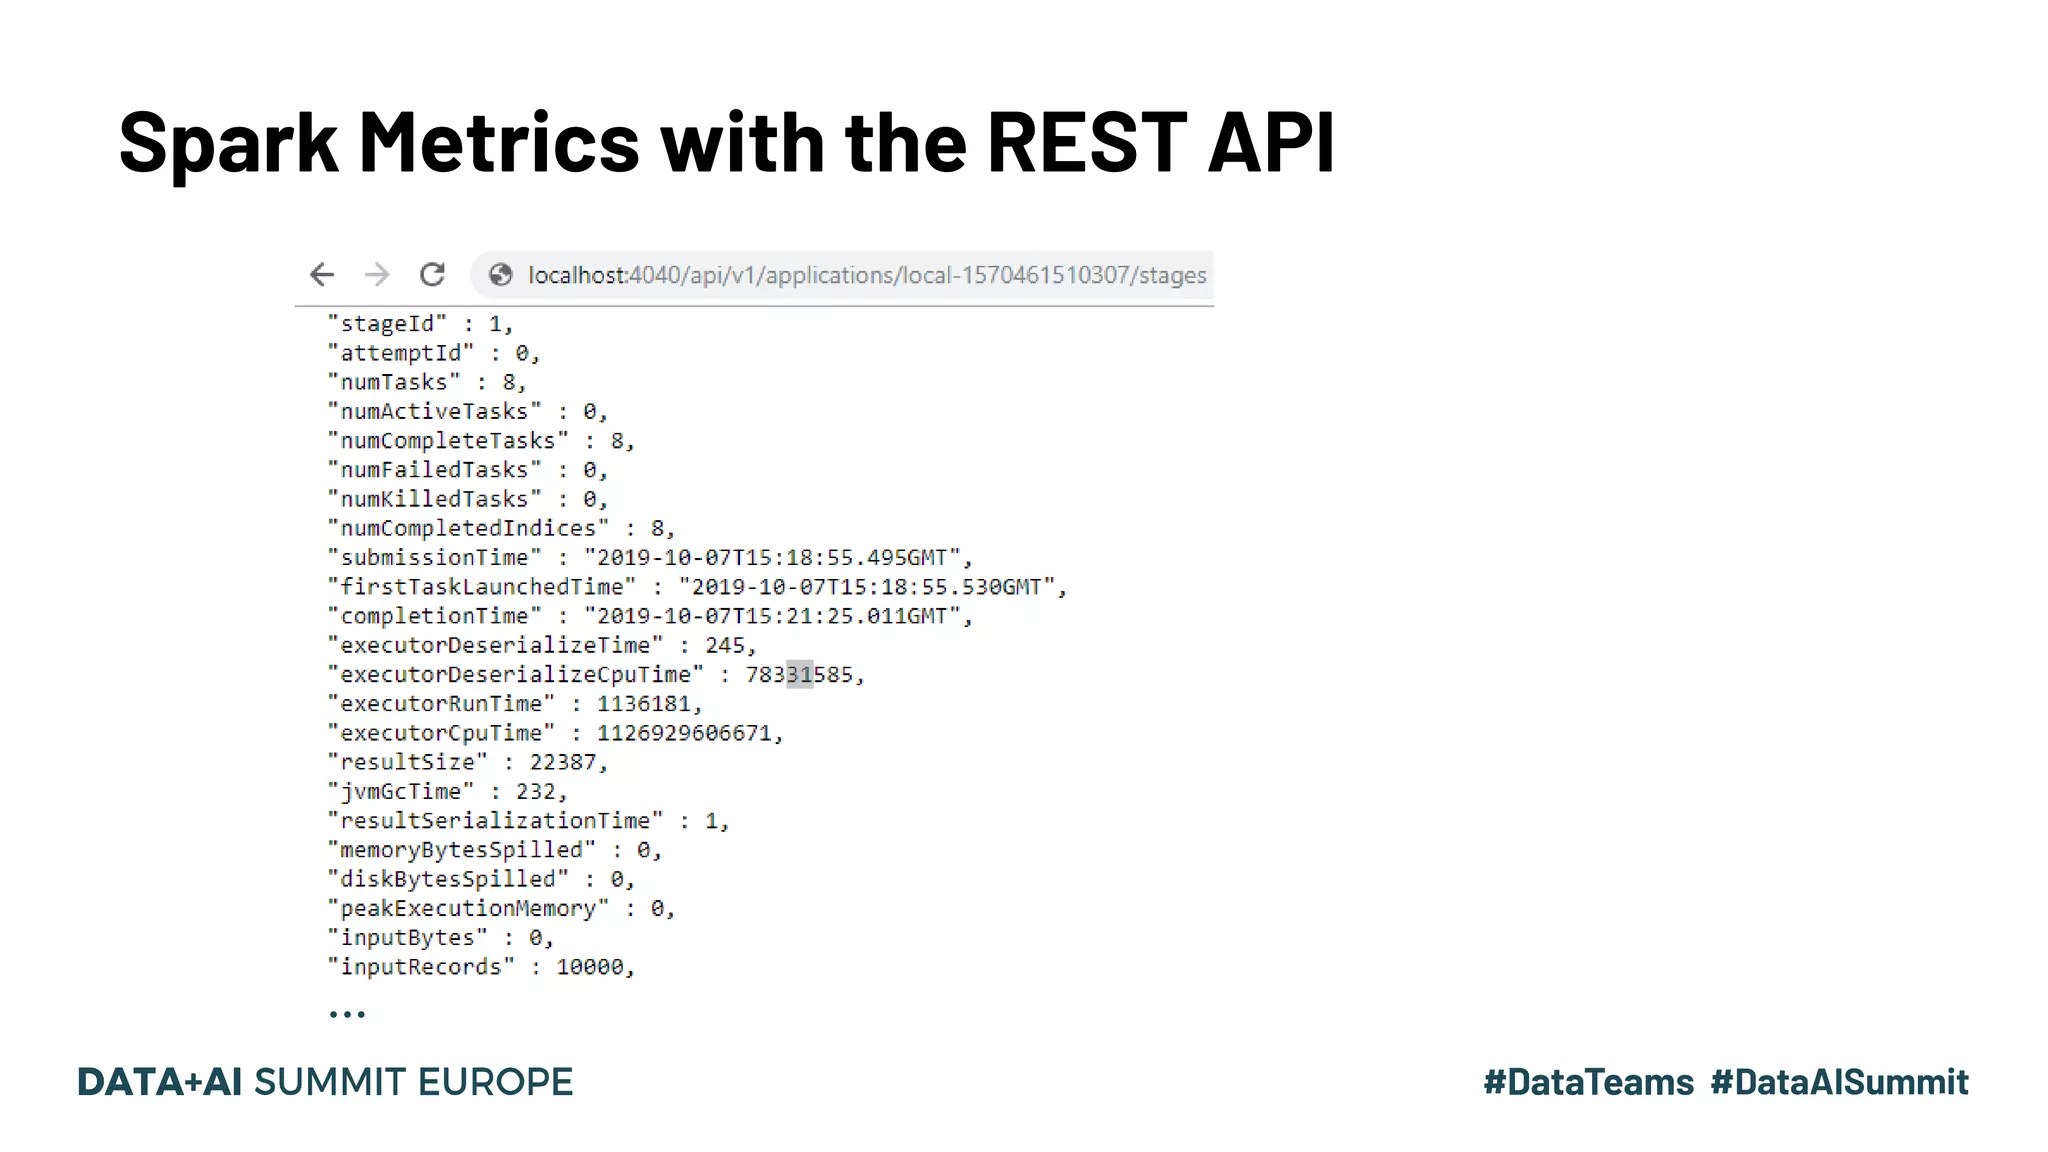
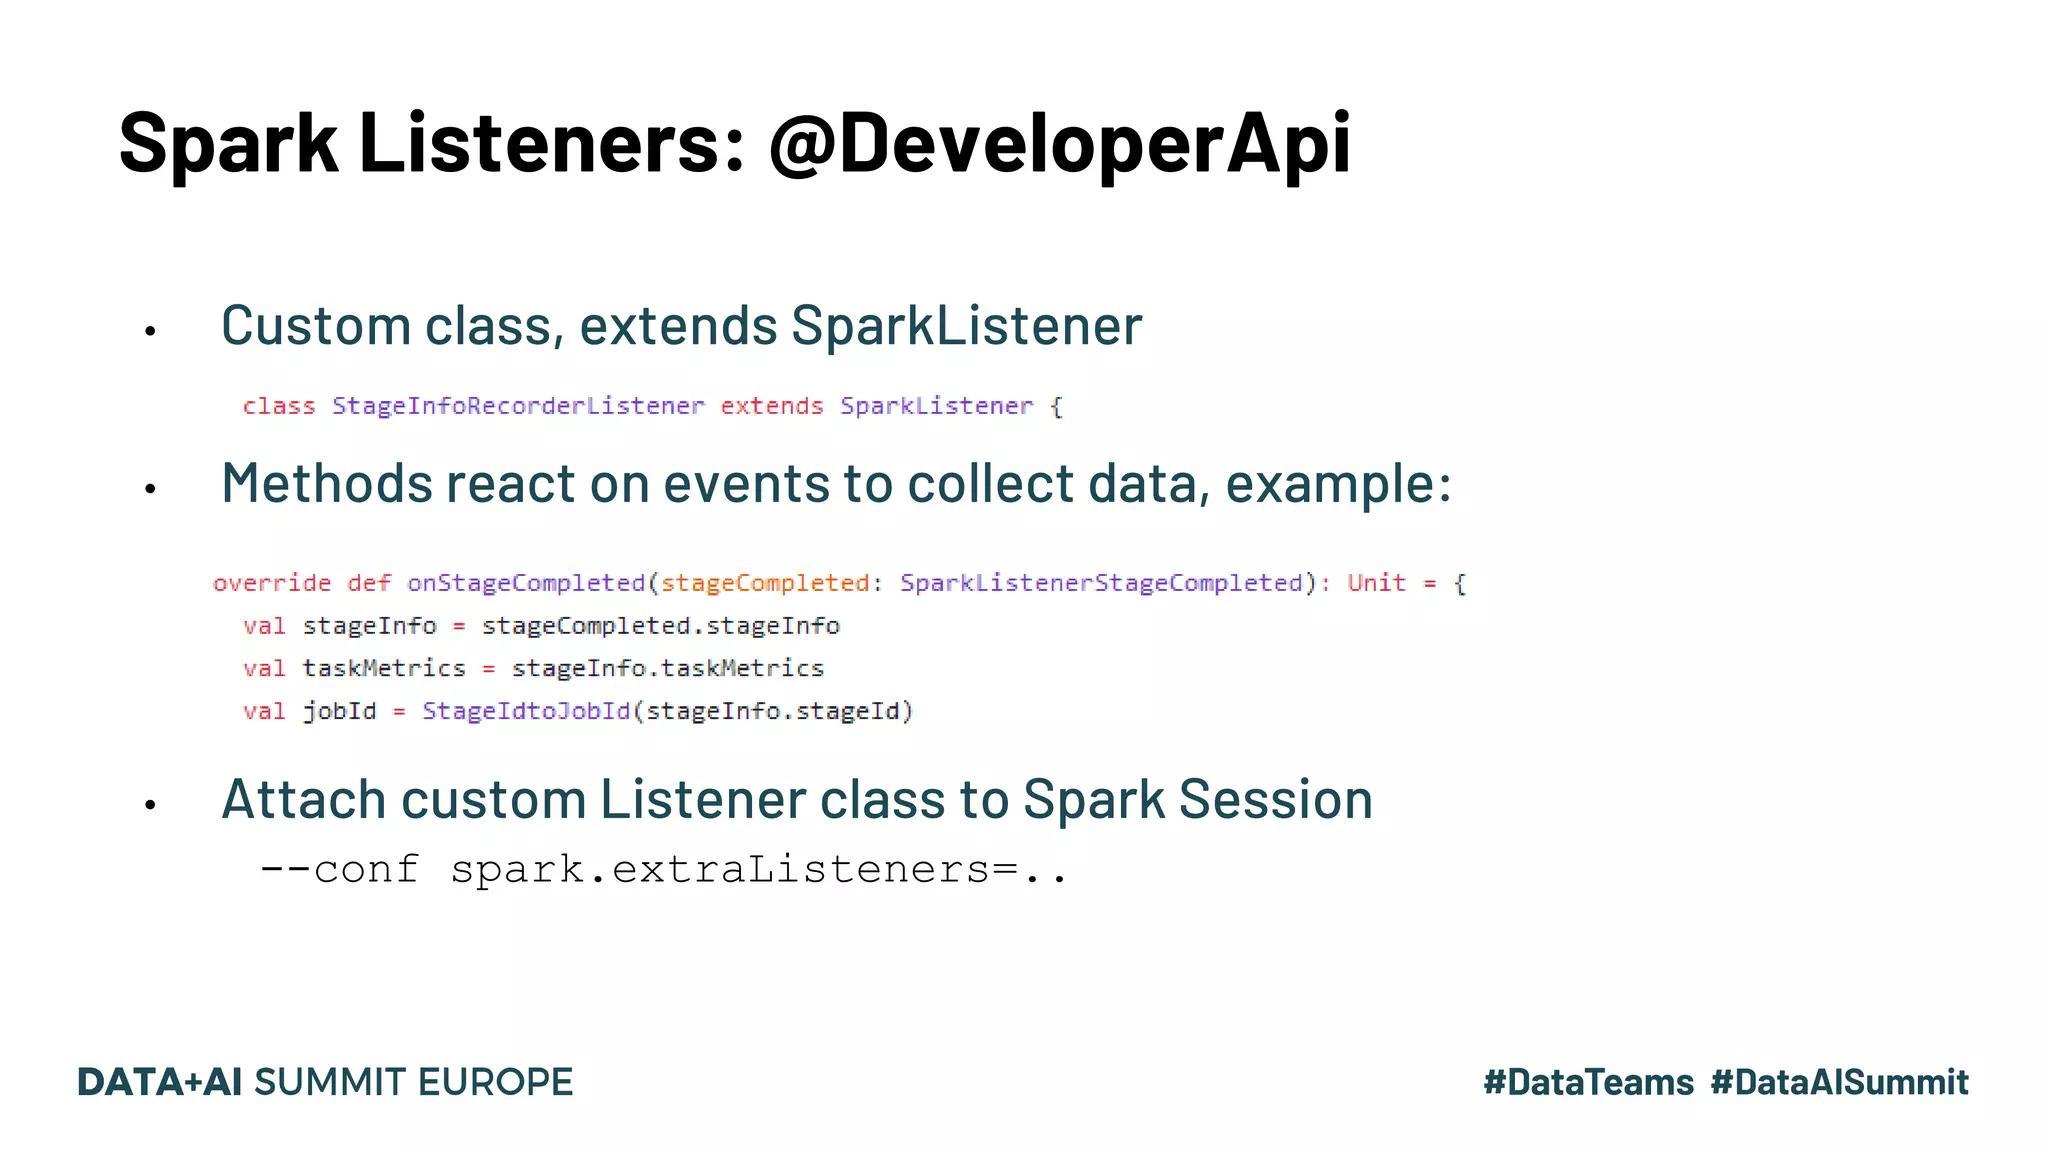
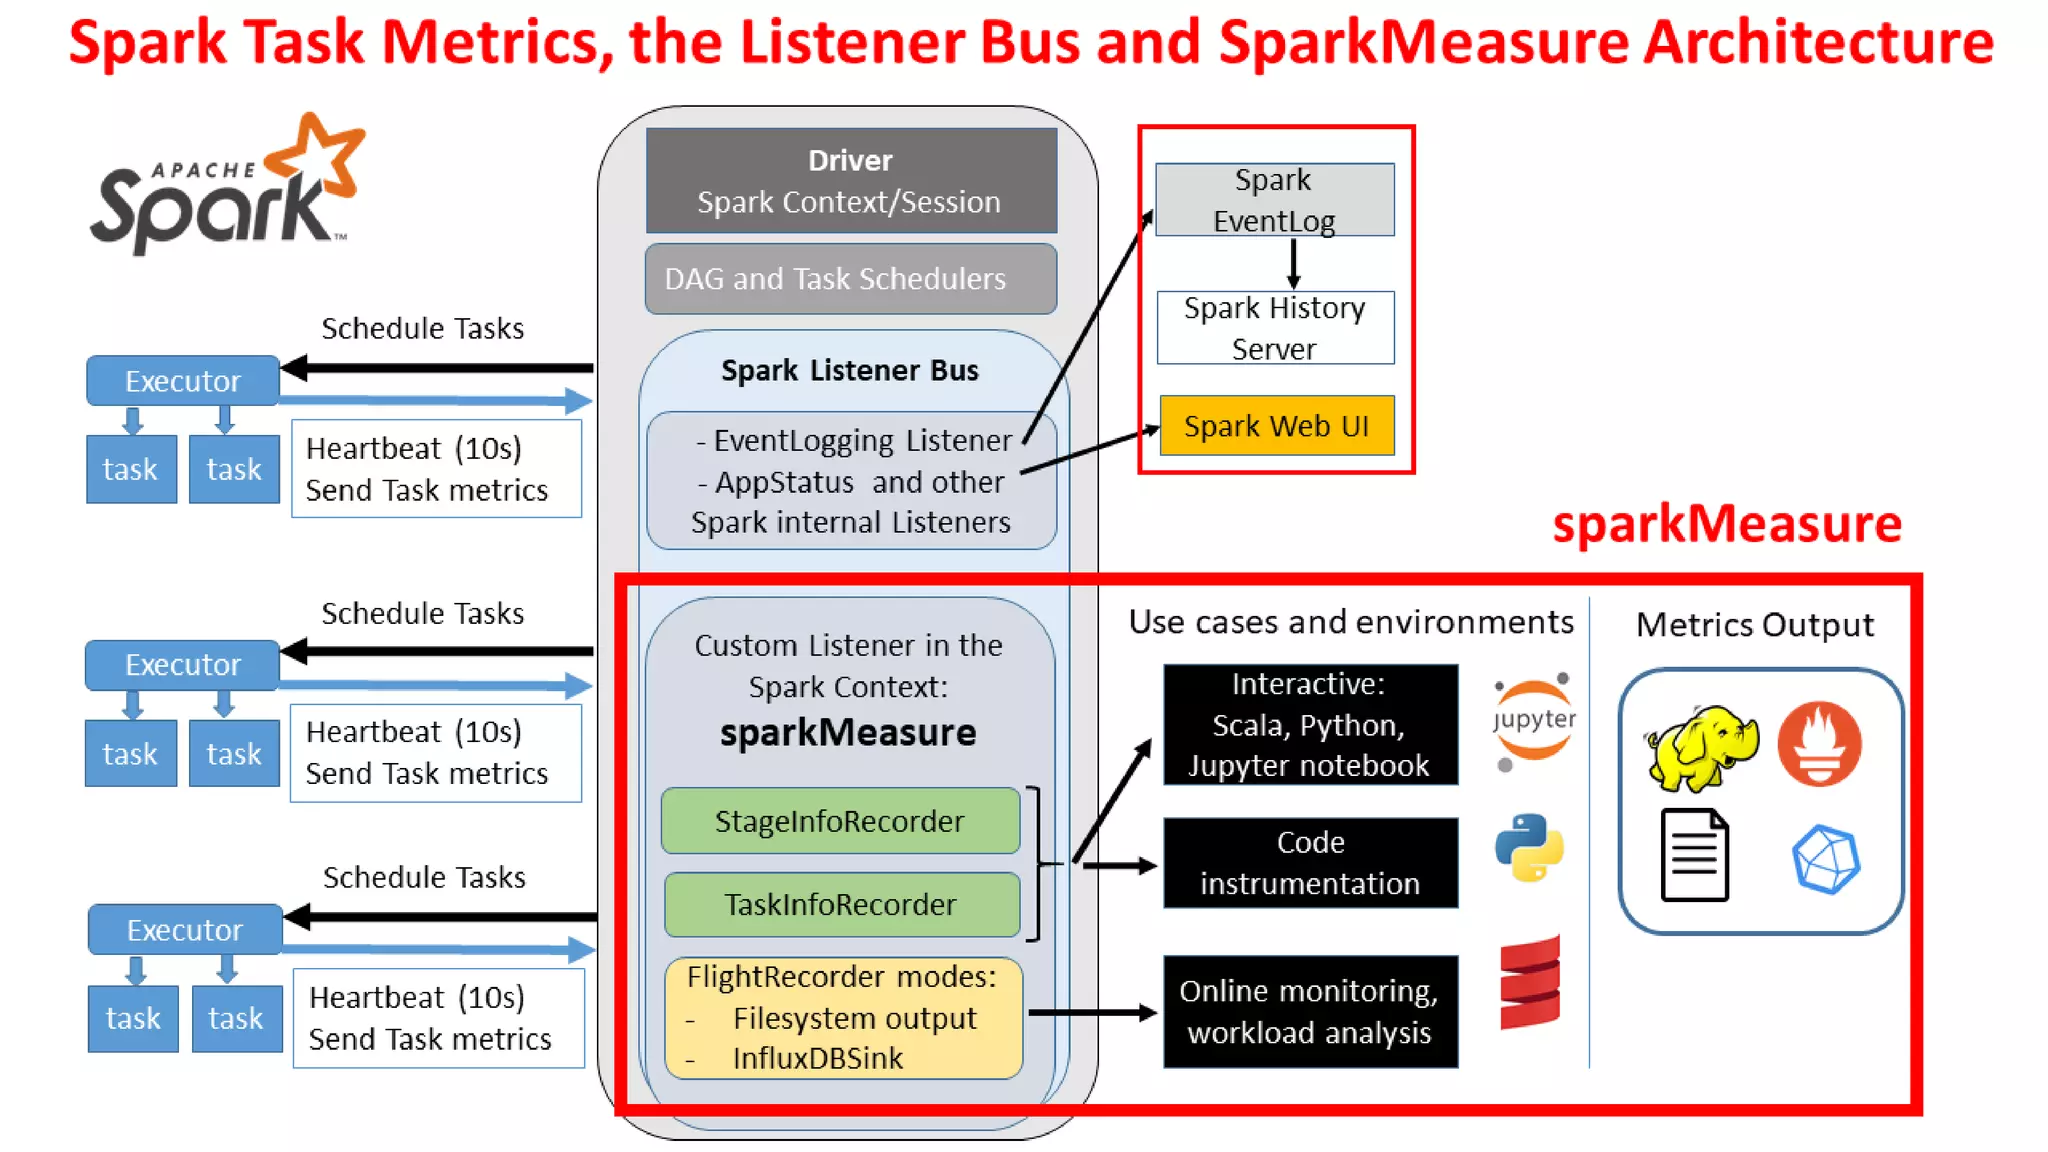
In-depth look at Spark's REST API for metrics, custom SparkListeners, and architecture of sparkMeasure.
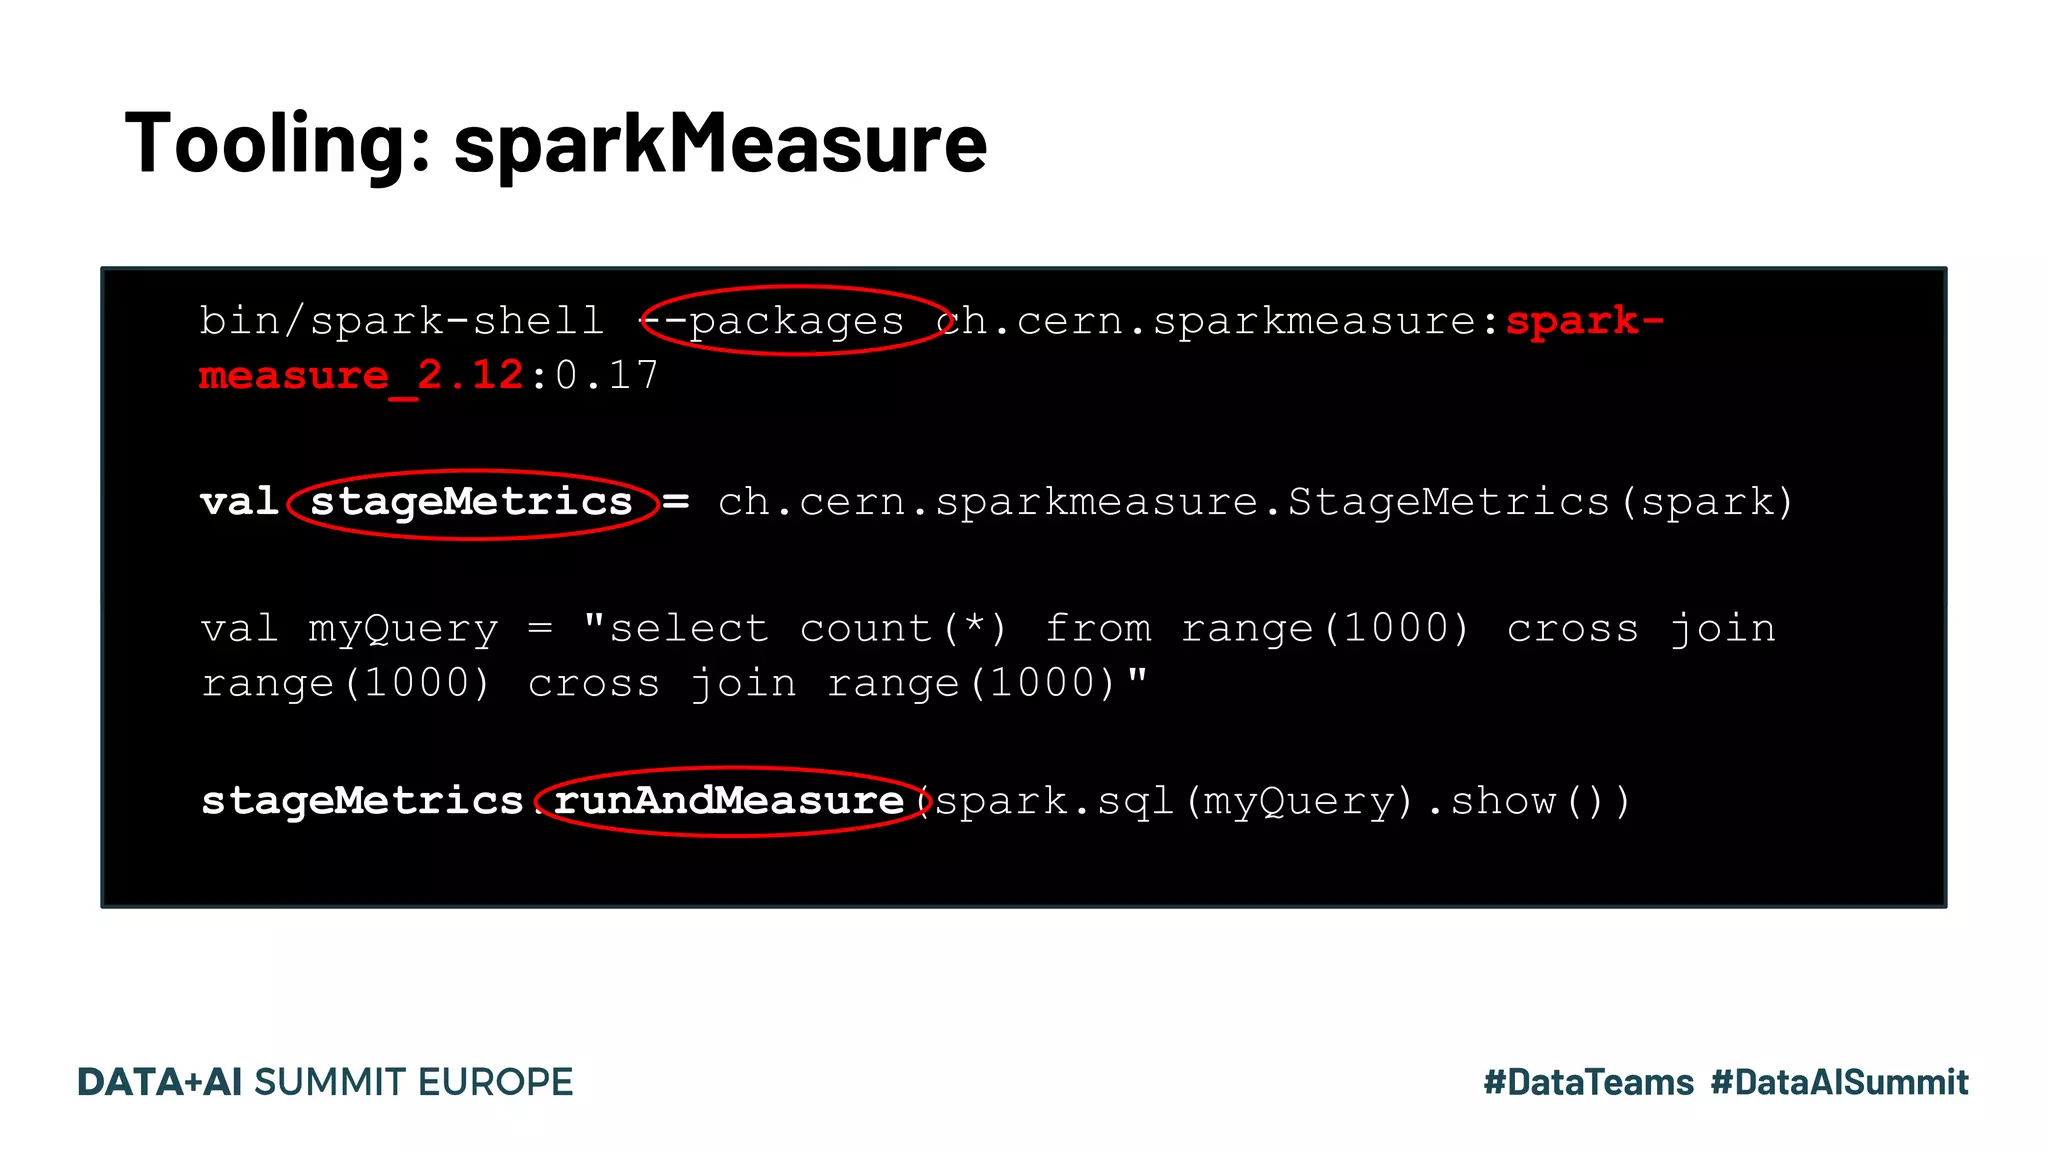
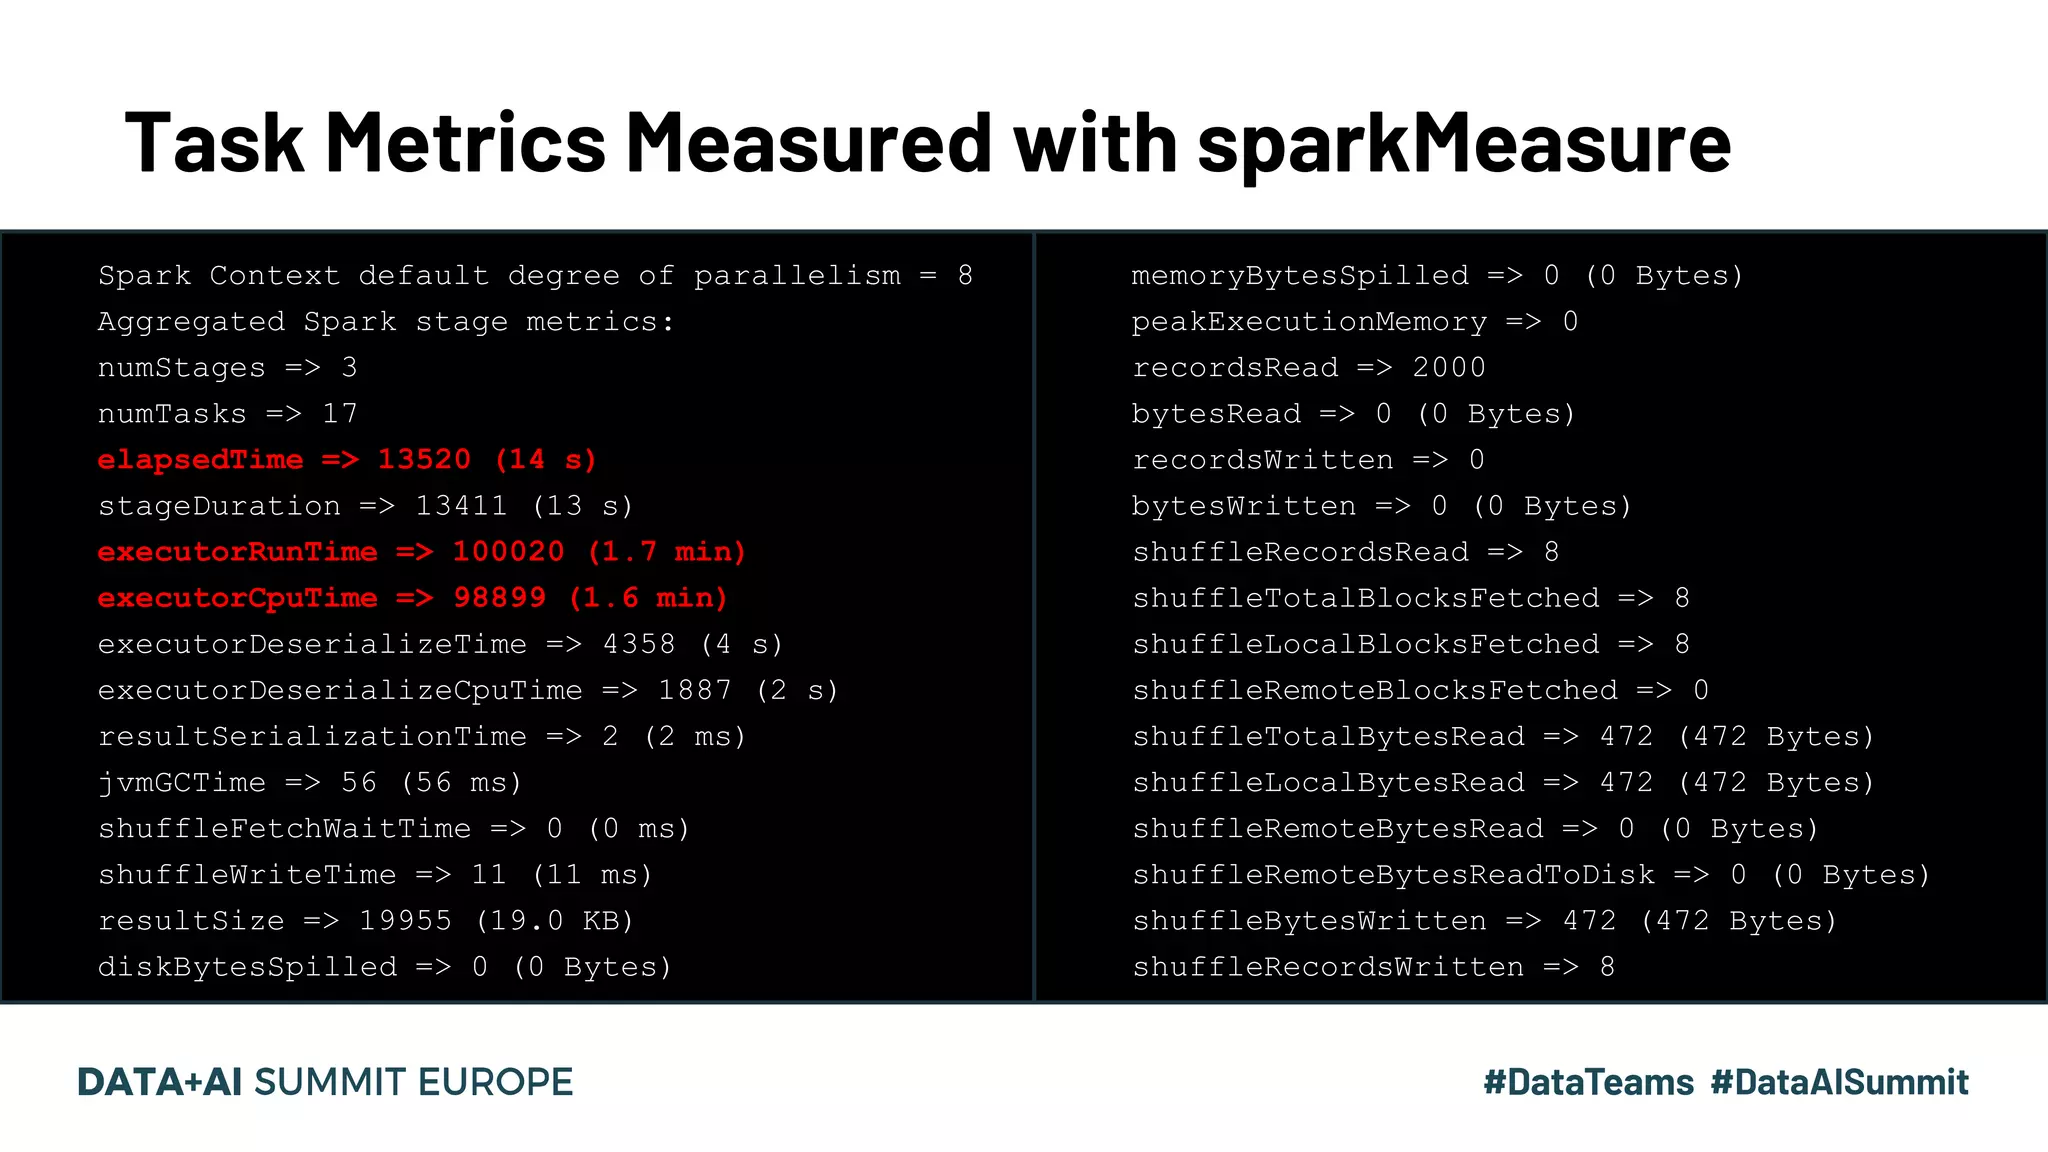
Introduction to sparkMeasure tool; comprehensive metrics including execution and resource usage statistics.
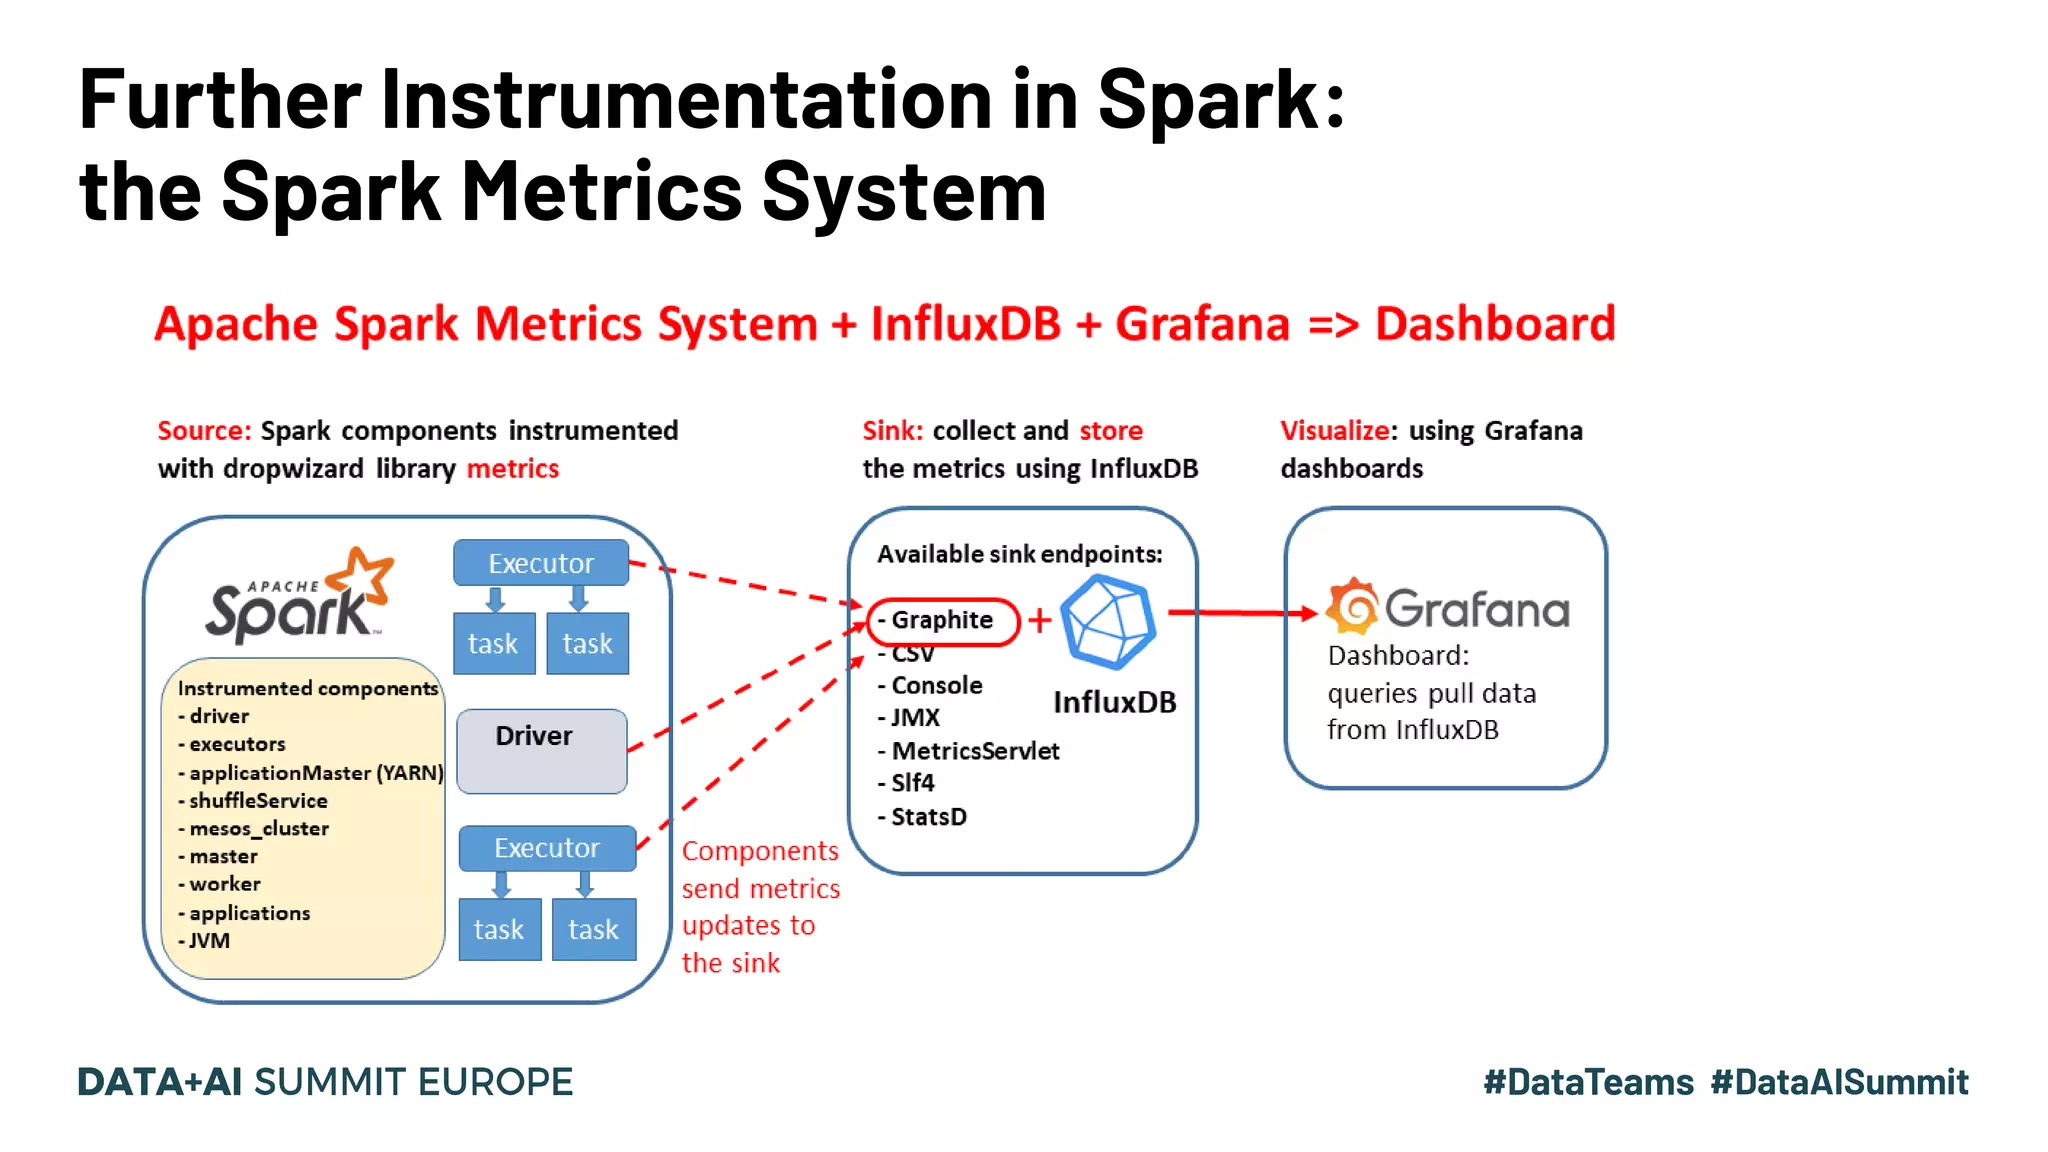
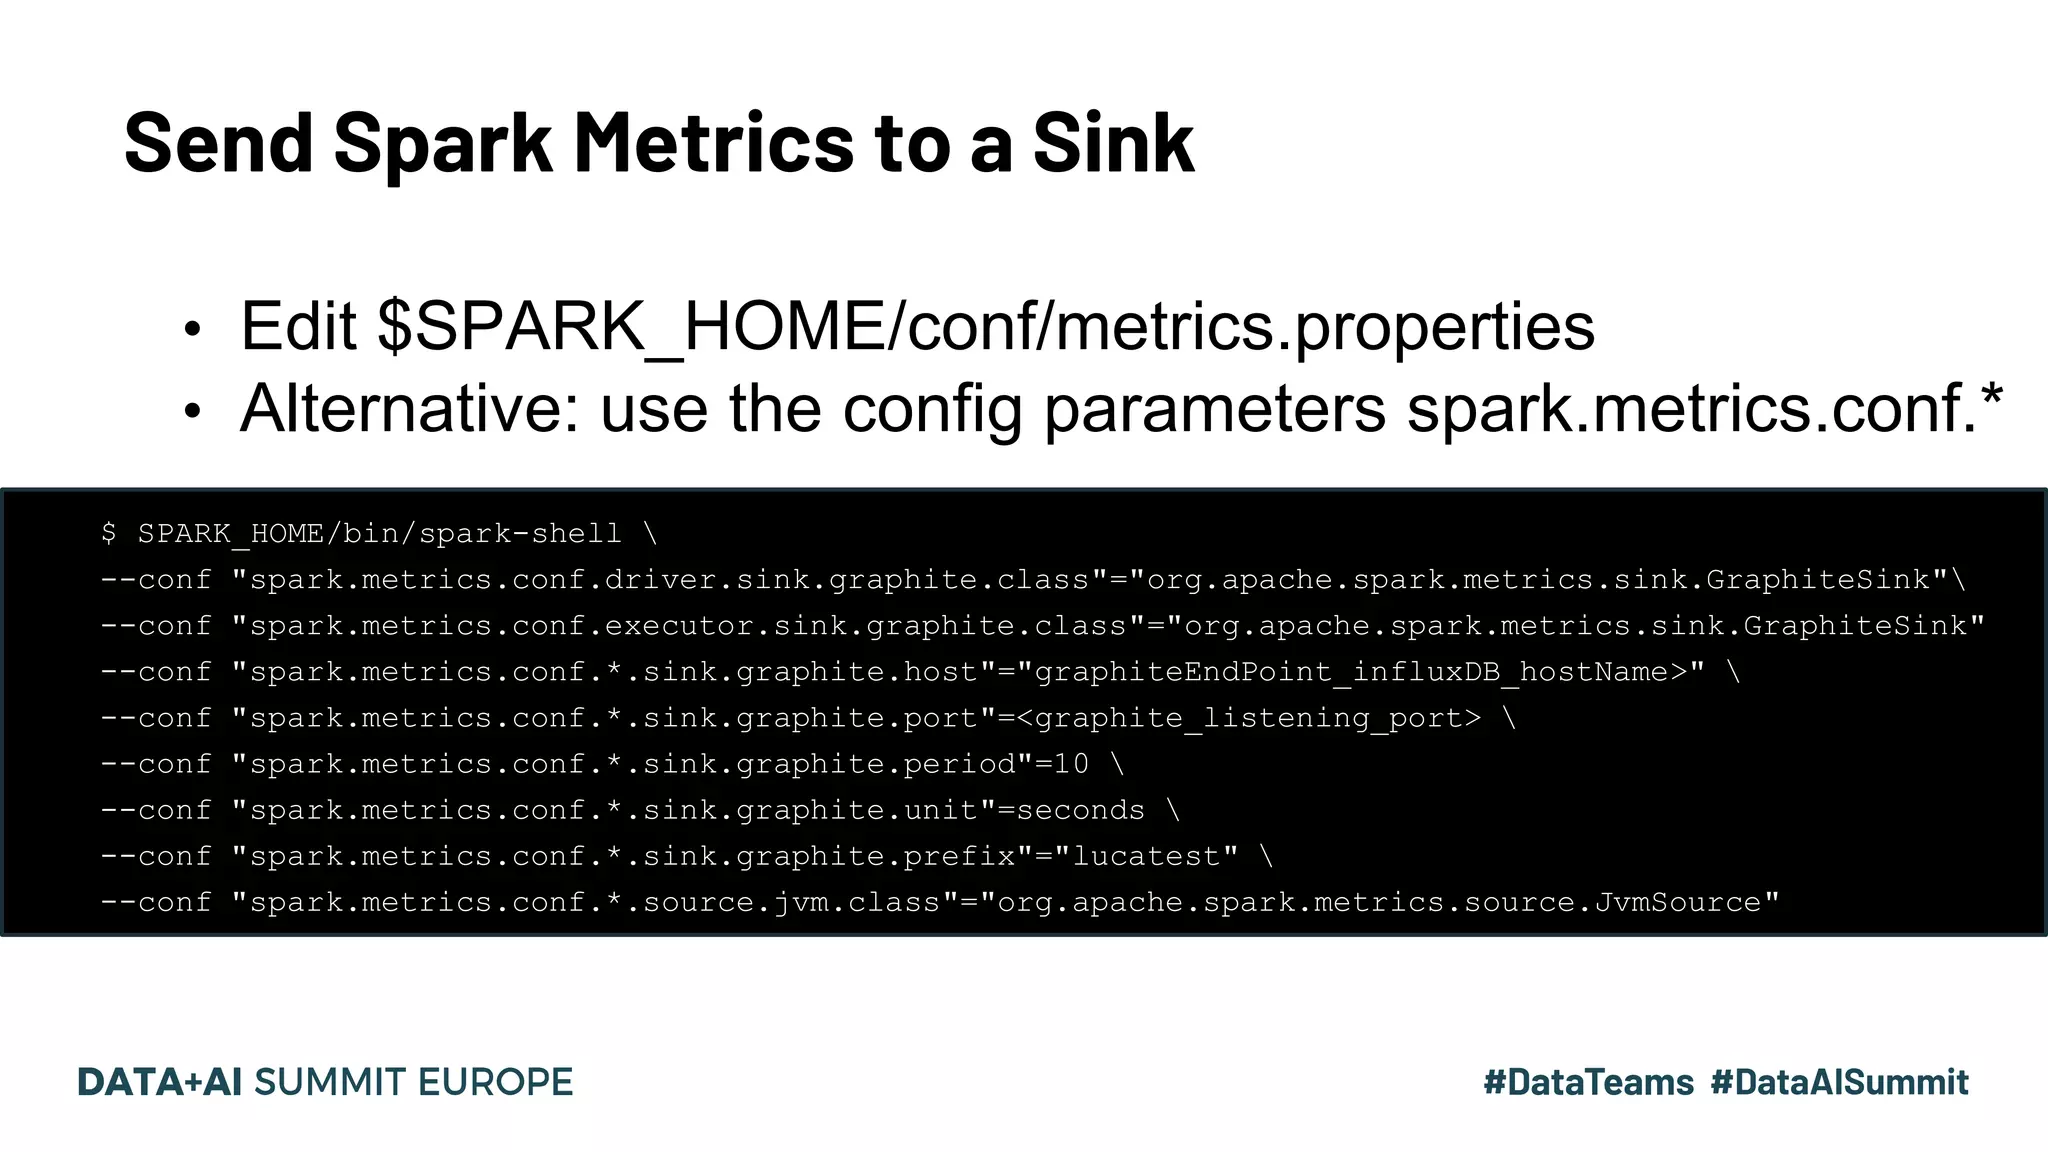
Overview of the Spark Metrics System; instructions on sending metrics to external sinks like Graphite.
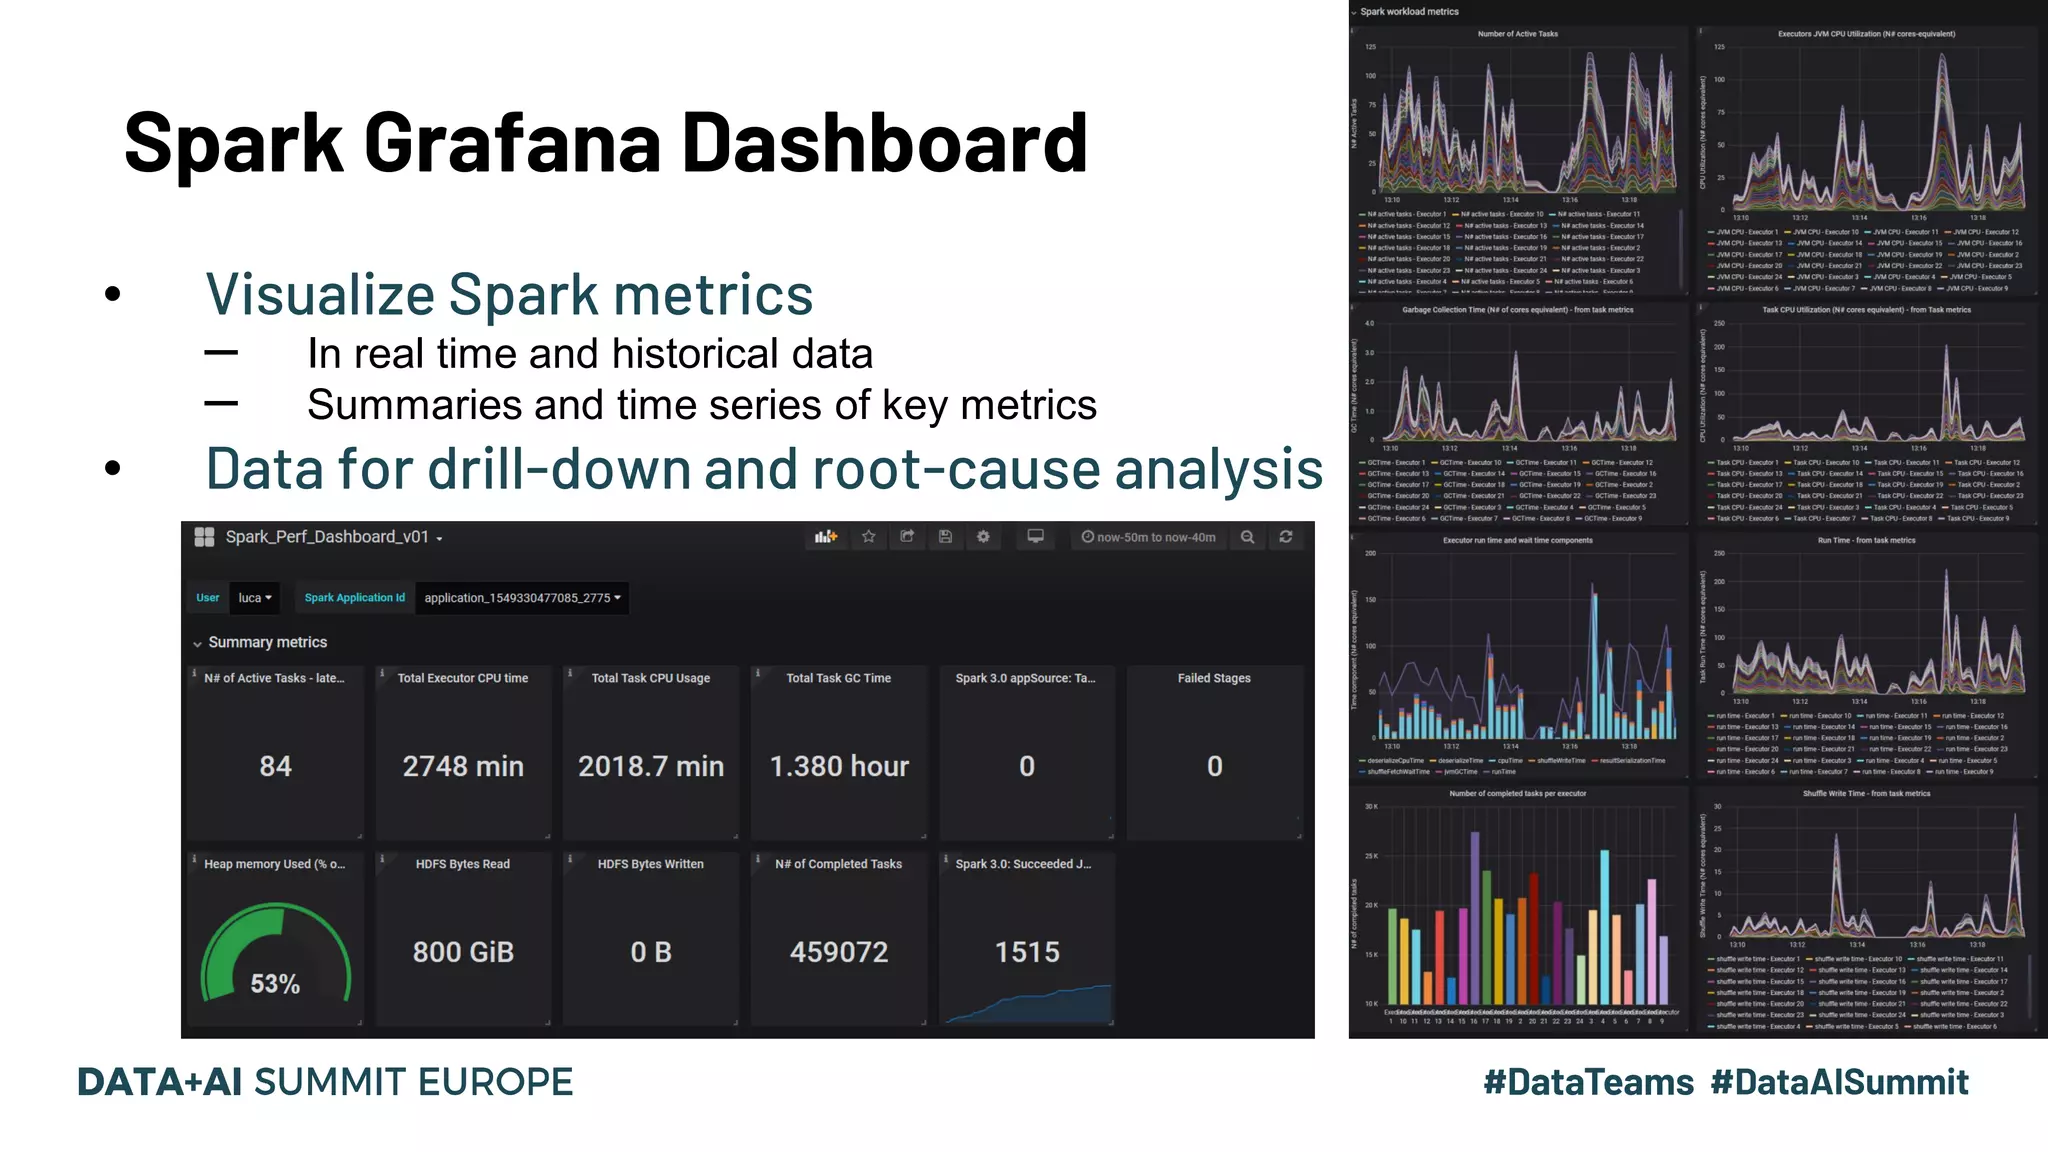
Use of Grafana for visualizing Spark metrics in real time, showing key metrics summaries.
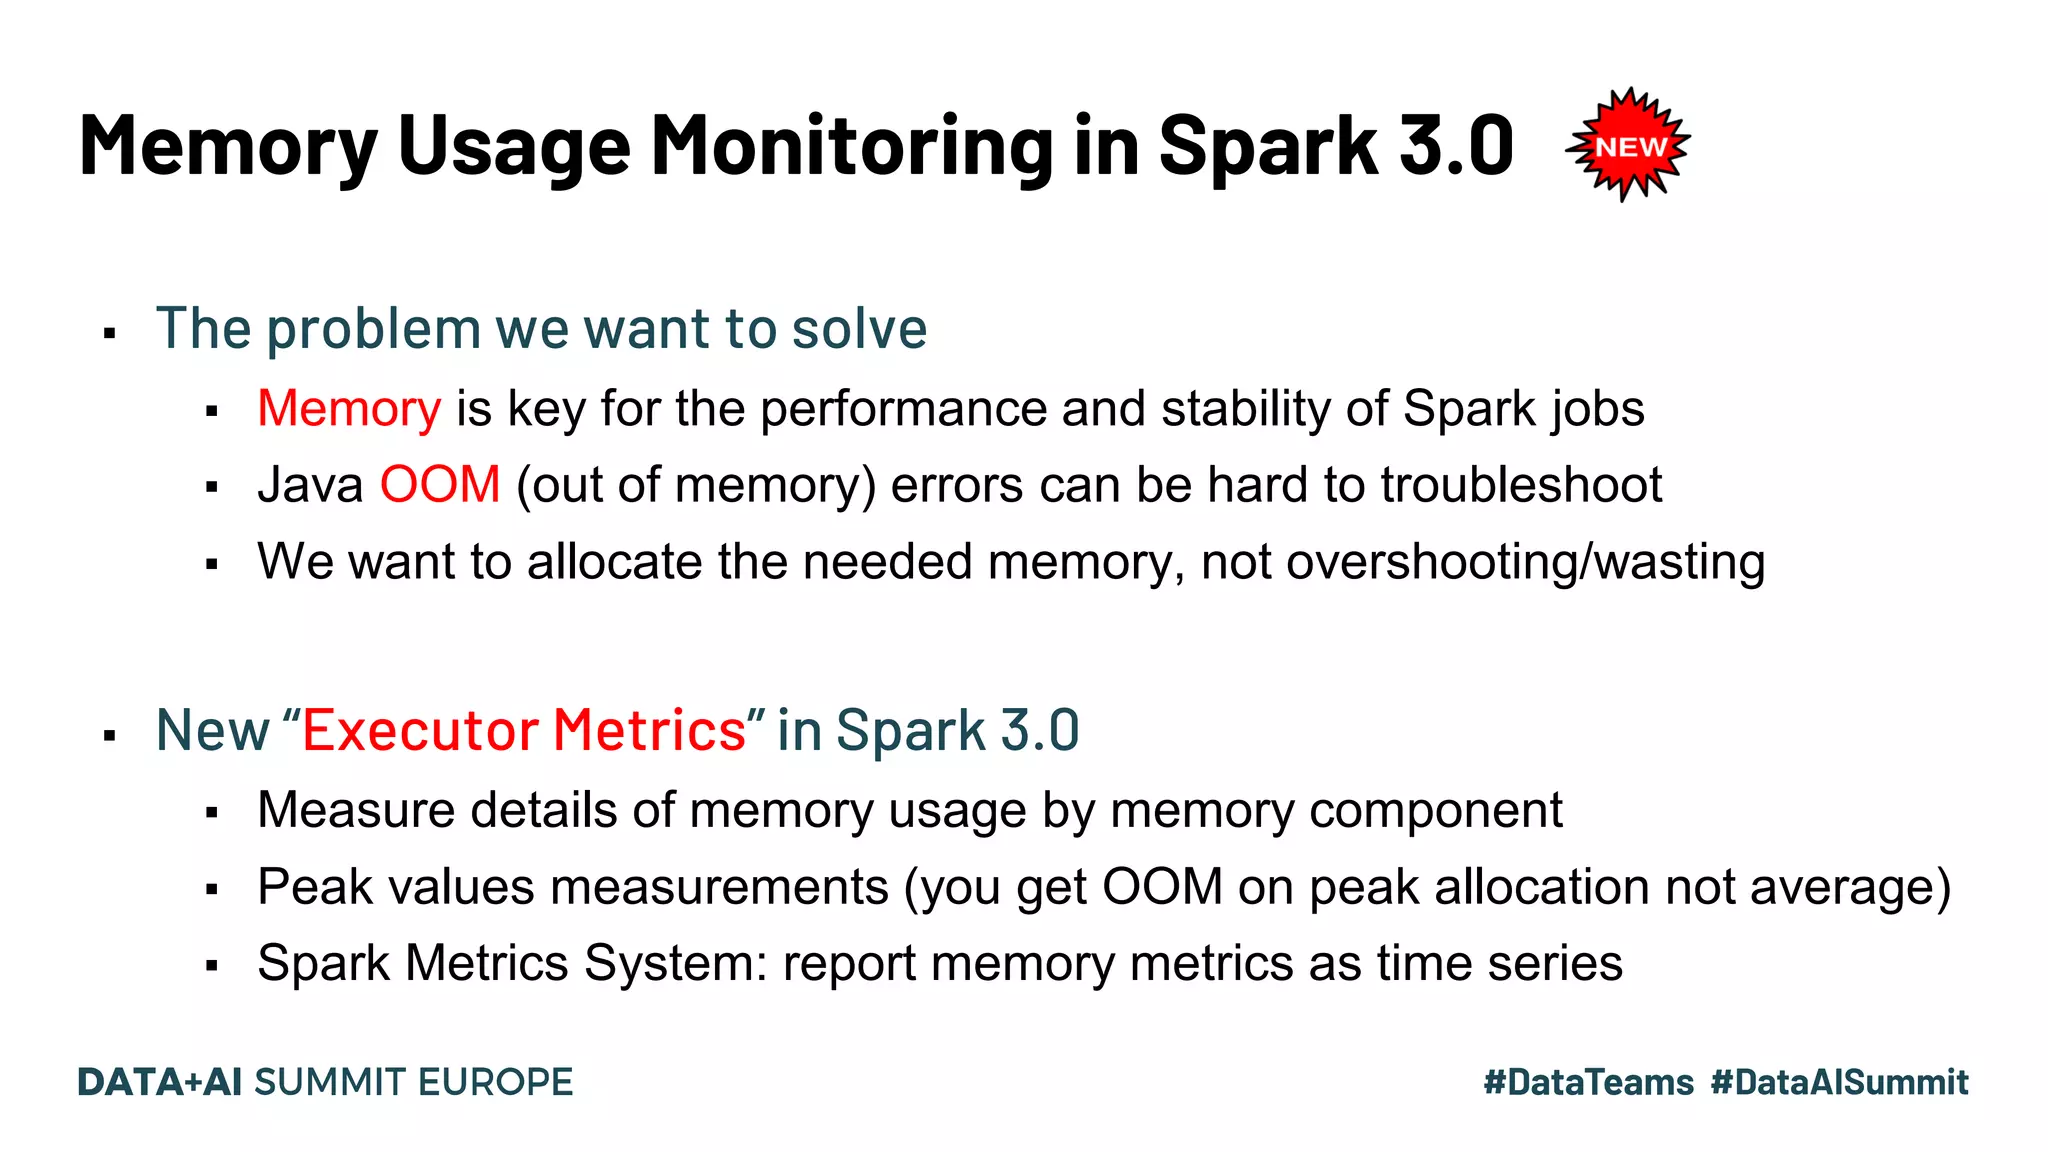
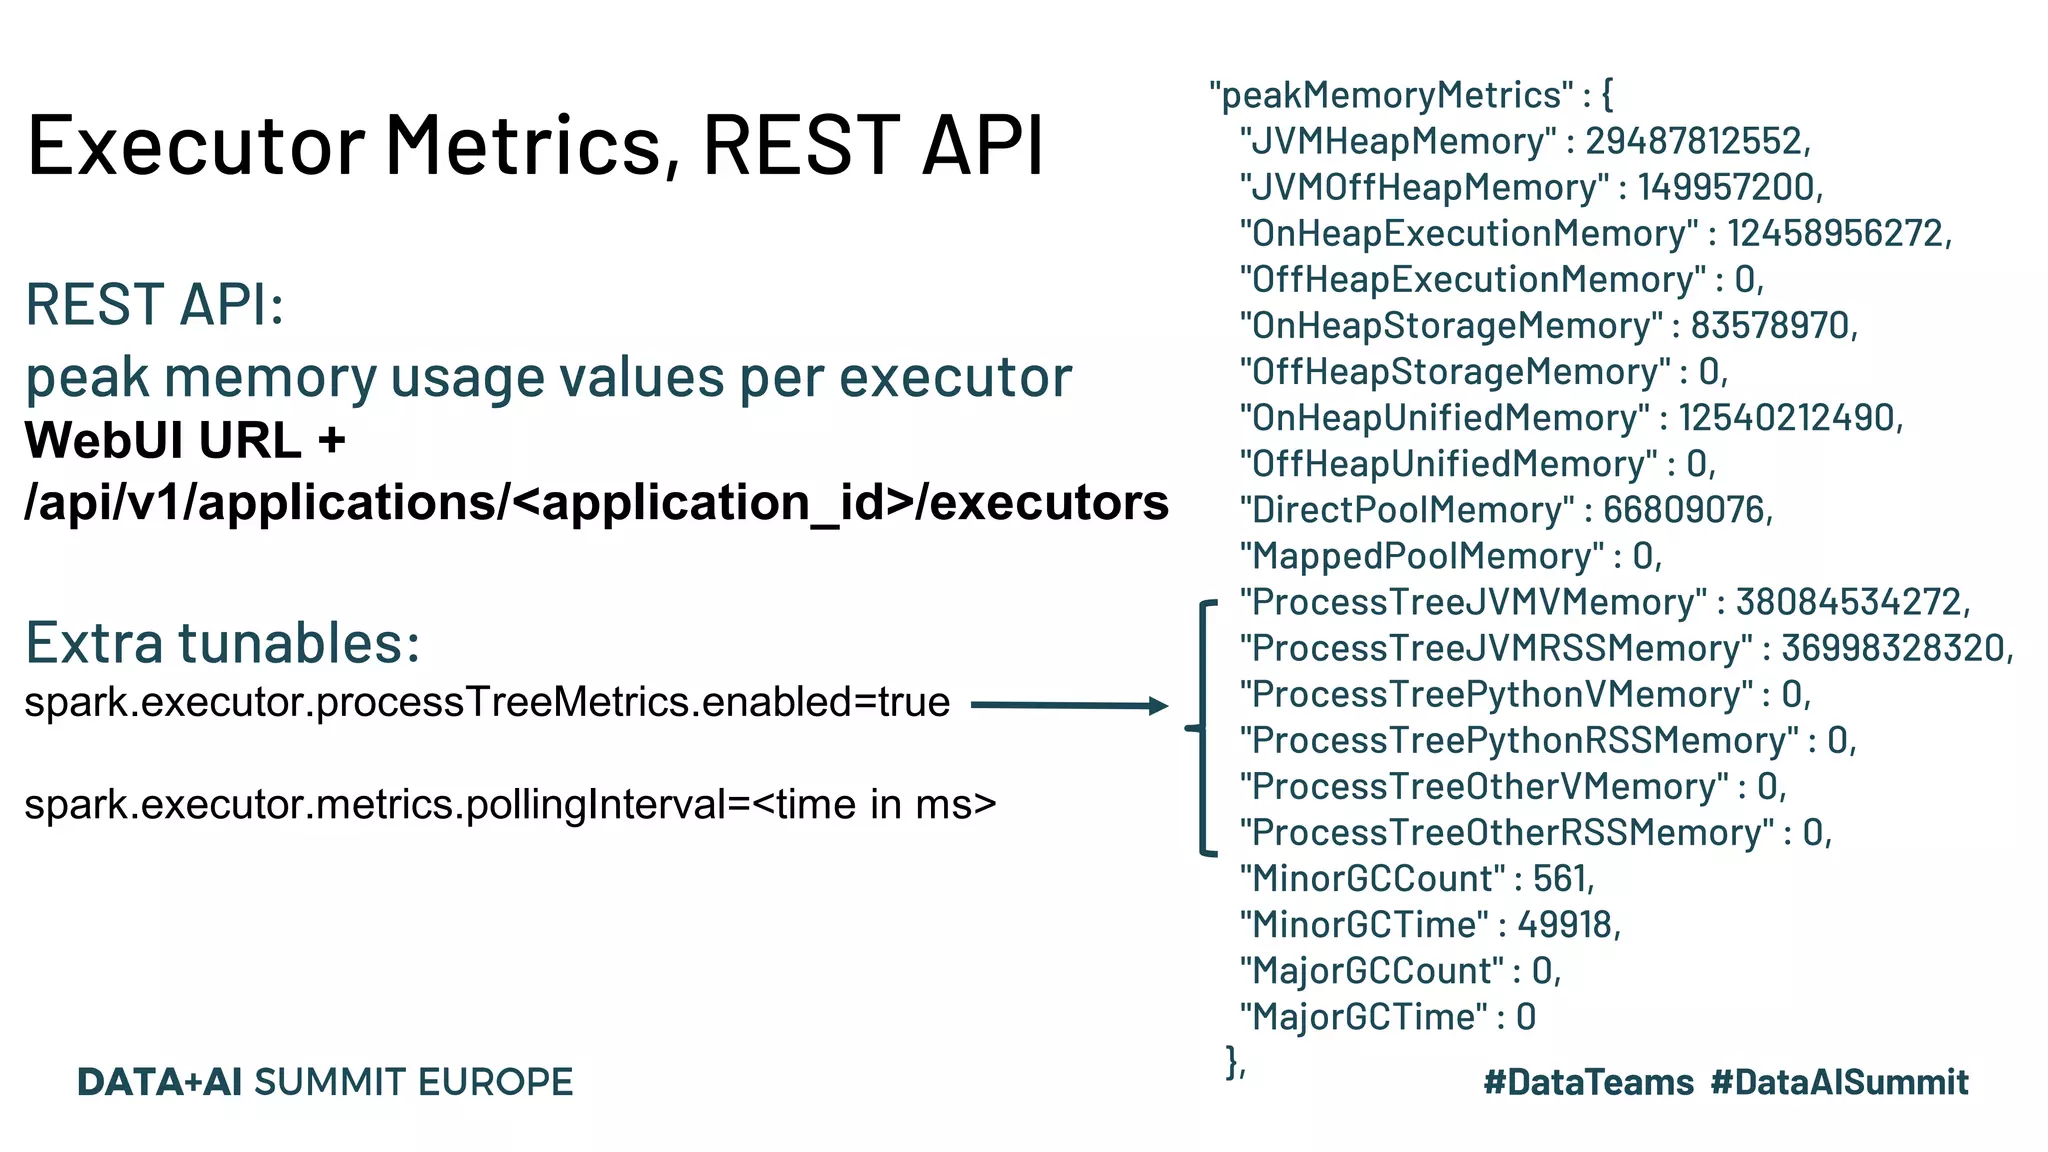
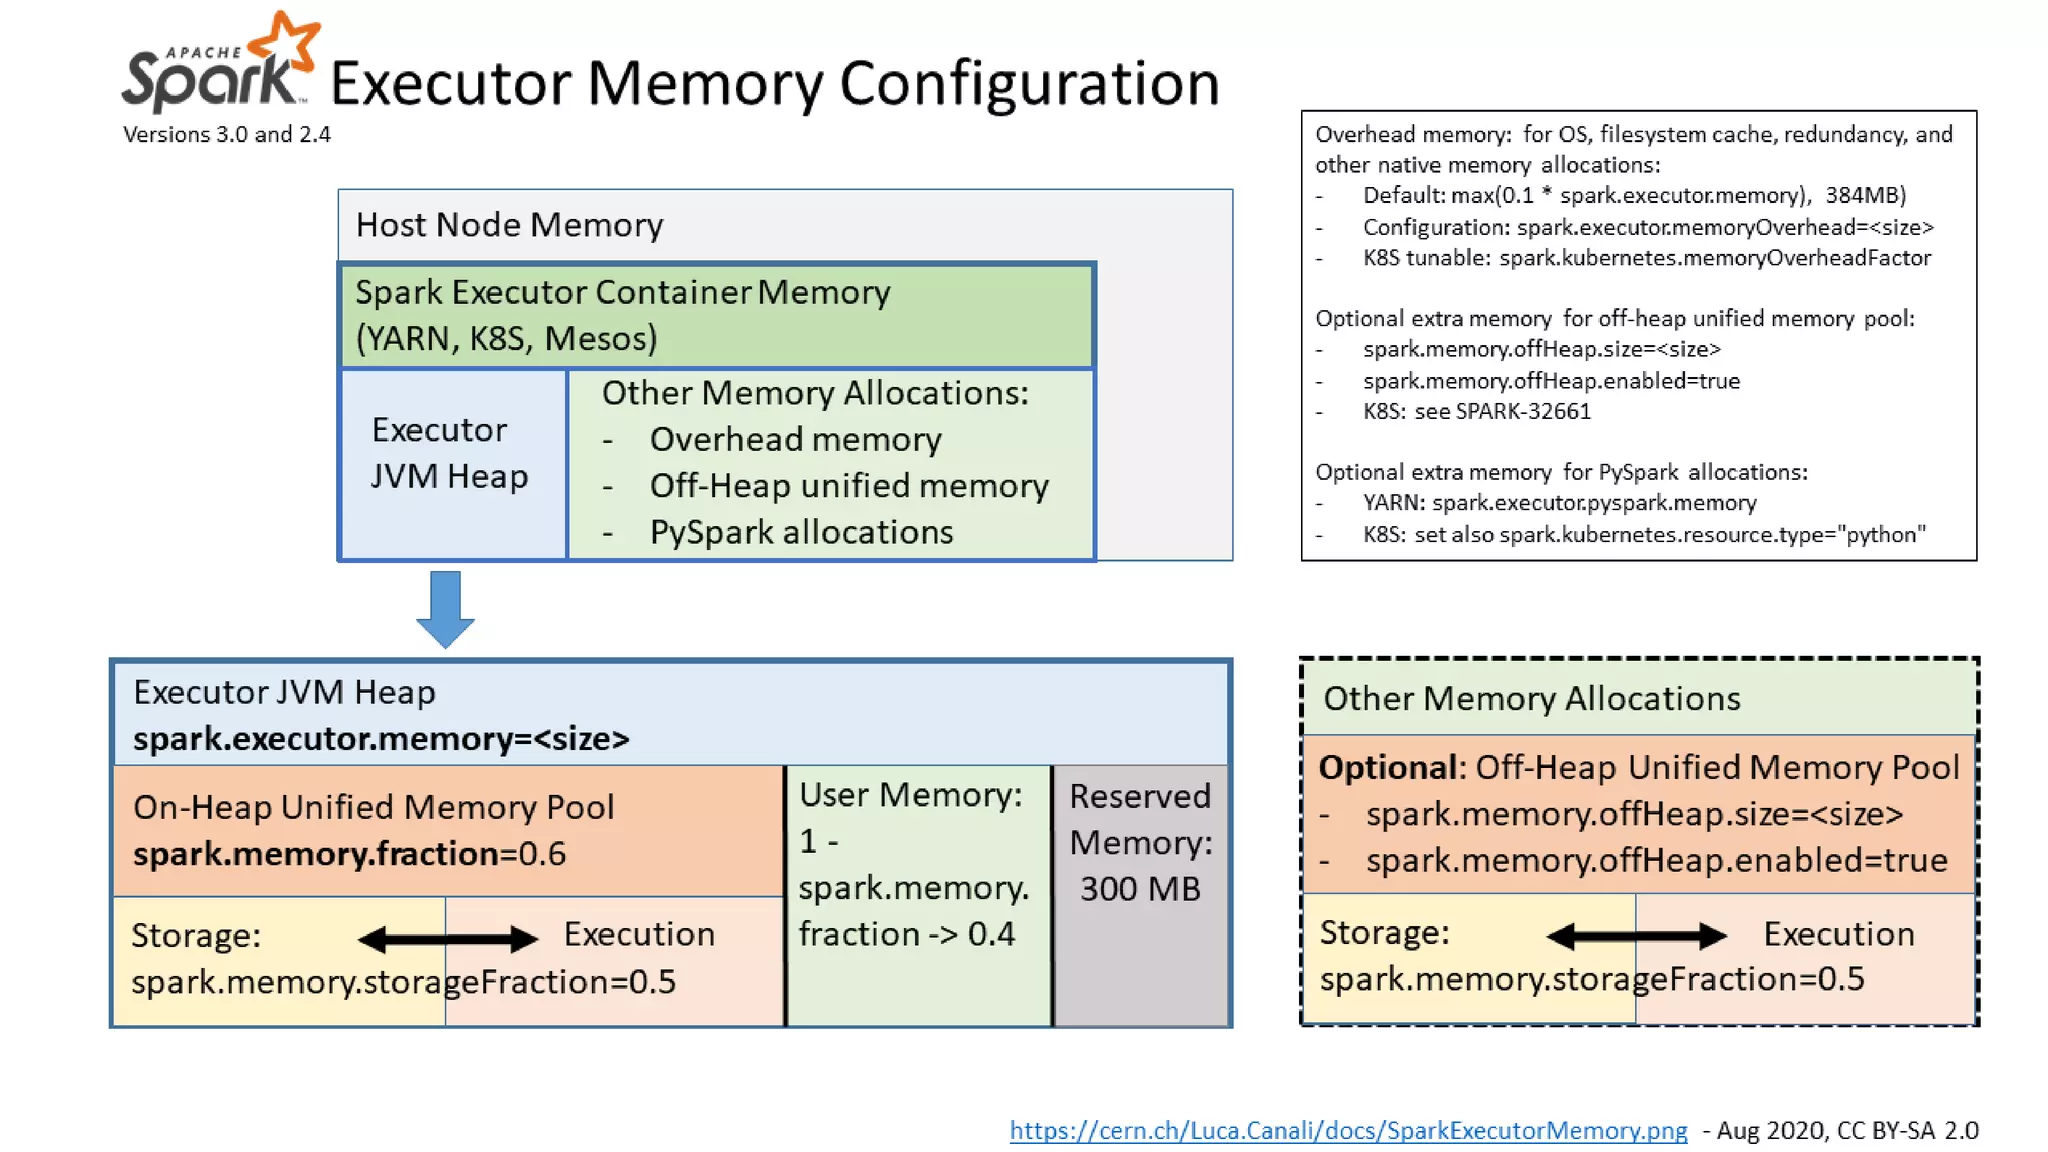
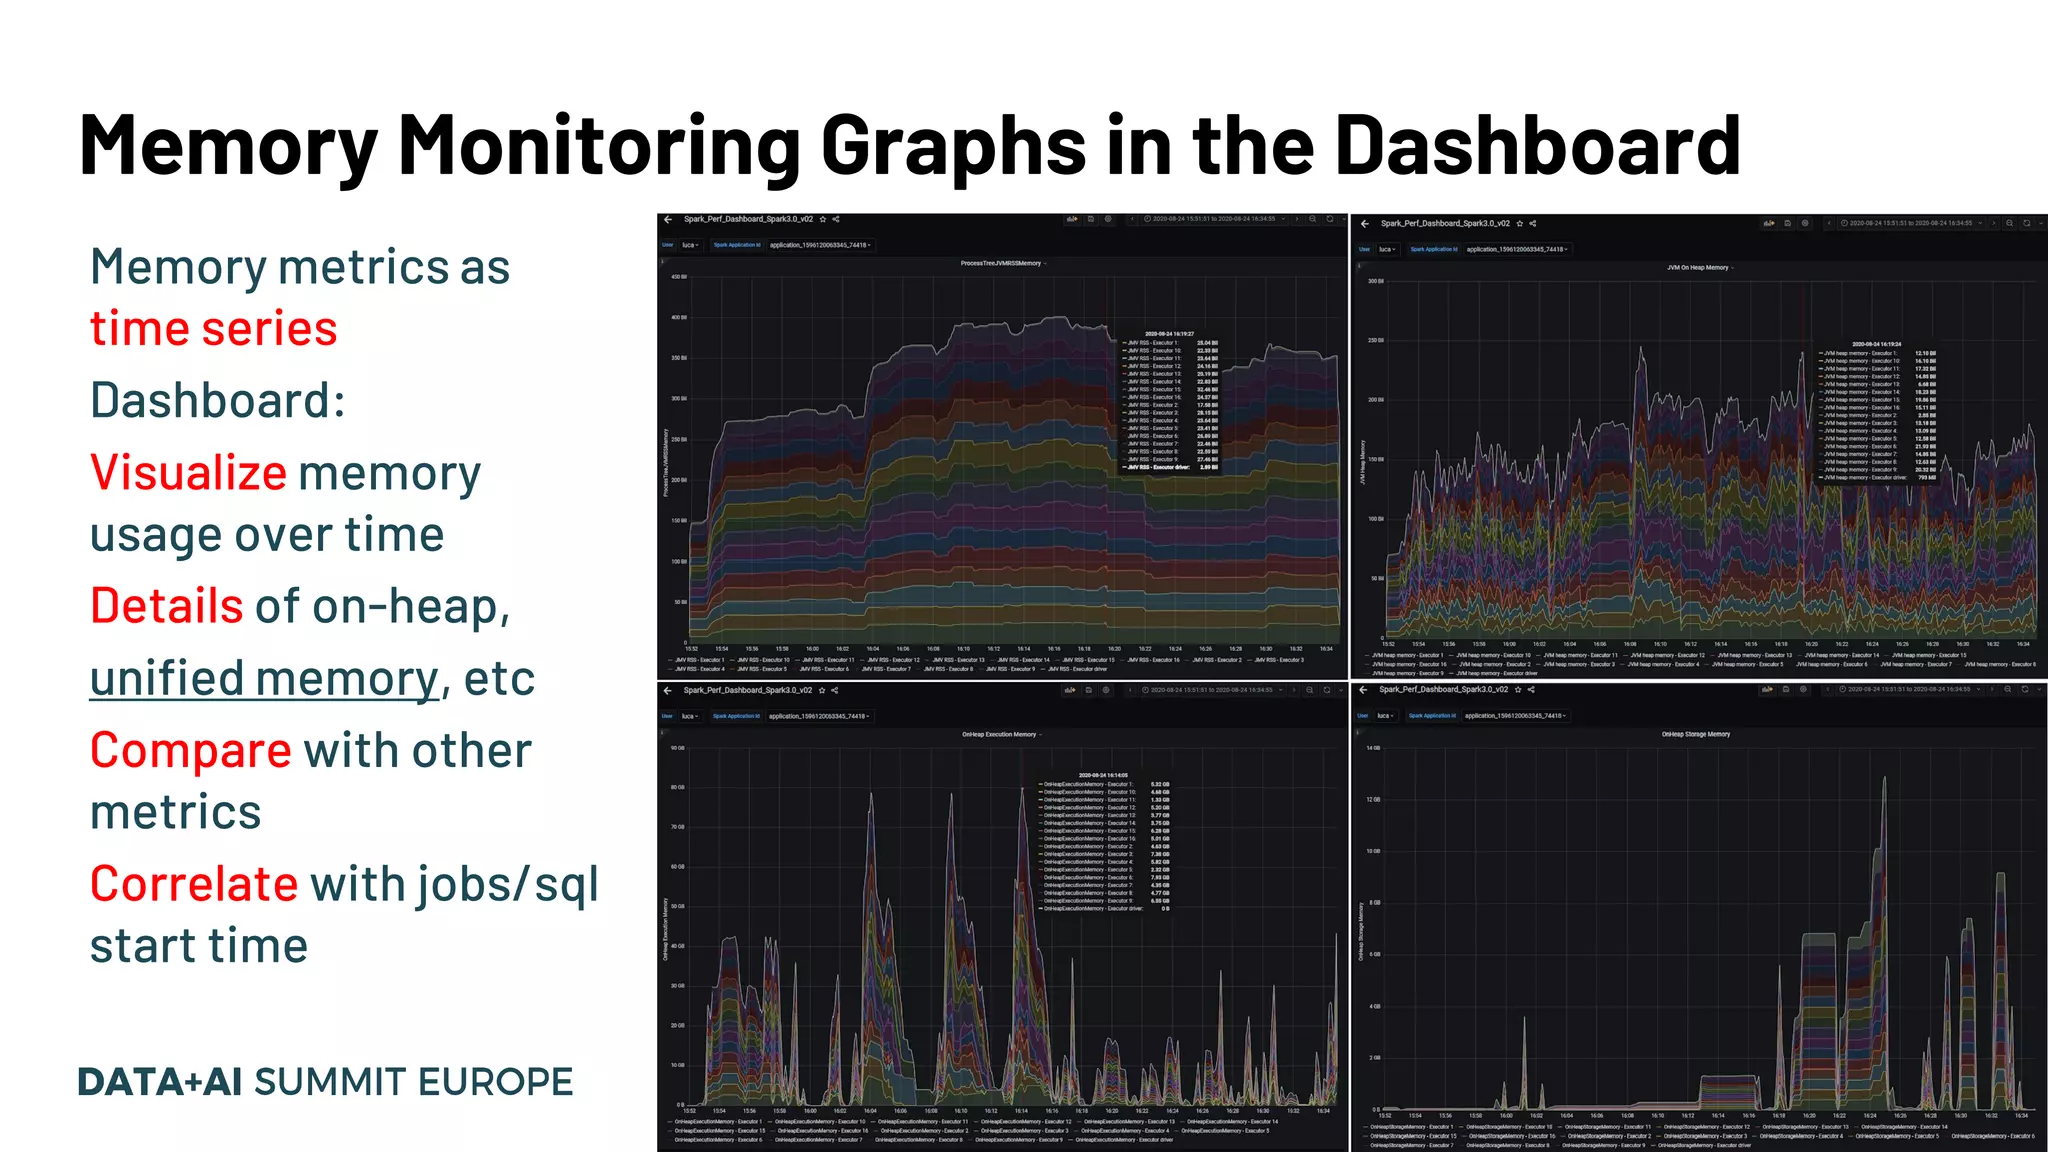
Improvements in memory usage monitoring; detail on how to address Out of Memory errors using new metrics.
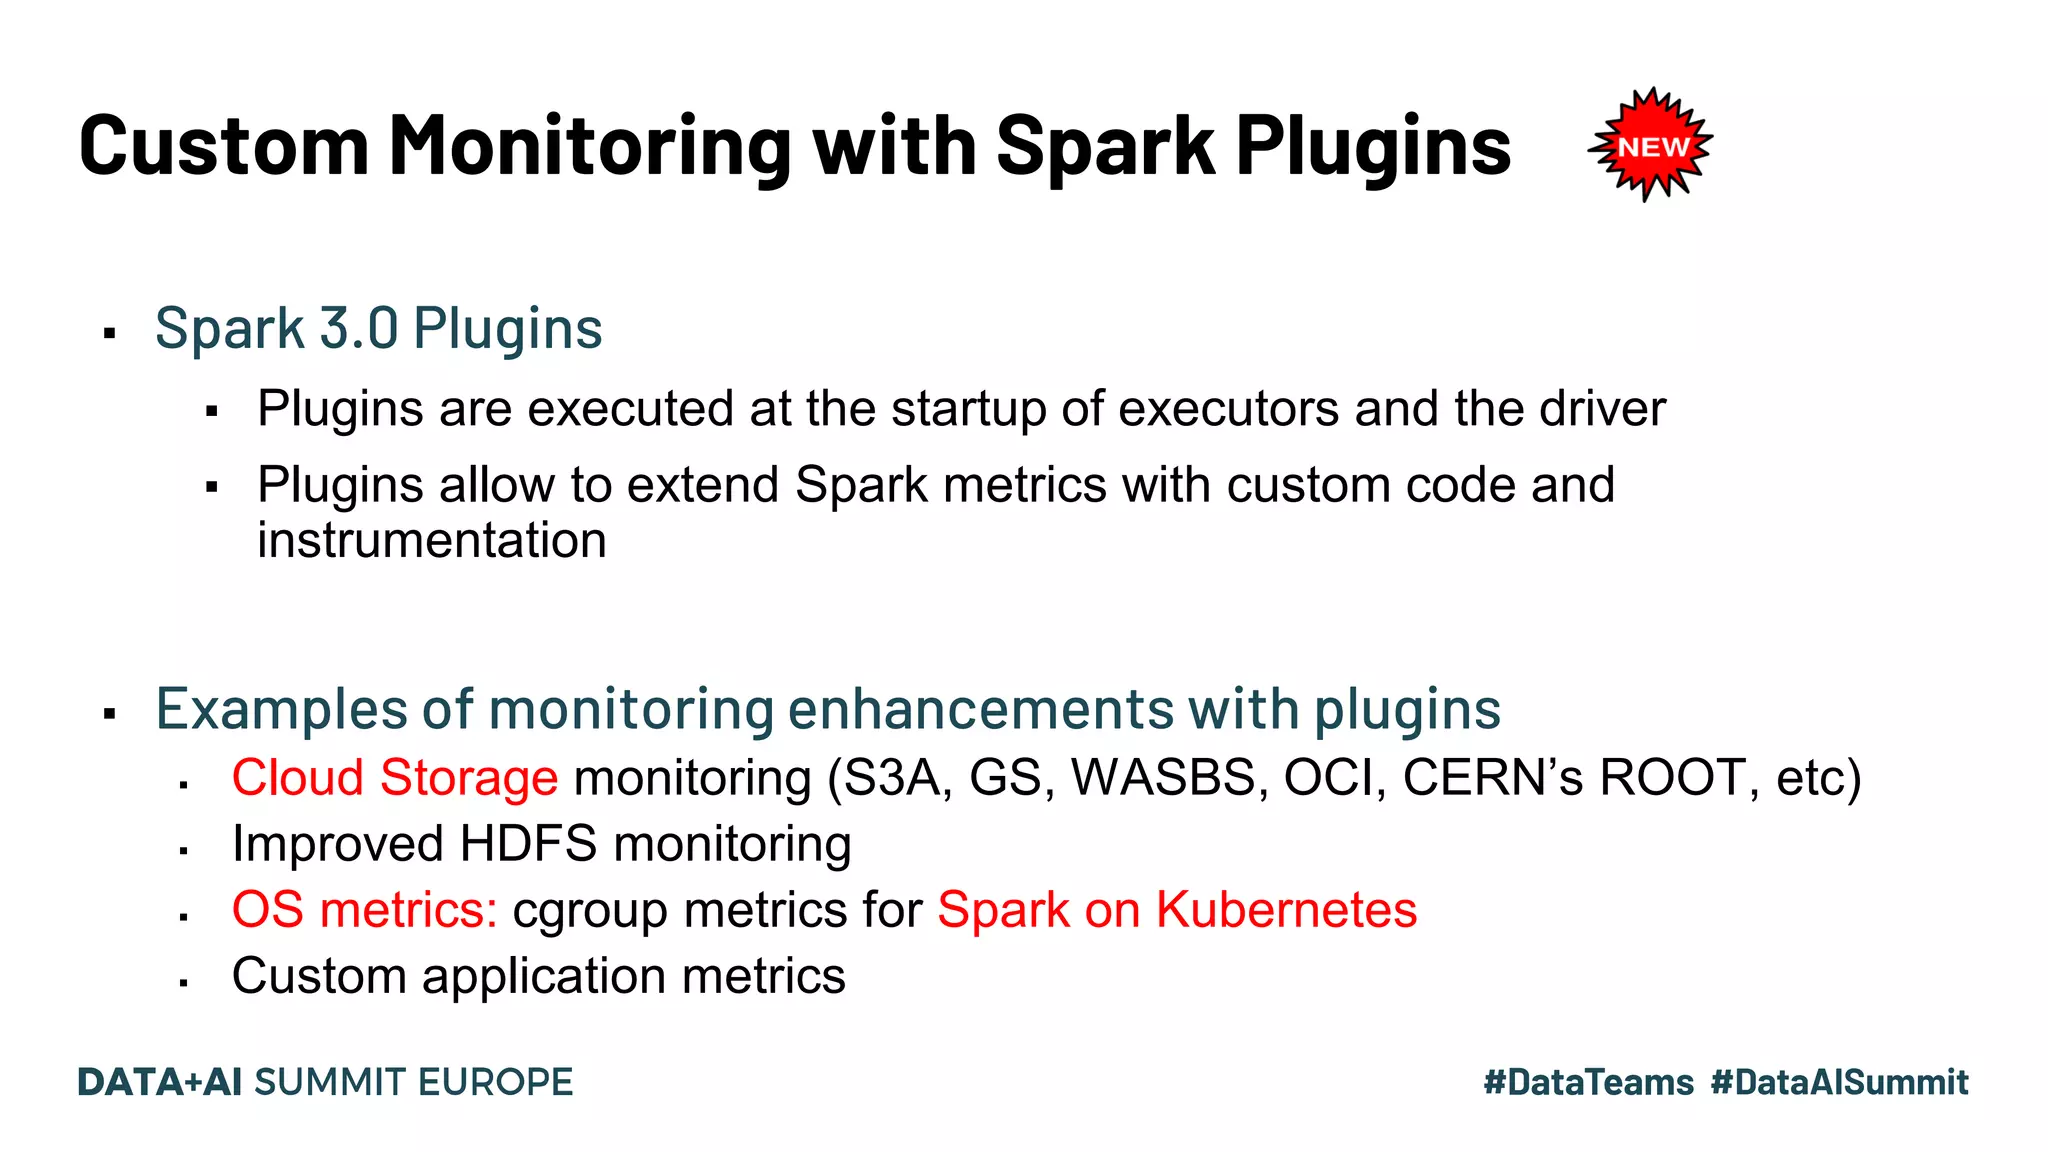
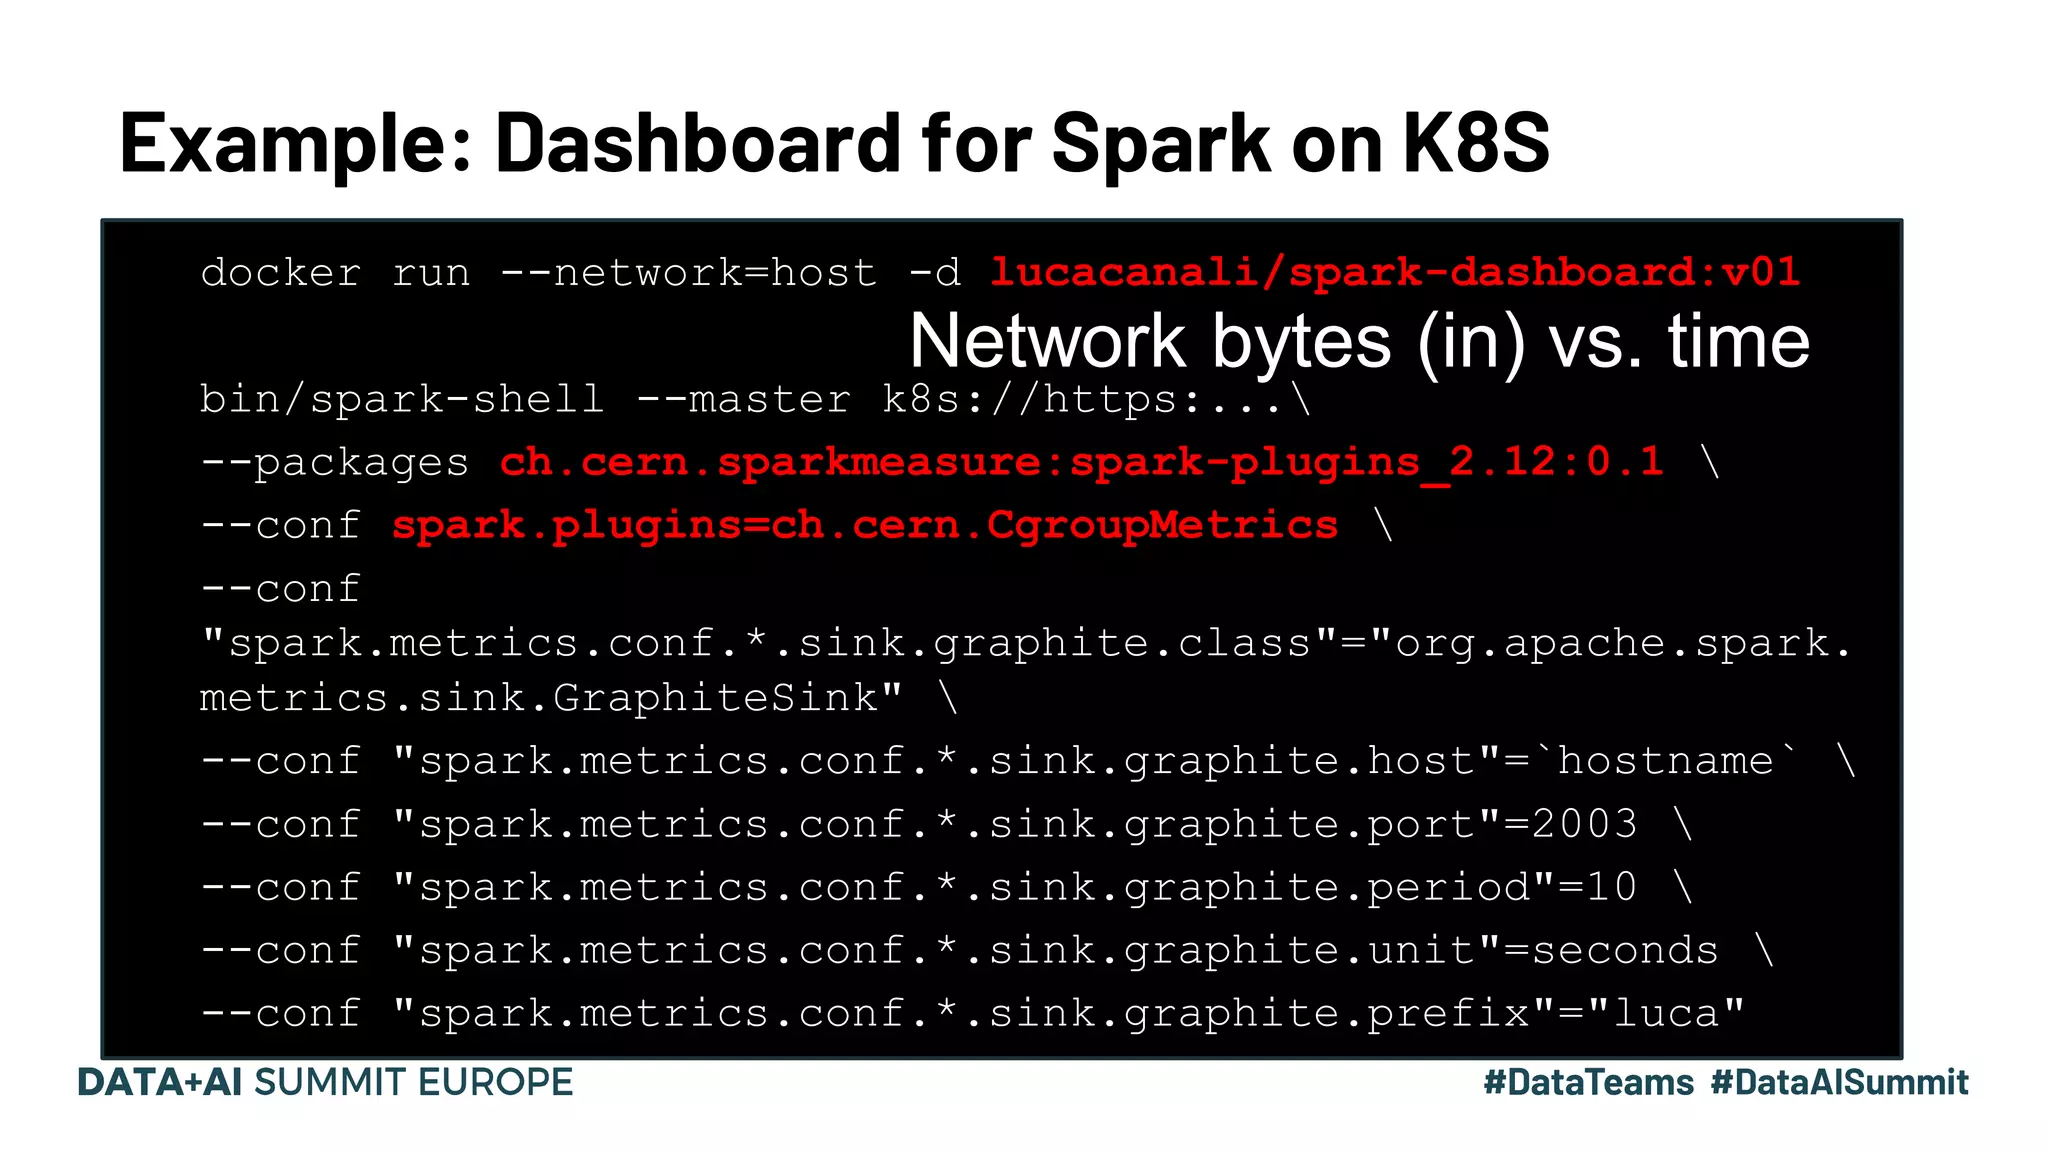
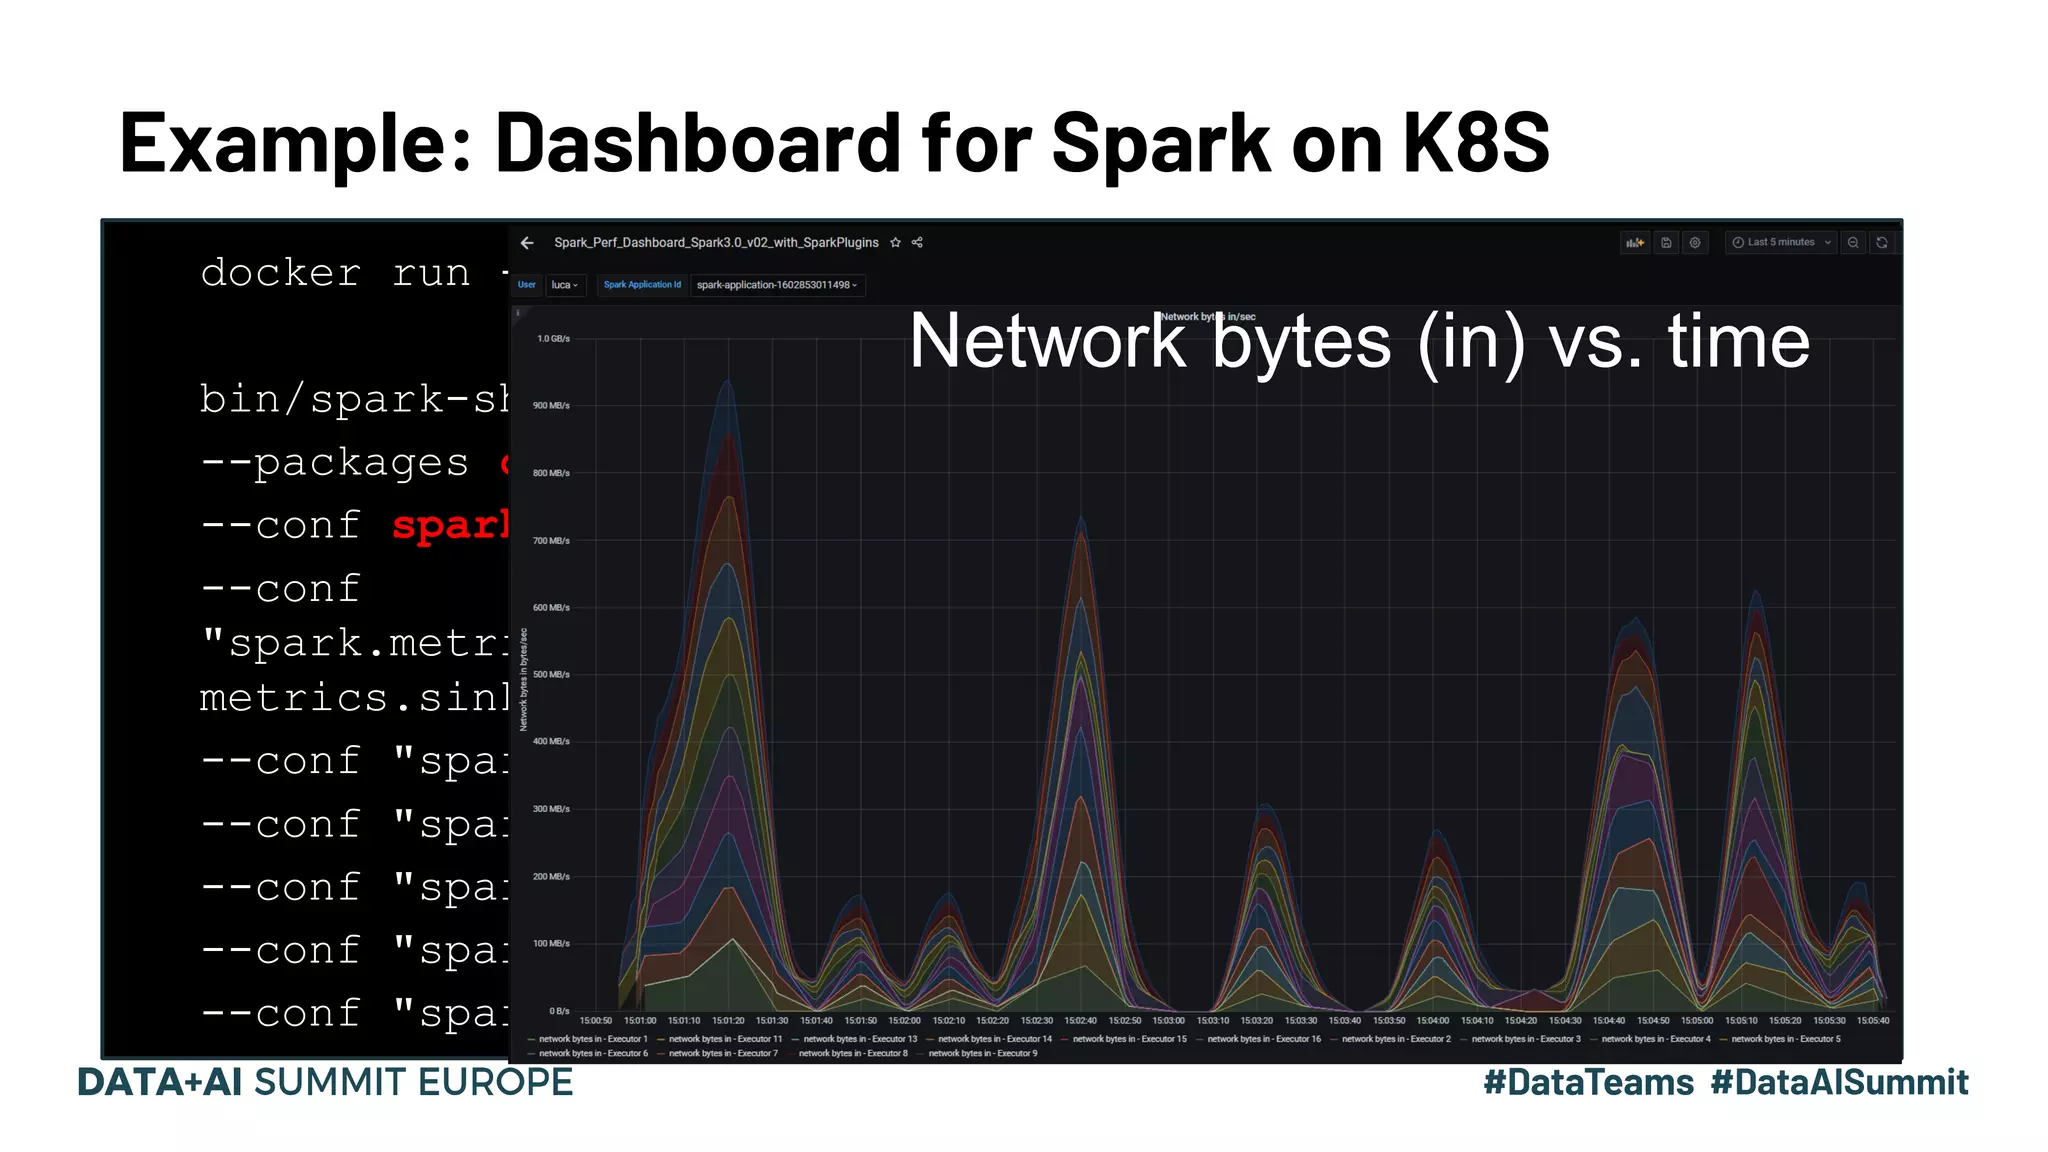
Dashboard features to visualize memory metrics over time and using plugins for custom monitoring.
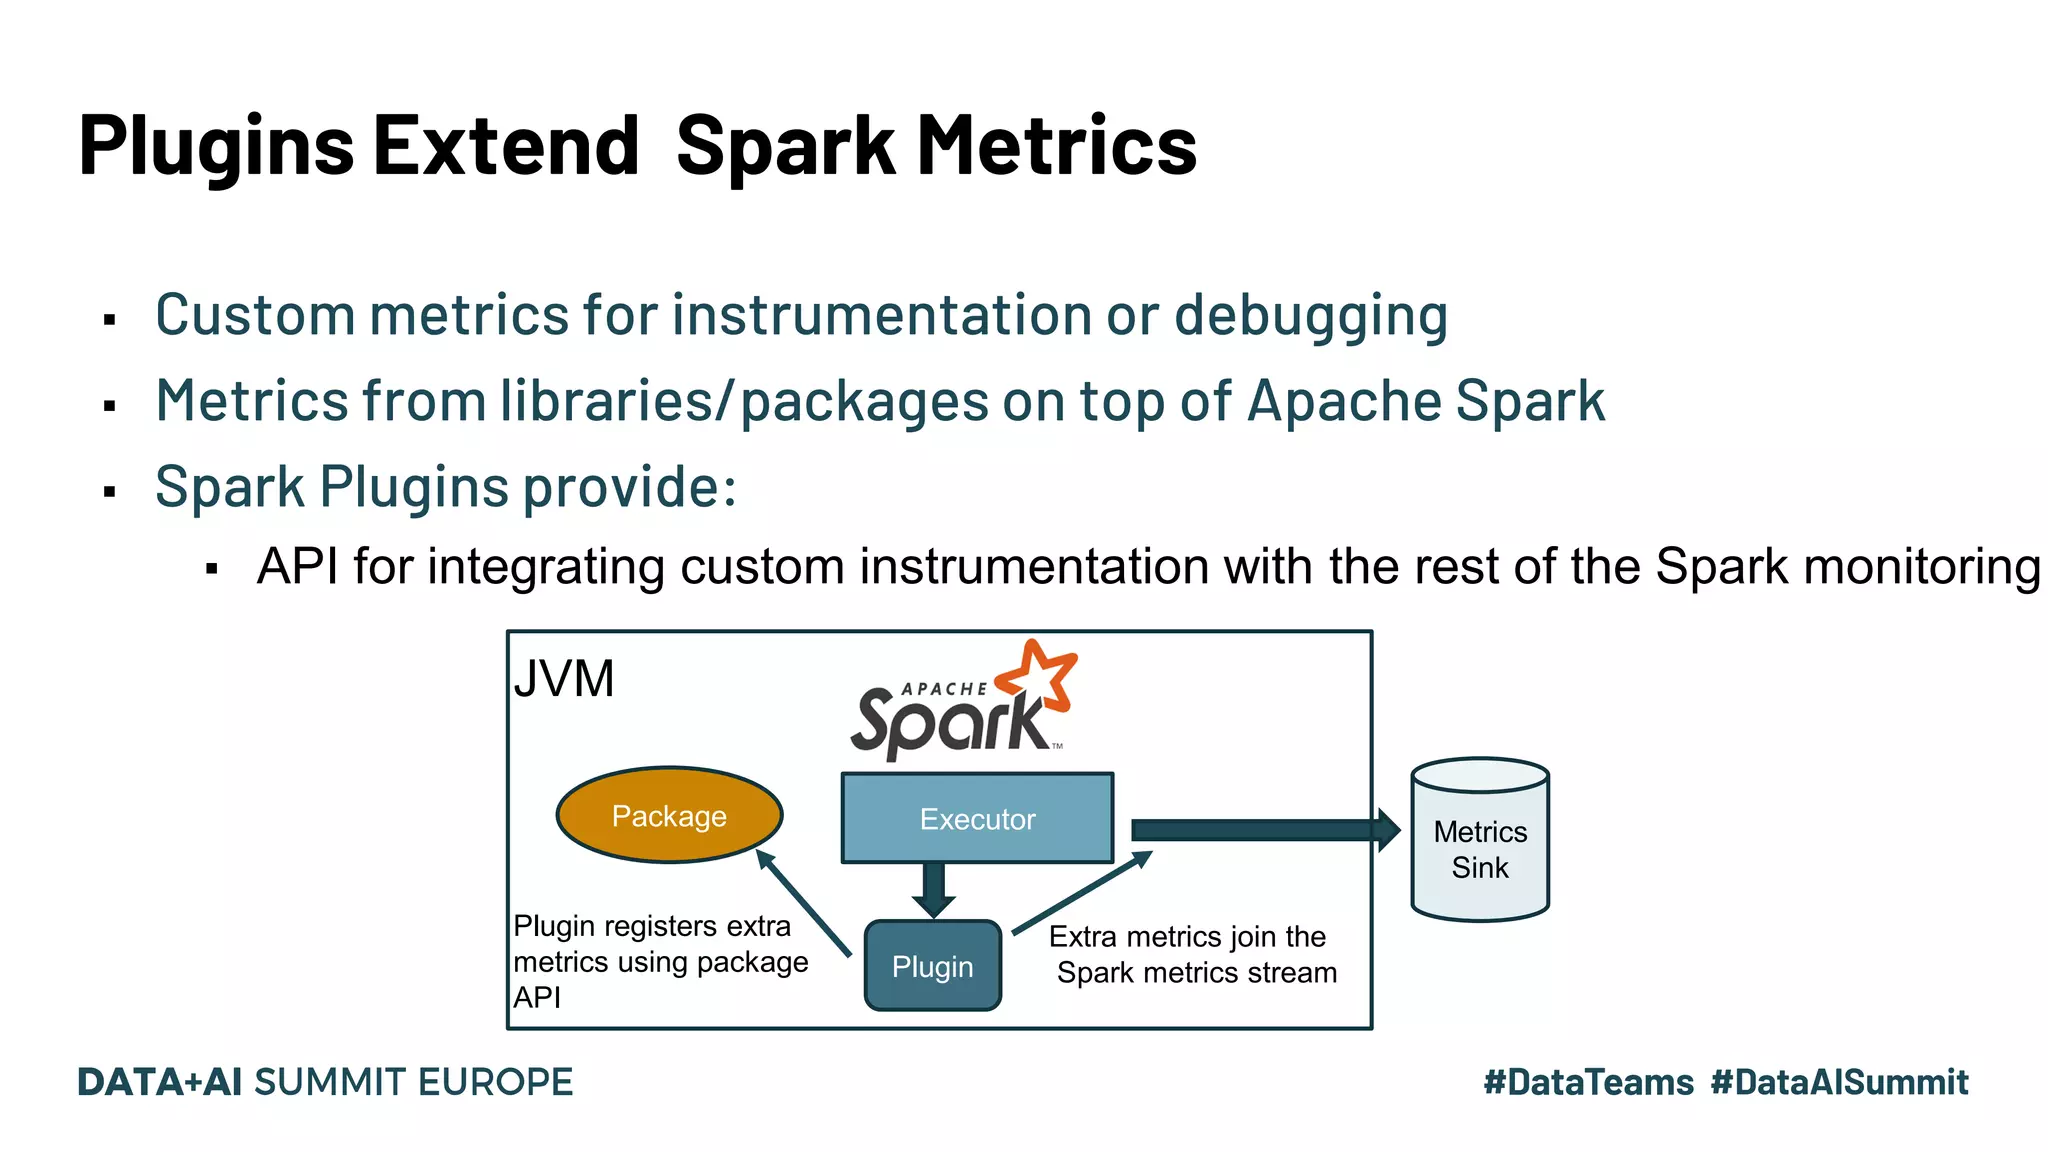
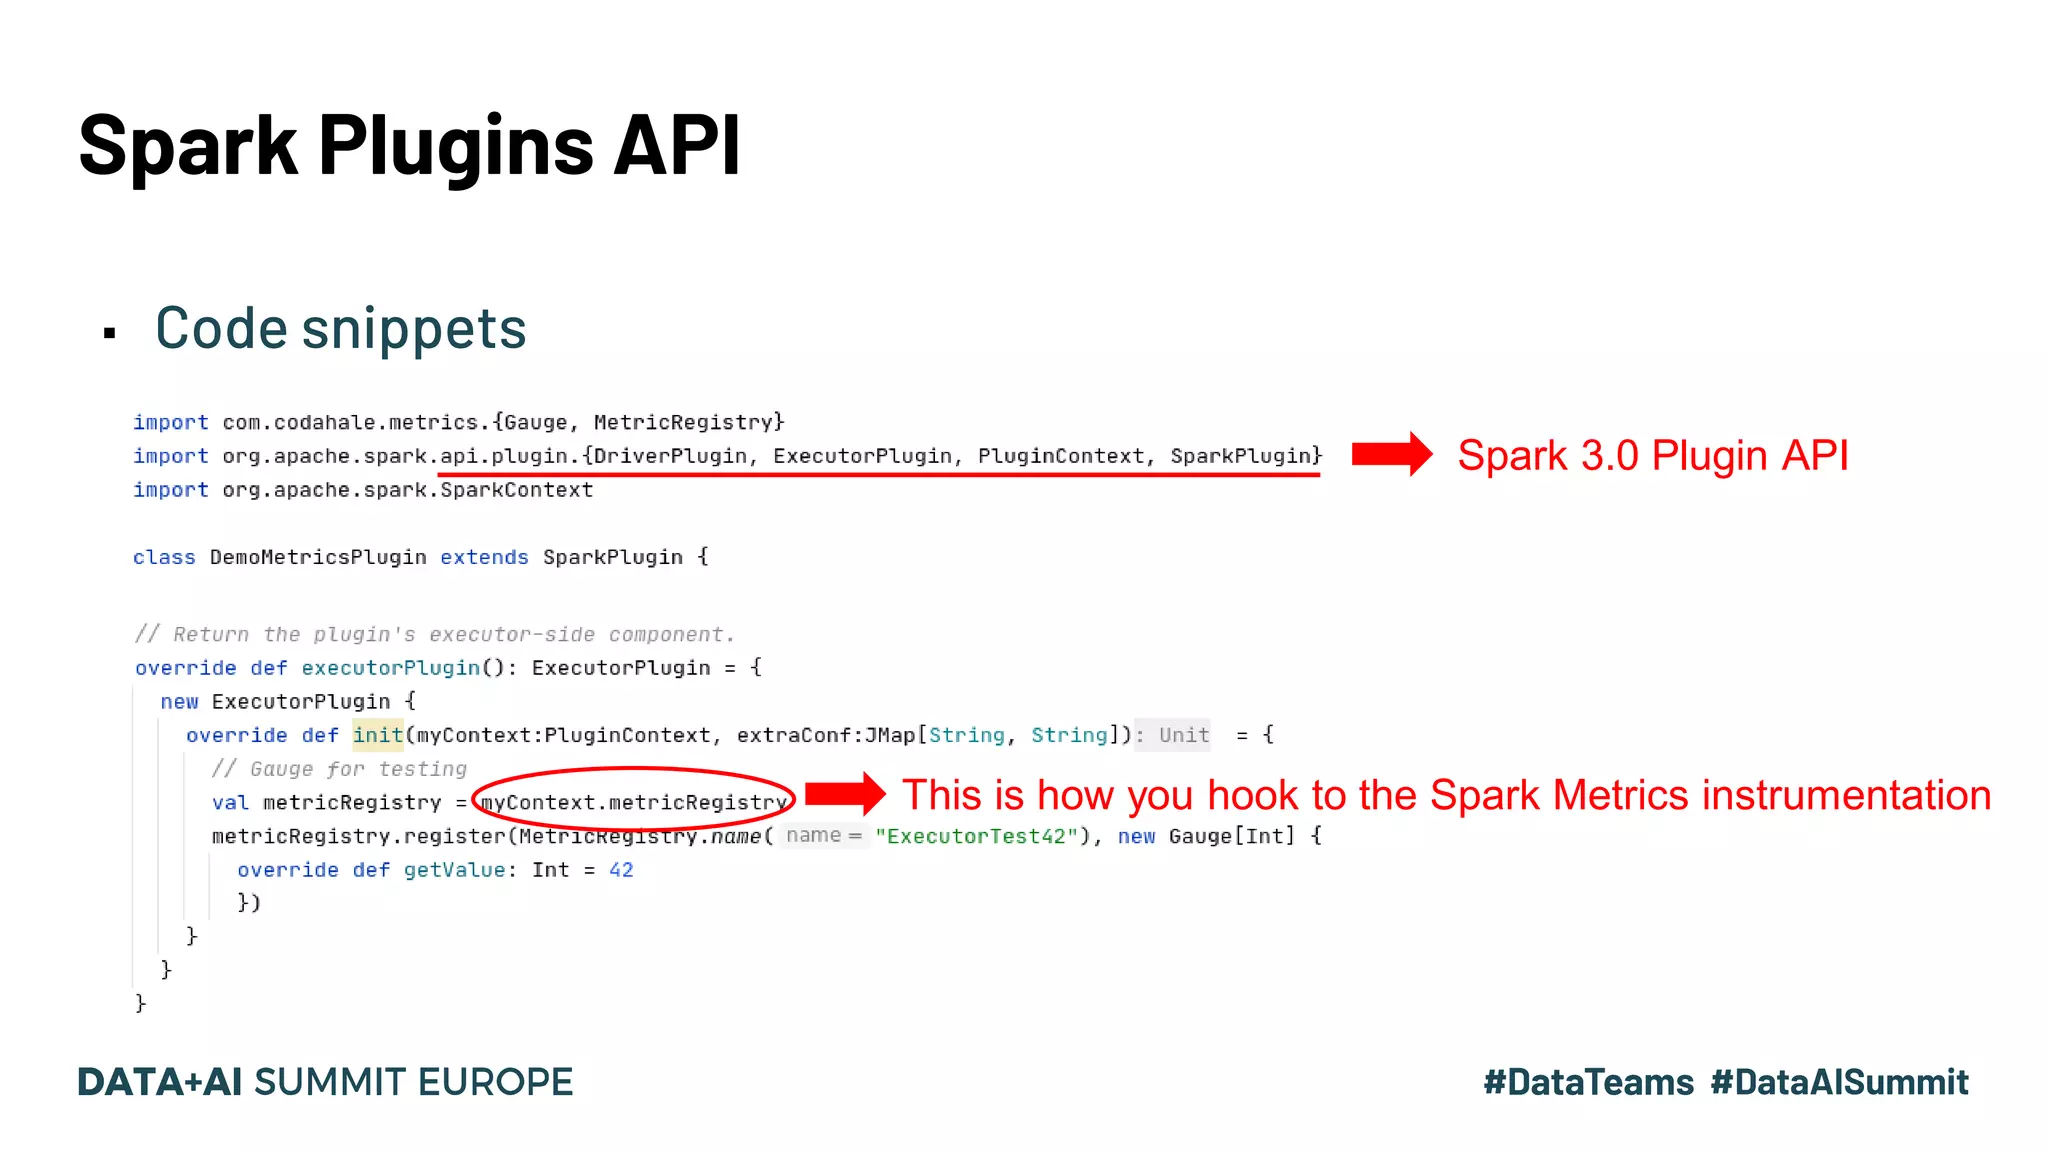
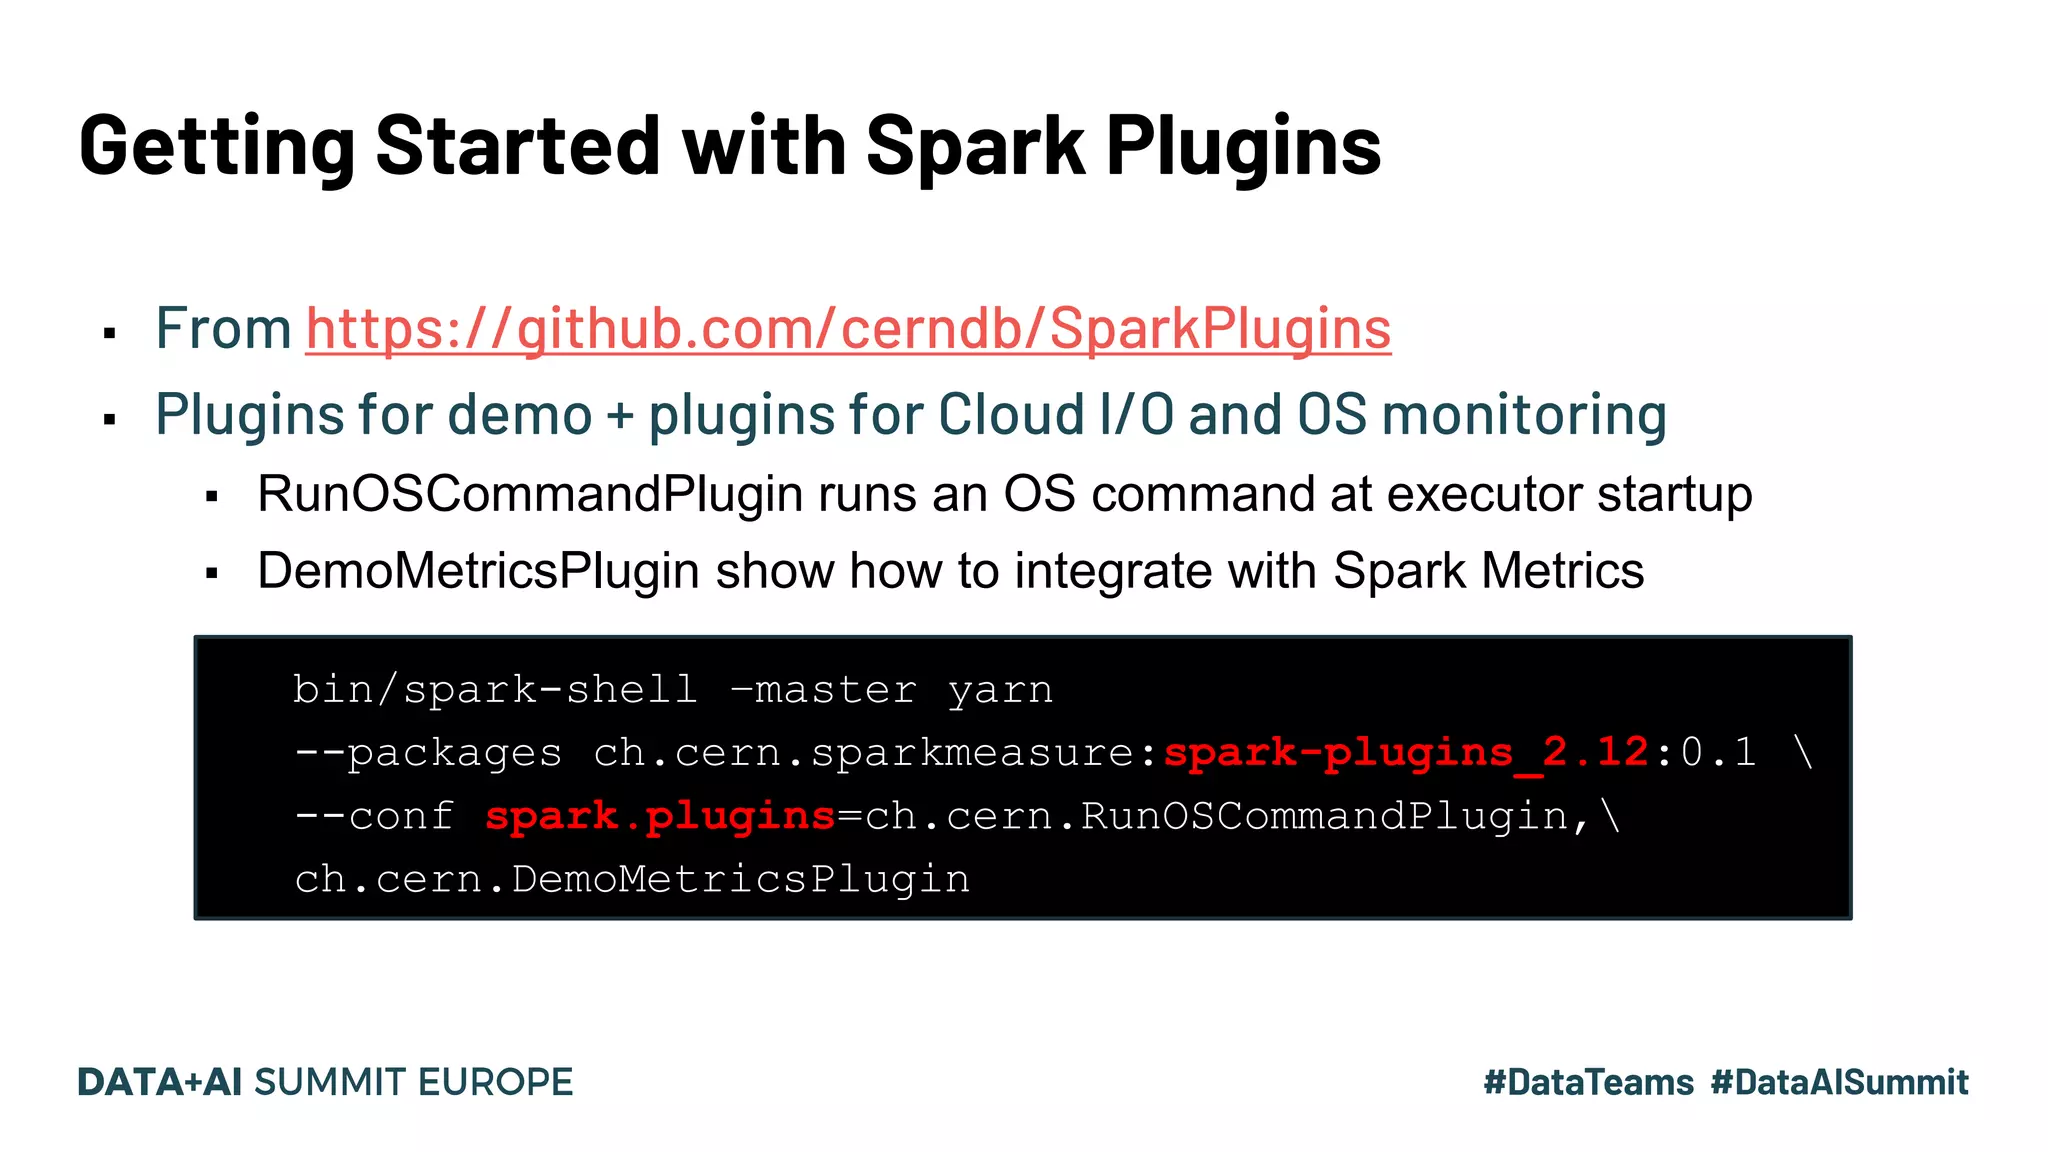
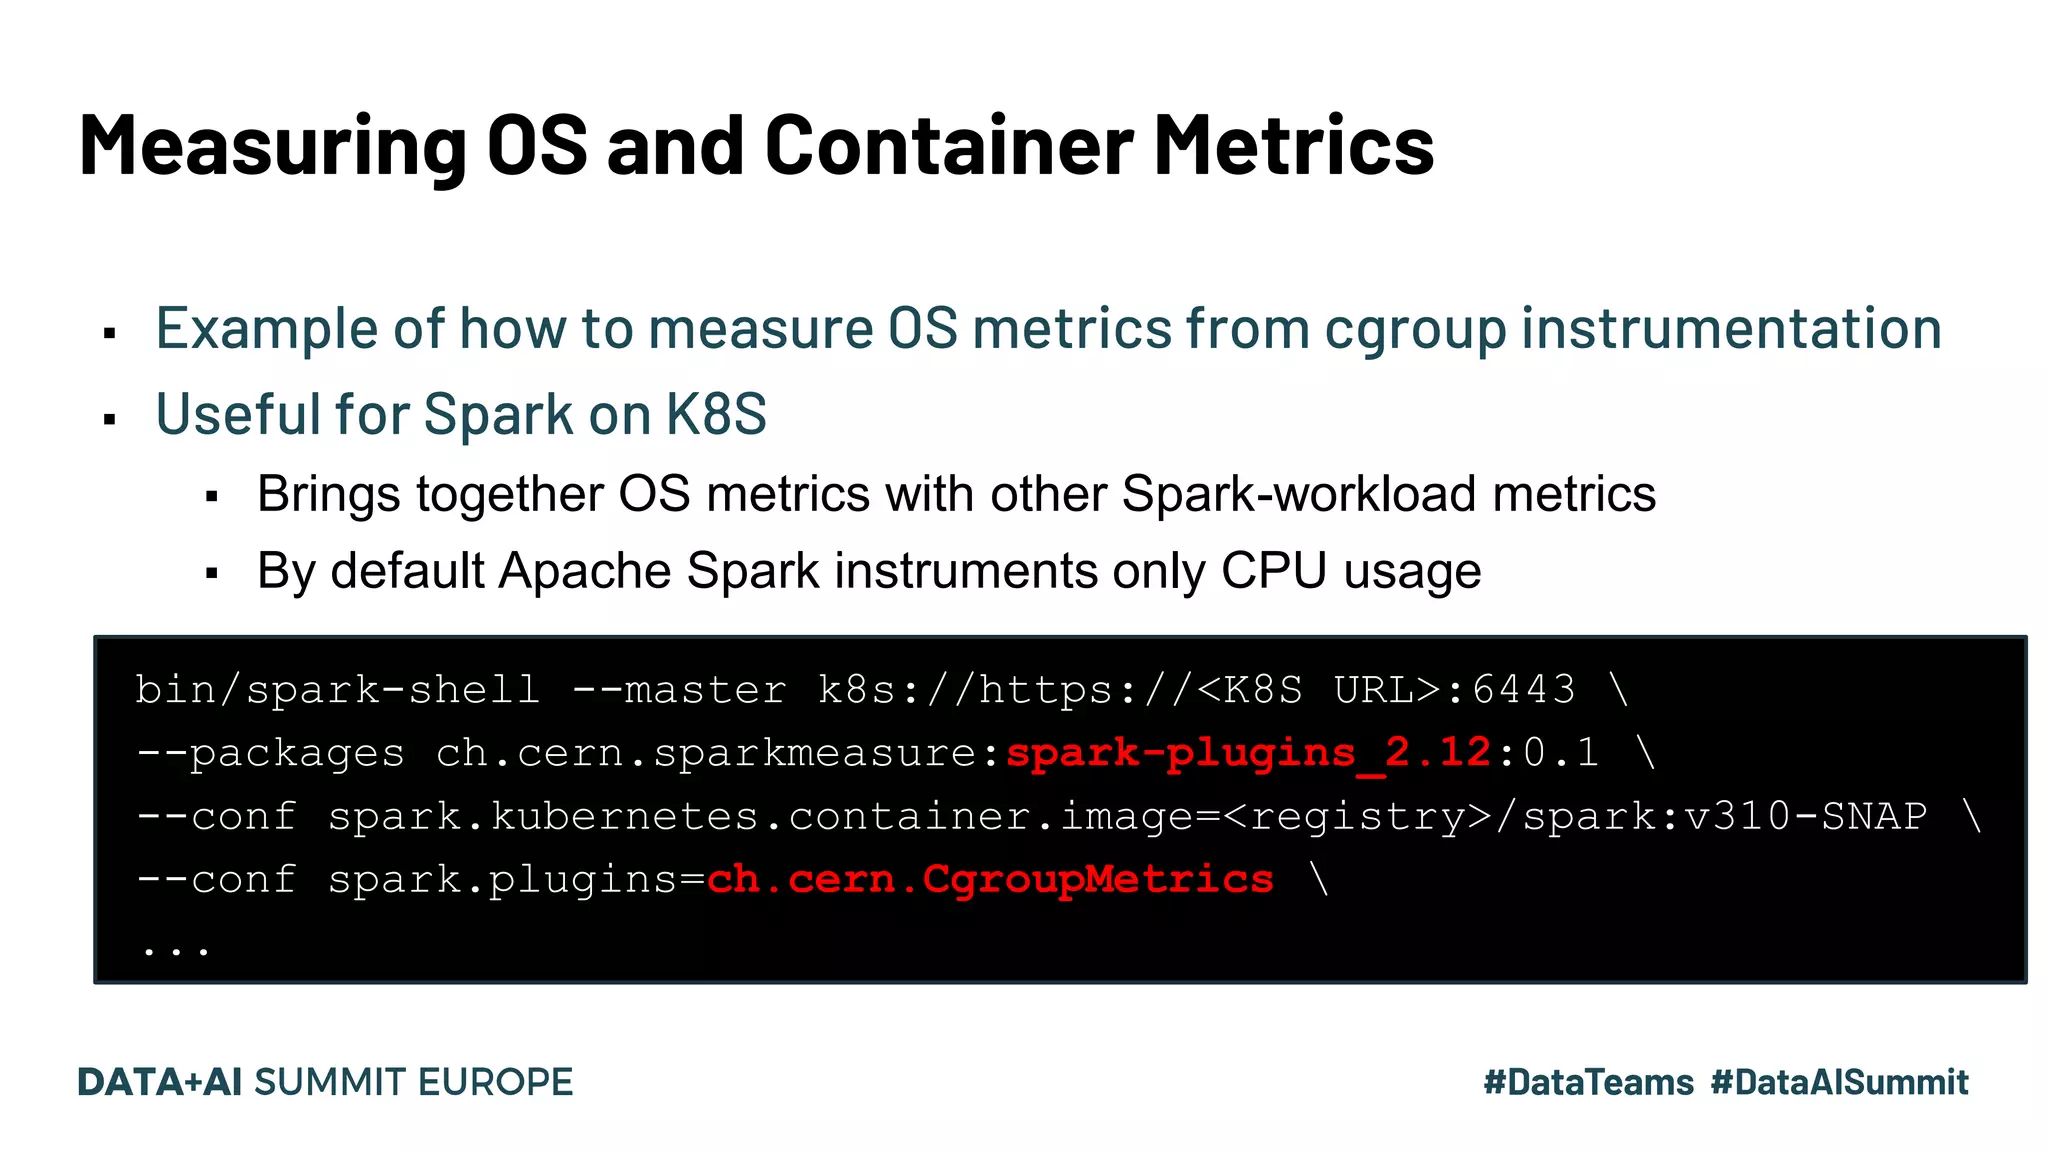
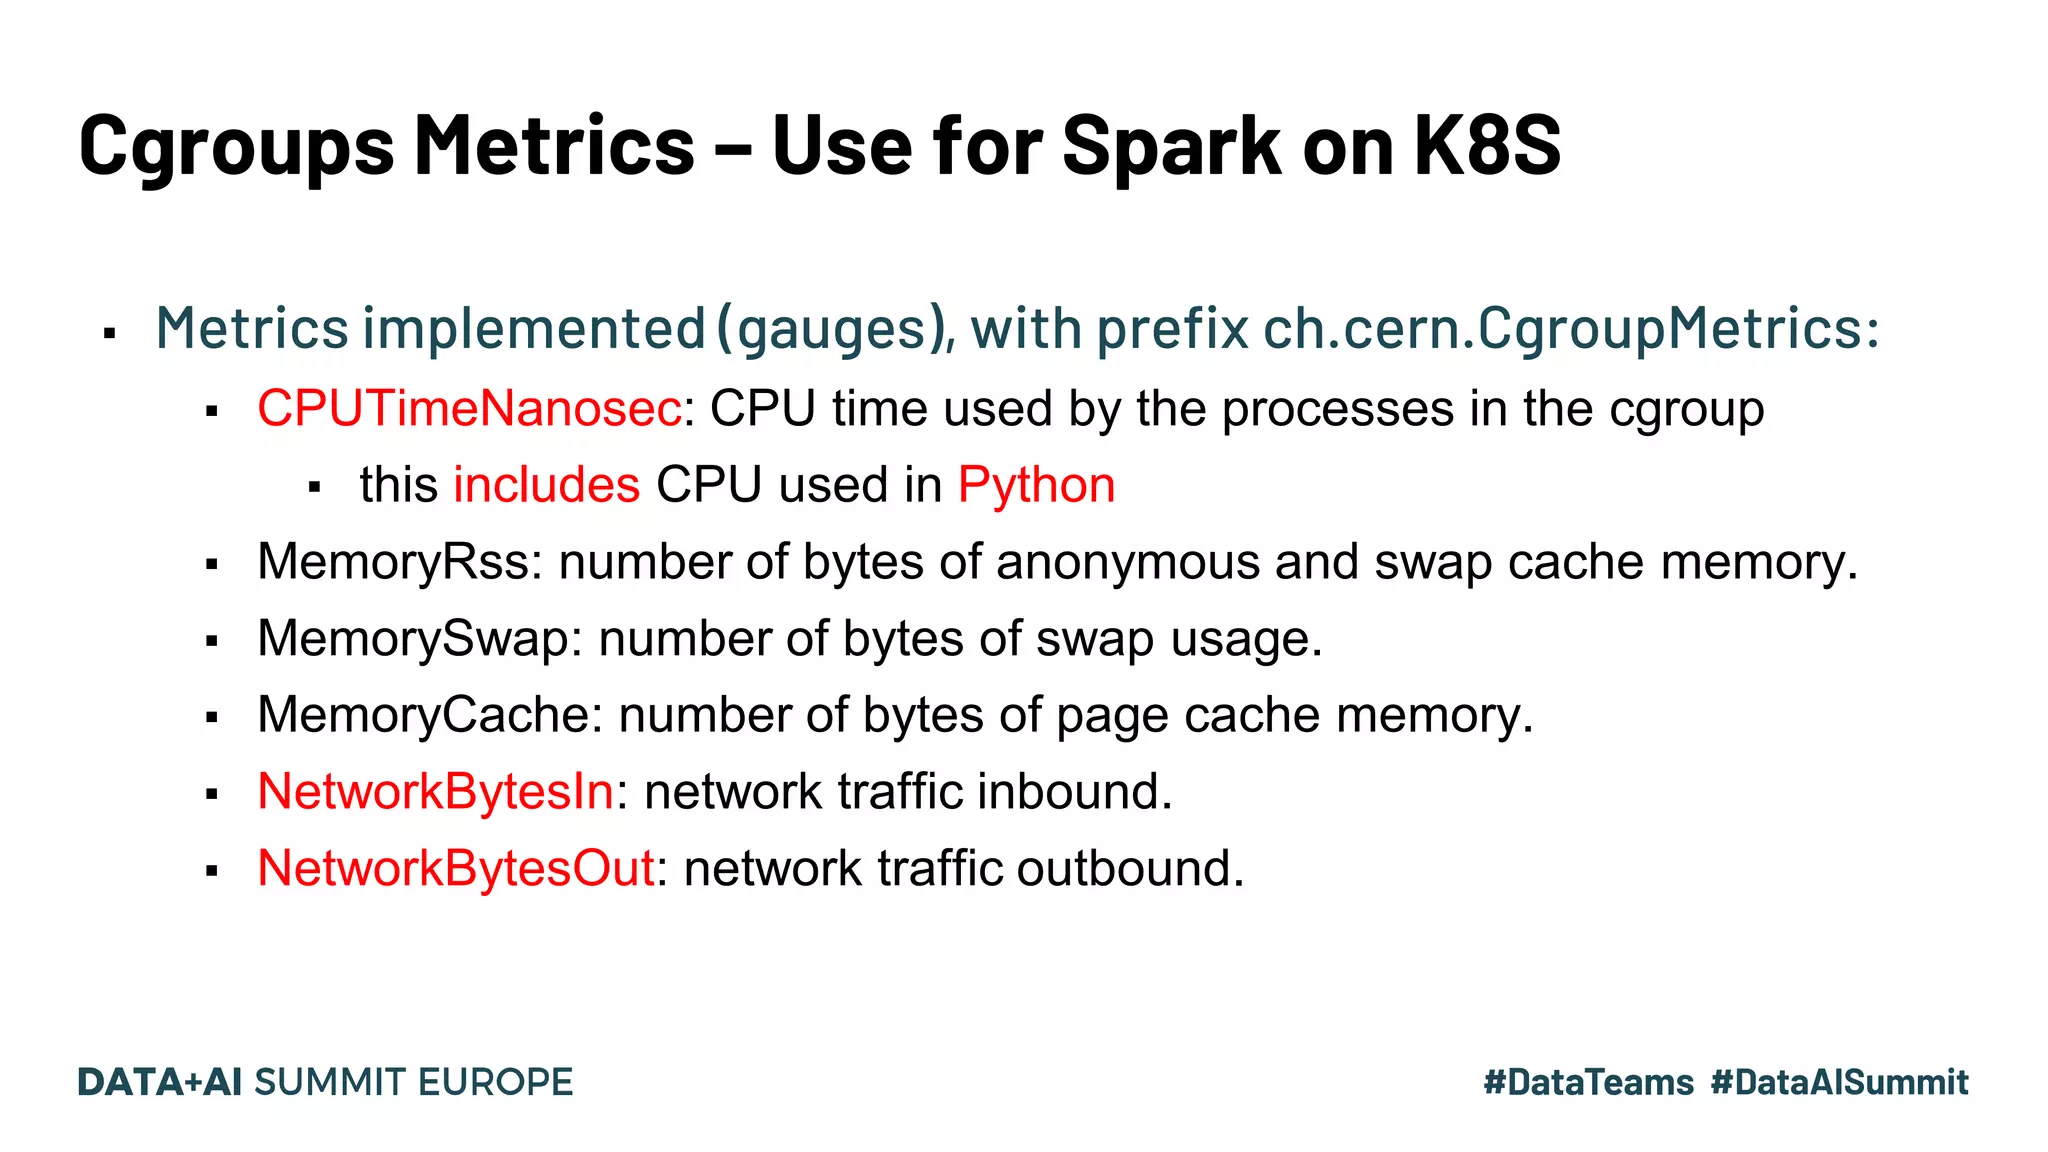
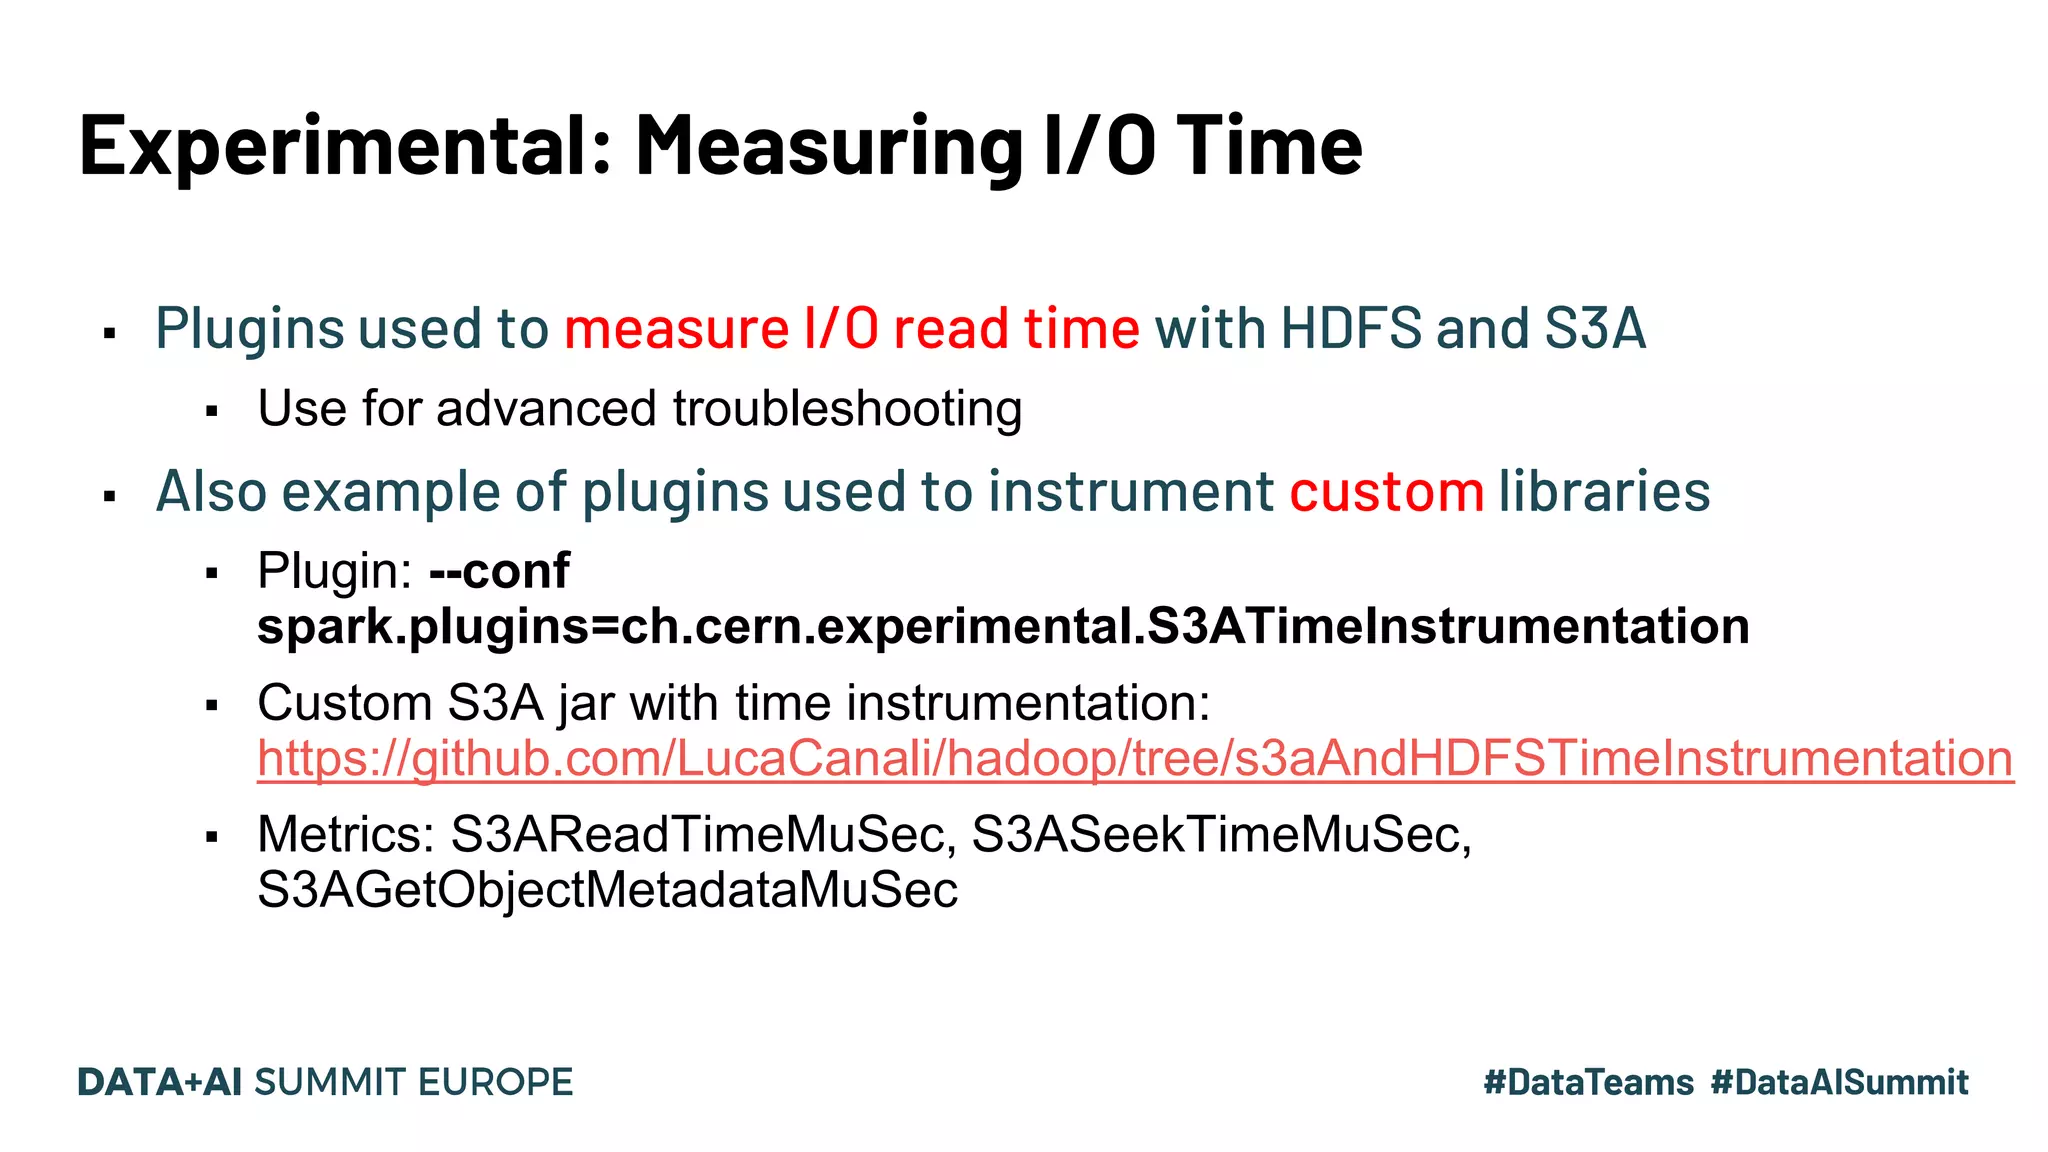
Discussion of Spark plugin APIs, capabilities for measuring OS and container metrics, along with examples.
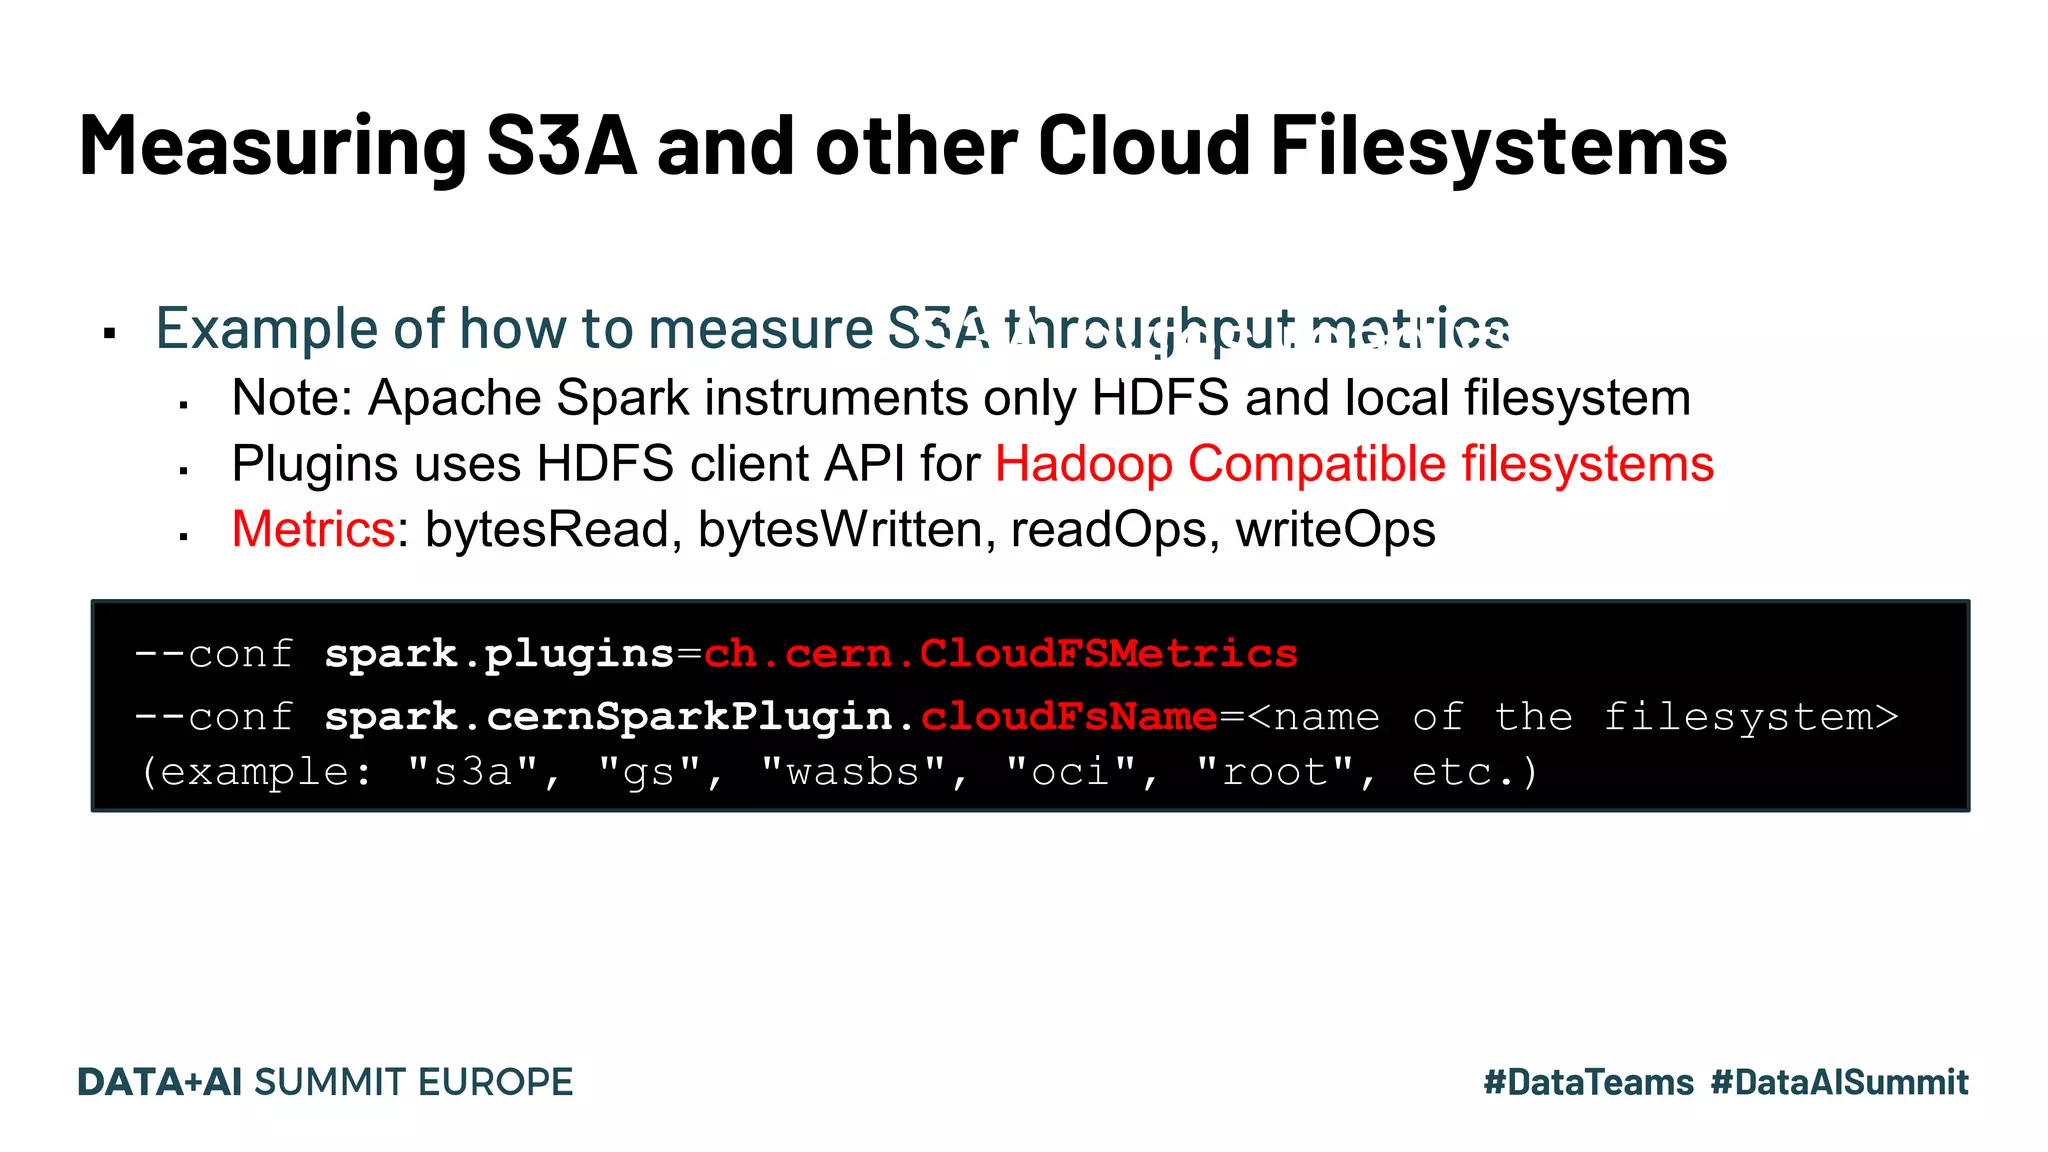
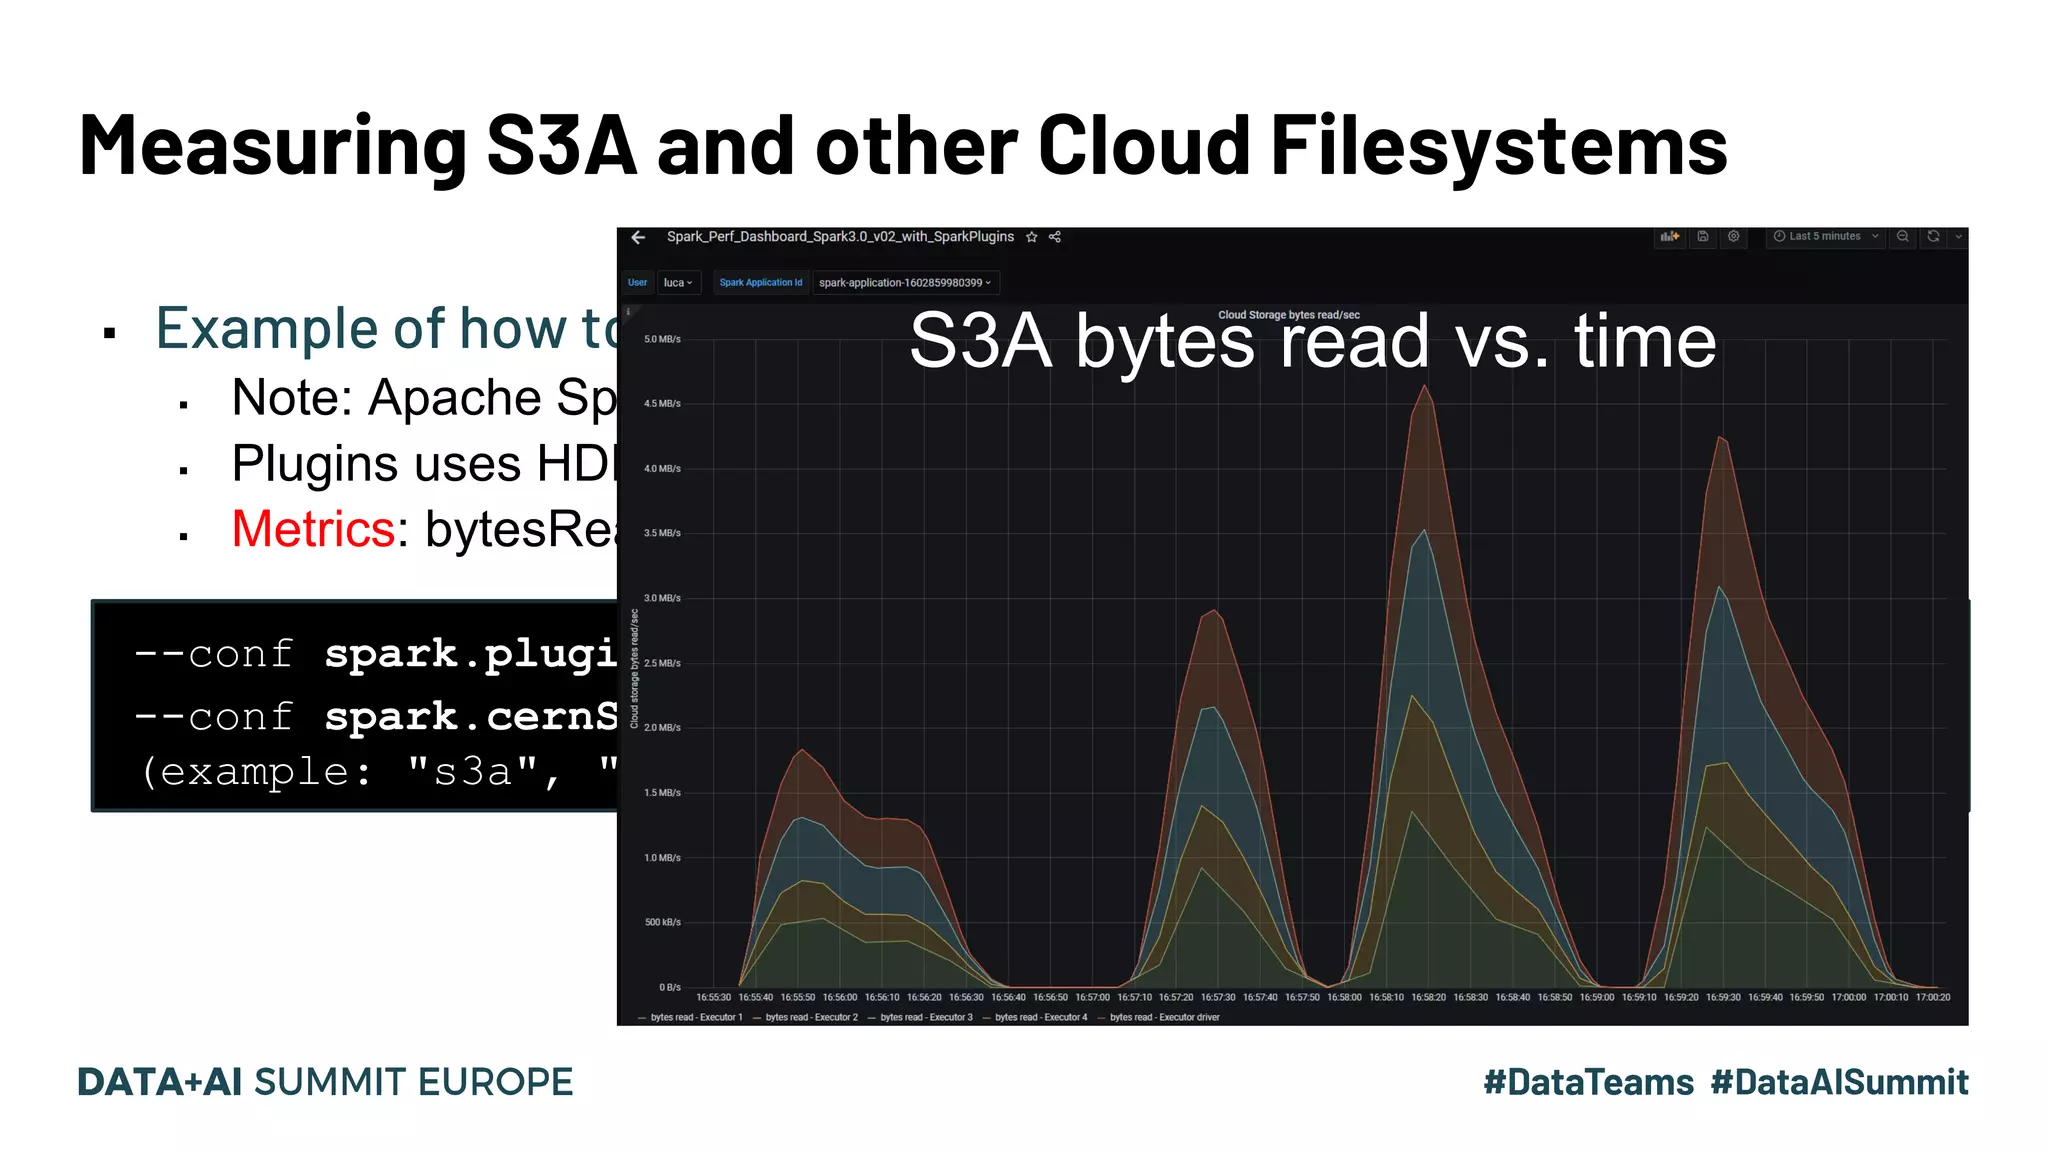
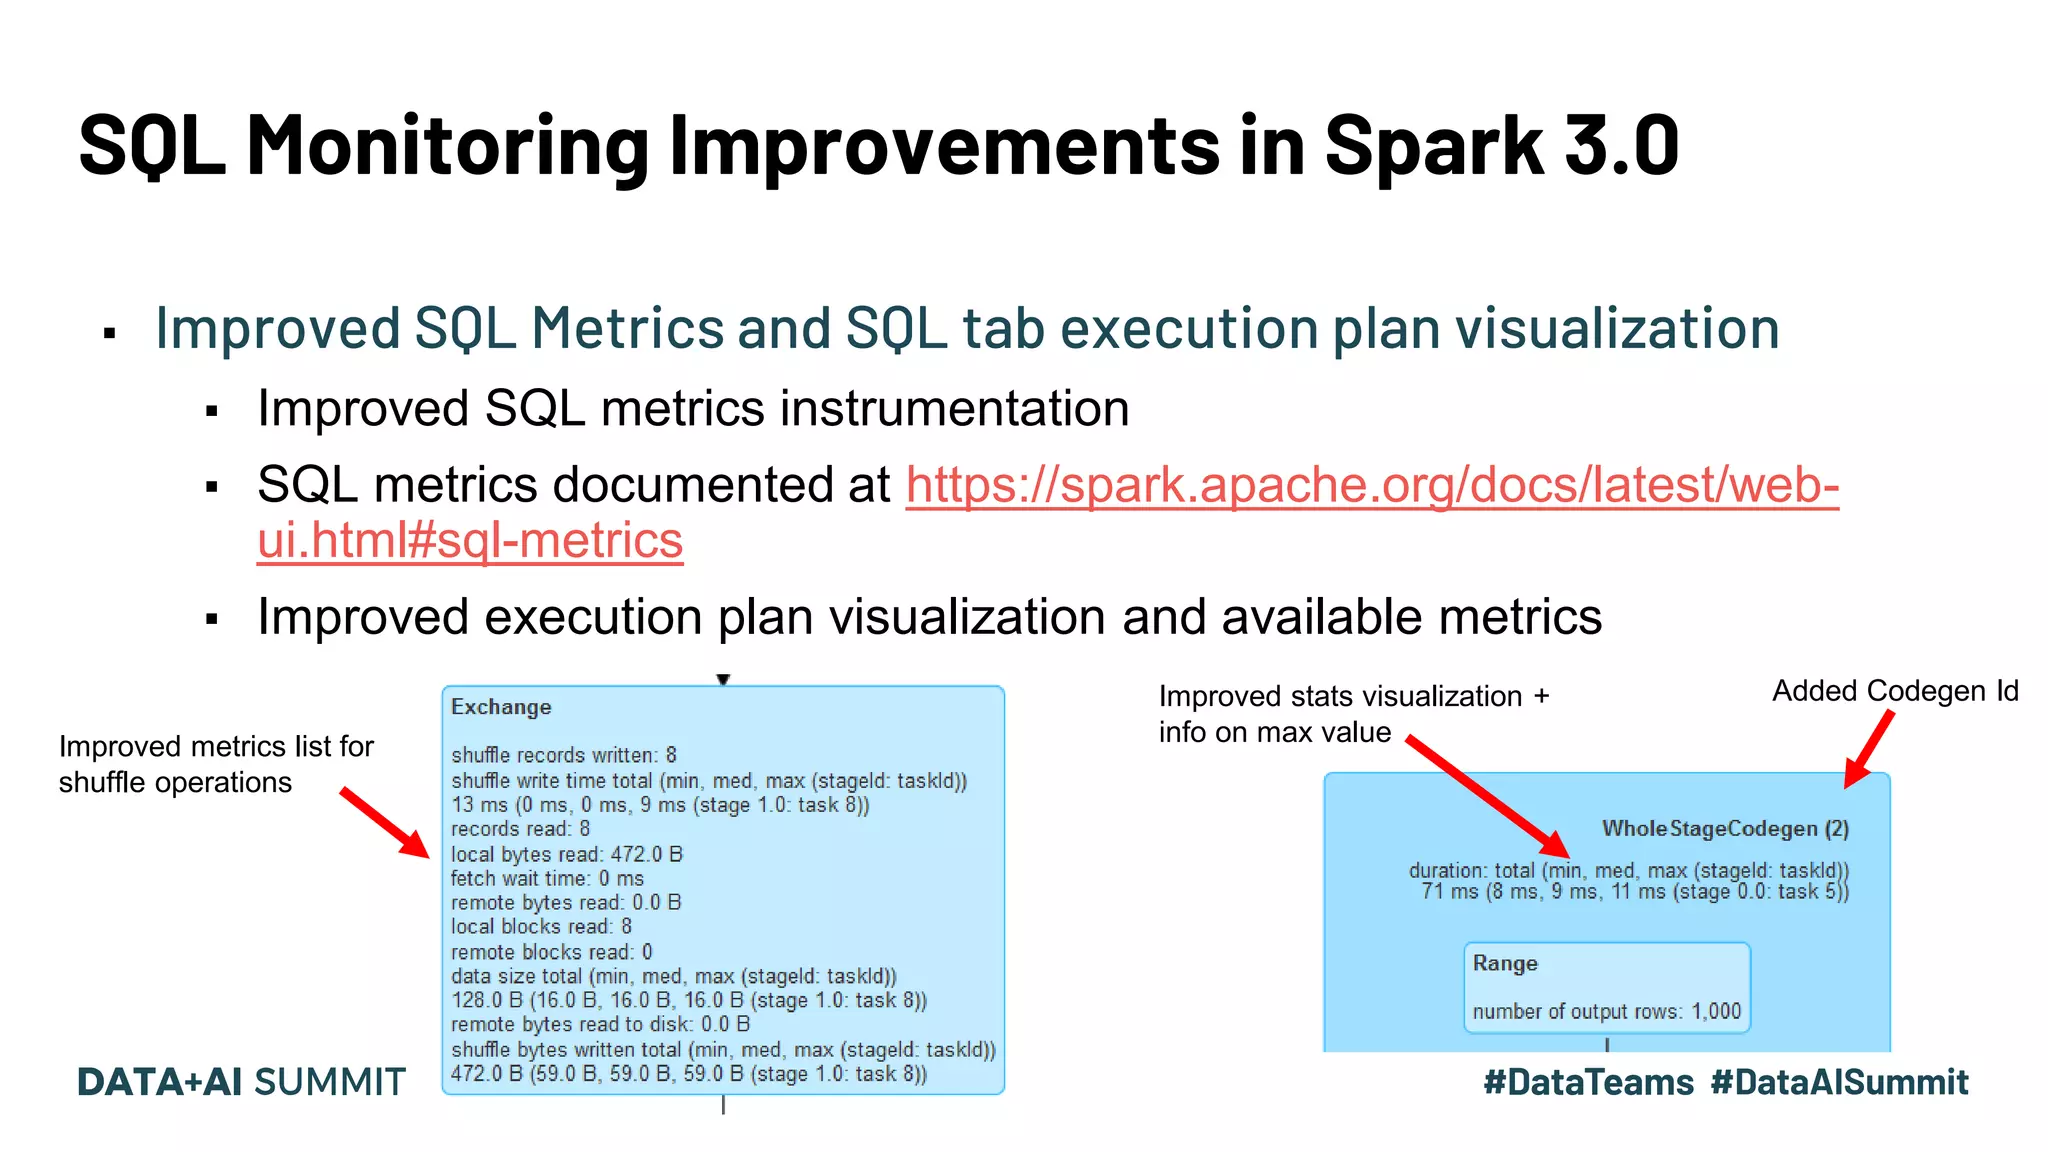
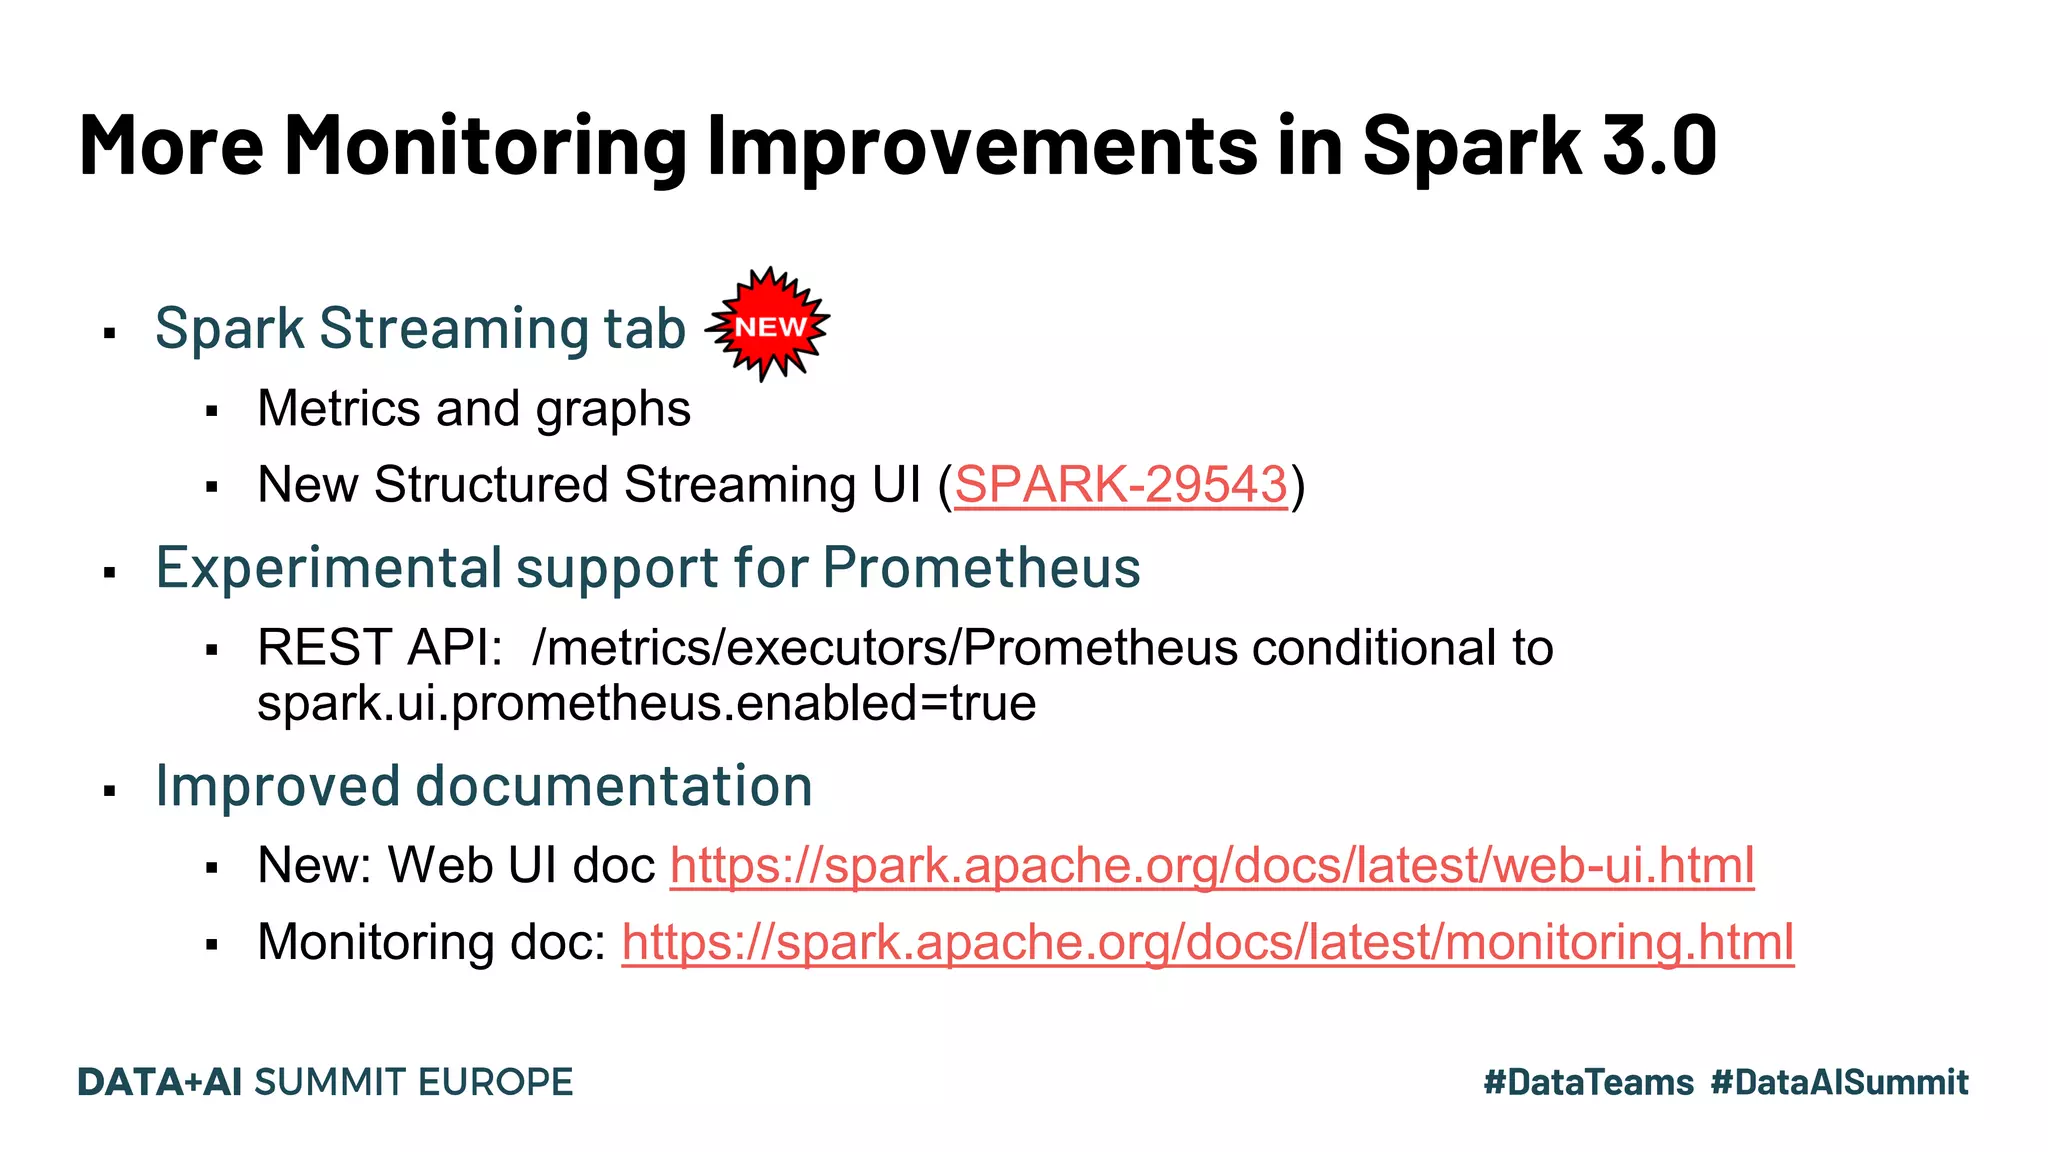
Metrics monitoring across cloud filesystems like S3A, and improvements in SQL and streaming monitoring.
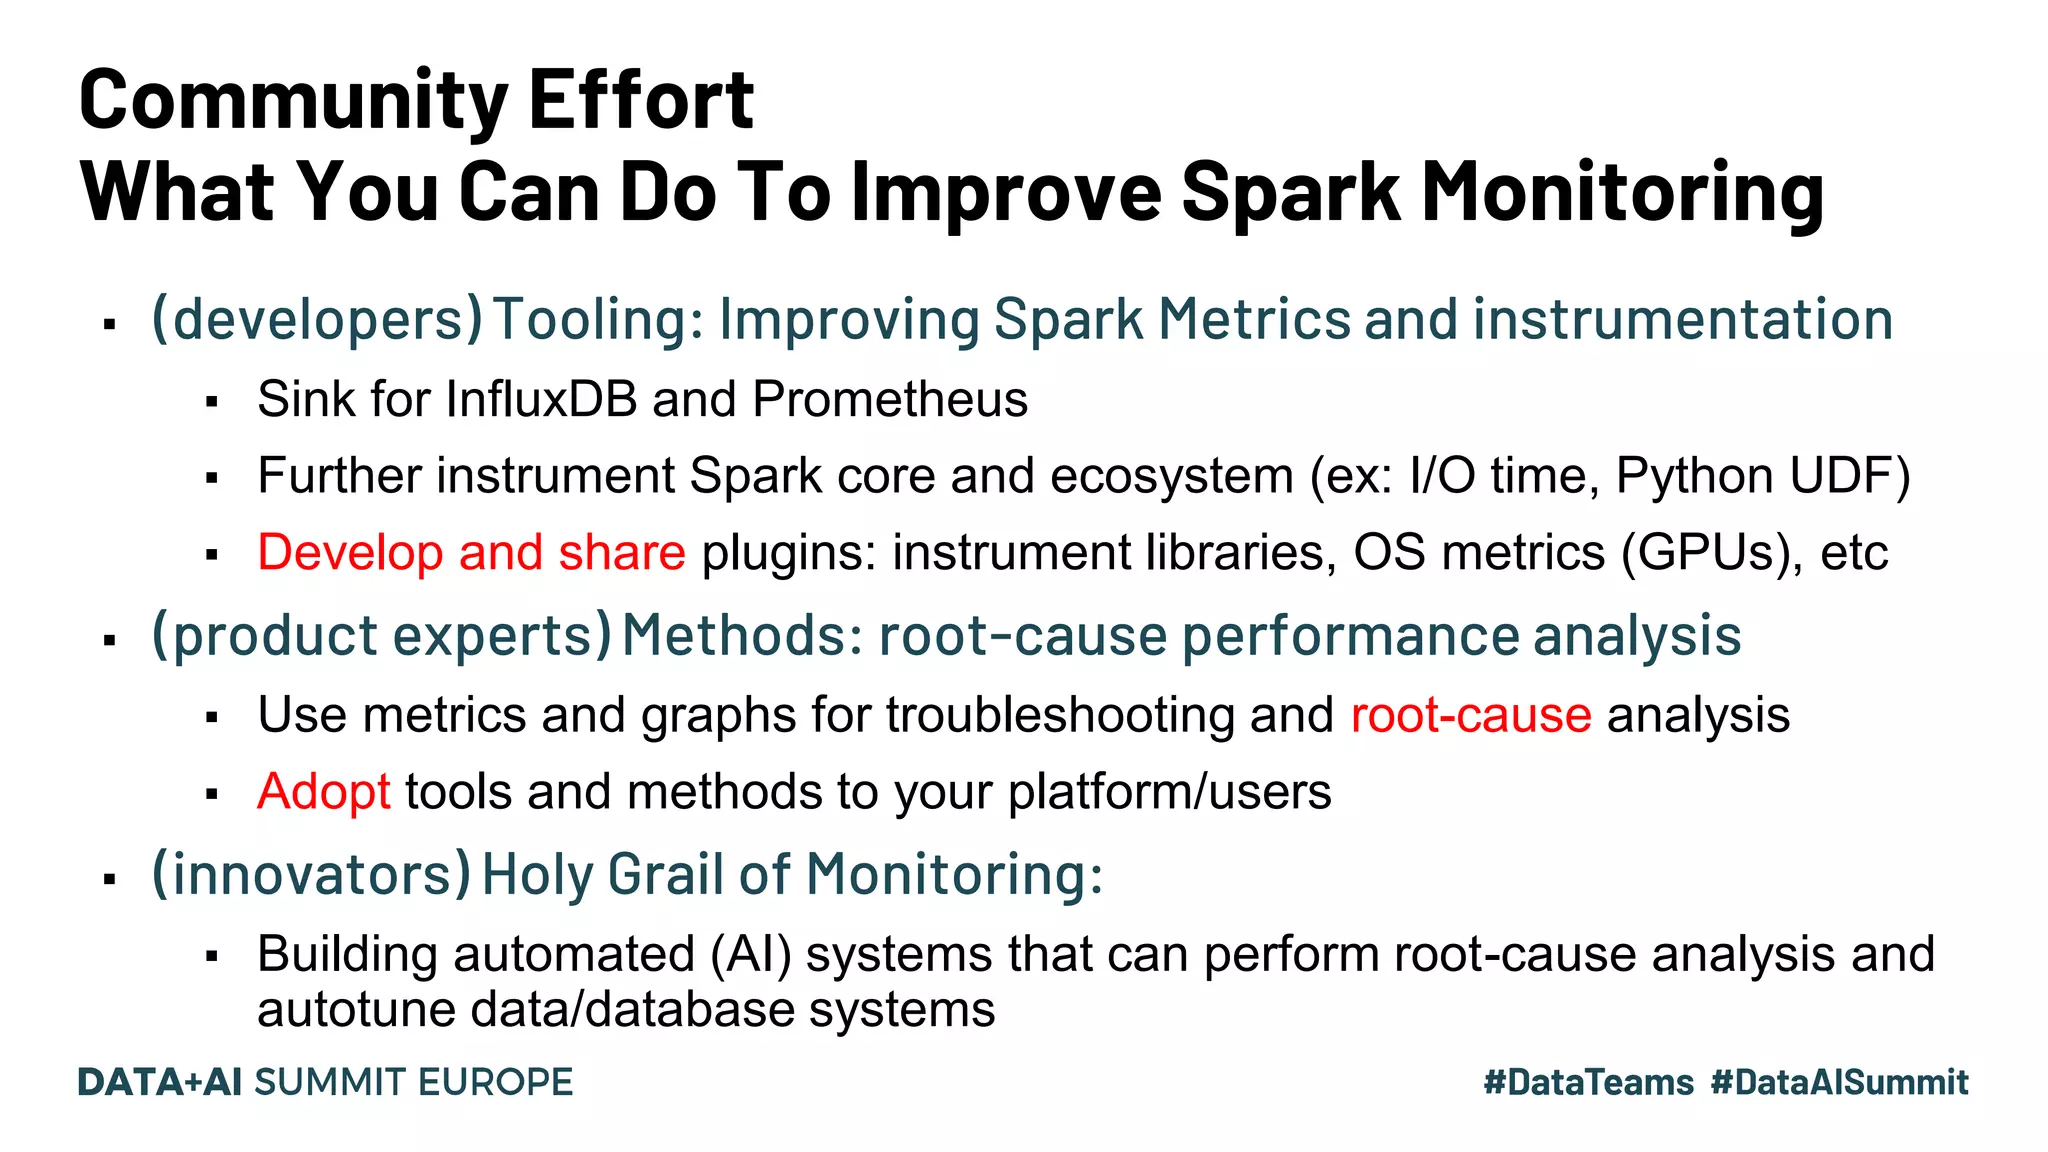
Community improvements in Spark monitoring and instrumentation; how to contribute and expected features.
Acknowledgments for contributions and a call for session feedback.