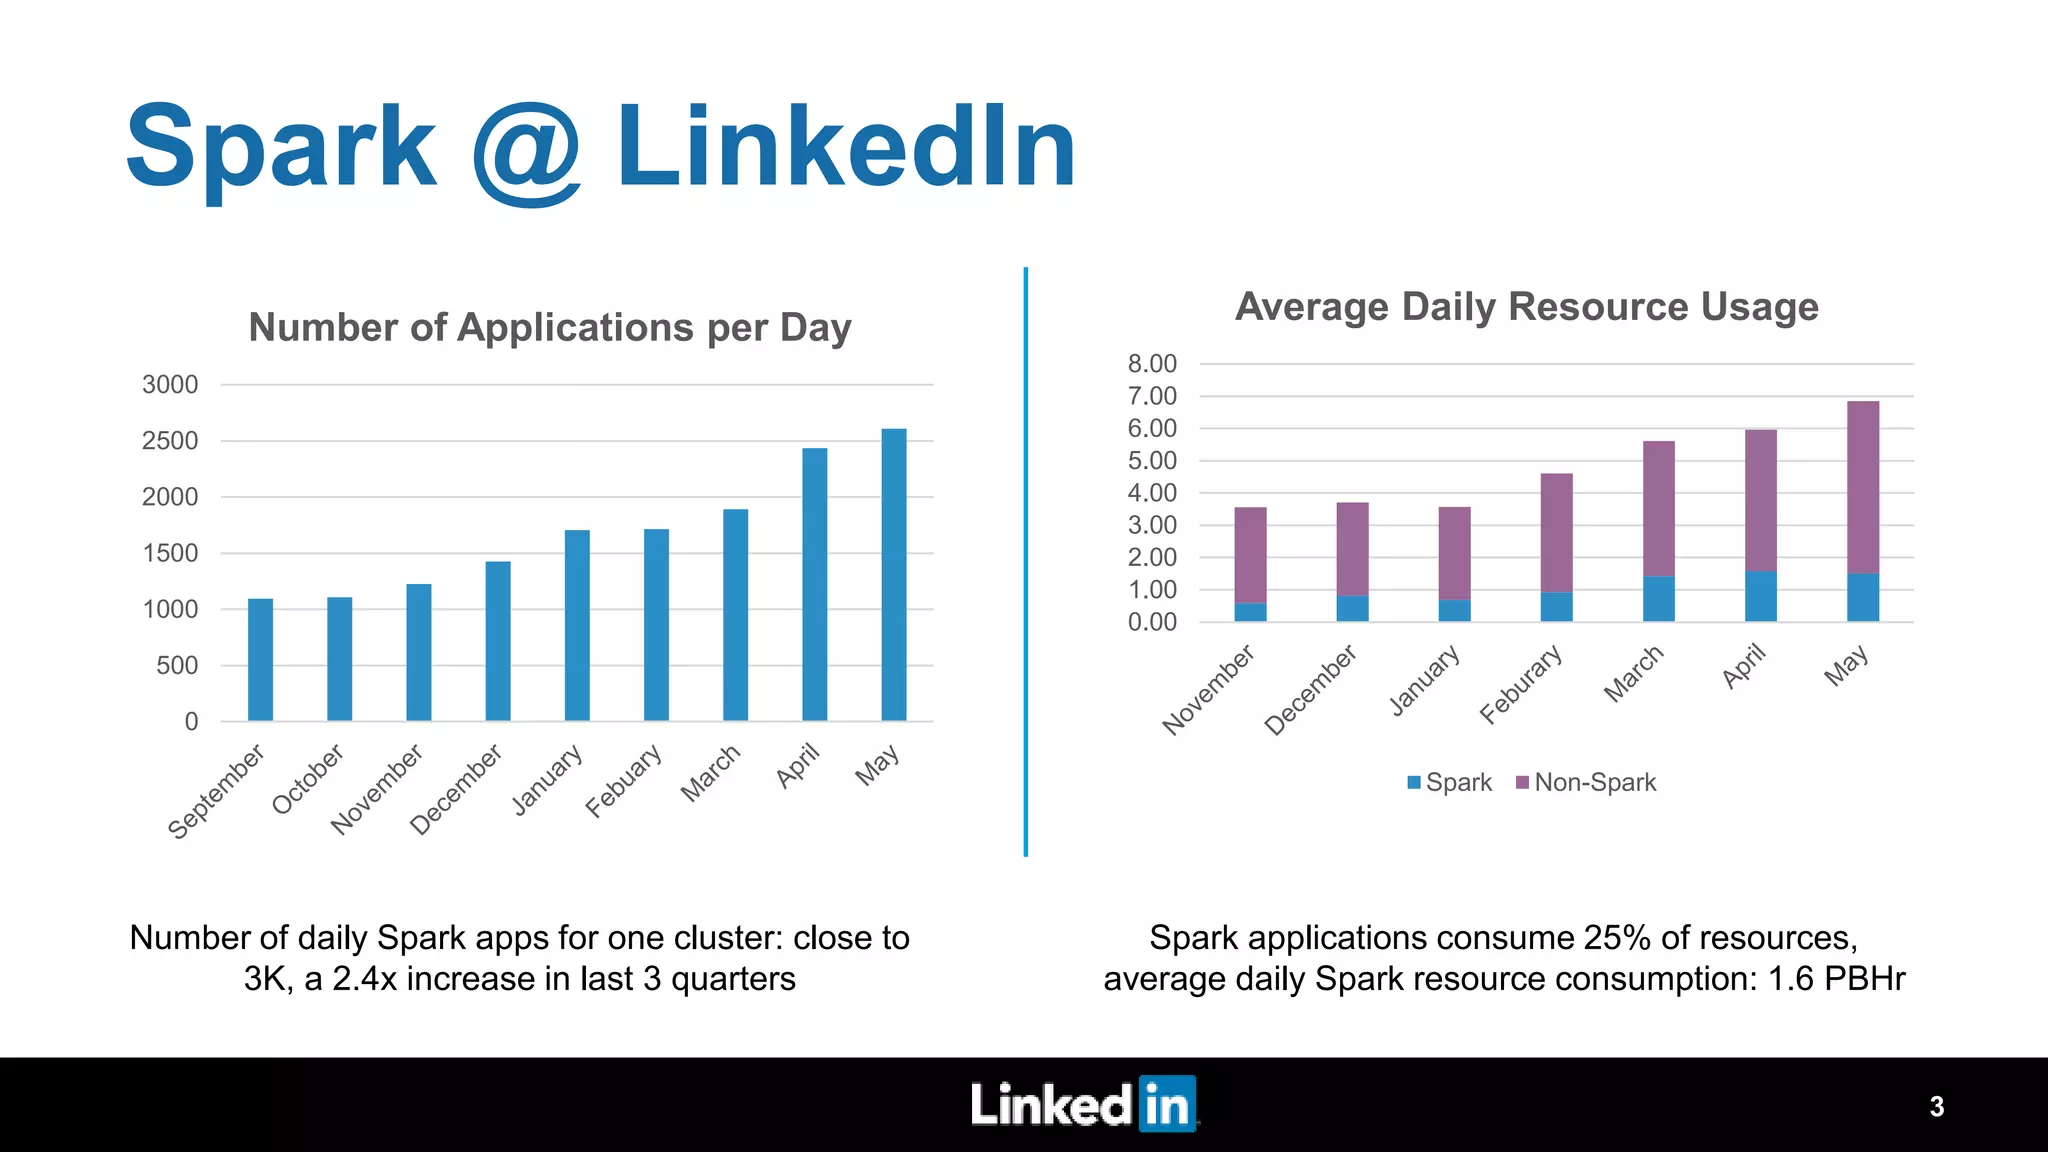
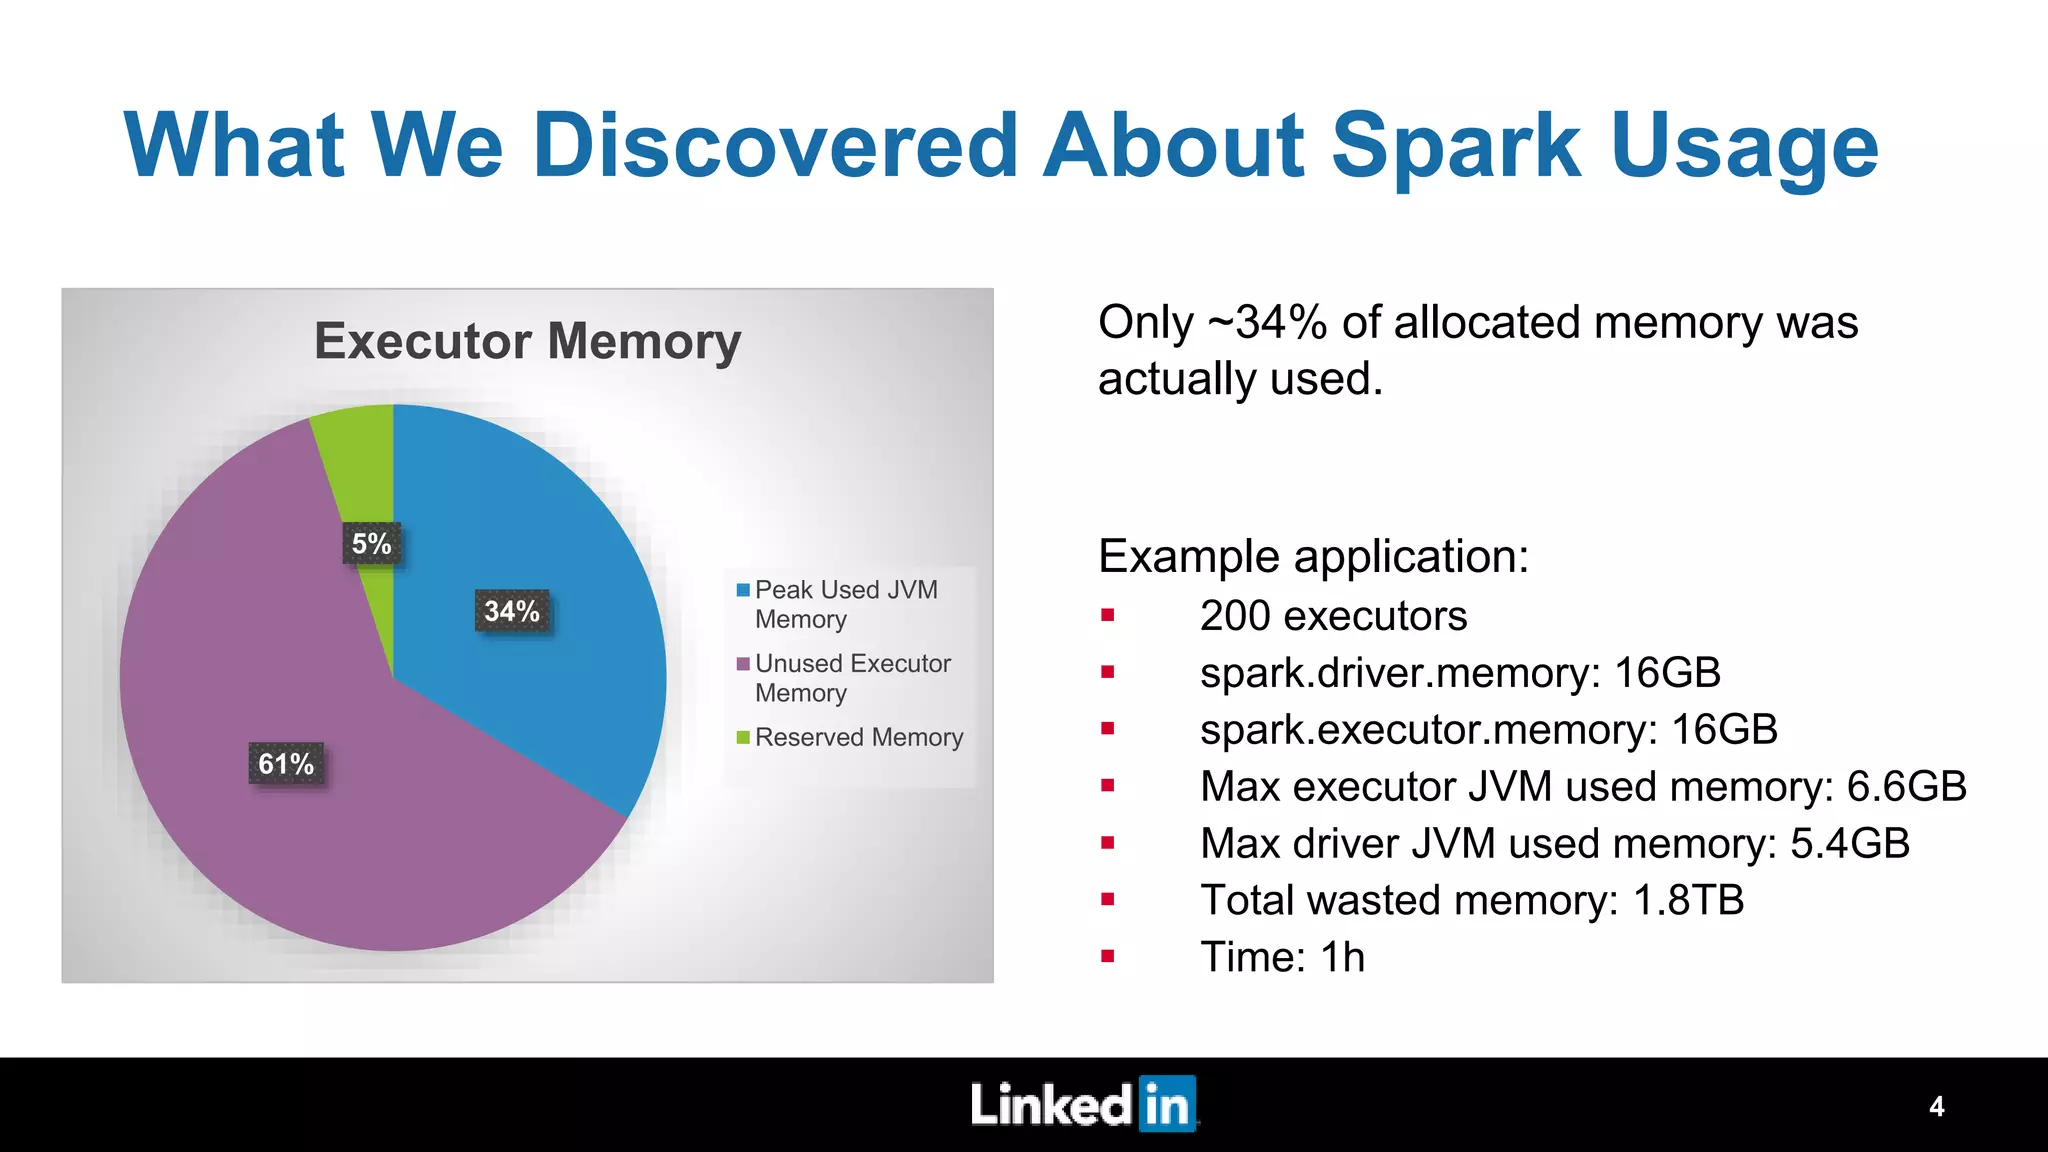
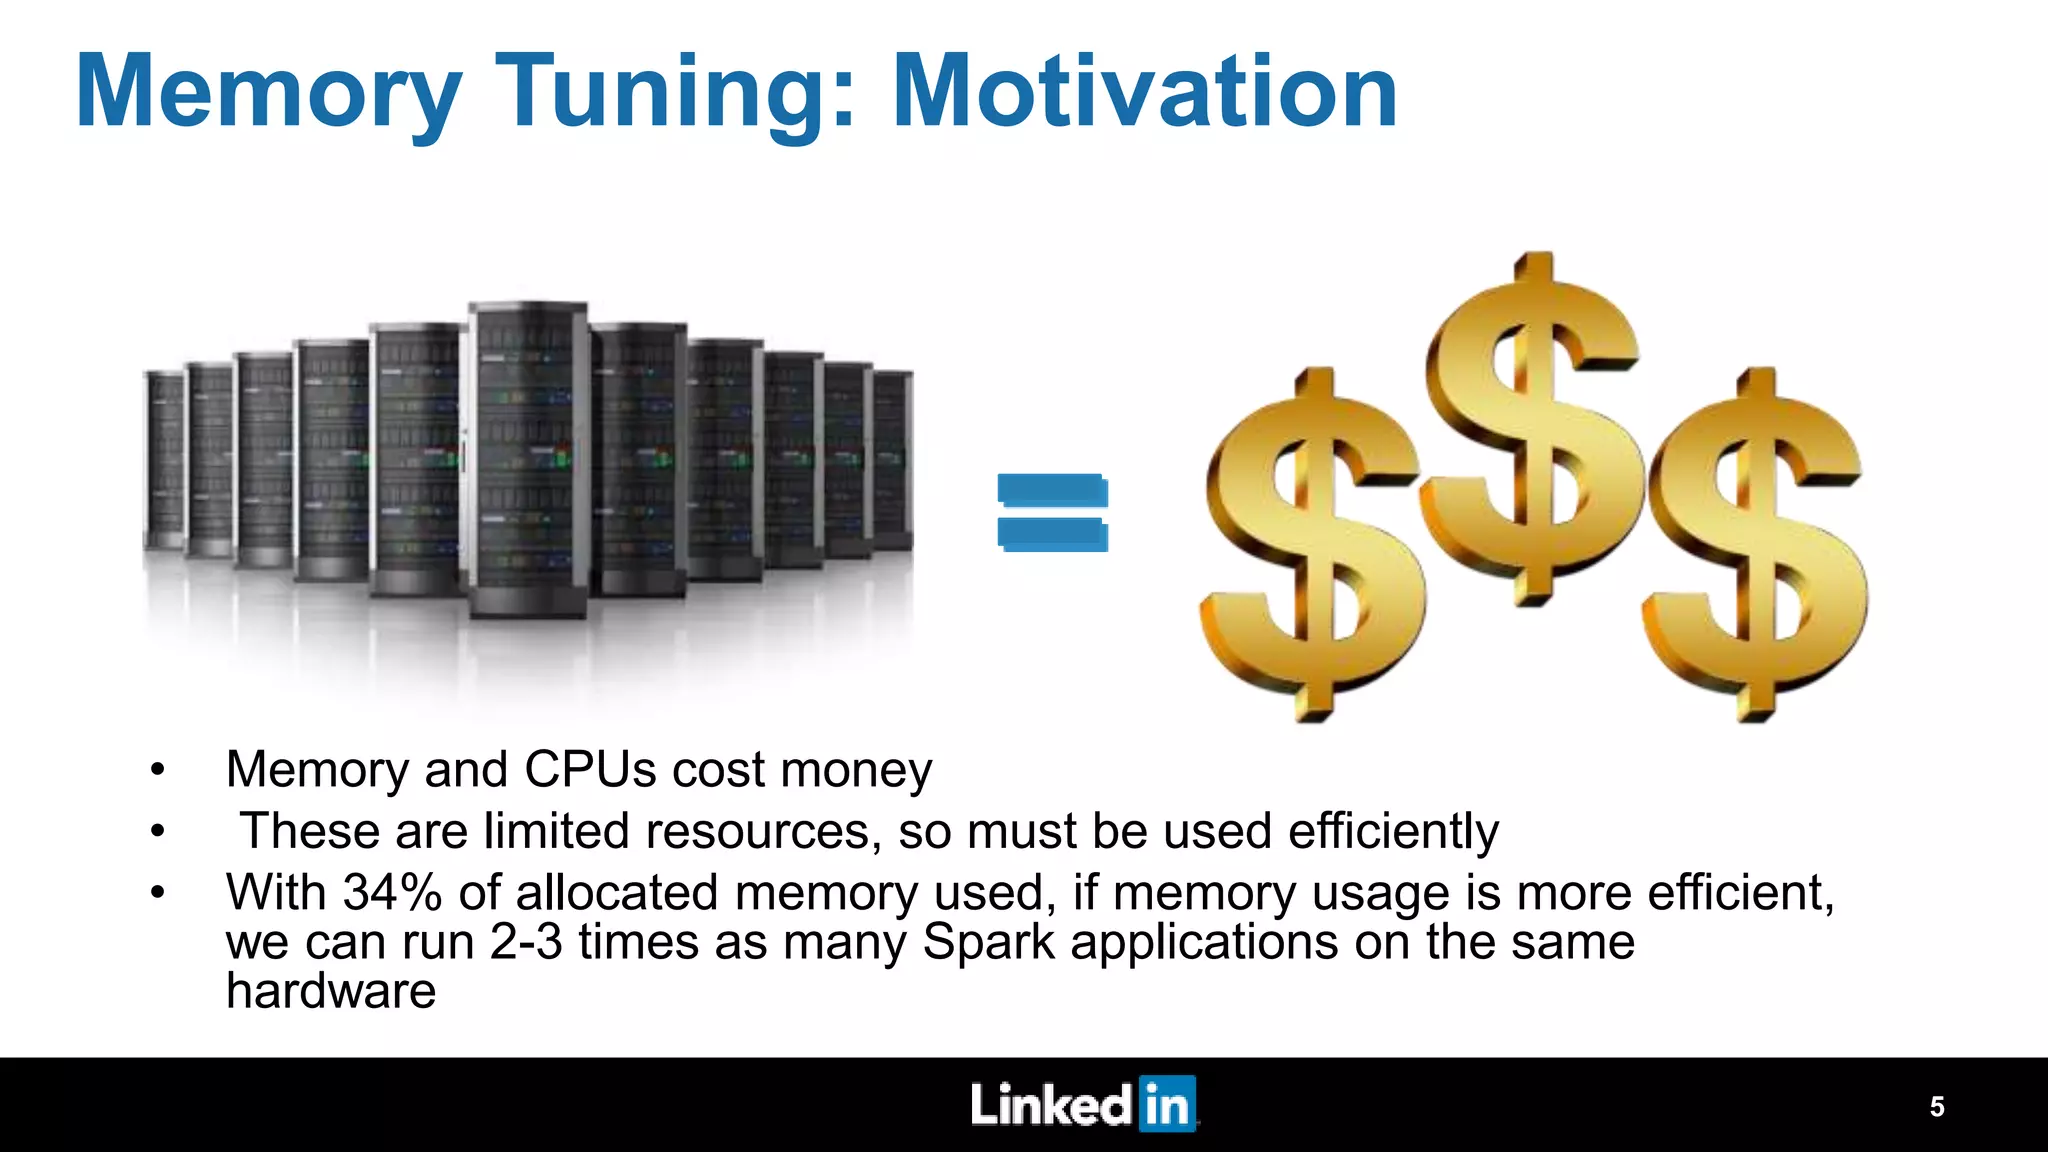
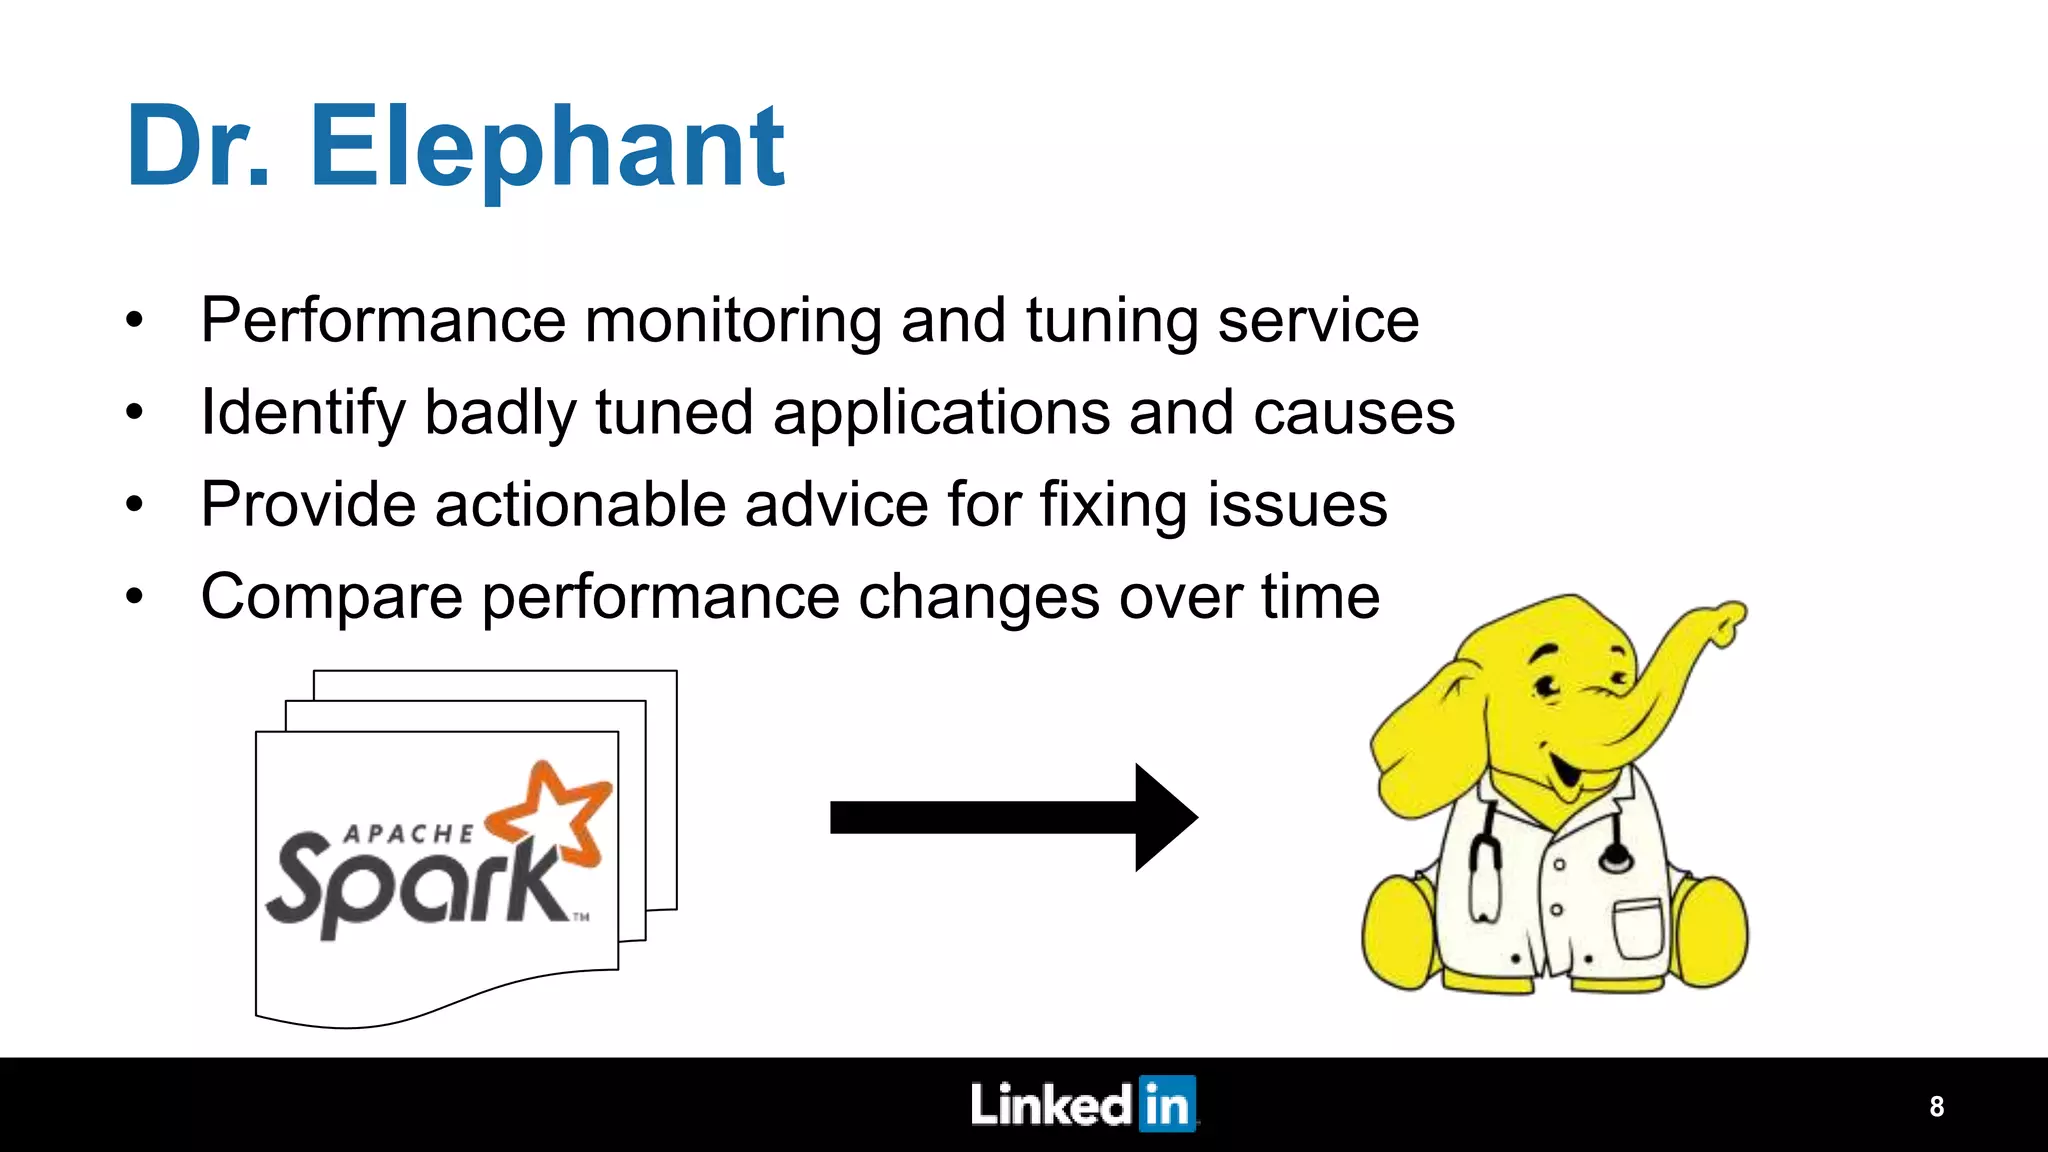
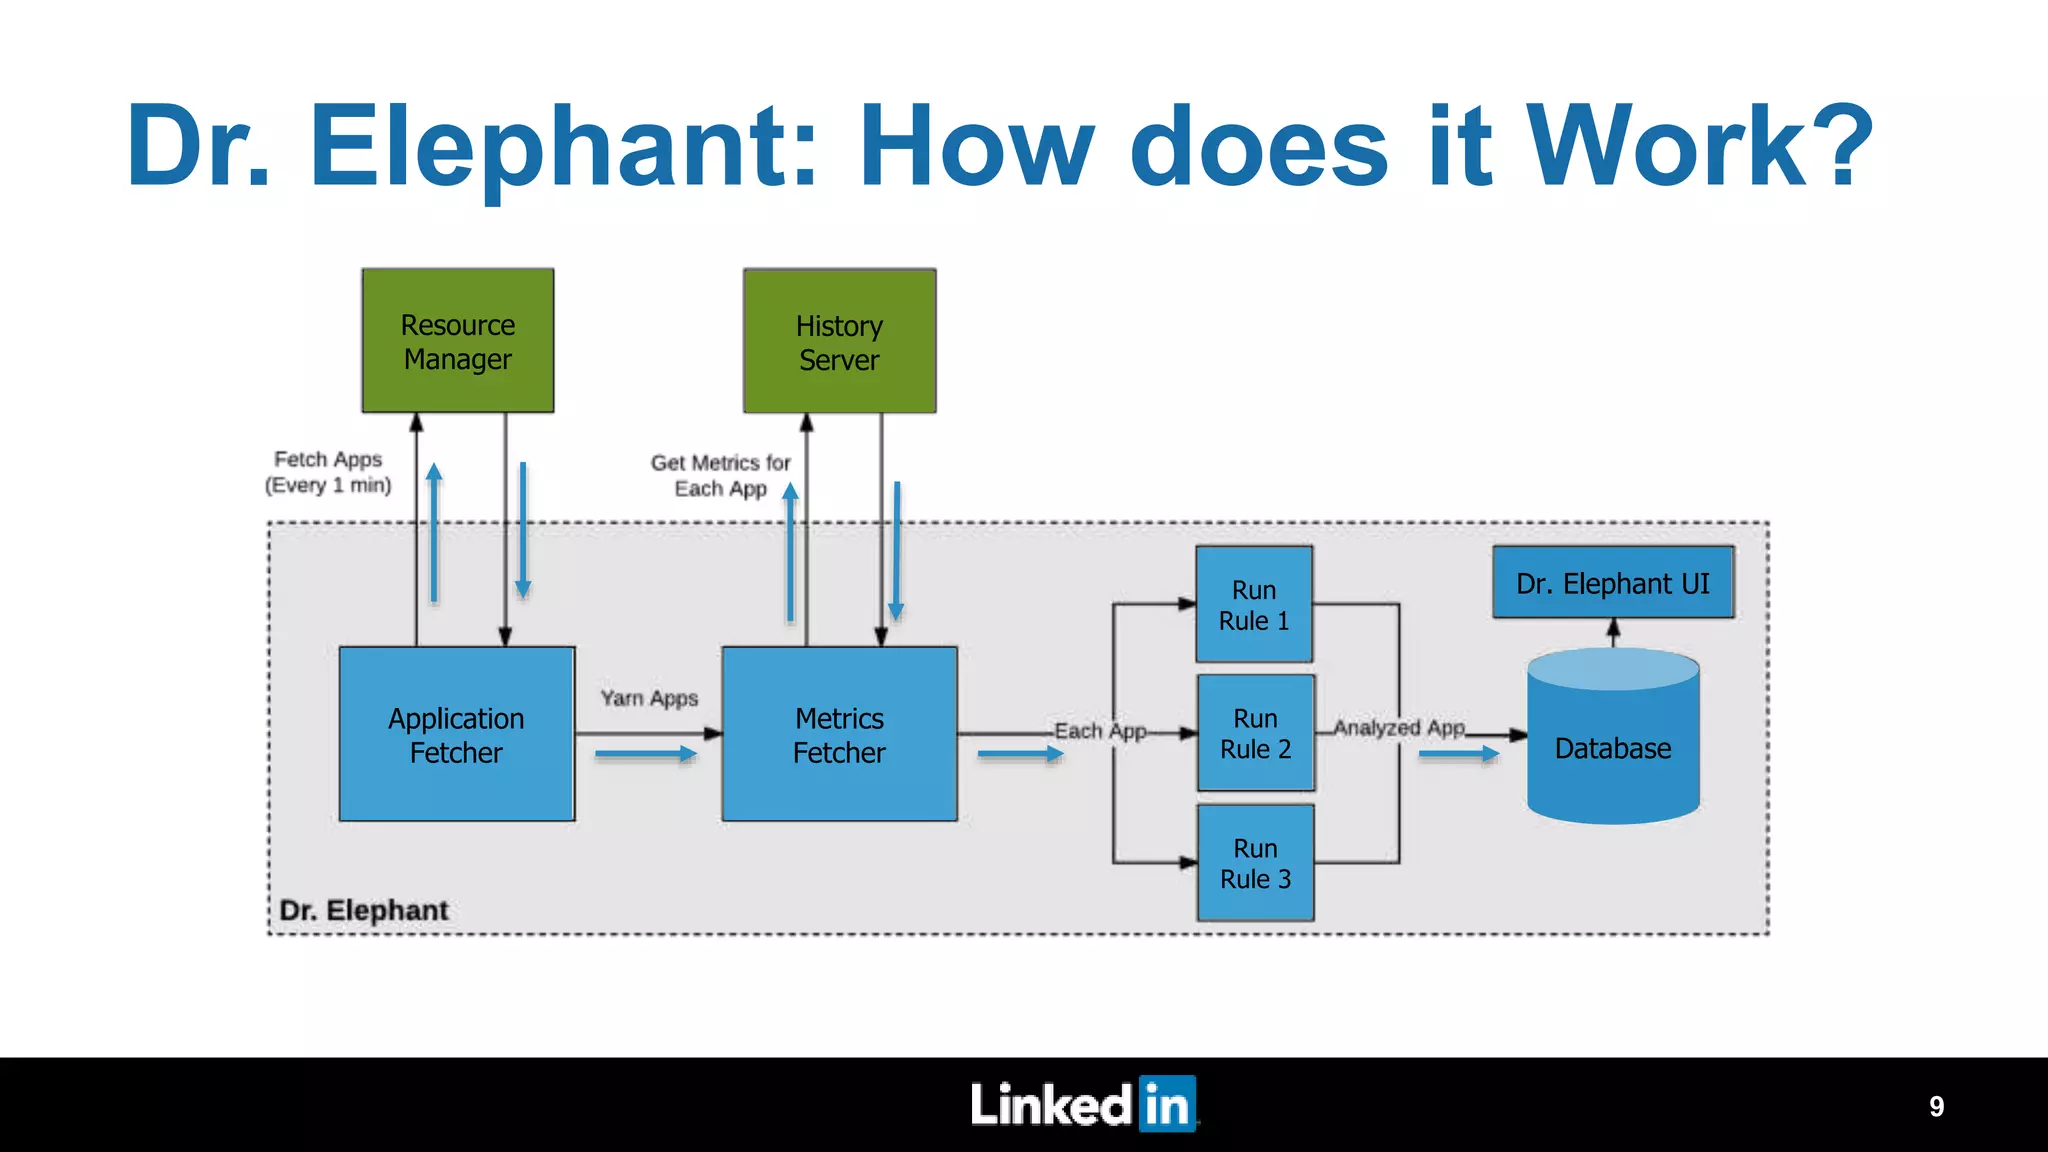
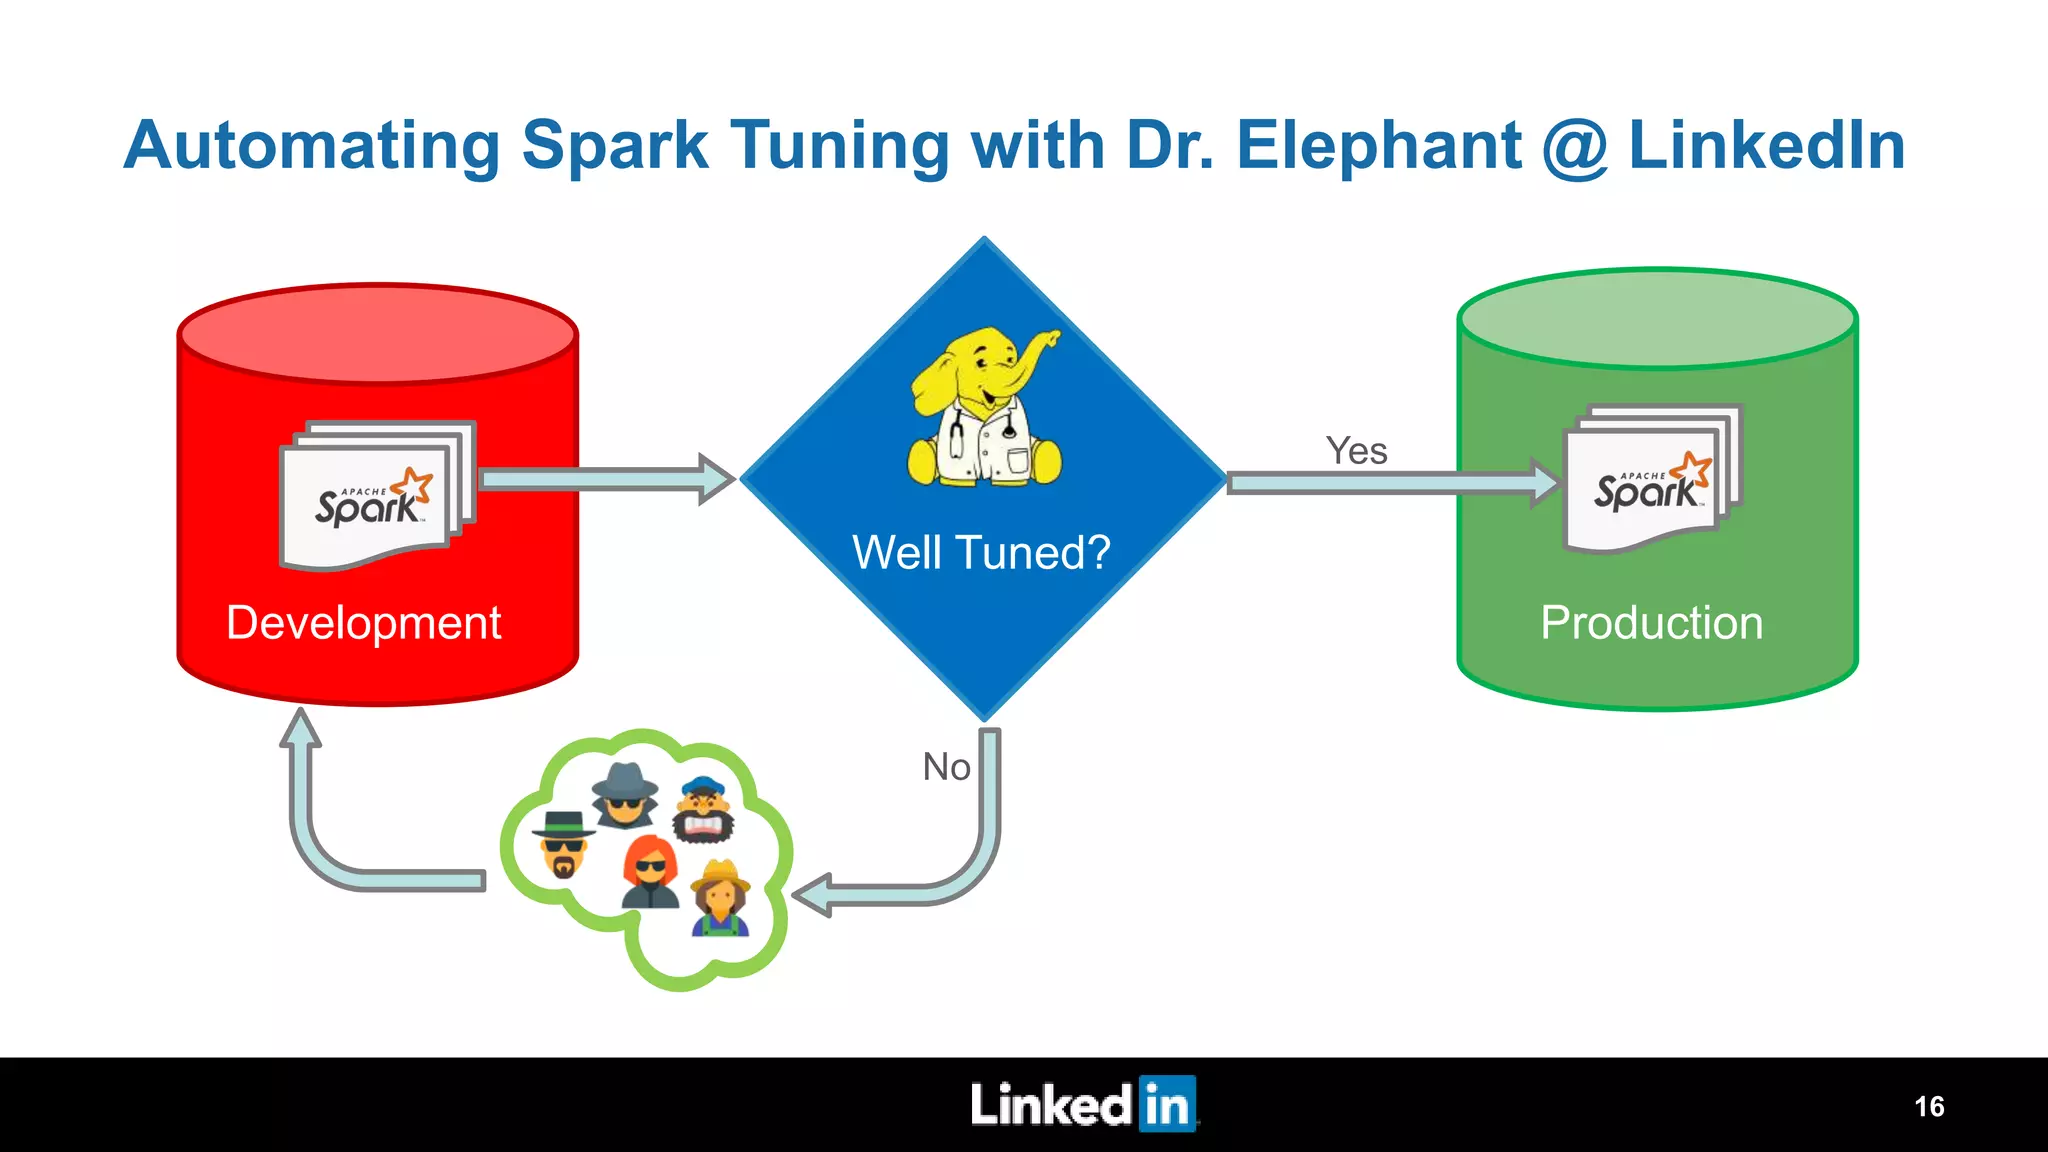
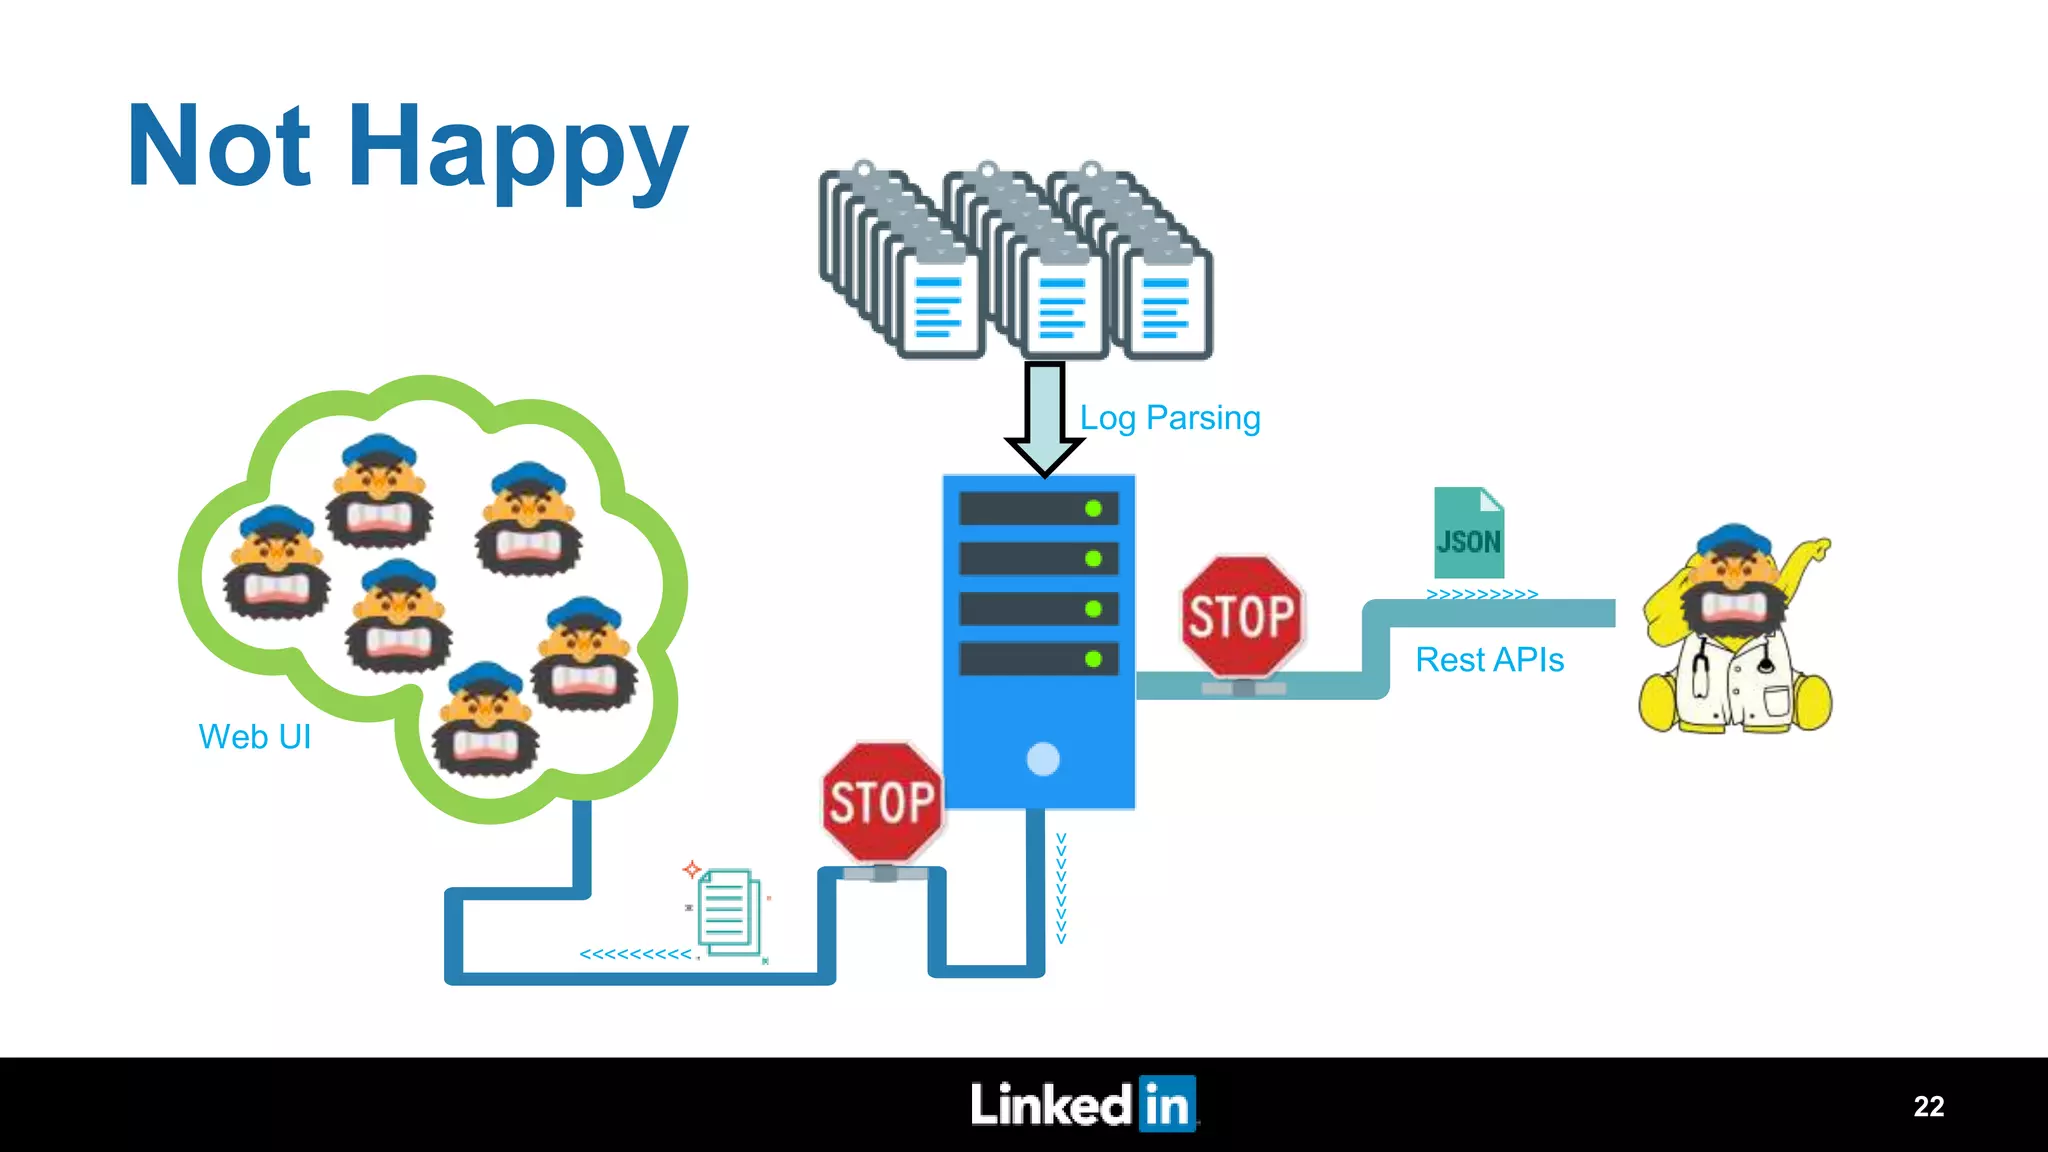
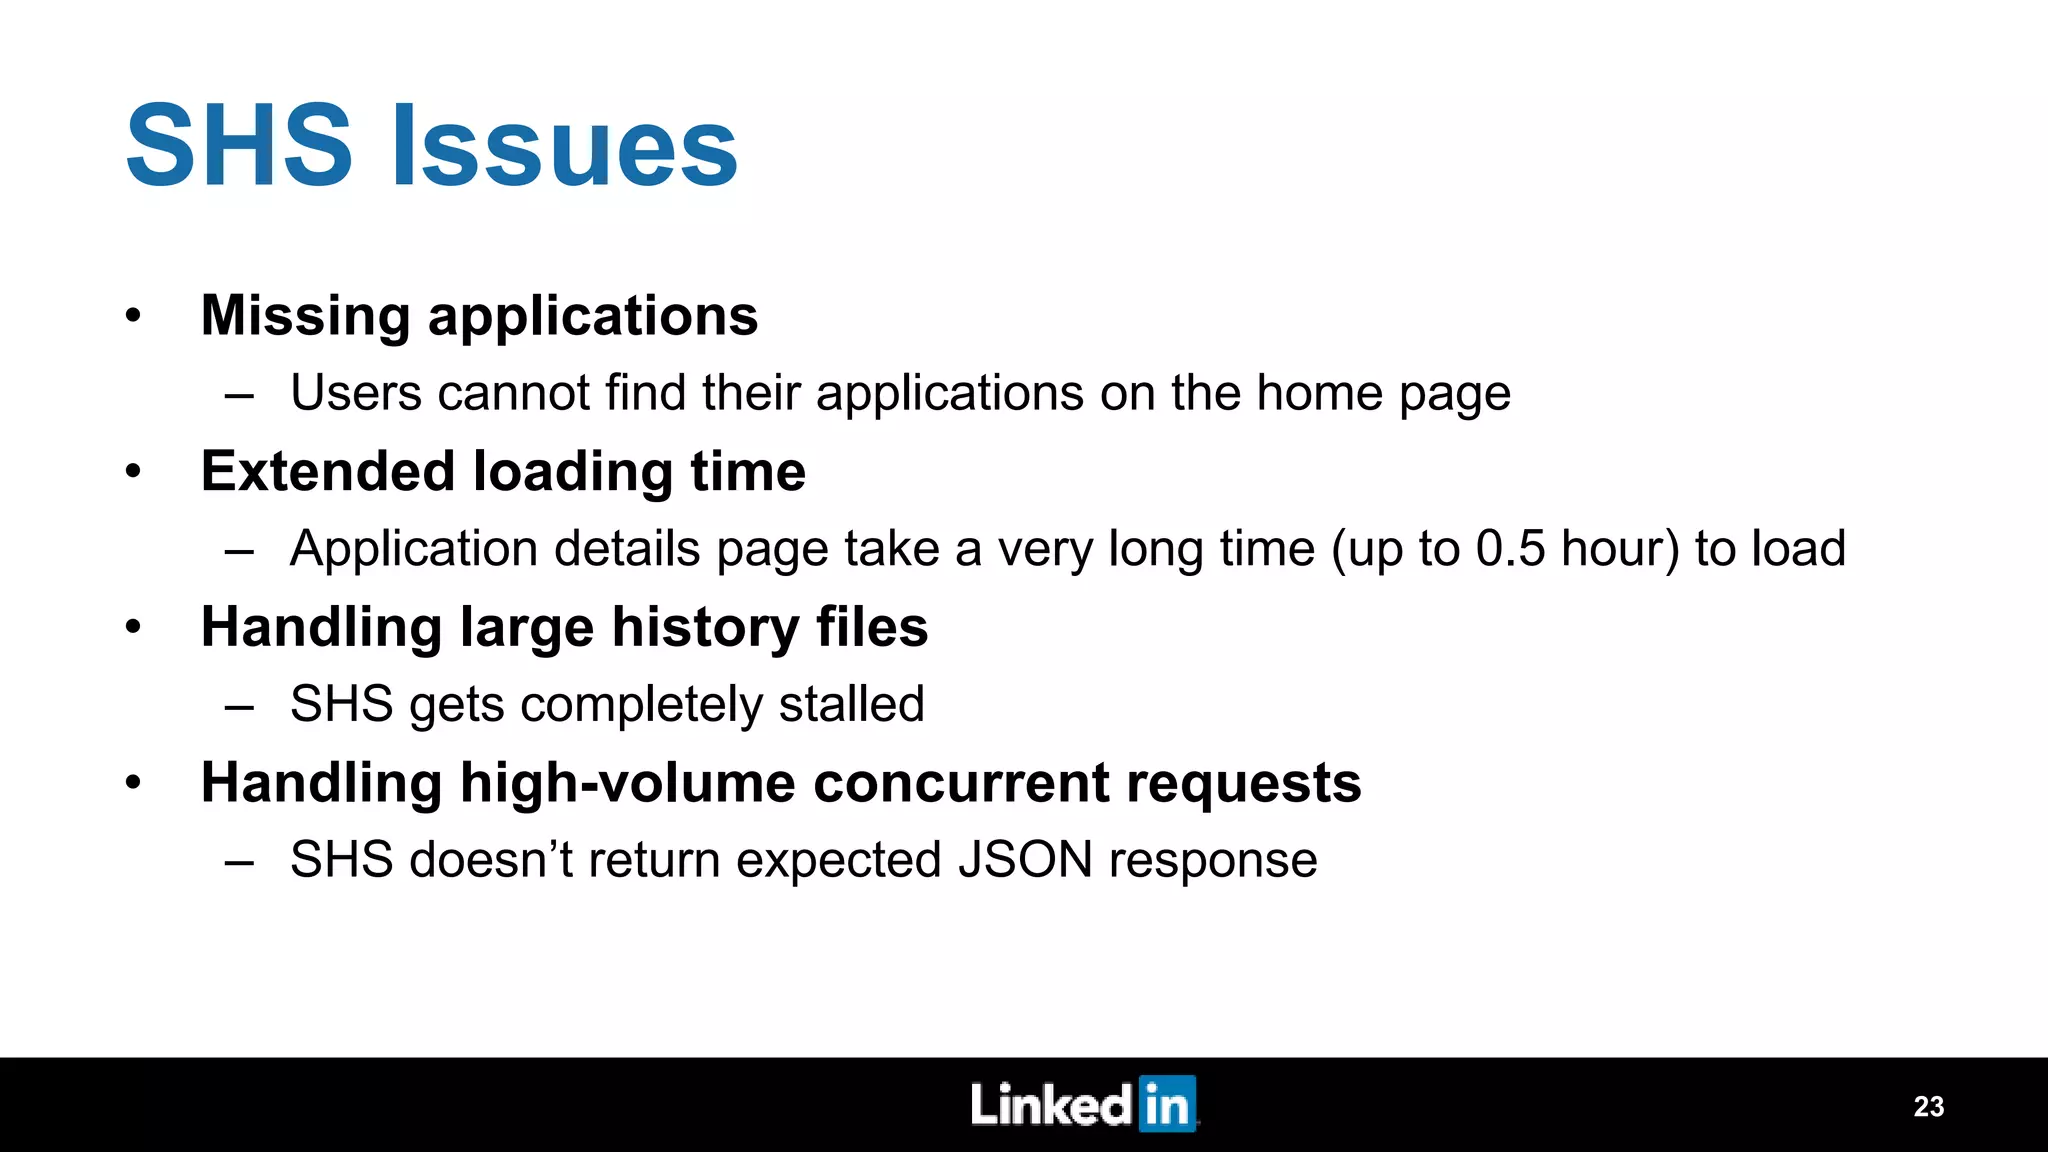
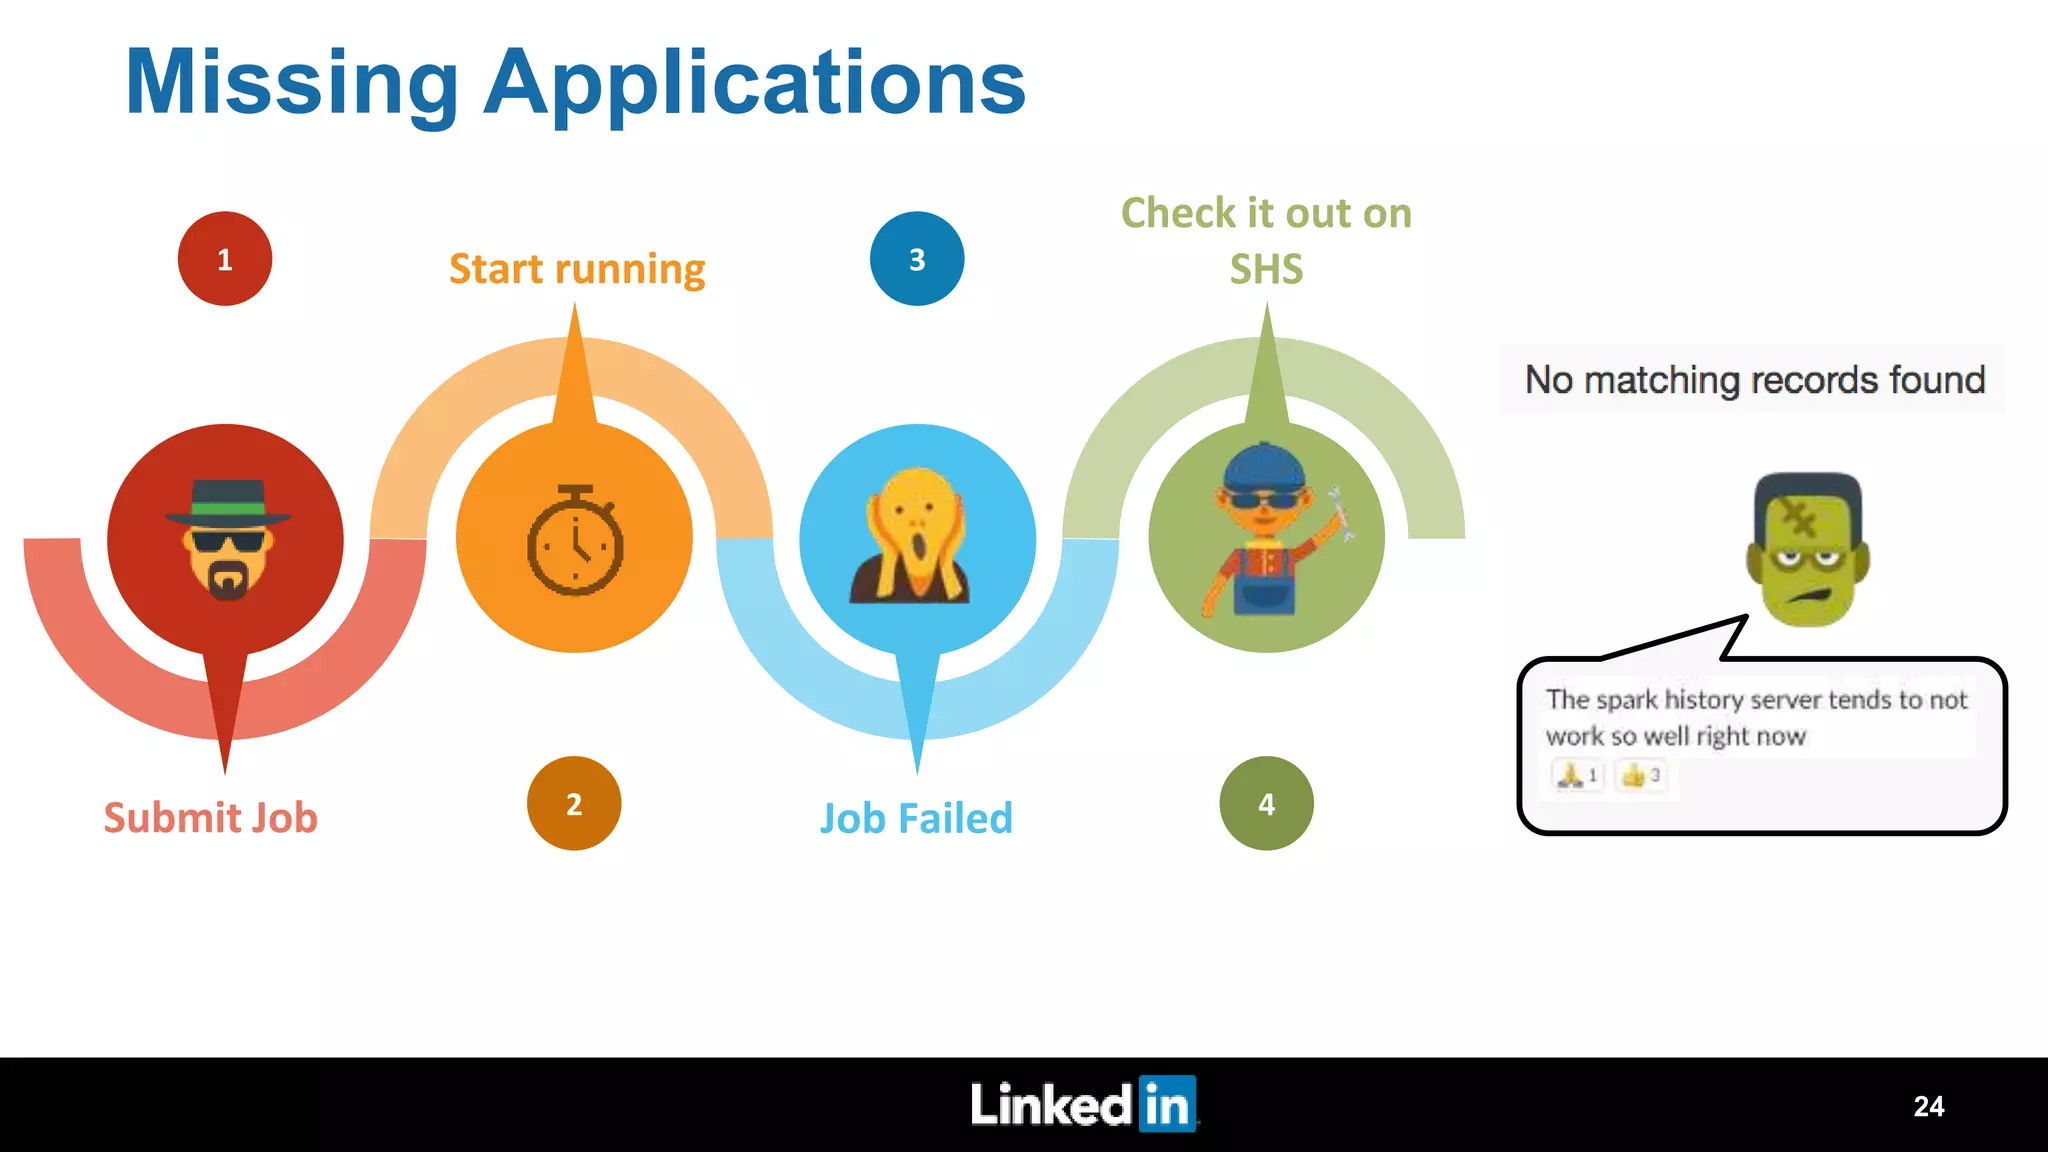
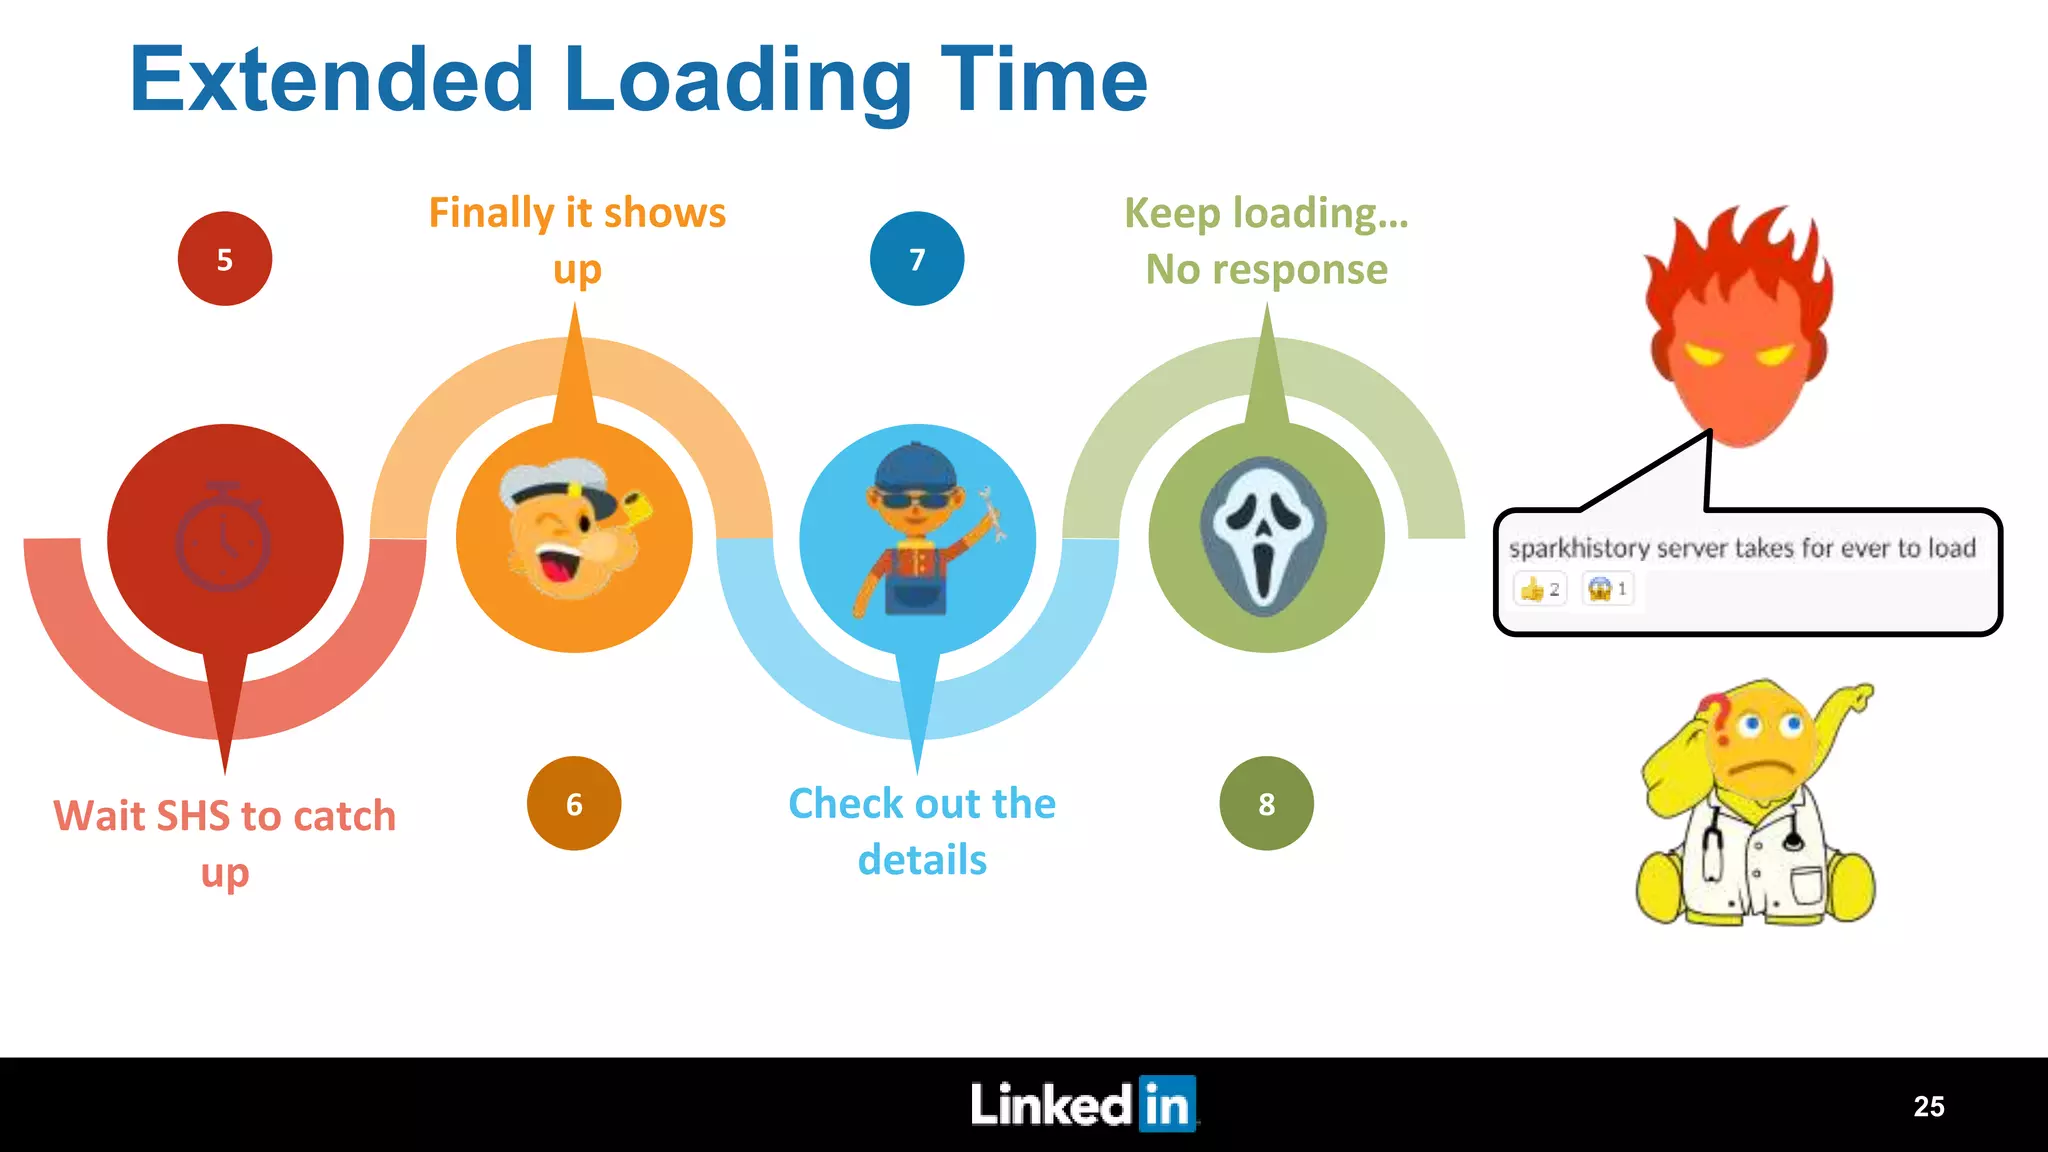
Edwina Lu and Ye Zhou, Metrics-Driven Tuning of Apache Spark at Scale
Hadoop Infra @ LinkedIn • 10+ clusters • 10,000+ nodes • 1000+ users 2
Number of daily Spark apps for one cluster: close to 3K, a 2.4x increase in last 3 quarters Spark applications consume 25% of resources, average daily Spark resource consumption: 1.6 PBHr 3 Spark @ LinkedIn 0 500 1000 1500 2000 2500 3000 Number of Applications per Day 0.00 1.00 2.00 3.00 4.00 5.00 6.00 7.00 8.00 Average Daily Resource Usage Spark Non-Spark
What We Discovered About Spark Usage Only ~34% of allocated memory was actually used. Example application:  200 executors  spark.driver.memory: 16GB  spark.executor.memory: 16GB  Max executor JVM used memory: 6.6GB  Max driver JVM used memory: 5.4GB  Total wasted memory: 1.8TB  Time: 1h 4 34% 61% 5% Executor Memory Peak Used JVM Memory Unused Executor Memory Reserved Memory
Memory Tuning: Motivation • Memory and CPUs cost money • These are limited resources, so must be used efficiently • With 34% of allocated memory used, if memory usage is more efficient, we can run 2-3 times as many Spark applications on the same hardware 5
Memory Tuning: What and How to Tune? • Spark tuning can be complicated, with many metrics and configuration parameters • Many users have limited knowledge about how to tune Spark applications 6
Memory Tuning: Scaling • Data scientist and engineer time cost even more money • Analyzing applications and giving tuning advice in person does not scale for the Spark team or users who must wait for help • Infrastructure efficiency vs. developer productivity – Do we have to choose between these two? 7
Dr. Elephant • Performance monitoring and tuning service • Identify badly tuned applications and causes • Provide actionable advice for fixing issues • Compare performance changes over time 8
Dr. Elephant: How does it Work? 9 Metrics Fetcher History Server Application Fetcher Resource Manager Run Rule 1 Run Rule 2 Run Rule 3 Database Dr. Elephant UI
Challenges for Dr. Elephant to Support Spark • Spark tuning heuristics – What are the necessary metrics to enable effective tuning? • Fetch Spark history – Spark components are not equally scalable 10
Spark Memory Overview 11 Executor Memory spark.executor.memory Overhead (off-heap memory) spark.yarn.executor.memoryOverhead max(executorMemory * 0.1, 384MB) Execution Memory Storage Memory spark.memory.storageFraction Reserved Memory 300 MB User Memory 1 – spark.memory.fraction = 0.4 Executor Container UNIFIED MEMORY spark.memory.fraction = 0.6 JVMUSEDMEMORY EXECUTORMEMORY
Executor JVM Used Memory Heuristic Spark Executor Memory Peak JVM Used Memory Reserved Memory 16GB 275.9MB300MBWastedMemory Executor JVM Used Memory Severity: Severe The configured executor memory is much higher than the maximum amount of JVM used by executors. Please set spark.executor.memory to a lower value. spark.executor.memory: 16 GB Max executor peak JVM used memory: 6.6 GB Suggested spark.executor.memory: 7 GB 12
Executor Unified Memory Heuristic Unified Memory Peak Unified Memory 8.36GB 474.42KBWastedMemory Executor Peak Unified Memory Severity: Critical The allocated unified memory is much higher than the maximum amount of unified memory used by executors. Please lower spark.memory.fraction. spark.executor.memory: 10 GB spark.memory.fraction: 0.6 Allocated unified memory: 6 GB Max peak JVM used memory: 7.2 GB Max peak unified memory: 1.2 GB Suggested spark.memory.fraction: 0.2 13
Execution Memory Spill Heuristic Disk Executor Memory Unified Memory Execution Memory Spill Severity: Severe Execution memory spill has been detected in stage 3. Shuffle read bytes and spill are evenly distributed. There are 200 tasks for this stage. Please increase spark.sql.shuffle.partitions, or modify the code to use more partitions, or reduce the number of executor cores. spark.executor.memory 10 GB spark.executor.cores 3 spark.executor.instances 300 Stage 3: Median shuffle read bytes: 954 MB Max shuffle read bytes: 955 MB Median shuffle write bytes: 359 MB Max shuffle write bytes: 388 MB Median memoryBytesSpilled: 1.2 GB Max memoryBytesSpilled: 1.2 GB Num tasks: 200 14
Executor GC Heuristic 13 Seconds 2 Minutes Executor Runtime GCTime Executor GC Severity: Moderate Executors are spending too much time in GC. Please increase spark.executor.memory. Spark.executor.memory: 4 GB GC time to executor run time ratio: 0.164 Total executor run time: 1 Hour 15 Minutes Total GC time: 12 Minutes 15
Automating Spark Tuning with Dr. Elephant @ LinkedIn Well Tuned? Ship It! Production Tune It! Yes No Development 16
Architecture Executor Task Task Cache Driver Task Scheduler Listener Bus Executor Task Task Cach e Executor Task Task Cache HDFS Spark History Logs Spark History Server DAG Scheduler EventLoggi ng Listener AppState Listener Task Heartbeats Task Task Heartbeats Heartbeats REST API Web UI 17
Upstream Ticket SPARK-23206: Additional Memory Tuning Metrics • New executor level memory metrics: – JVM used memory – Execution memory – Storage memory – Unified memory • Metrics sent from executors to driver via Heartbeat • Peak values for executor metrics logged at stage end • Metrics exposed via web UI and REST API 18
Overview of our Solution Scalable application metrics provider Spark History Server (SHS) Enhancements on SHS Benefits brought by enhanced SHS Scalable application history provider Dr Elephant Performance analysis at scale Debug Easy investigation of past applications 19
Spark History Server (SHS) at LinkedIn >>>>>>>>> >>>>>>>>> >>>>>>>>> >>>>>>>>> Log Parsing Web UI Rest APIs 20
How does SHS work? Apps DBsListing DB Queued Thread Pool Update Jetty Handlers Thread Pool Createhttp://www.yoursite.com http://www.yoursite.com http://www.yoursite.com SHS SPARK-18085 21
Not Happy >>>>>>>>> >>>>>>>>> >>>>>>>>> Log Parsing Web UI Rest APIs 22
SHS Issues • Missing applications – Users cannot find their applications on the home page • Extended loading time – Application details page take a very long time (up to 0.5 hour) to load • Handling large history files – SHS gets completely stalled • Handling high-volume concurrent requests – SHS doesn’t return expected JSON response 23
Missing Applications 1 2 3 4 Submit Job Start running Job Failed Check it out on SHS 24
5 6 7 8Wait SHS to catch up Finally it shows up Check out the details Keep loading… No response Extended Loading Time 25
Extended Listing Delay Listing DB History Files Update 1. Replay same file multiple times 2. Limited threads for the replay 3. Processing time proportional to file size 26
How to Decrease the Listing Delay Listing DB Read from extended attributes Spark Driver Write log file content Write log file extended attributes key/value Read from log content when fail to read from extended attributes 1 2 NameNode • Use HDFS Extended Attributes 27
Extended Loading Delay Apps DBs Request Response SHS Replaying all the events takes a long time for large log file Replay 28
How to Decrease the Loading Delay • DB creation time is unavoidable • Start DB creation prior to User’s request for every application log file Apps DBs Request SHS Replay Request Response 29
Results of Improvement • SHS can get the completed/running application information into home page within 1 minute. • Start to create DBs in 5 minutes for 90% applications right after they finish 30
Scalability Issues • Increasing number of Spark applications • Increasing Spark users 31
Severe Garbage Collection (GC) Full GC Full GC Full GCFull GC 32
What Caused GC? • Unnecessary events used too much memory while replaying • SHS got completely stalled • SHS needs to ignore those unnecessary events 33 23GB
High-Volume Concurrent Requests • When REST call frequency goes beyond certain threshold, SHS is likely to return non- JSON response to users • Home page shows empty list 34
Upstream Tickets SPARK-23607: Use HDFS extended attributes to store application summary SPARK-21961: Filter out BlockStatusUpdates in History Server when analyzing logs SPARK-23608: Synchronize when attaching and detaching SparkUI in History Server 35
Results • User can always find their applications on SHS home page within 1 minute • For 90% of applications DBs, SHS will start creating them within 5 minutes after they complete • Stable and reliable service • Handle high-volume concurrent requests 36
Future Work • More memory metrics: – Netty memory – Total memory • More Tuning: – Skew in assignment of tasks to executors – Size/time skew in tasks for a stage – DAG analysis • Incremental Replay for History Logs • Horizontal Scalable History Server 37
Q&A 38

Metrics-driven tuning of Apache Spark at scale

  • 1.
    Edwina Lu andYe Zhou, Metrics-Driven Tuning of Apache Spark at Scale
  • 2.
    Hadoop Infra @LinkedIn • 10+ clusters • 10,000+ nodes • 1000+ users 2
  • 3.
    Number of dailySpark apps for one cluster: close to 3K, a 2.4x increase in last 3 quarters Spark applications consume 25% of resources, average daily Spark resource consumption: 1.6 PBHr 3 Spark @ LinkedIn 0 500 1000 1500 2000 2500 3000 Number of Applications per Day 0.00 1.00 2.00 3.00 4.00 5.00 6.00 7.00 8.00 Average Daily Resource Usage Spark Non-Spark
  • 4.
    What We DiscoveredAbout Spark Usage Only ~34% of allocated memory was actually used. Example application:  200 executors  spark.driver.memory: 16GB  spark.executor.memory: 16GB  Max executor JVM used memory: 6.6GB  Max driver JVM used memory: 5.4GB  Total wasted memory: 1.8TB  Time: 1h 4 34% 61% 5% Executor Memory Peak Used JVM Memory Unused Executor Memory Reserved Memory
  • 5.
    Memory Tuning: Motivation •Memory and CPUs cost money • These are limited resources, so must be used efficiently • With 34% of allocated memory used, if memory usage is more efficient, we can run 2-3 times as many Spark applications on the same hardware 5
  • 6.
    Memory Tuning: Whatand How to Tune? • Spark tuning can be complicated, with many metrics and configuration parameters • Many users have limited knowledge about how to tune Spark applications 6
  • 7.
    Memory Tuning: Scaling •Data scientist and engineer time cost even more money • Analyzing applications and giving tuning advice in person does not scale for the Spark team or users who must wait for help • Infrastructure efficiency vs. developer productivity – Do we have to choose between these two? 7
  • 8.
    Dr. Elephant • Performancemonitoring and tuning service • Identify badly tuned applications and causes • Provide actionable advice for fixing issues • Compare performance changes over time 8
  • 9.
    Dr. Elephant: Howdoes it Work? 9 Metrics Fetcher History Server Application Fetcher Resource Manager Run Rule 1 Run Rule 2 Run Rule 3 Database Dr. Elephant UI
  • 10.
    Challenges for Dr.Elephant to Support Spark • Spark tuning heuristics – What are the necessary metrics to enable effective tuning? • Fetch Spark history – Spark components are not equally scalable 10
  • 11.
    Spark Memory Overview 11 ExecutorMemory spark.executor.memory Overhead (off-heap memory) spark.yarn.executor.memoryOverhead max(executorMemory * 0.1, 384MB) Execution Memory Storage Memory spark.memory.storageFraction Reserved Memory 300 MB User Memory 1 – spark.memory.fraction = 0.4 Executor Container UNIFIED MEMORY spark.memory.fraction = 0.6 JVMUSEDMEMORY EXECUTORMEMORY
  • 12.
    Executor JVM UsedMemory Heuristic Spark Executor Memory Peak JVM Used Memory Reserved Memory 16GB 275.9MB300MBWastedMemory Executor JVM Used Memory Severity: Severe The configured executor memory is much higher than the maximum amount of JVM used by executors. Please set spark.executor.memory to a lower value. spark.executor.memory: 16 GB Max executor peak JVM used memory: 6.6 GB Suggested spark.executor.memory: 7 GB 12
  • 13.
    Executor Unified MemoryHeuristic Unified Memory Peak Unified Memory 8.36GB 474.42KBWastedMemory Executor Peak Unified Memory Severity: Critical The allocated unified memory is much higher than the maximum amount of unified memory used by executors. Please lower spark.memory.fraction. spark.executor.memory: 10 GB spark.memory.fraction: 0.6 Allocated unified memory: 6 GB Max peak JVM used memory: 7.2 GB Max peak unified memory: 1.2 GB Suggested spark.memory.fraction: 0.2 13
  • 14.
    Execution Memory SpillHeuristic Disk Executor Memory Unified Memory Execution Memory Spill Severity: Severe Execution memory spill has been detected in stage 3. Shuffle read bytes and spill are evenly distributed. There are 200 tasks for this stage. Please increase spark.sql.shuffle.partitions, or modify the code to use more partitions, or reduce the number of executor cores. spark.executor.memory 10 GB spark.executor.cores 3 spark.executor.instances 300 Stage 3: Median shuffle read bytes: 954 MB Max shuffle read bytes: 955 MB Median shuffle write bytes: 359 MB Max shuffle write bytes: 388 MB Median memoryBytesSpilled: 1.2 GB Max memoryBytesSpilled: 1.2 GB Num tasks: 200 14
  • 15.
    Executor GC Heuristic 13Seconds 2 Minutes Executor Runtime GCTime Executor GC Severity: Moderate Executors are spending too much time in GC. Please increase spark.executor.memory. Spark.executor.memory: 4 GB GC time to executor run time ratio: 0.164 Total executor run time: 1 Hour 15 Minutes Total GC time: 12 Minutes 15
  • 16.
    Automating Spark Tuningwith Dr. Elephant @ LinkedIn Well Tuned? Ship It! Production Tune It! Yes No Development 16
  • 17.
    Architecture Executor Task Task Cache Driver TaskScheduler Listener Bus Executor Task Task Cach e Executor Task Task Cache HDFS Spark History Logs Spark History Server DAG Scheduler EventLoggi ng Listener AppState Listener Task Heartbeats Task Task Heartbeats Heartbeats REST API Web UI 17
  • 18.
    Upstream Ticket SPARK-23206: AdditionalMemory Tuning Metrics • New executor level memory metrics: – JVM used memory – Execution memory – Storage memory – Unified memory • Metrics sent from executors to driver via Heartbeat • Peak values for executor metrics logged at stage end • Metrics exposed via web UI and REST API 18
  • 19.
    Overview of ourSolution Scalable application metrics provider Spark History Server (SHS) Enhancements on SHS Benefits brought by enhanced SHS Scalable application history provider Dr Elephant Performance analysis at scale Debug Easy investigation of past applications 19
  • 20.
    Spark History Server(SHS) at LinkedIn >>>>>>>>> >>>>>>>>> >>>>>>>>> >>>>>>>>> Log Parsing Web UI Rest APIs 20
  • 21.
    How does SHSwork? Apps DBsListing DB Queued Thread Pool Update Jetty Handlers Thread Pool Createhttp://www.yoursite.com http://www.yoursite.com http://www.yoursite.com SHS SPARK-18085 21
  • 22.
  • 23.
    SHS Issues • Missingapplications – Users cannot find their applications on the home page • Extended loading time – Application details page take a very long time (up to 0.5 hour) to load • Handling large history files – SHS gets completely stalled • Handling high-volume concurrent requests – SHS doesn’t return expected JSON response 23
  • 24.
    Missing Applications 1 2 3 4 Submit Job Startrunning Job Failed Check it out on SHS 24
  • 25.
    5 6 7 8Wait SHS tocatch up Finally it shows up Check out the details Keep loading… No response Extended Loading Time 25
  • 26.
    Extended Listing Delay ListingDB History Files Update 1. Replay same file multiple times 2. Limited threads for the replay 3. Processing time proportional to file size 26
  • 27.
    How to Decreasethe Listing Delay Listing DB Read from extended attributes Spark Driver Write log file content Write log file extended attributes key/value Read from log content when fail to read from extended attributes 1 2 NameNode • Use HDFS Extended Attributes 27
  • 28.
    Extended Loading Delay AppsDBs Request Response SHS Replaying all the events takes a long time for large log file Replay 28
  • 29.
    How to Decreasethe Loading Delay • DB creation time is unavoidable • Start DB creation prior to User’s request for every application log file Apps DBs Request SHS Replay Request Response 29
  • 30.
    Results of Improvement •SHS can get the completed/running application information into home page within 1 minute. • Start to create DBs in 5 minutes for 90% applications right after they finish 30
  • 31.
    Scalability Issues • Increasingnumber of Spark applications • Increasing Spark users 31
  • 32.
    Severe Garbage Collection(GC) Full GC Full GC Full GCFull GC 32
  • 33.
    What Caused GC? •Unnecessary events used too much memory while replaying • SHS got completely stalled • SHS needs to ignore those unnecessary events 33 23GB
  • 34.
    High-Volume Concurrent Requests •When REST call frequency goes beyond certain threshold, SHS is likely to return non- JSON response to users • Home page shows empty list 34
  • 35.
    Upstream Tickets SPARK-23607: UseHDFS extended attributes to store application summary SPARK-21961: Filter out BlockStatusUpdates in History Server when analyzing logs SPARK-23608: Synchronize when attaching and detaching SparkUI in History Server 35
  • 36.
    Results • User canalways find their applications on SHS home page within 1 minute • For 90% of applications DBs, SHS will start creating them within 5 minutes after they complete • Stable and reliable service • Handle high-volume concurrent requests 36
  • 37.
    Future Work • Morememory metrics: – Netty memory – Total memory • More Tuning: – Skew in assignment of tasks to executors – Size/time skew in tasks for a stage – DAG analysis • Incremental Replay for History Logs • Horizontal Scalable History Server 37
  • 38.