Download as PDF, PPTX


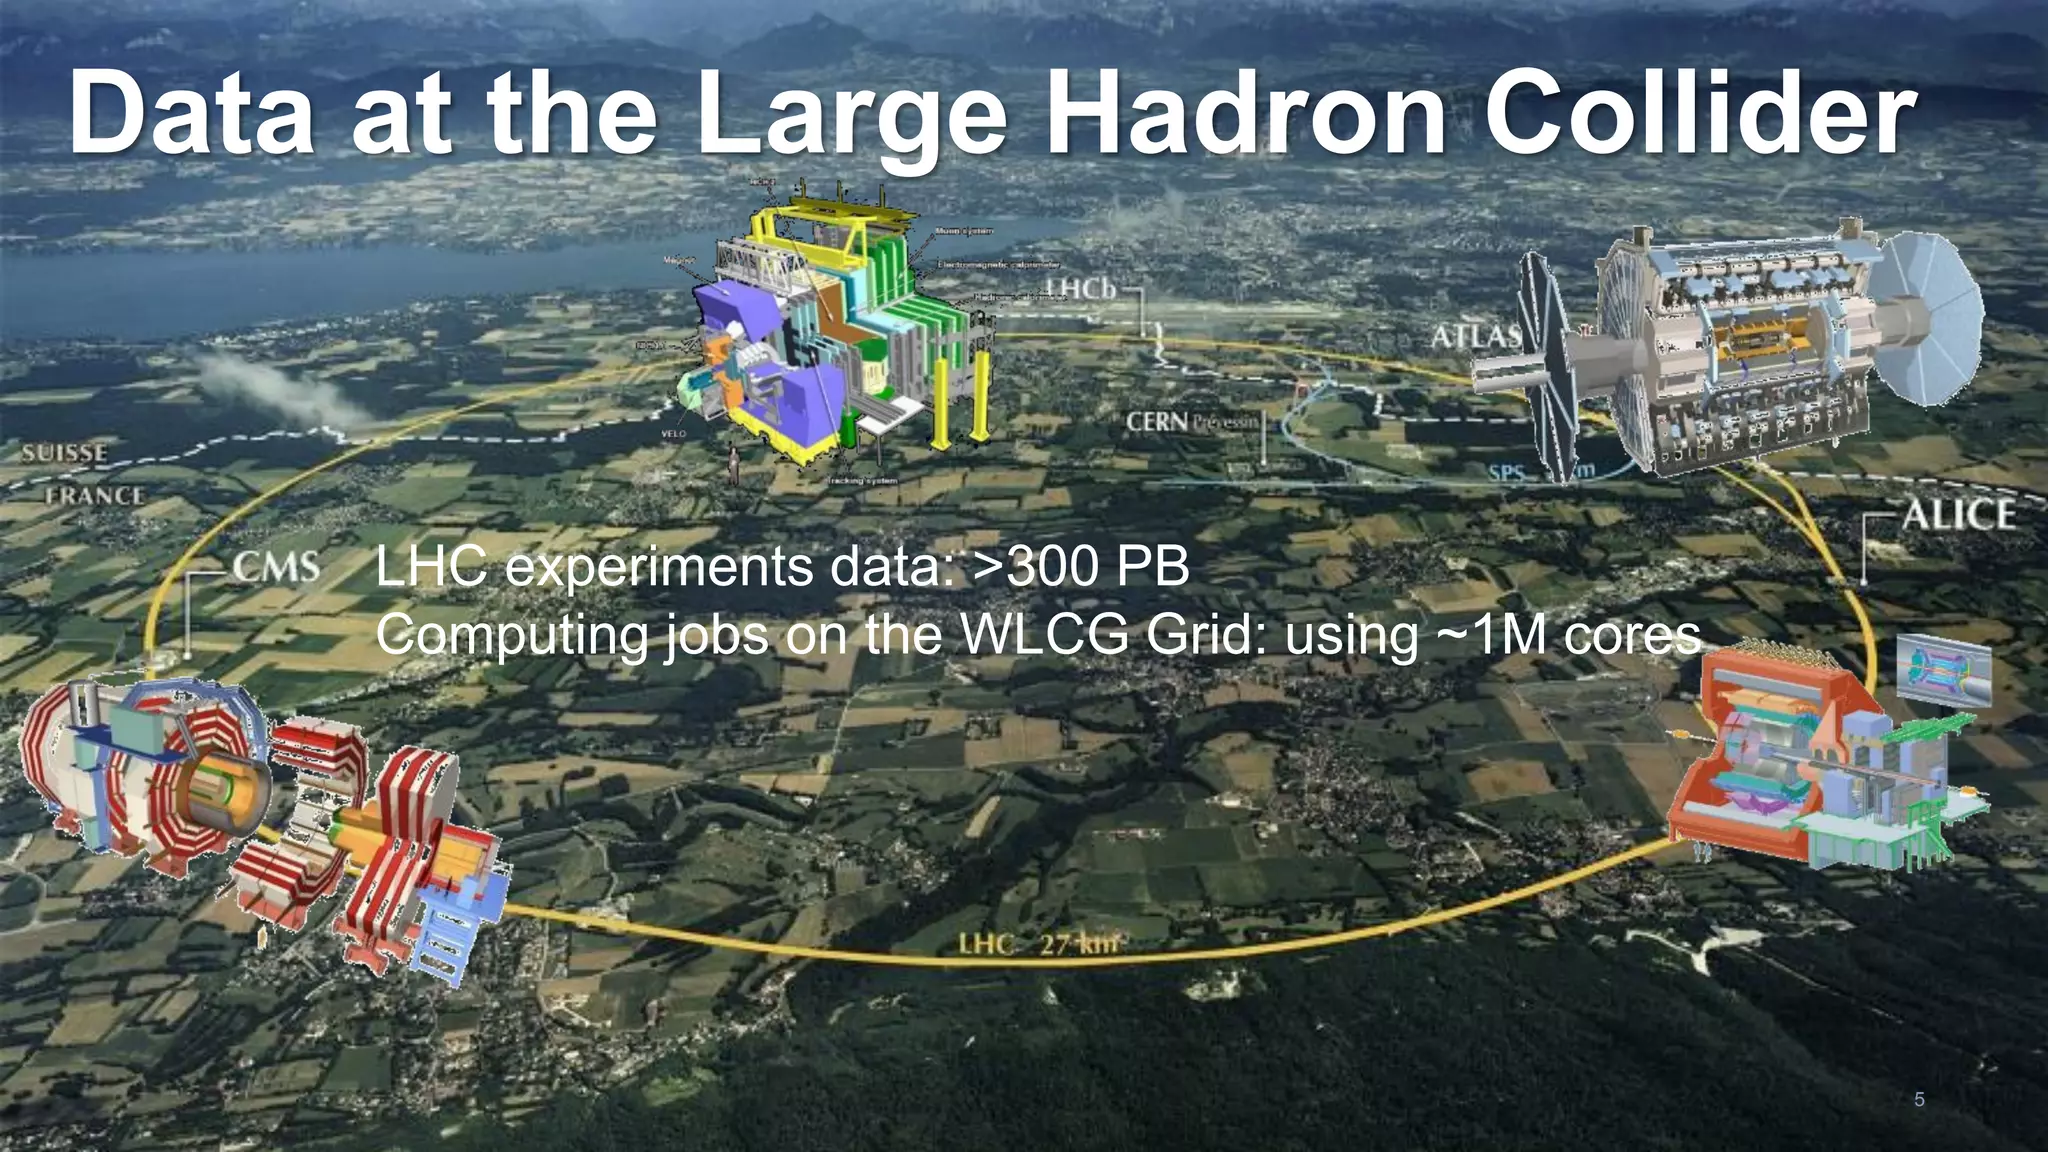
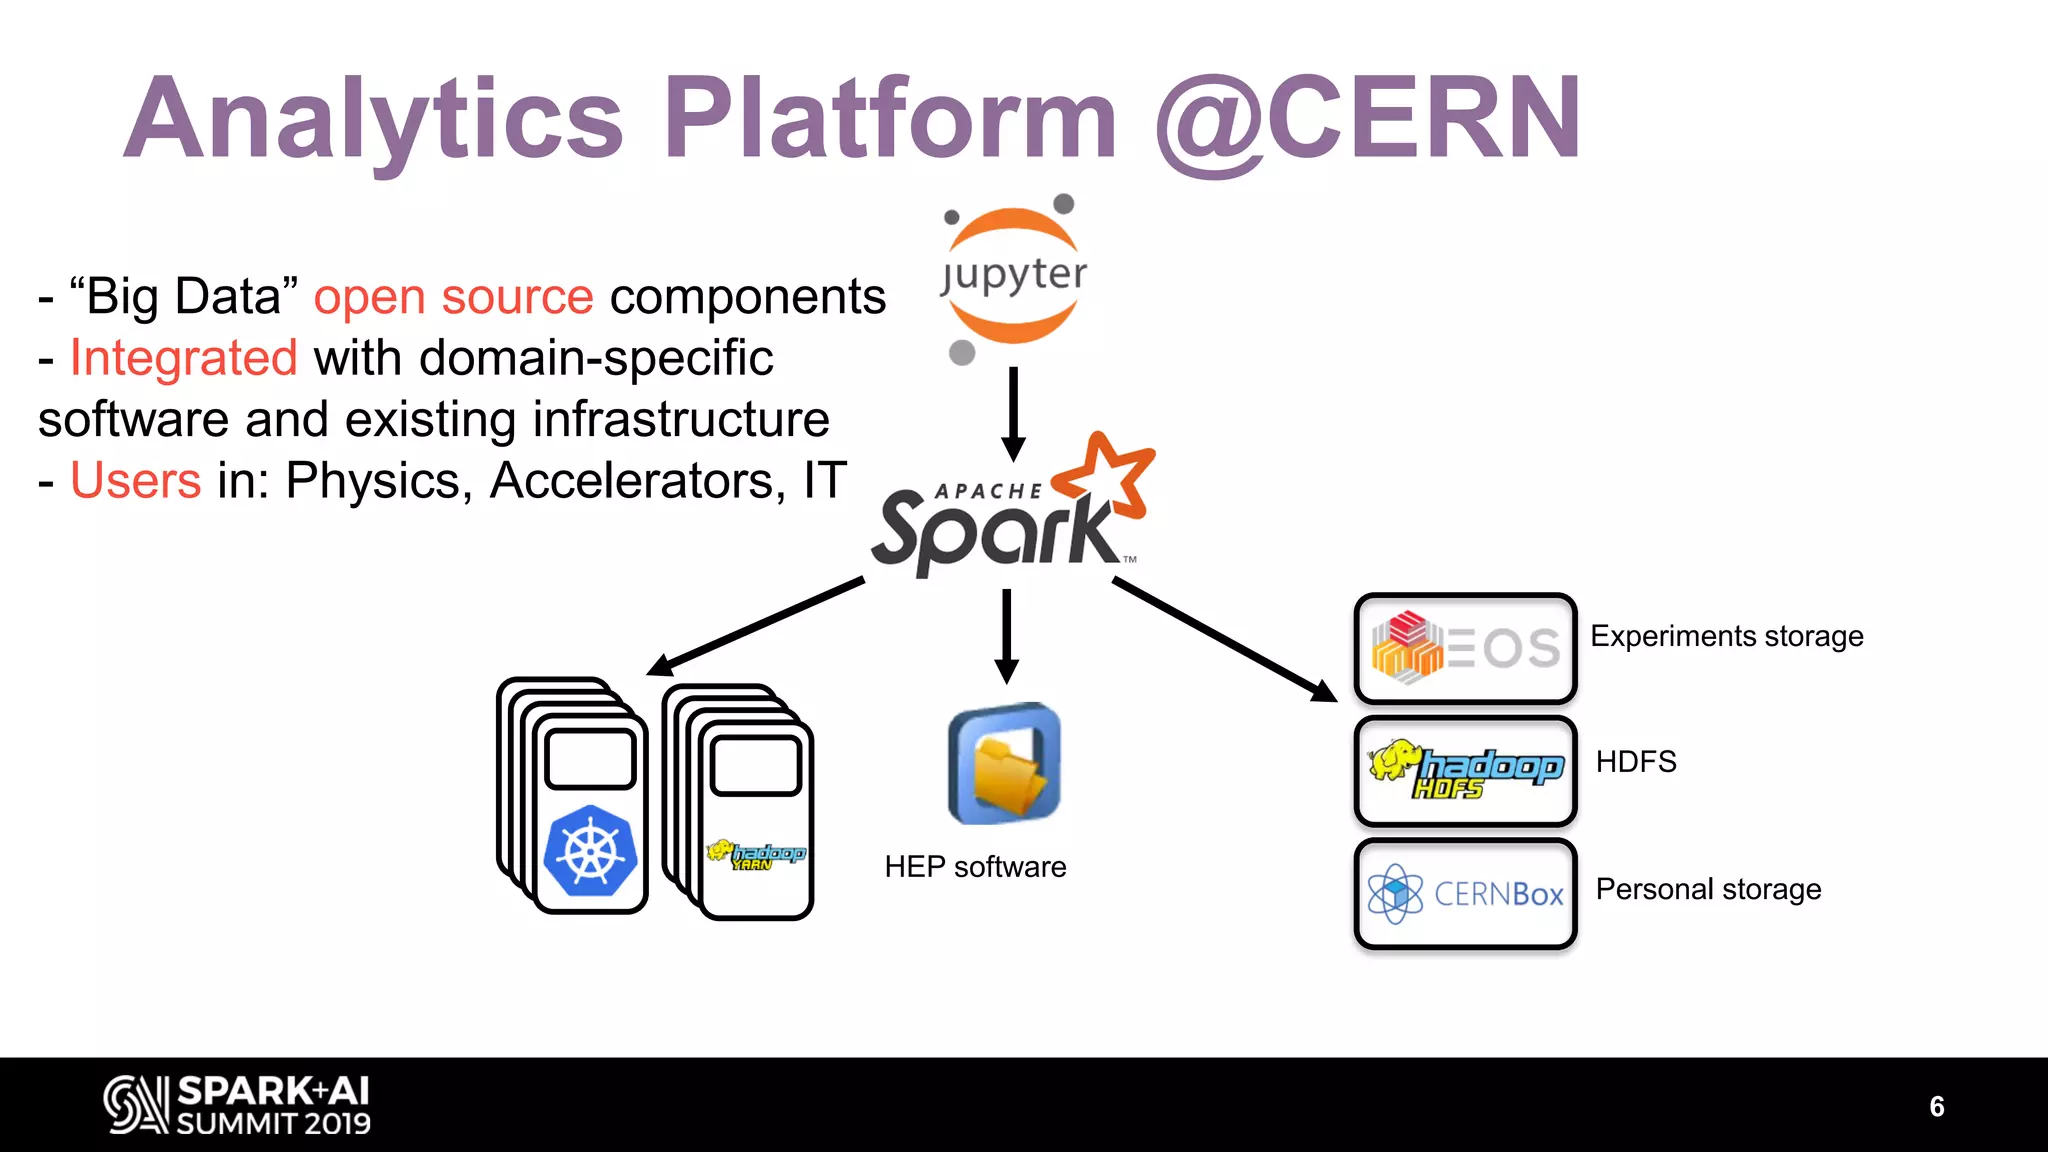
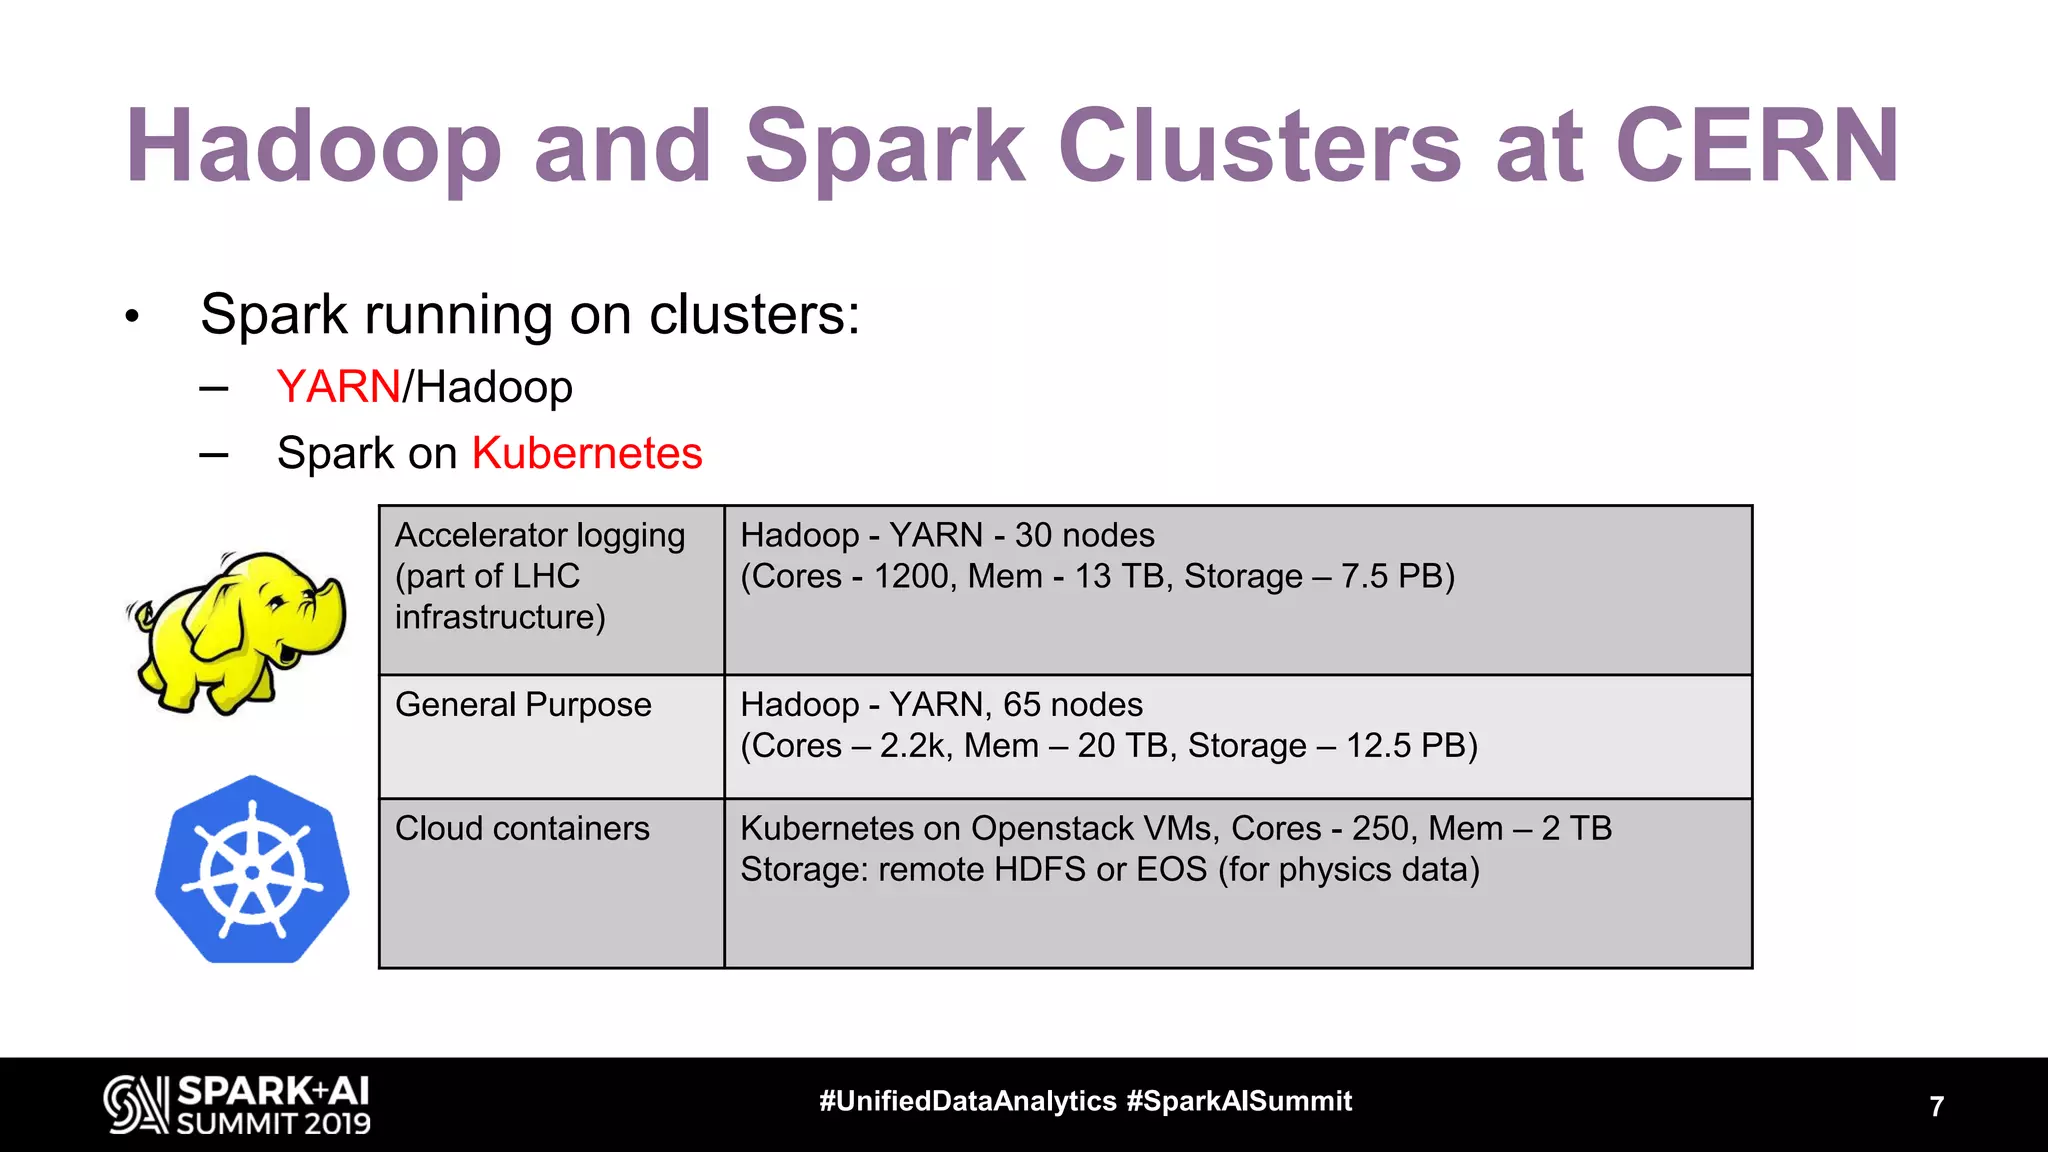
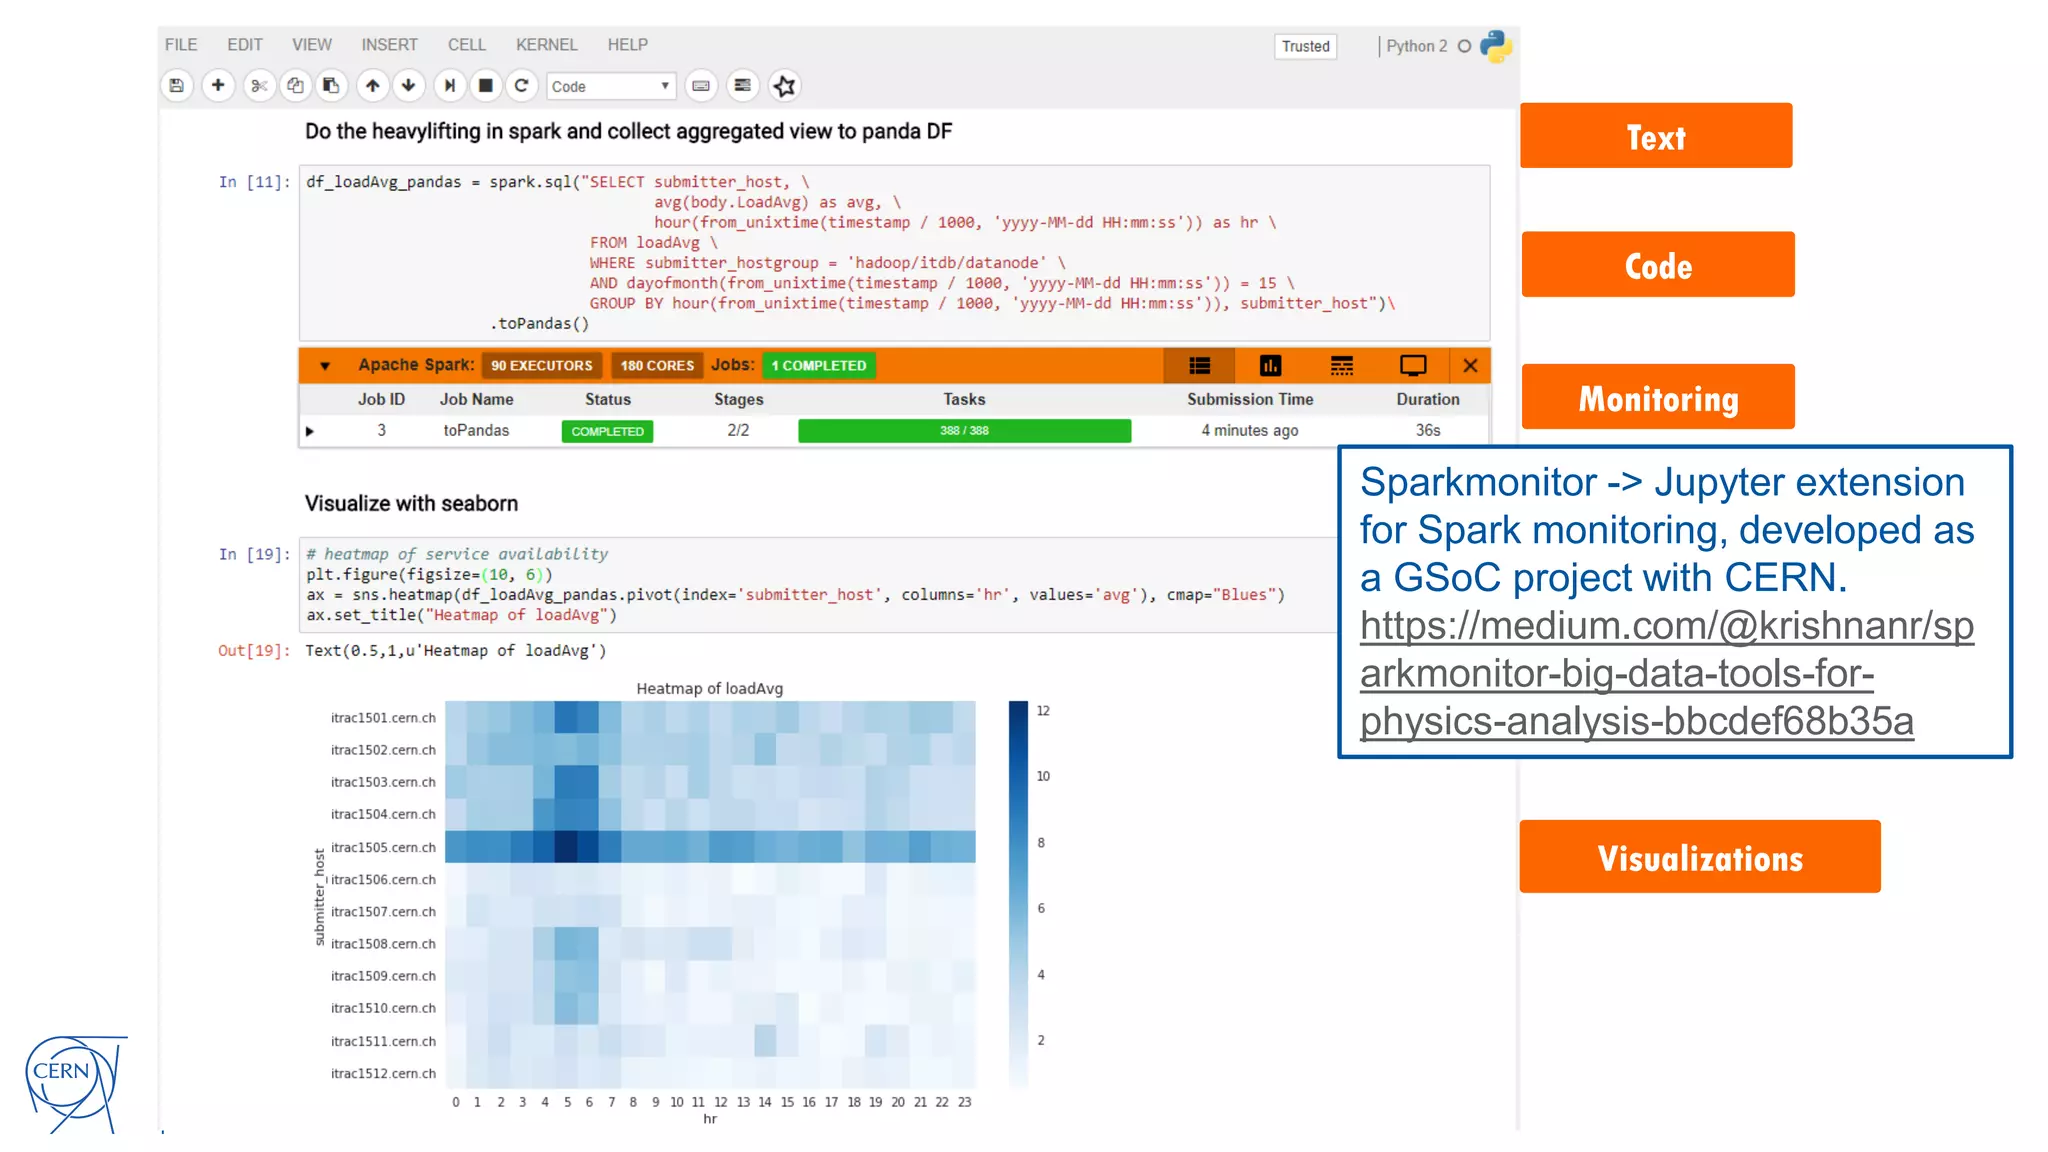
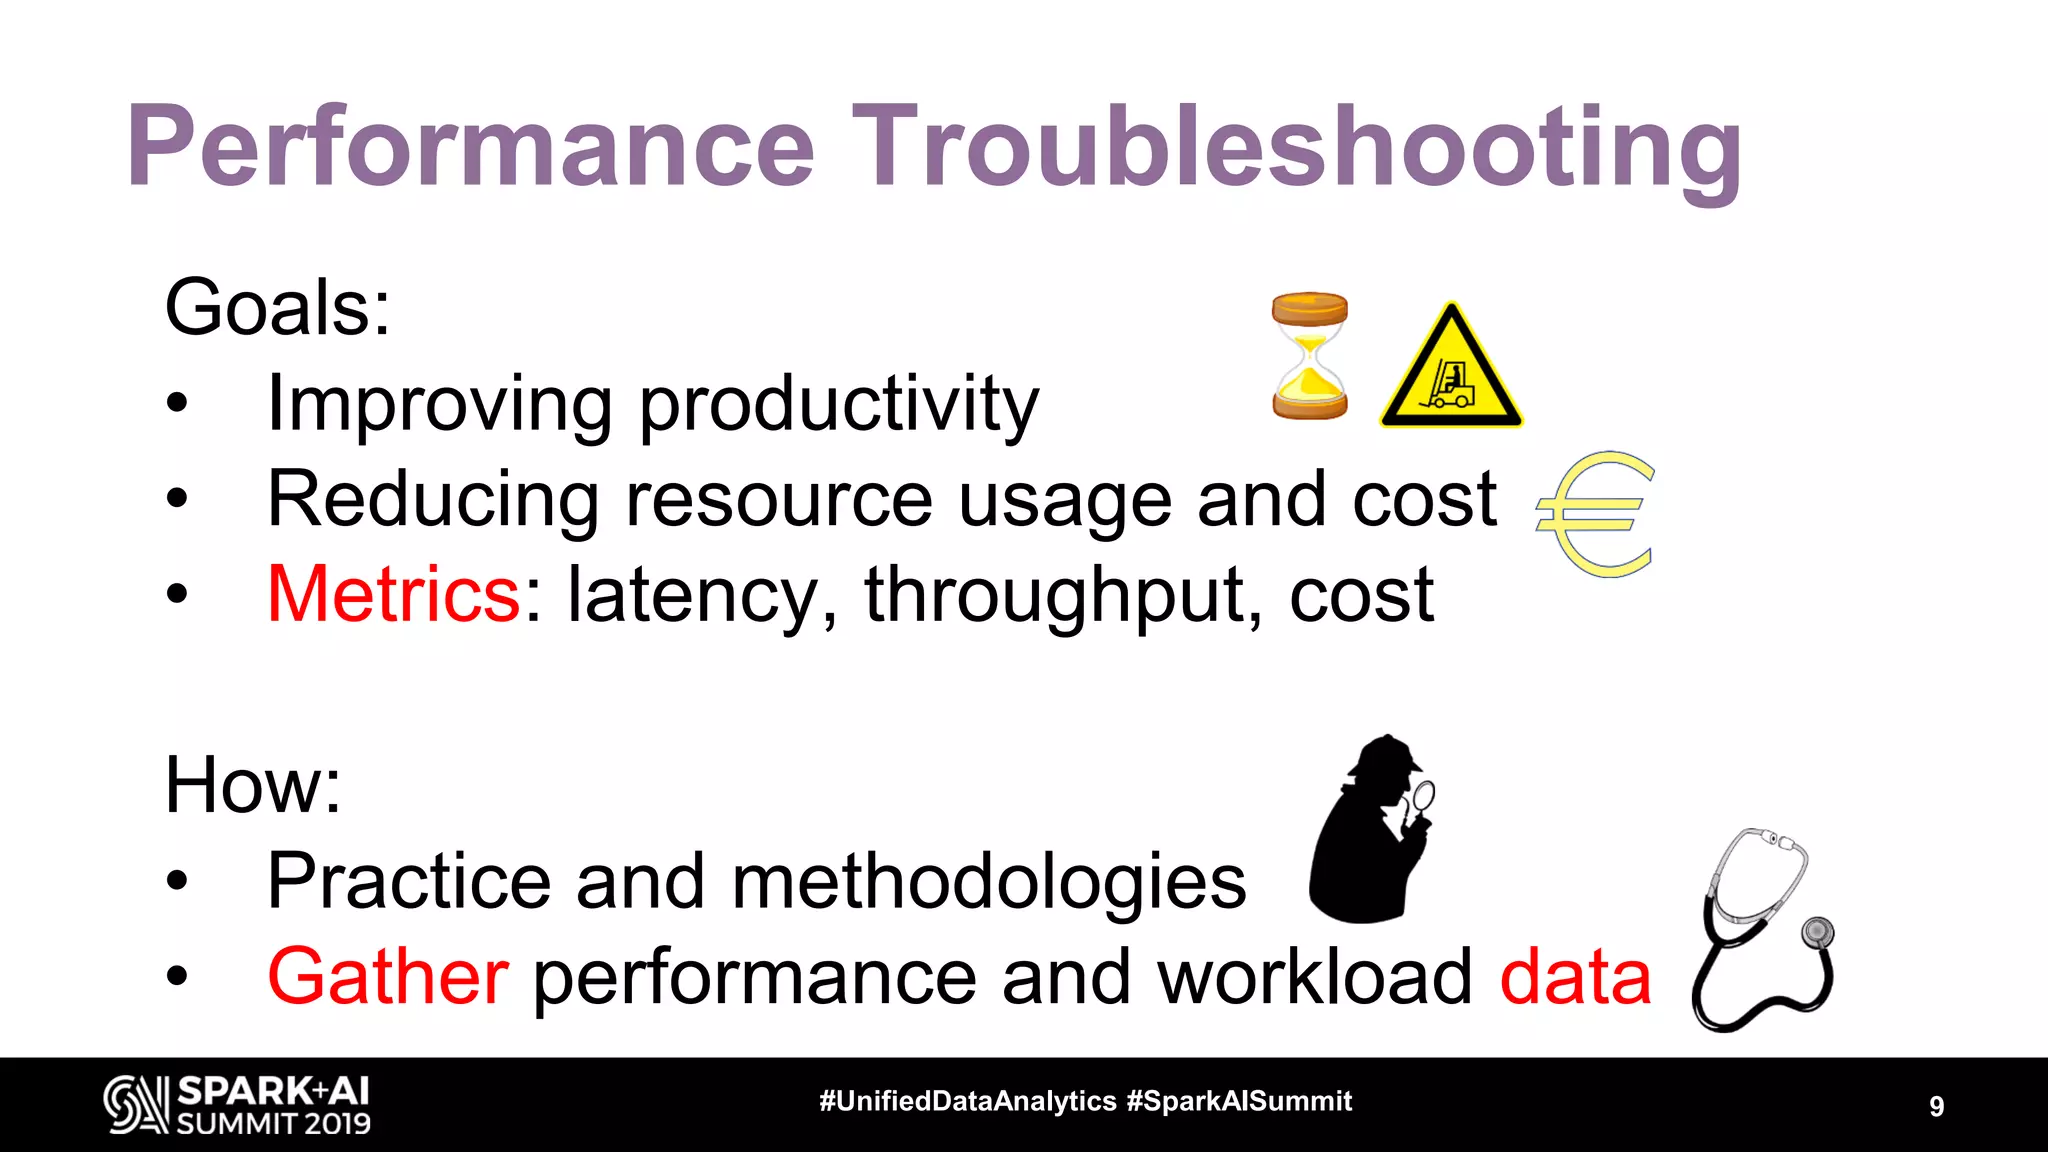
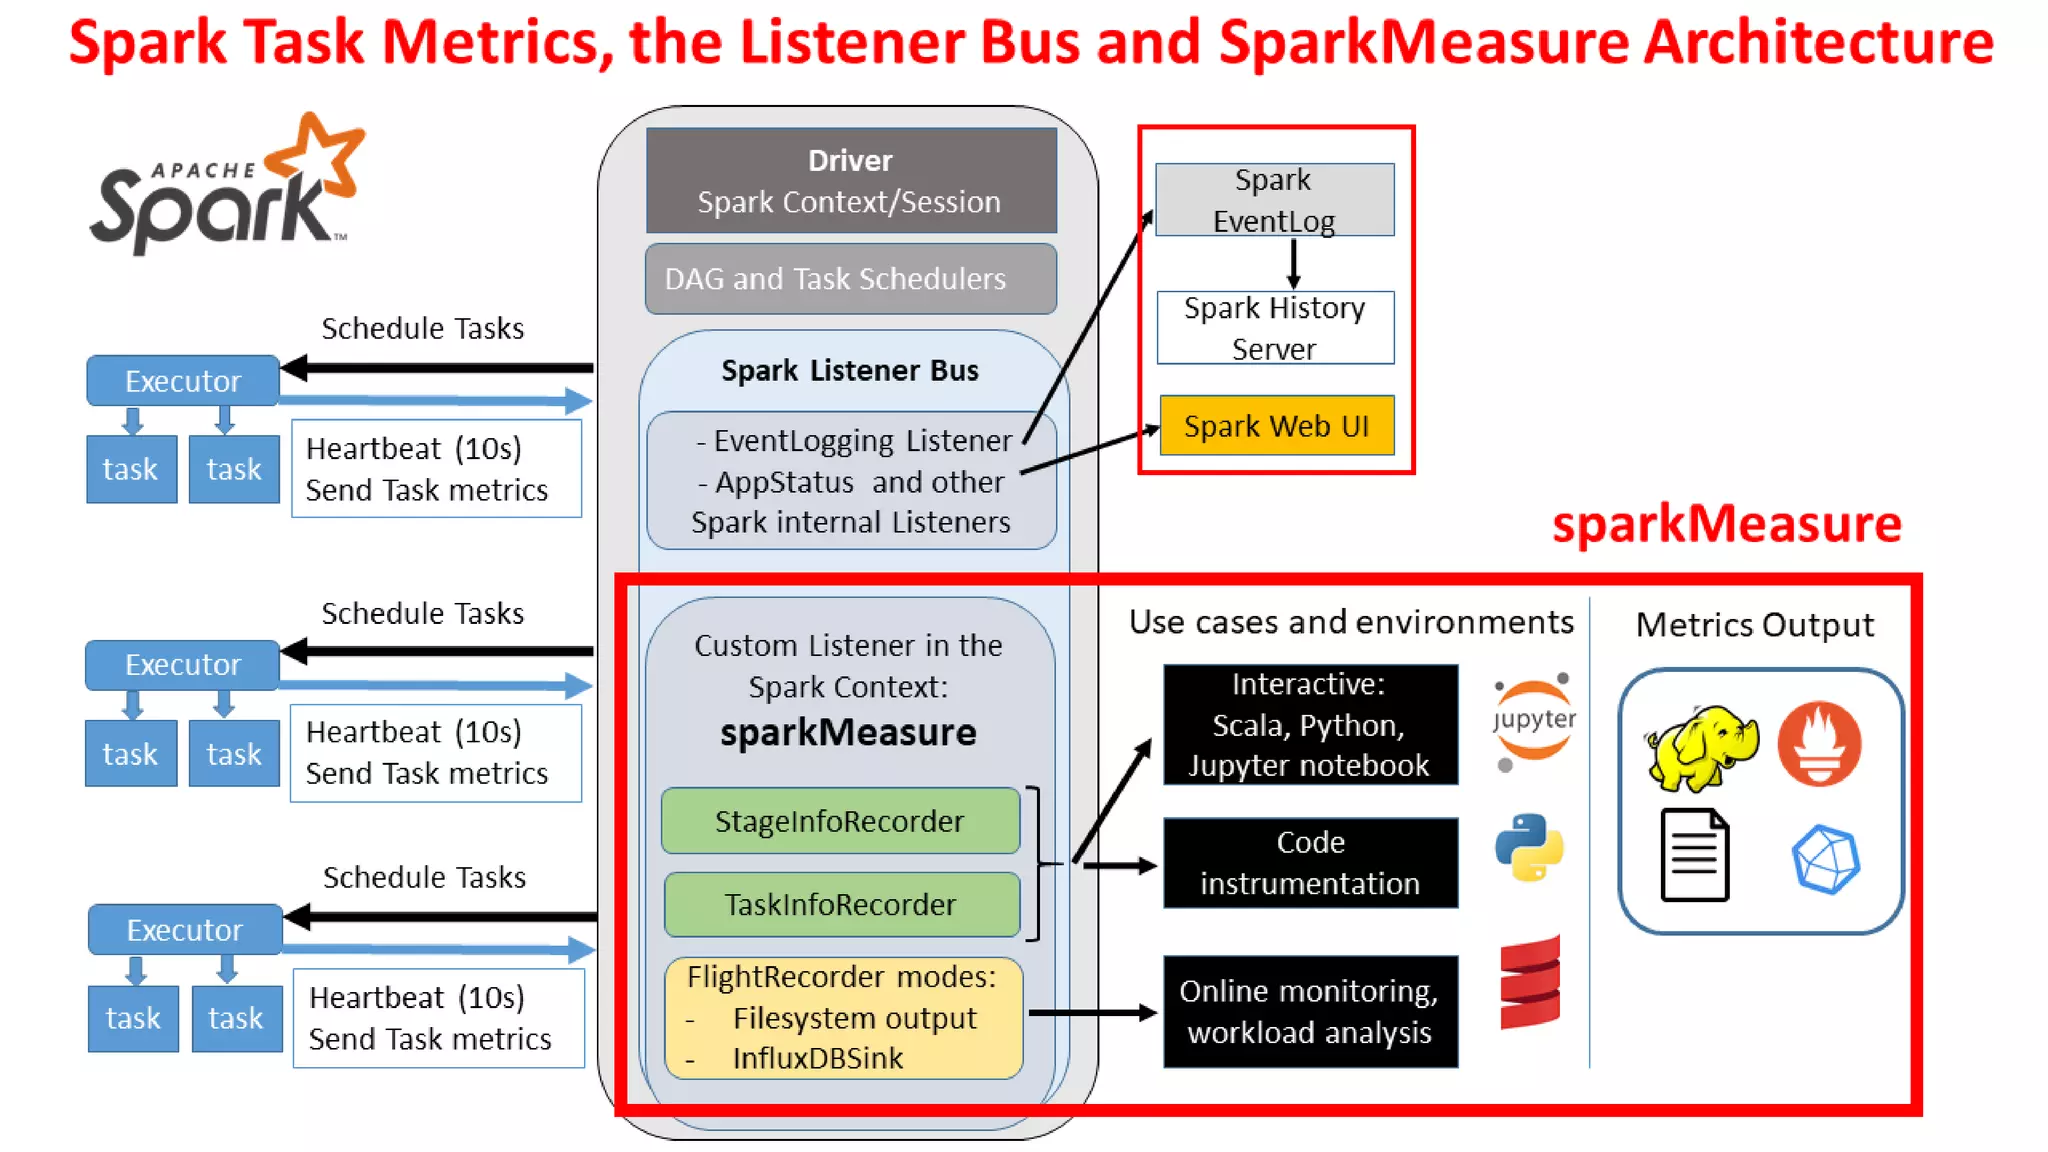
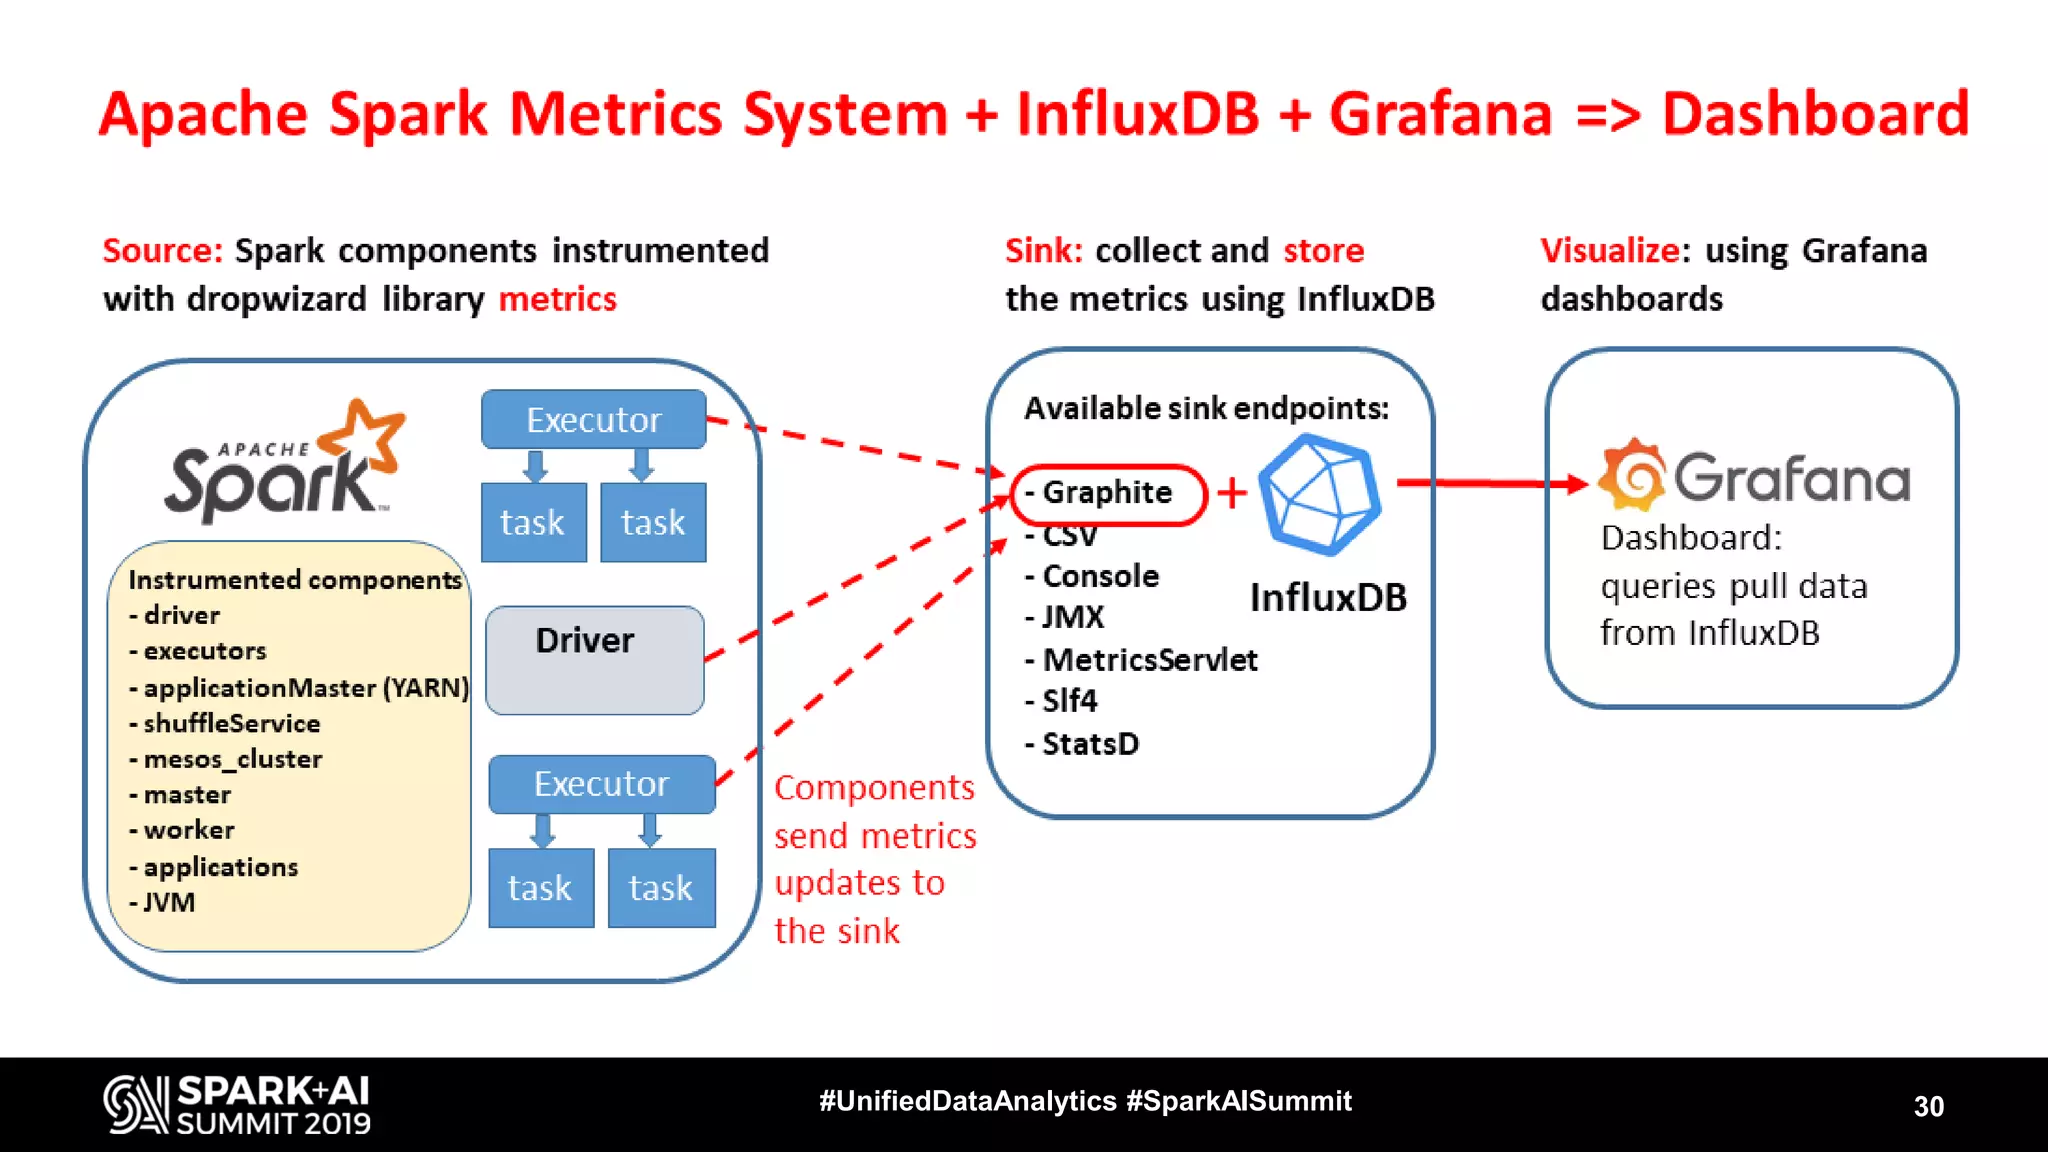
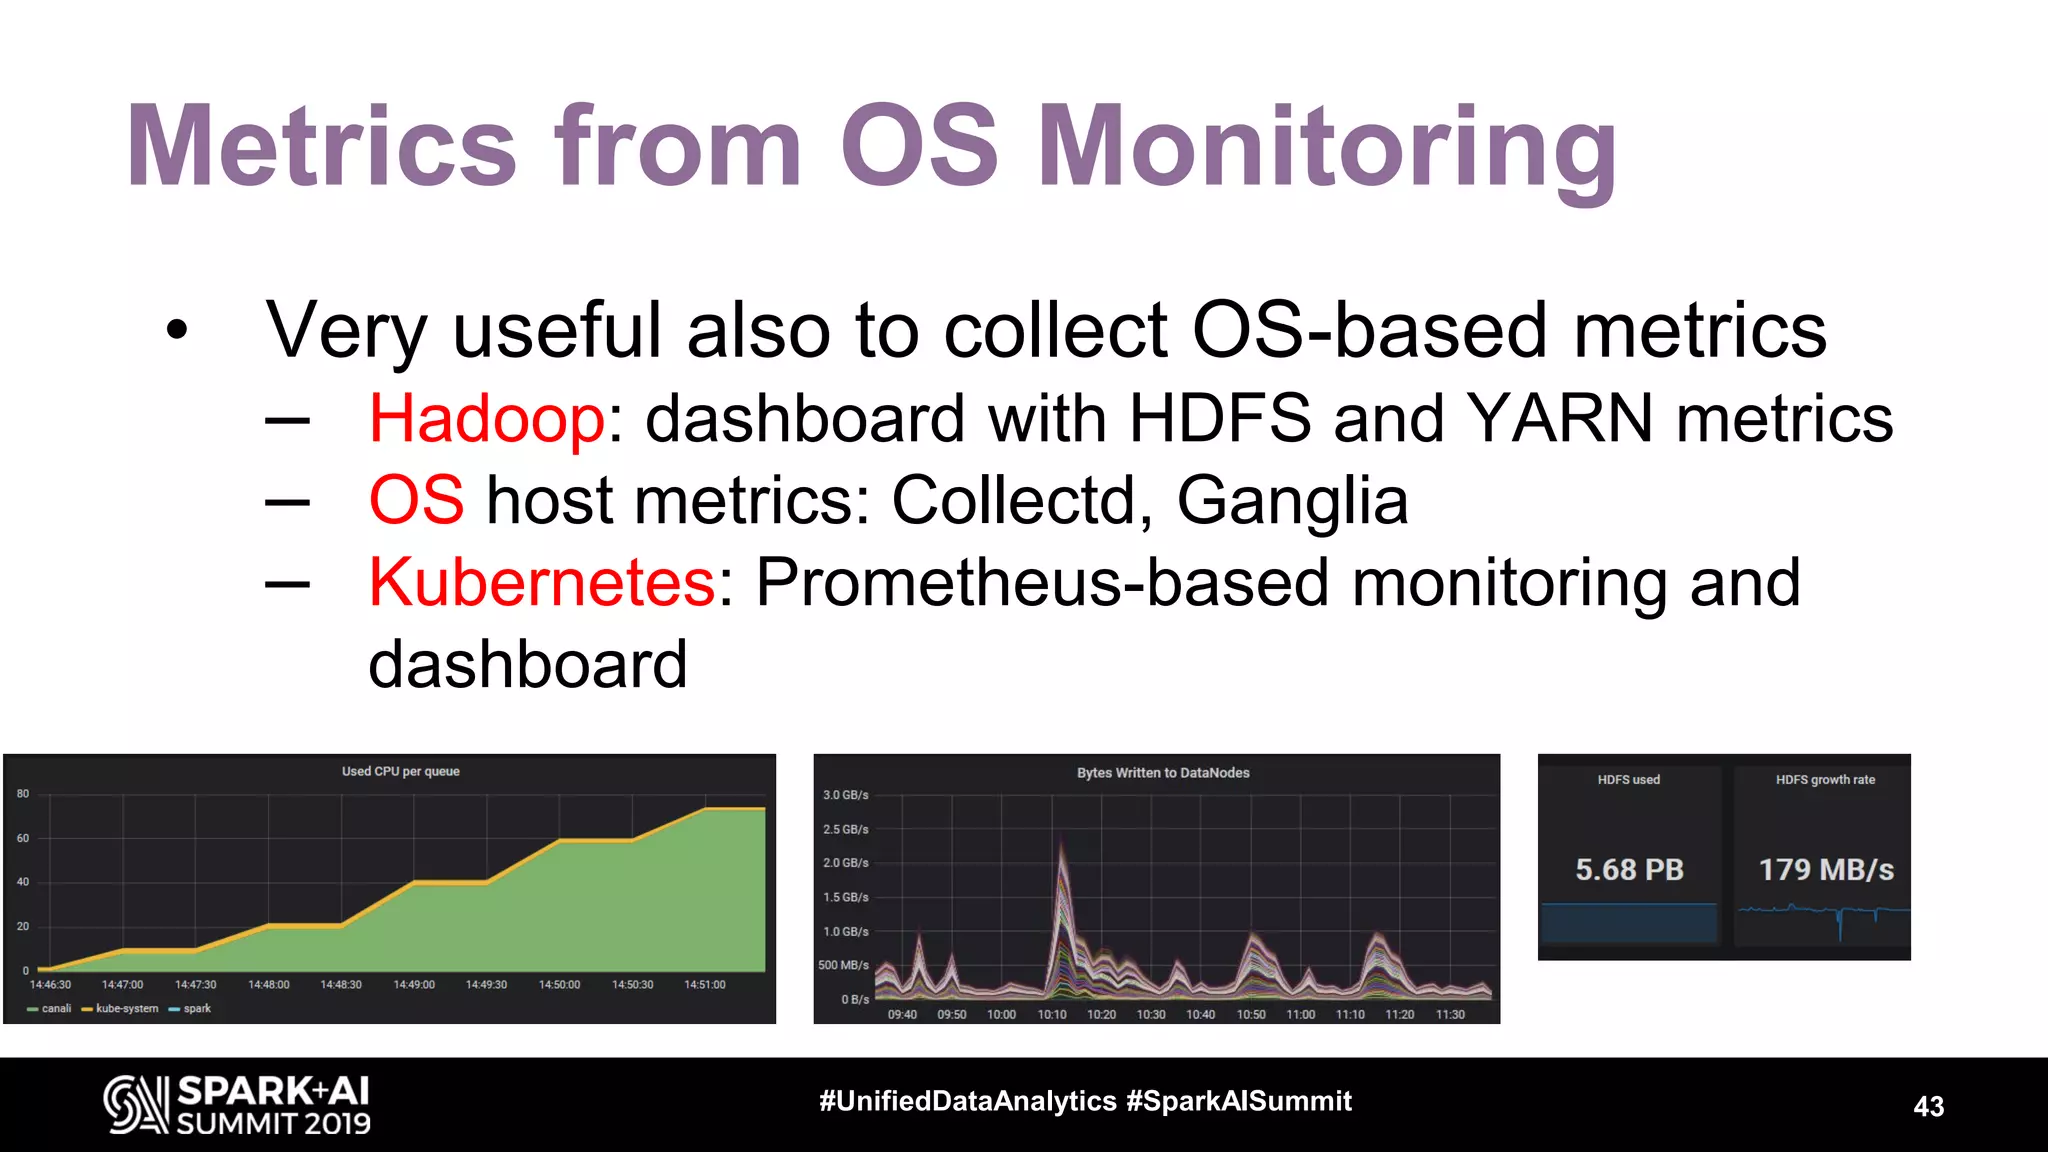


Luca Canali, a data engineer at CERN, presented on performance troubleshooting using Apache Spark metrics at the UnifiedDataAnalytics #SparkAISummit. CERN runs large Hadoop and Spark clusters to process over 300 PB of data from the Large Hadron Collider experiments. Luca discussed how to gather, analyze, and visualize Spark metrics to identify bottlenecks and improve performance.