Downloaded 63 times


![PROMQL ● Powerful query language to get metrics on kubernetes cluster along with spark clusters. ● What are gauges and counters? Gauges: Latest value of metric Counters: Total number of event occurrences. Might be suffix “*total”. You can use this format to get the last minute prom_metric_total[1m] #Radanalytics](https://image.slidesharecdn.com/3dianefeddemazakhassan-180614014240/75/Scalable-Monitoring-Using-Prometheus-with-Apache-Spark-Clusters-with-Diane-Feddema-and-Zak-Hassan-16-2048.jpg)


![Example: Code for non-cached run rdd1 = RandomRDDs.normalVectorRDD(spark, nRow, nCol, numPartitions, seed) seed = 3 rdd2 = RandomRDDs.normalVectorRDD(spark, nRow, nCol, numPartitions, seed) sc = spark.sparkContext # convert each tuple in the rdd to a row randomNumberRdd1 = rdd1.map(lambda x: Row(A=float(x[0]), B=float(x[1]), C=float(x[2]), D=float(x[3]))) randomNumberRdd2 = rdd2.map(lambda x: Row(E=float(x[0]), F=float(x[1]), G=float(x[2]), H=float(x[3]))) # create dataframe from rdd schemaRandomNumberDF1 = spark.createDataFrame(randomNumberRdd1) schemaRandomNumberDF2 = spark.createDataFrame(randomNumberRdd2) cross_df = schemaRandomNumberDF1.crossJoin(schemaRandomNumberDF2) # aggregate results = schemaRandomNumberDF1.groupBy("A").agg(func.max("B"),func.sum("C")) results.show(n=100) print "----------Count in cross-join--------------- {0}".format(cross_df.count()) #Radanalytics](https://image.slidesharecdn.com/3dianefeddemazakhassan-180614014240/75/Scalable-Monitoring-Using-Prometheus-with-Apache-Spark-Clusters-with-Diane-Feddema-and-Zak-Hassan-25-2048.jpg)
![Example: Code for cached run rdd1 = RandomRDDs.normalVectorRDD(spark, nRow, nCol, numPartitions, seed) seed = 3 rdd2 = RandomRDDs.normalVectorRDD(spark, nRow, nCol, numPartitions, seed) sc = spark.sparkContext # convert each tuple in the rdd to a row randomNumberRdd1 = rdd1.map(lambda x: Row(A=float(x[0]), B=float(x[1]), C=float(x[2]), D=float(x[3]))) randomNumberRdd2 = rdd2.map(lambda x: Row(E=float(x[0]), F=float(x[1]), G=float(x[2]), H=float(x[3]))) # create dataframe from rdd schemaRandomNumberDF1 = spark.createDataFrame(randomNumberRdd1) schemaRandomNumberDF2 = spark.createDataFrame(randomNumberRdd2) # cache the dataframe schemaRandomNumberDF1.cache() schemaRandomNumberDF2.cache() cross_df = schemaRandomNumberDF1.crossJoin(schemaRandomNumberDF2) # aggregate results = schemaRandomNumberDF1.groupBy("A").agg(func.max("B"),func.sum("C")) results.show(n=100) print "----------Count in cross-join--------------- {0}".format(cross_df.count()) #Radanalytics](https://image.slidesharecdn.com/3dianefeddemazakhassan-180614014240/75/Scalable-Monitoring-Using-Prometheus-with-Apache-Spark-Clusters-with-Diane-Feddema-and-Zak-Hassan-26-2048.jpg)
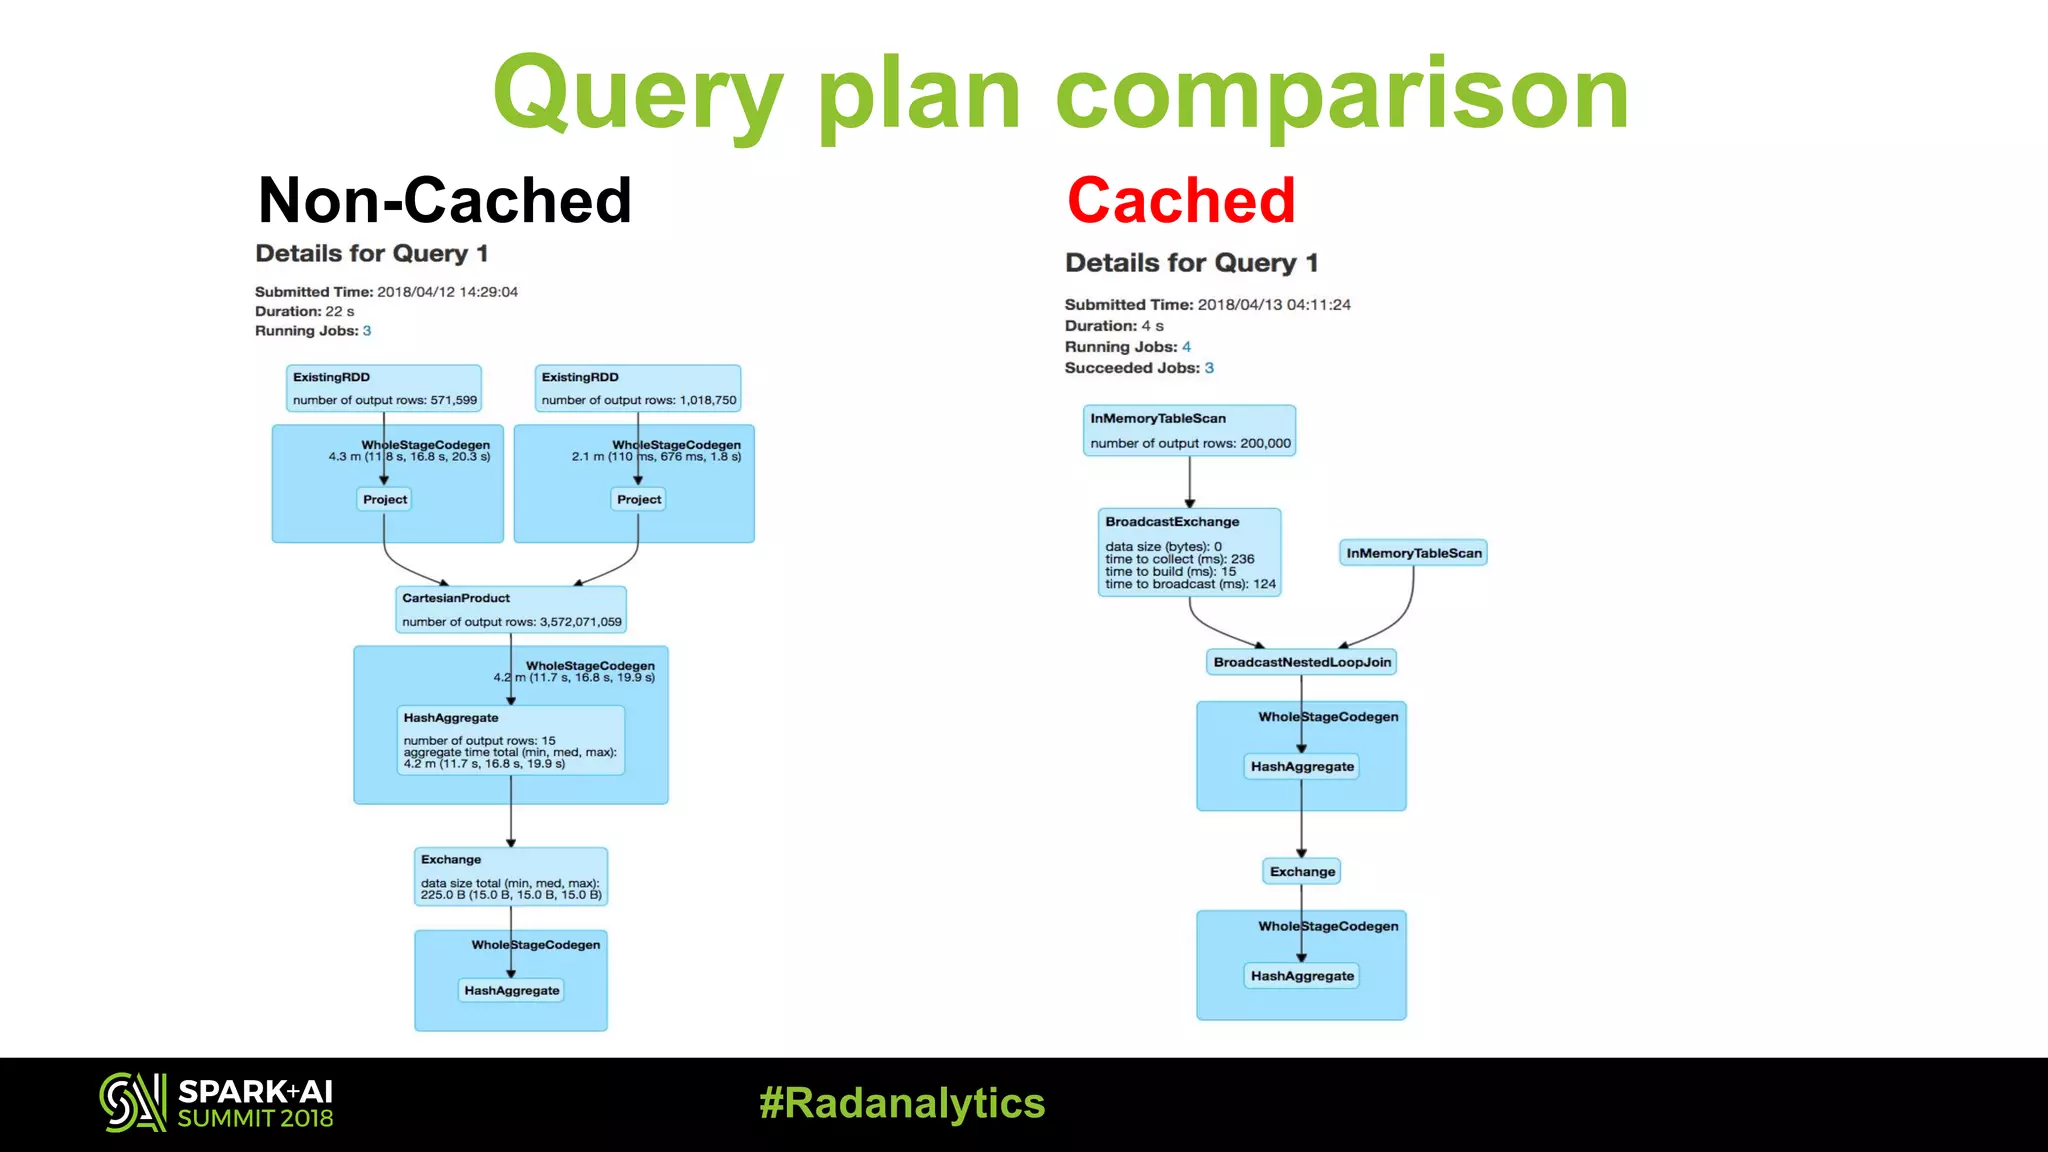
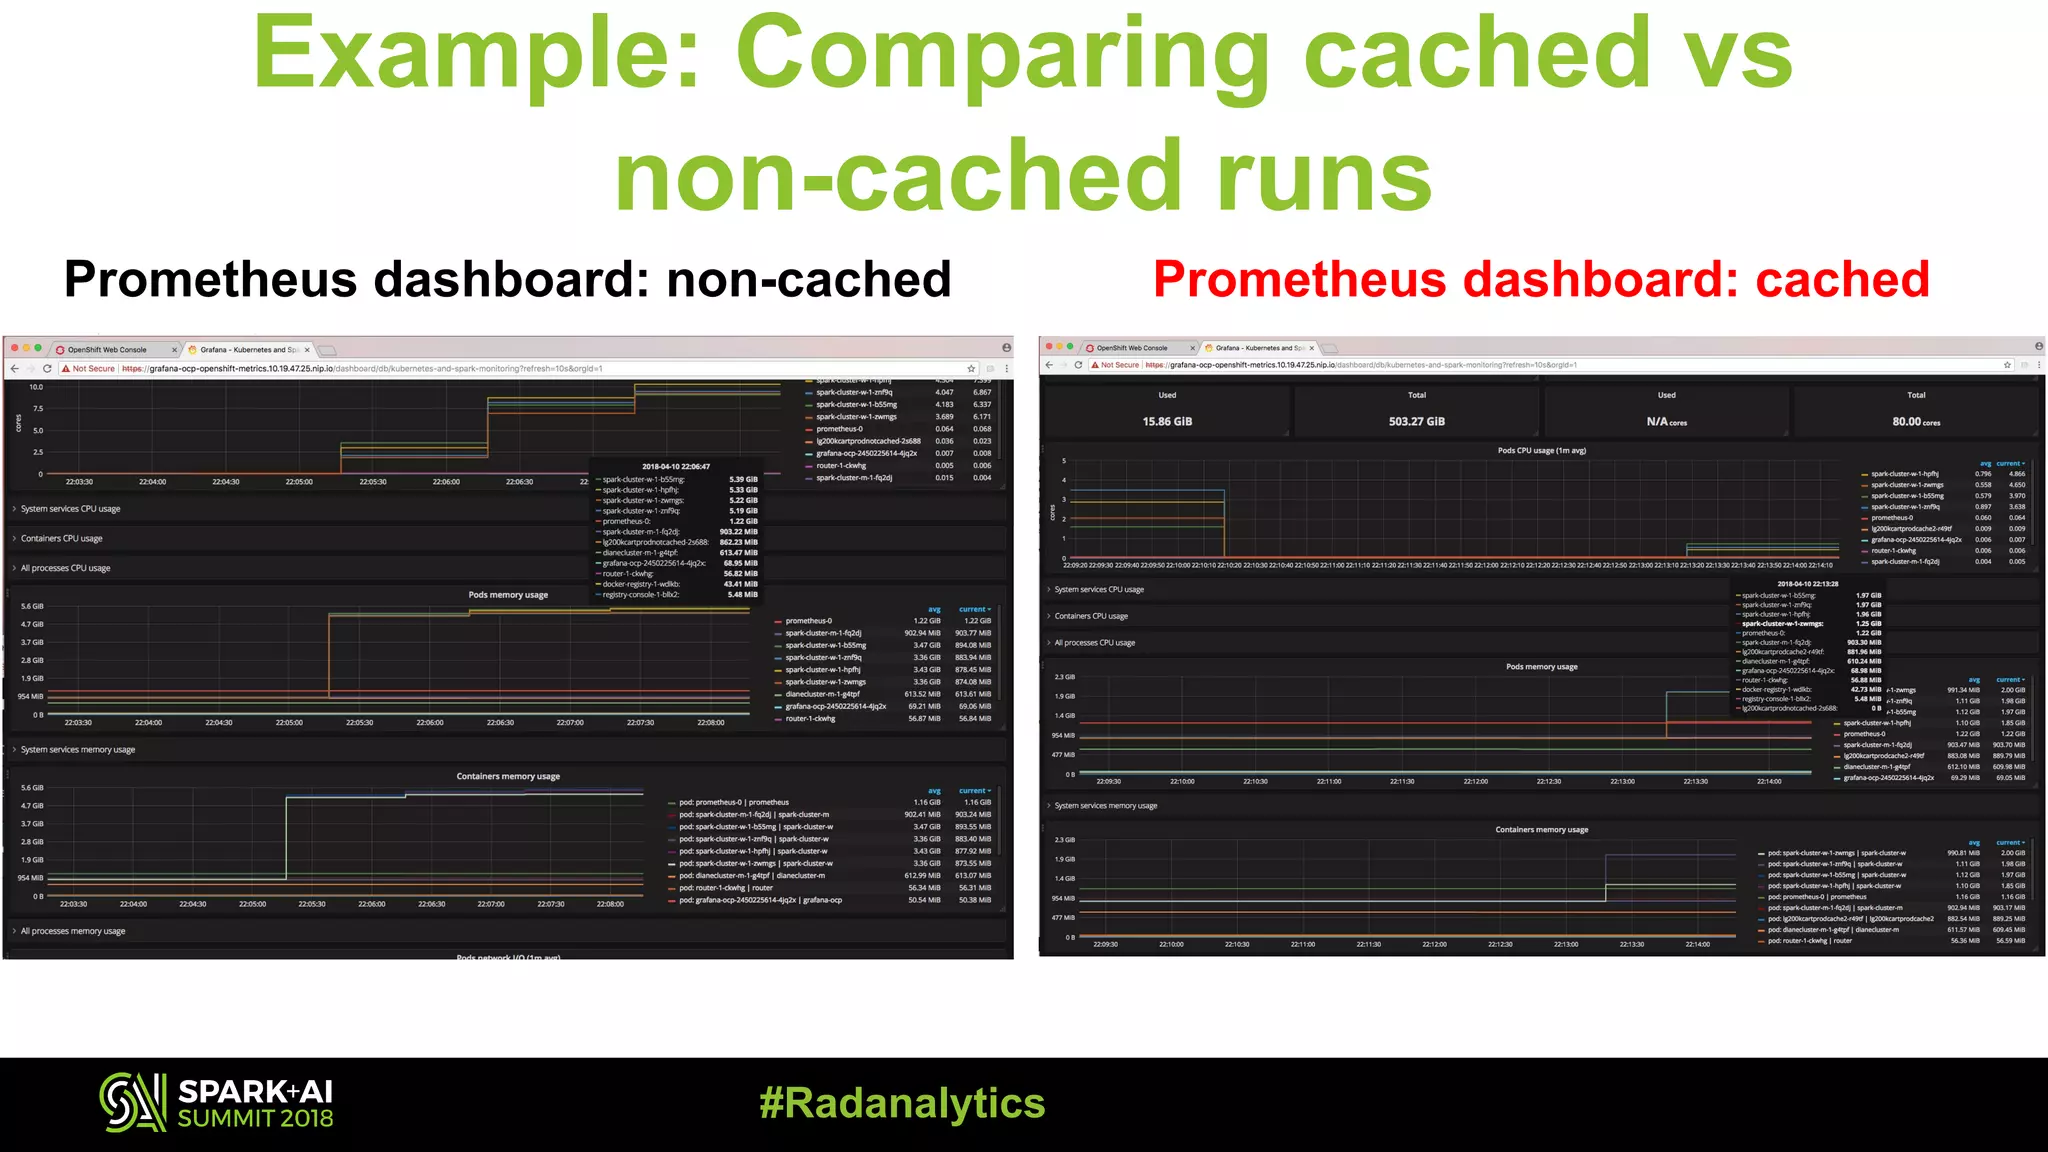
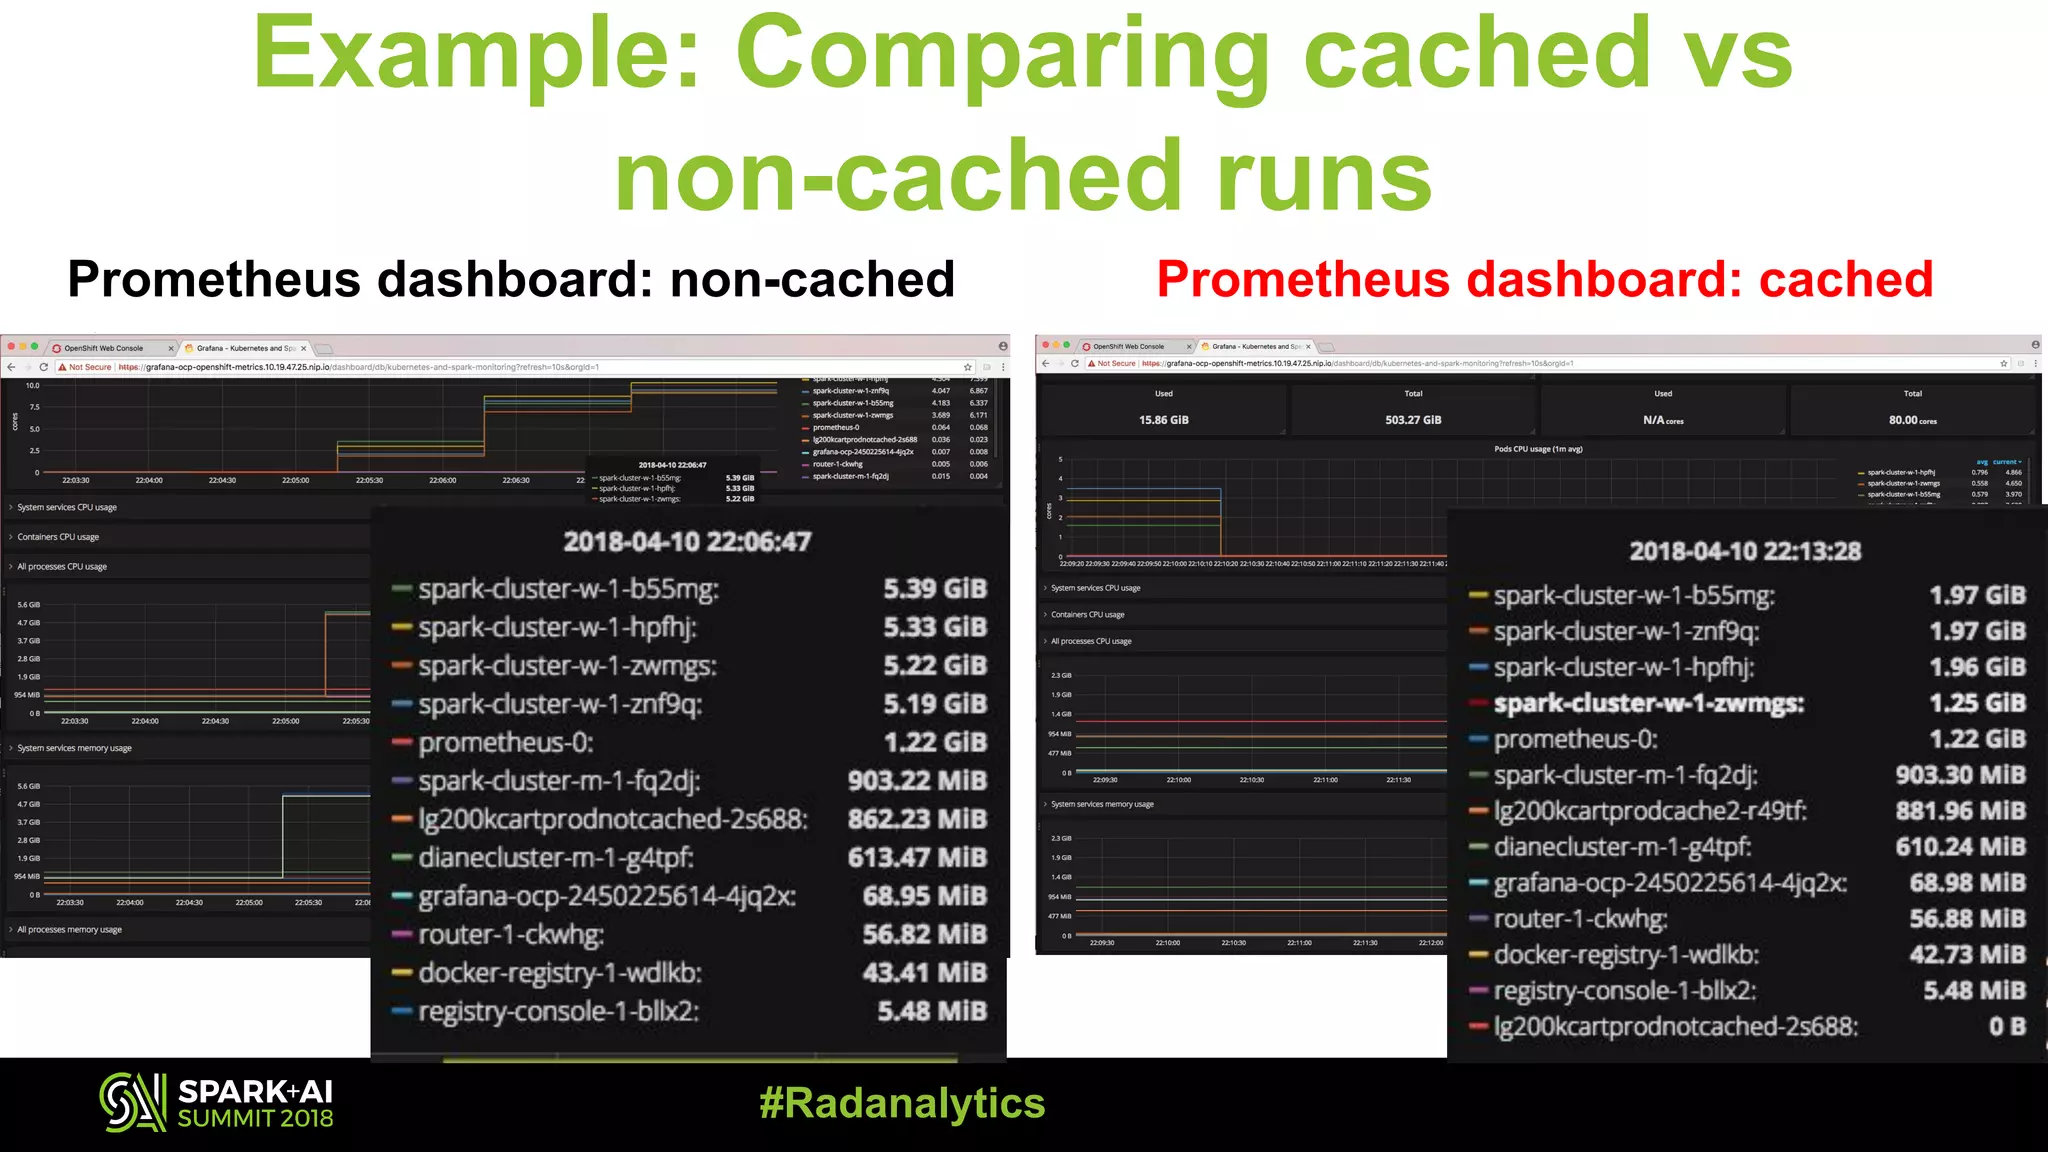
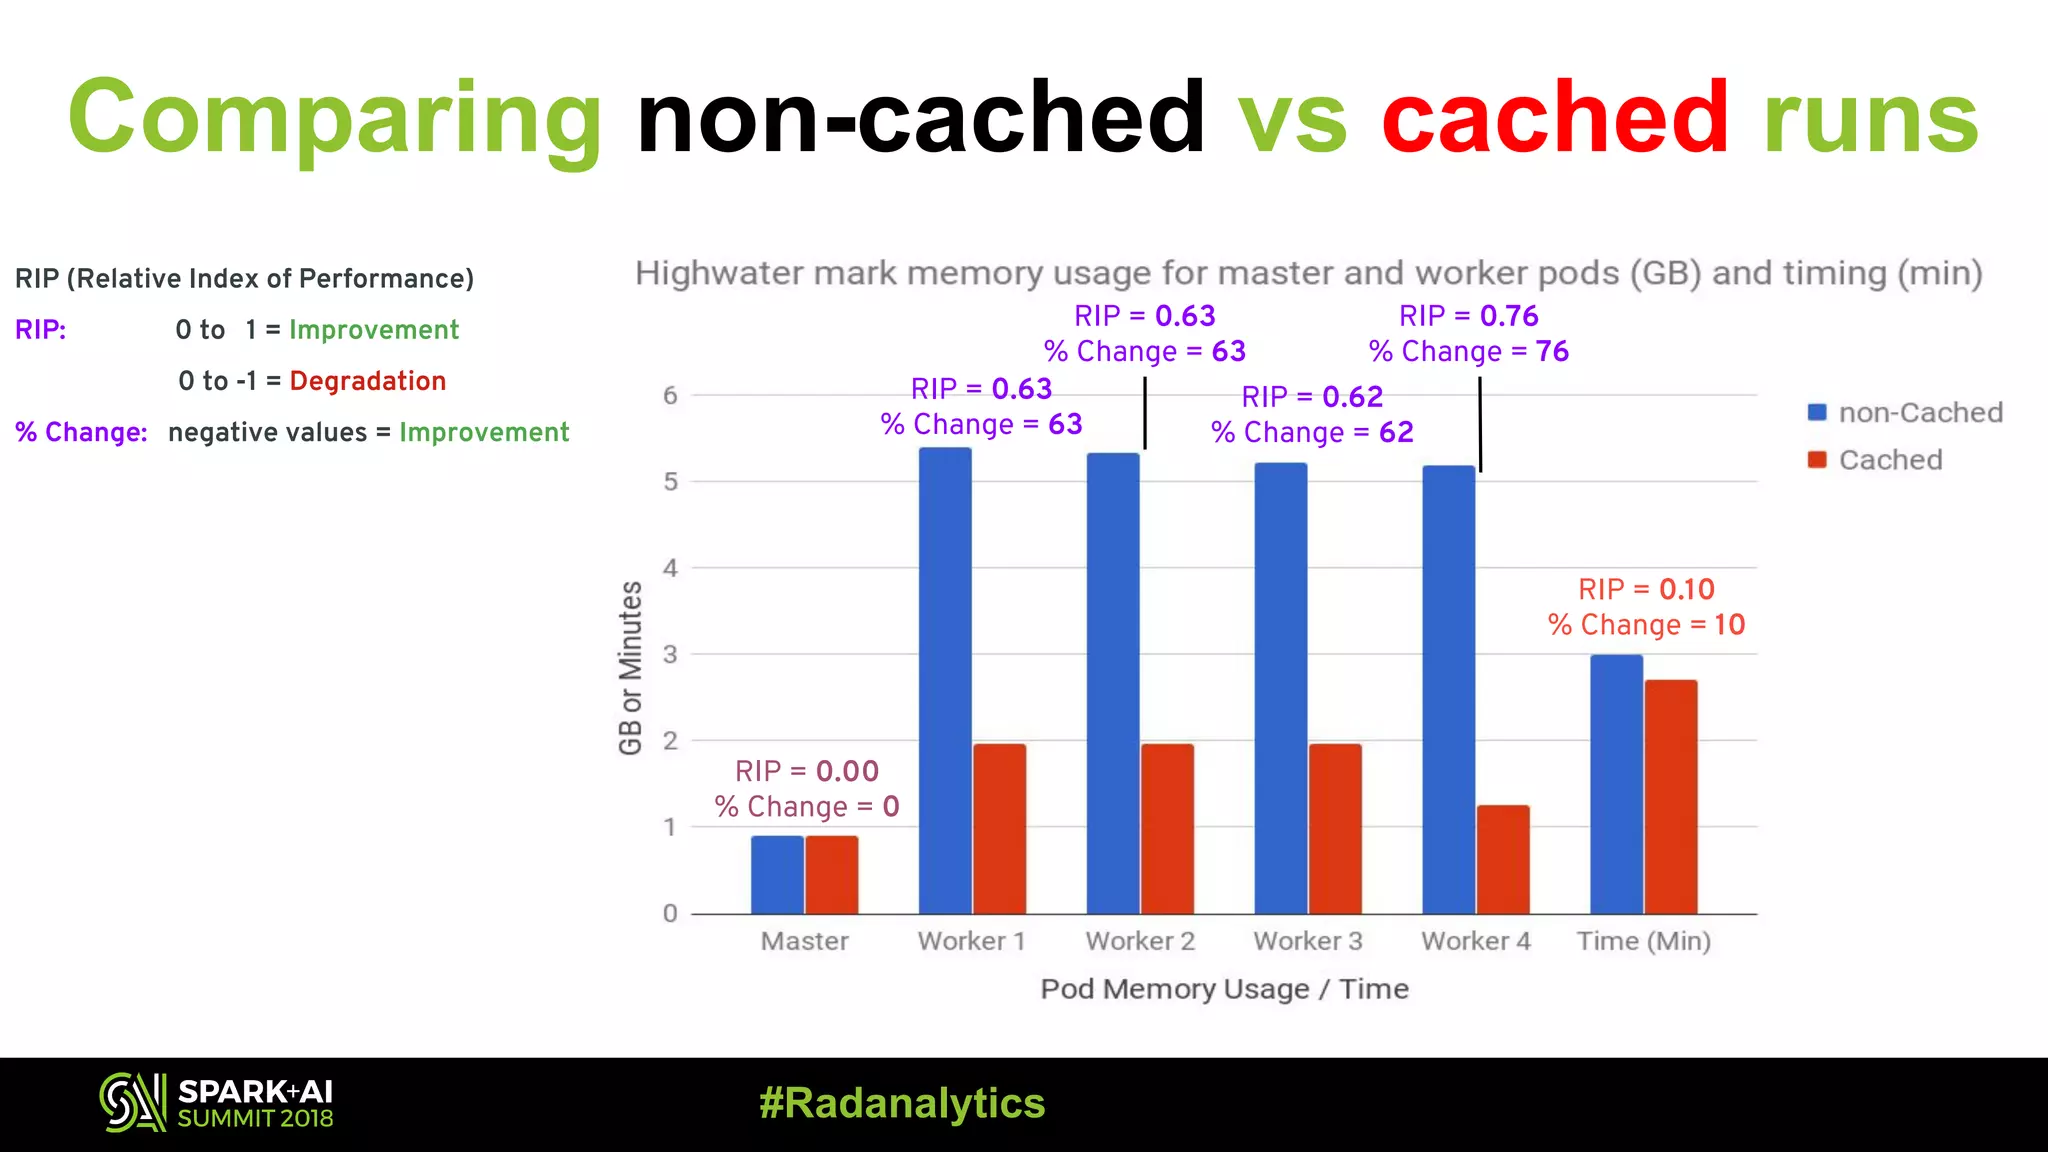

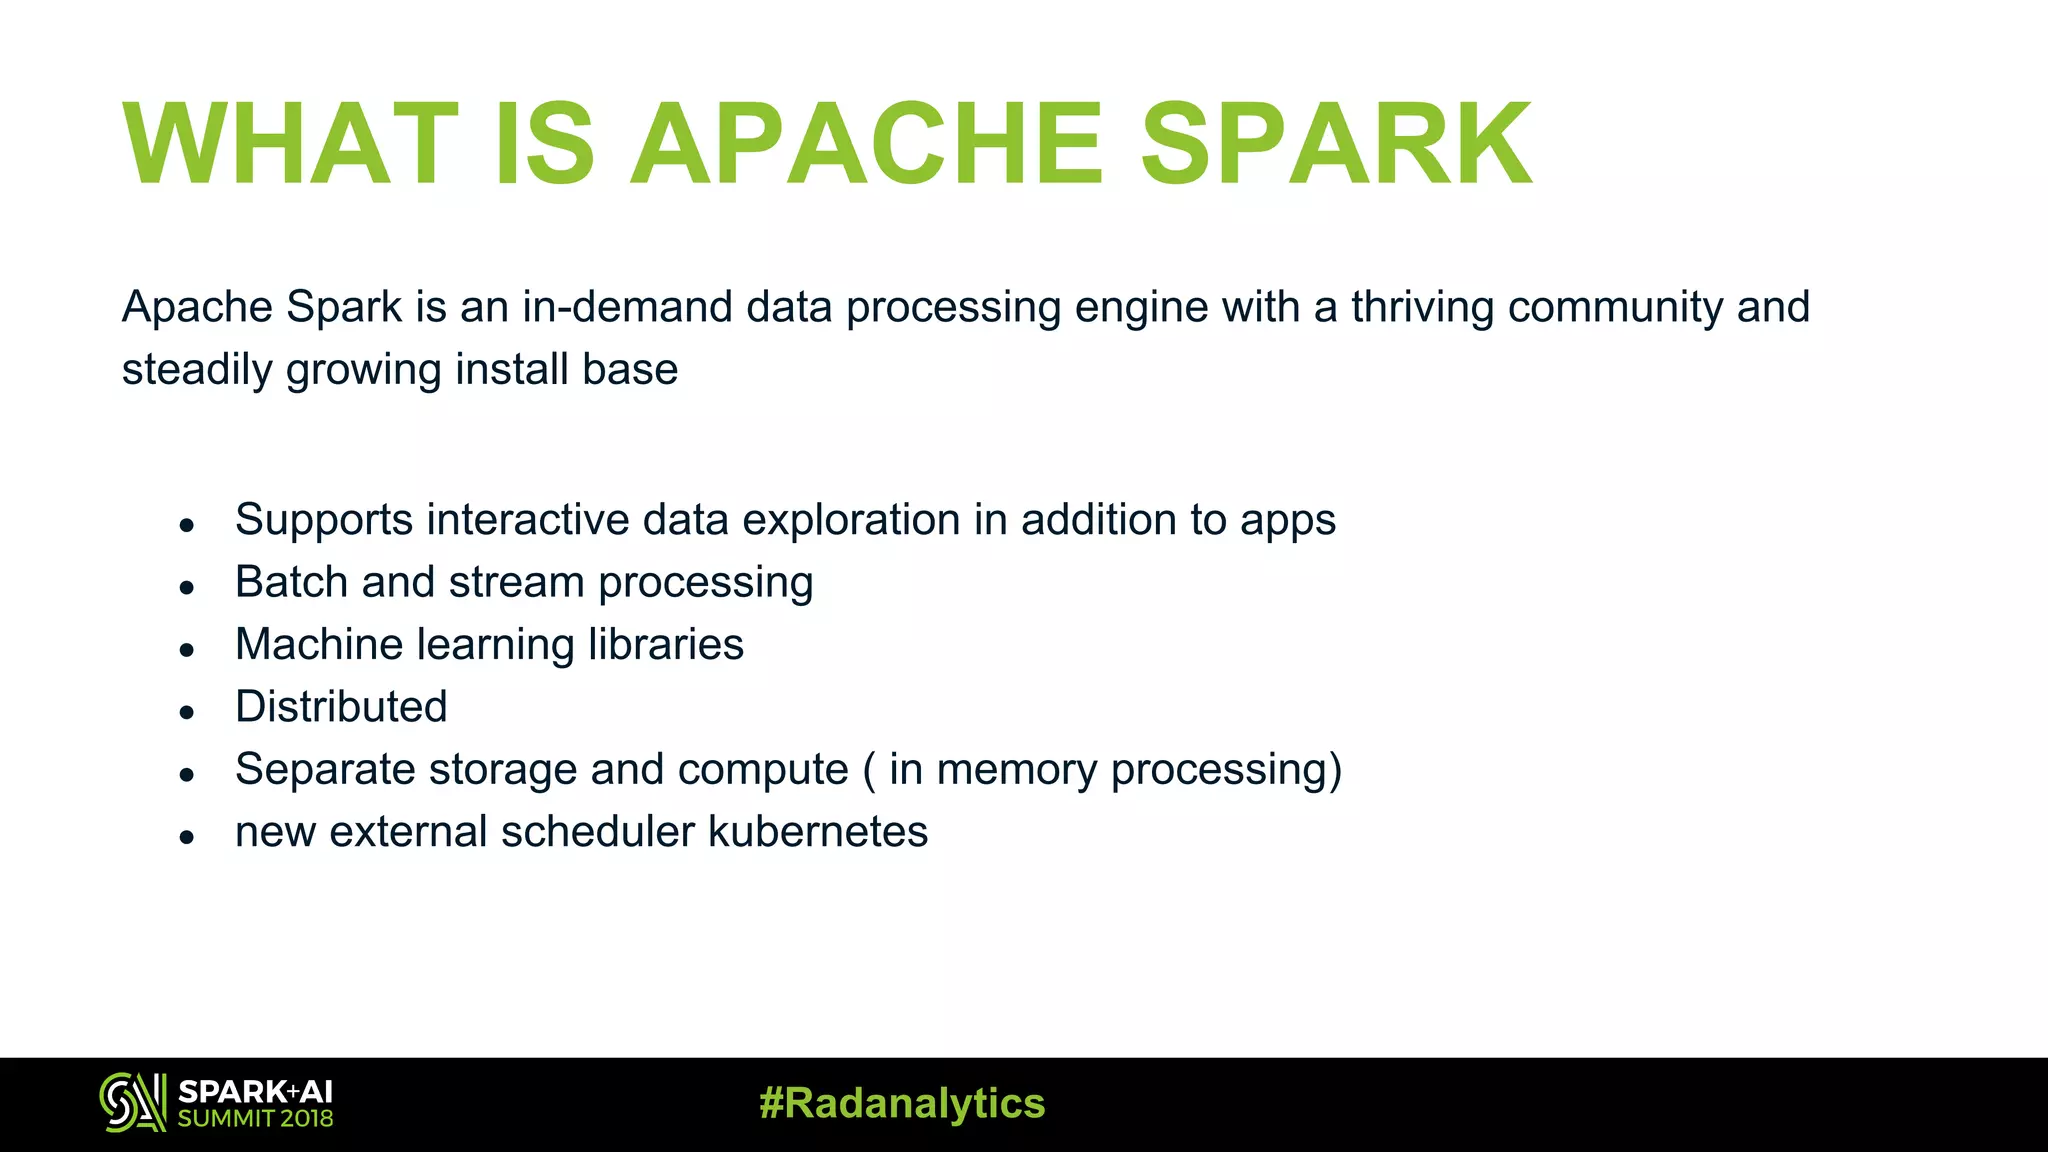
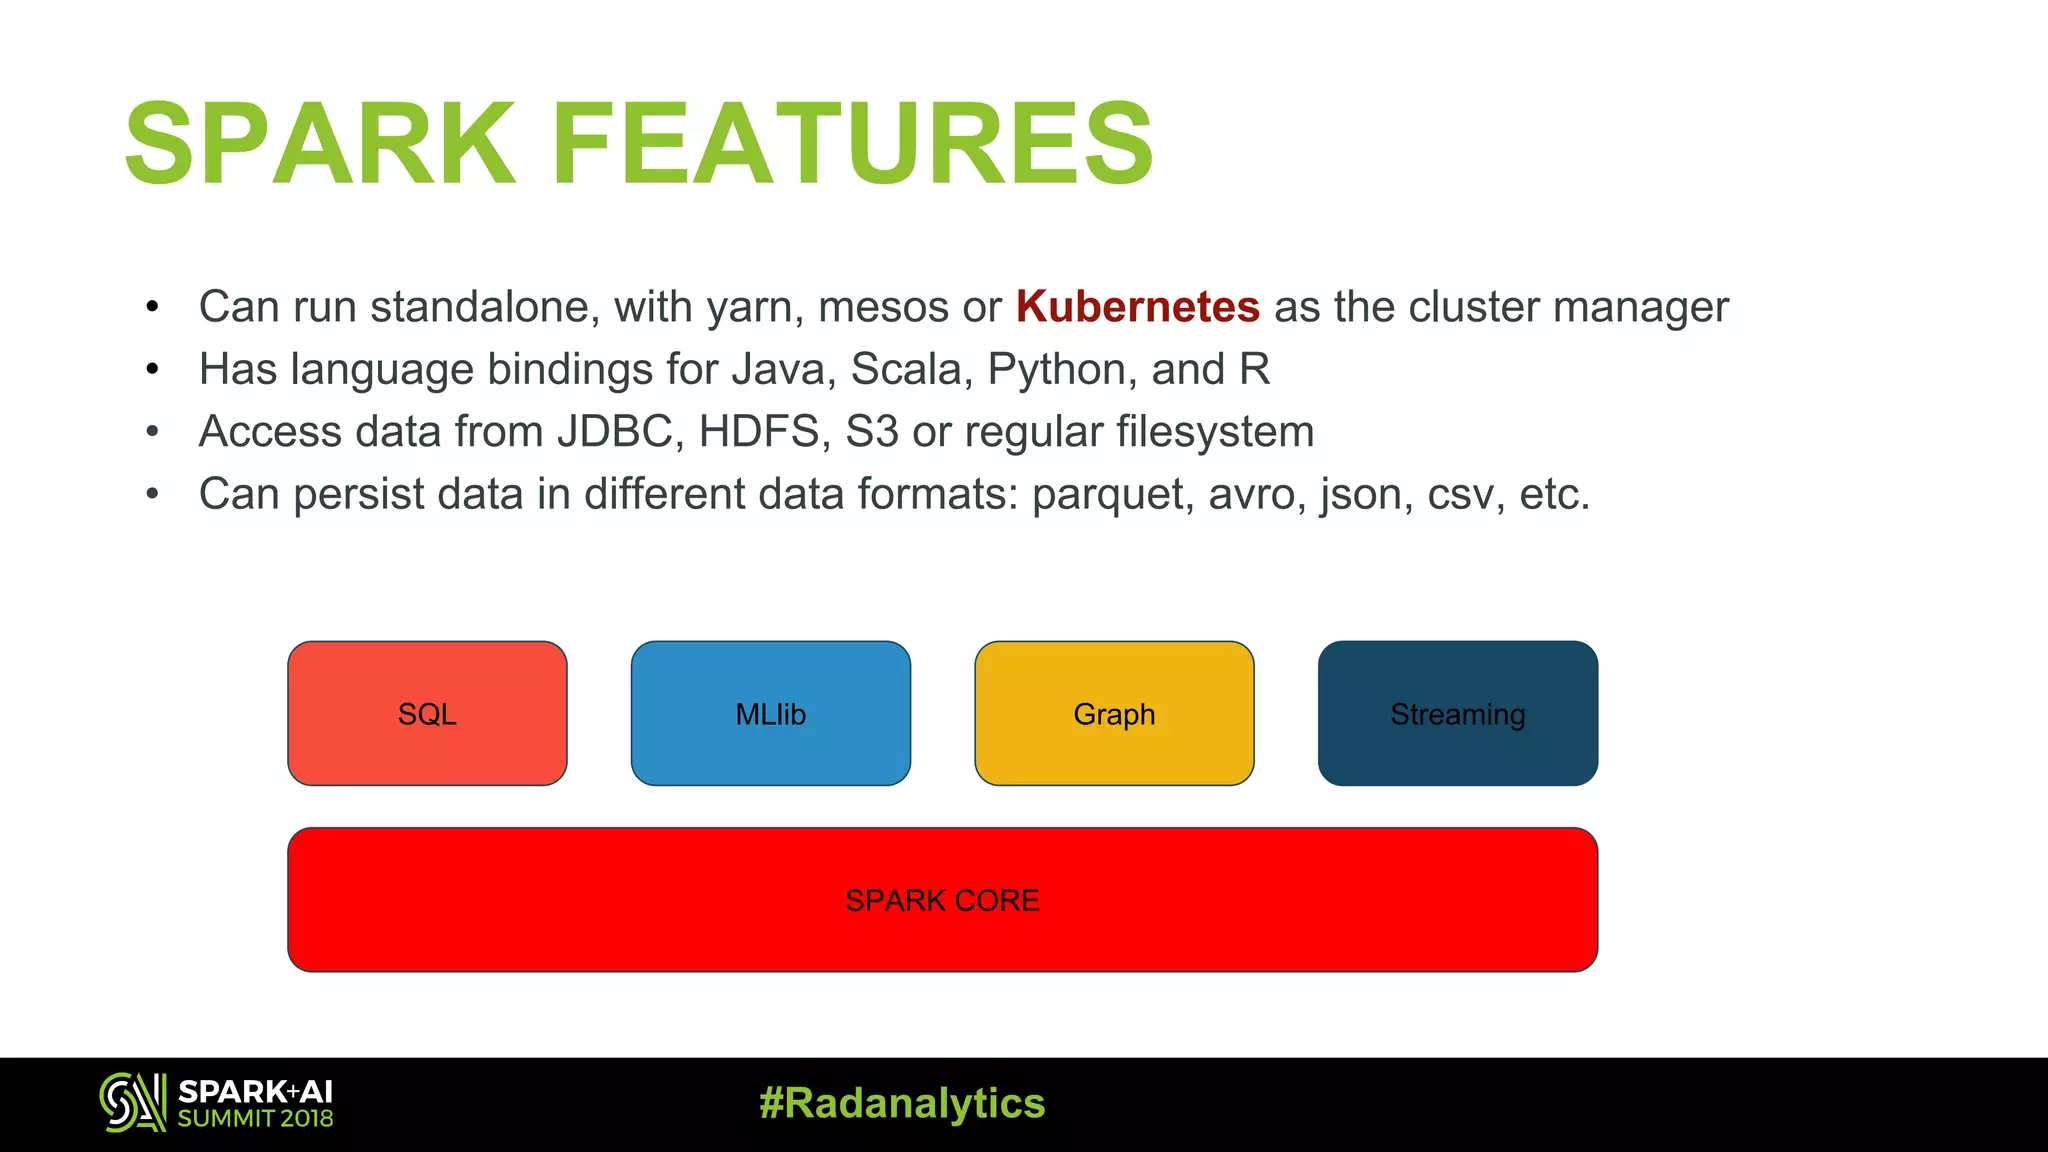
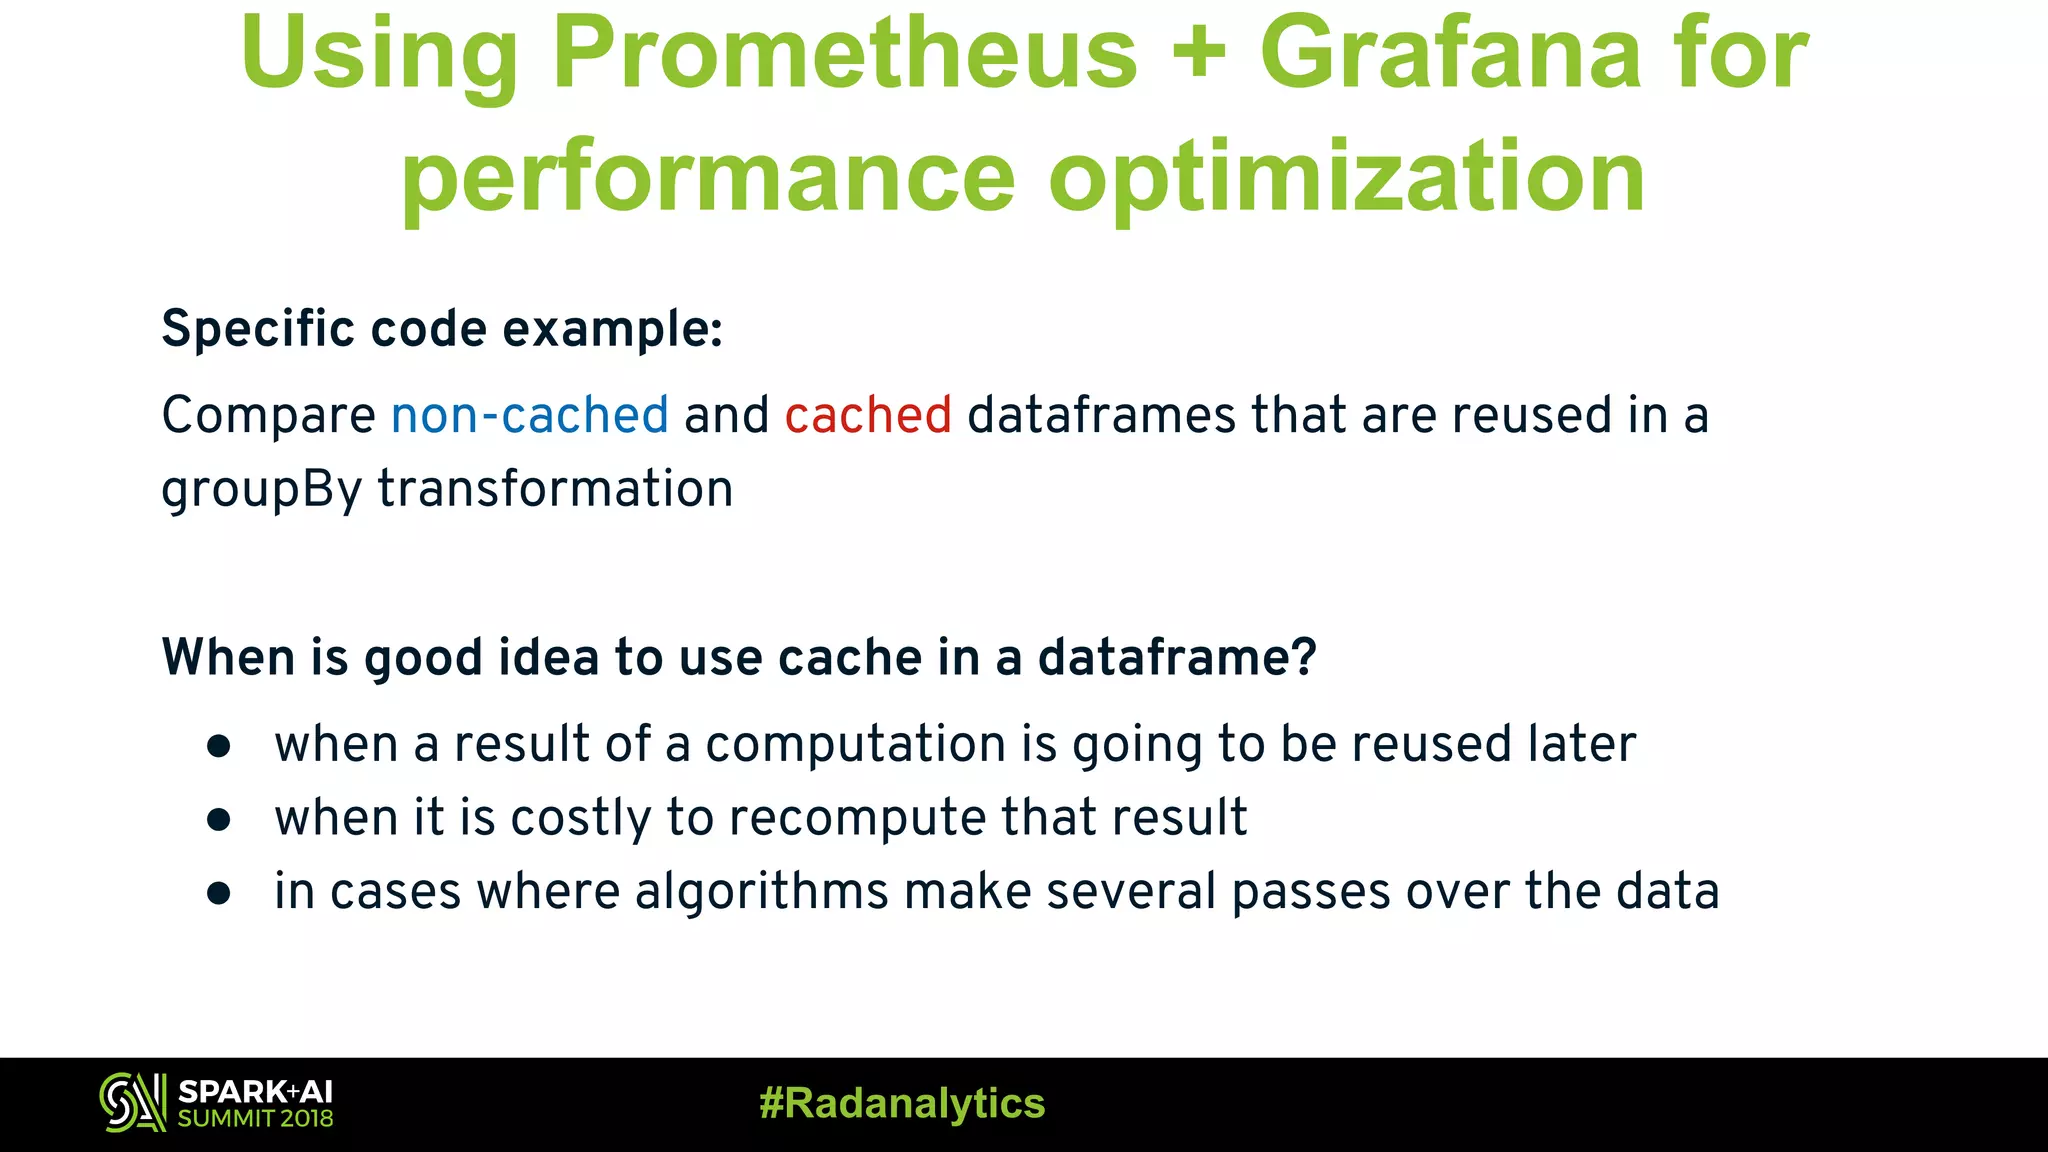
The document discusses the integration of Prometheus for scalable monitoring of Apache Spark jobs, emphasizing the benefits of observability for performance tuning. It covers topics such as Spark features, JVM instrumentation, and how to monitor metrics using Prometheus and Grafana dashboards. Additionally, it explores memory optimization strategies in Spark and compares the performance of cached versus non-cached DataFrames.