Download to read offline
![[Unclear] words are denoted in brackets Webinar: Data Visualisation Part 2 – Tools and Techniques 12 April 2018 Video & slides available from ANDS website START OF TRANSCRIPT Gerry Ryder: Good afternoon everyone. My name is Gerry Ryder and it's my pleasure to host this webinar today. Now, on to our speaker today - for those that weren't with us for the previous webinar in this series, our speaker is Martin Schweitzer, who is a data technologist with ANDS in our Melbourne office. Martin has a background in computer science and a particular interest in visualisation, data science and user interface design. He has a very professional background, which includes photography, working on large IT systems, lecturing, as well as running workshops and training courses. Martin is currently seconded to ANDS from the Bureau of Meteorology, where he is largely responsible for the climate record of Australia. Today Martin is presenting the second in the series of two webinars on data visualisation and today's focus will be on tools and techniques. So without any further ado, I'll hand over to you, Martin. Martin Schweitzer: Thanks Gerry, and thanks Susannah, who's behind the controls. I hope everybody can see my screen.](https://image.slidesharecdn.com/transcript-datavisualisation-toolsandtechniques-180615031321/75/Transcript-Data-Visualisation-Tools-and-Techniques-1-2048.jpg)
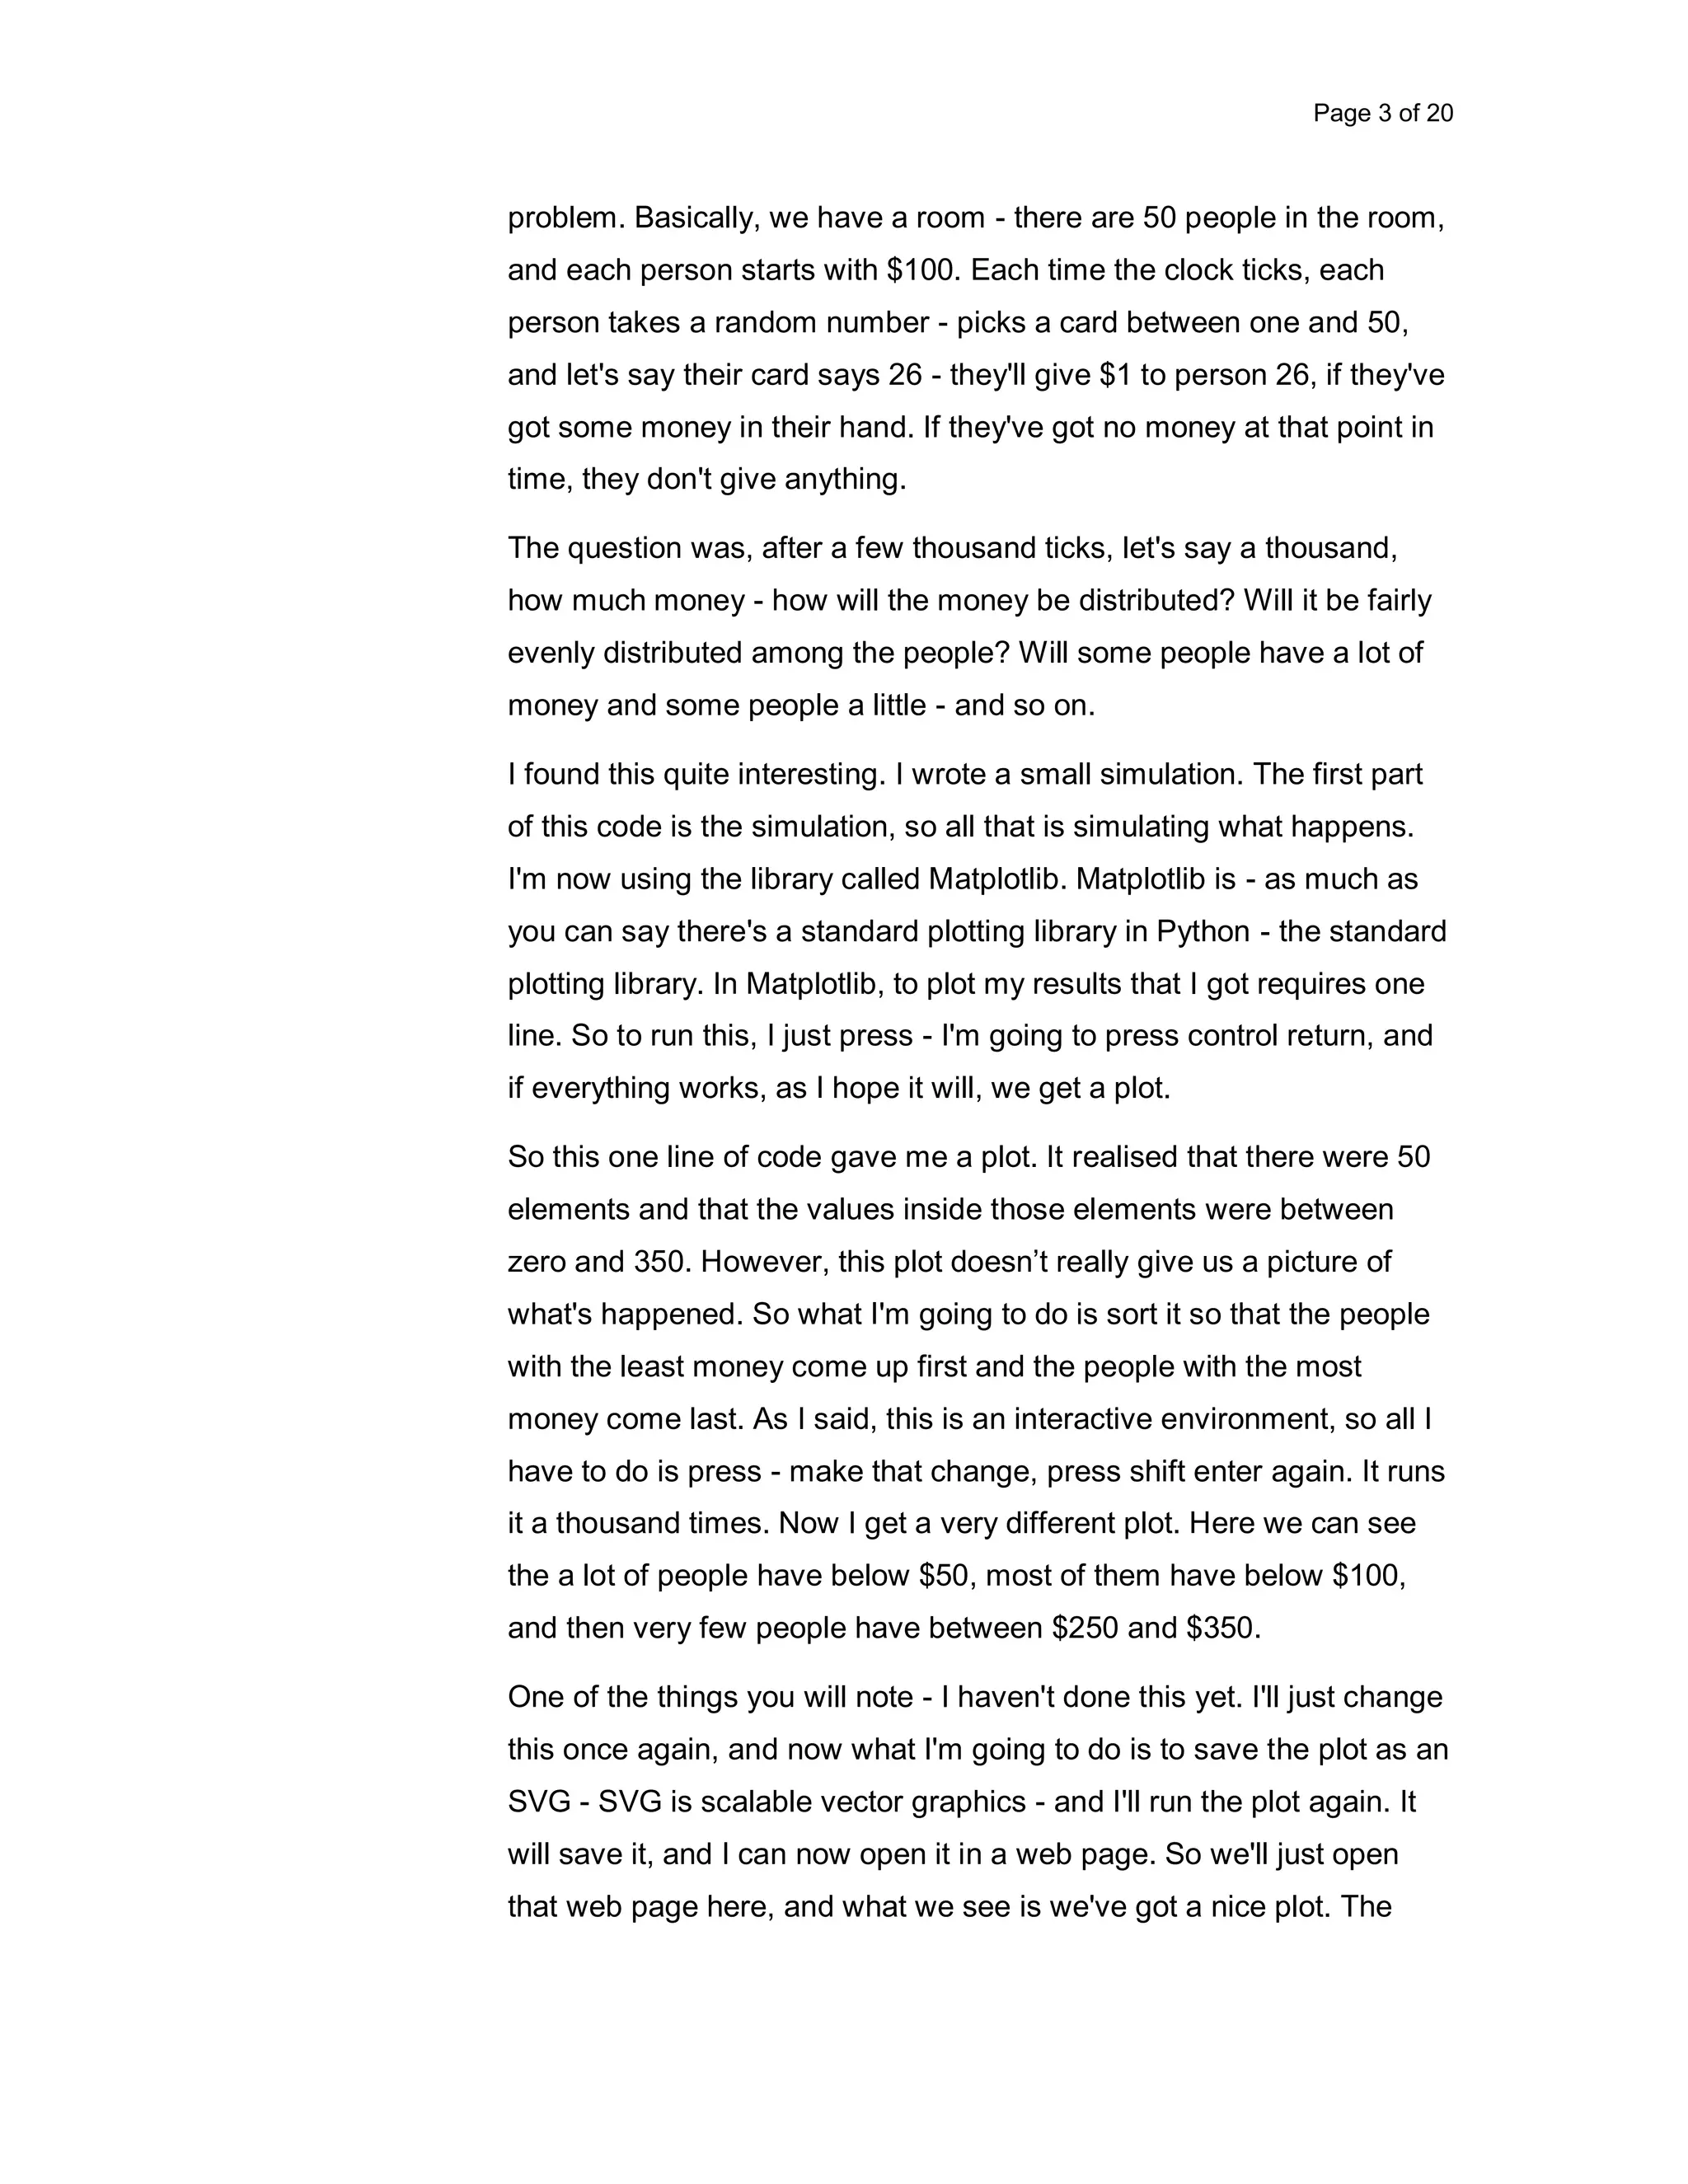
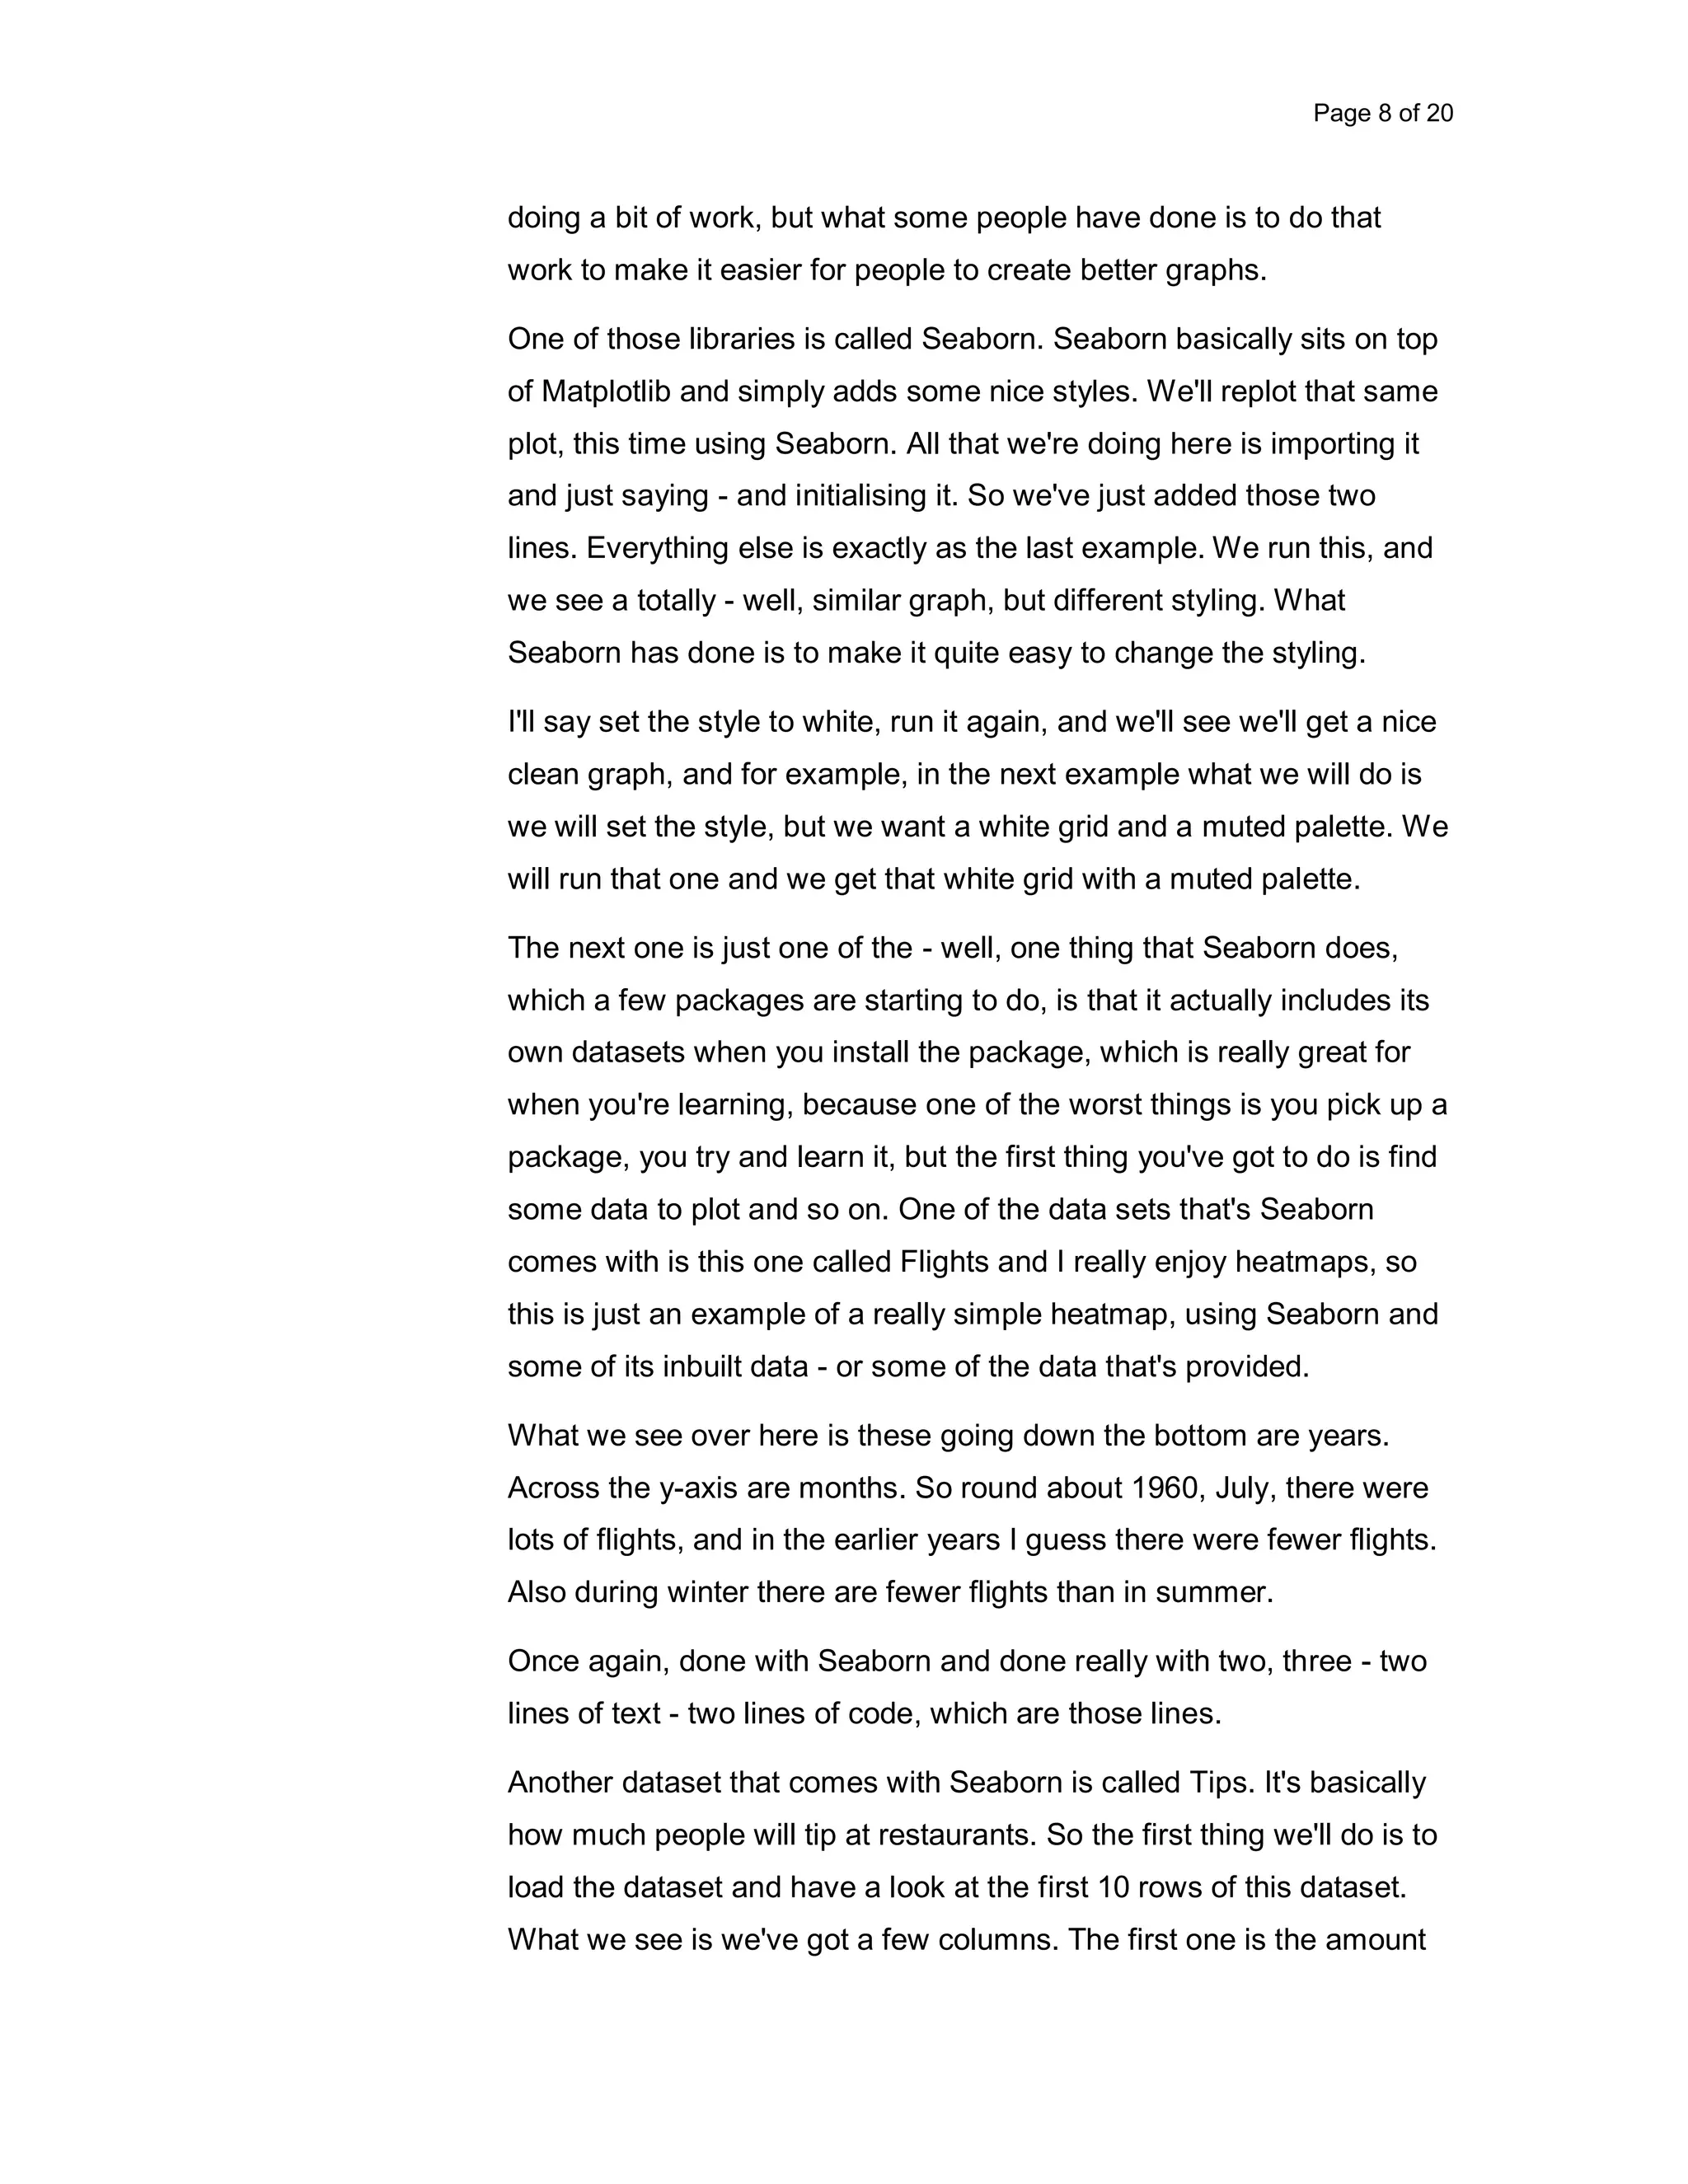
![Page 7 of 20 who watched the last presentation would be familiar that I showed some examples. You'll see the same examples again today. The first line reads the file, the second line plots it, using Pandas plotting, and the third line just adds a legend to it, or sets the label on the file at [send full]. So we're run this code, and there we did get - these are Melbourne dams, and this is showing that the Thomson is about 68 per cent full, and things like Tarago are 95 per cent full. So what we've done is in one line we've run that CSV file, we've told it what we want to call the columns. One of the columns is called name and one of the columns is called Pfull, for percentage full. When we plot it, because Pandas knows about this thing called DS, all we have to say, I want to plot the name against the percentage full and I want a bar chart. I've also said, I want to plot from the value 60 to 100. If I leave out those values, but the same graph, it will plot from zero to 100 by default. On this one - part of the thing was to show that even though we got the same figures in the same graph, it looks different when we start our scale from zero. Once again, the Thomson is about 68 per cent full and Tarago is almost 100 per cent full. The point which is the take-home point here is that to create that plot took two lines of code. The third thing that we showed last time was what's really interesting though, is the gap in volume of these different dams. That gives us a much better picture of what's happening. So when we run that what we see is because the Thomson dam is a really big dam, it's got over 200,000 gigalitres of water deficit. So even though these dams on the right are almost full, altogether they don't even make up that deficit in the dam. So that's Matplotlib and its strength is that it pretty much comes standard with Python. It's flexible, and so on. However, its simplicity often comes at the cost that it's not the best publication-ready graphing tool. You can get very nice publication-ready graphs by](https://image.slidesharecdn.com/transcript-datavisualisation-toolsandtechniques-180615031321/75/Transcript-Data-Visualisation-Tools-and-Techniques-7-2048.jpg)
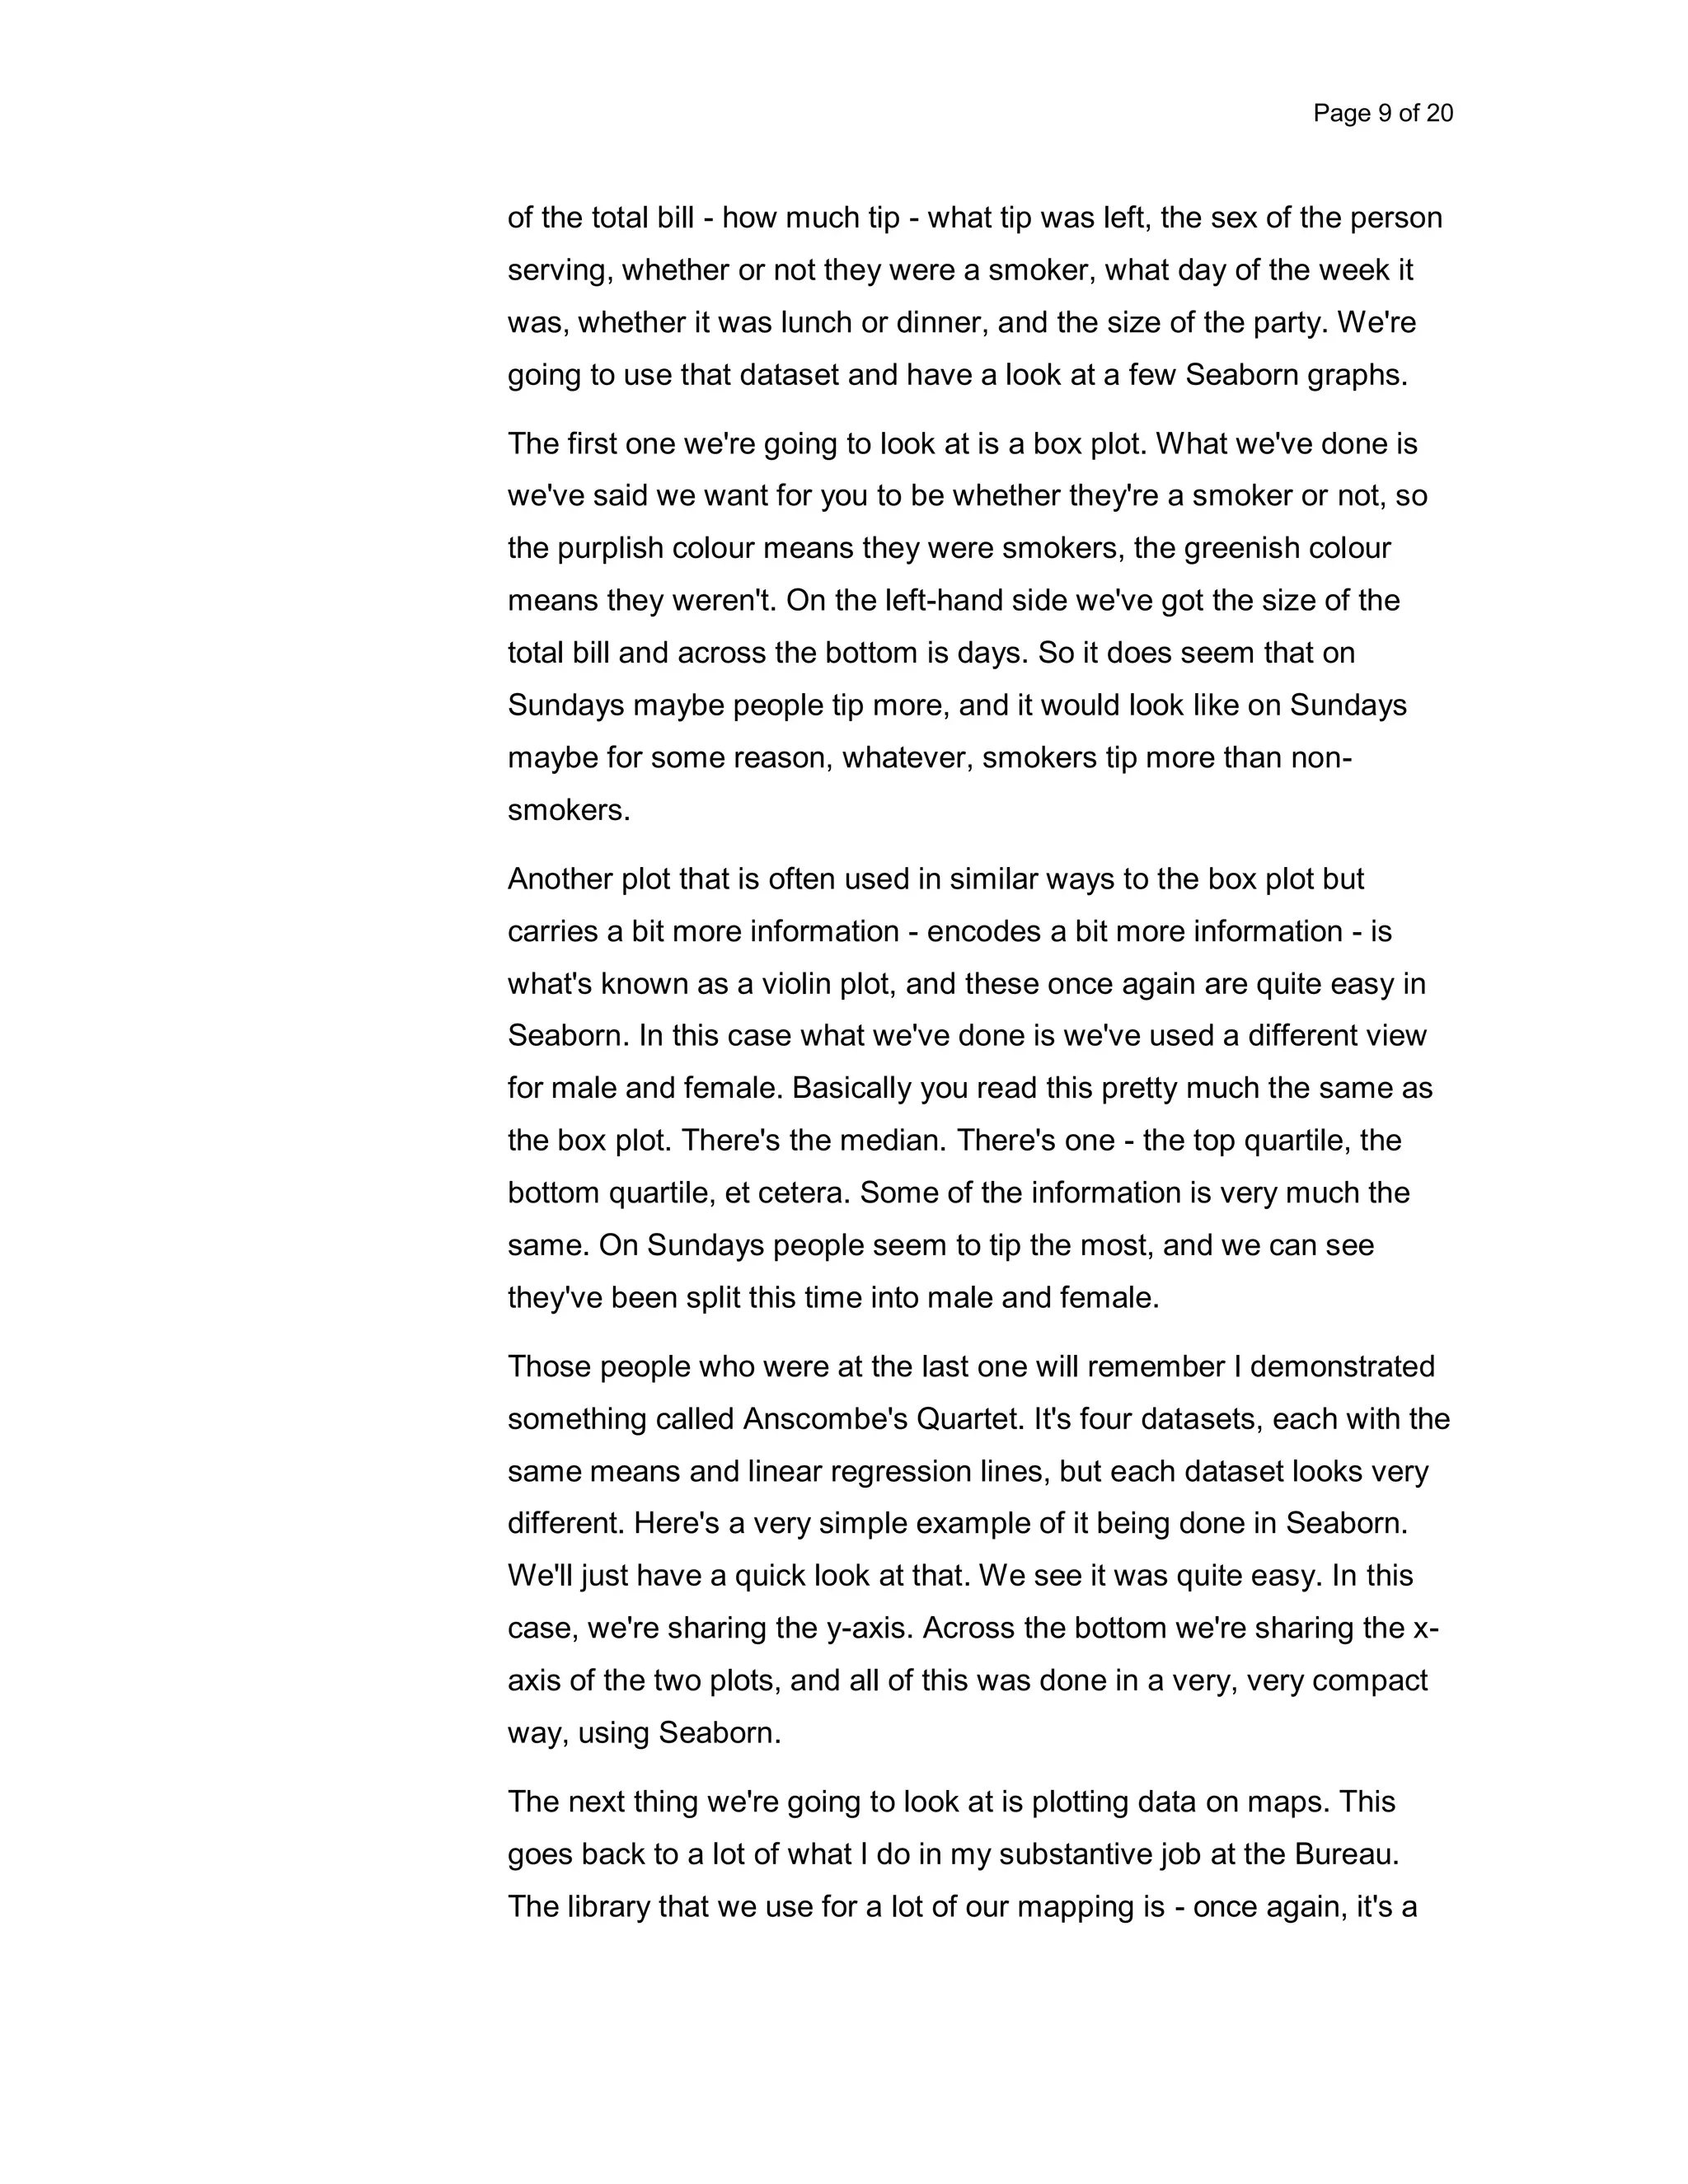
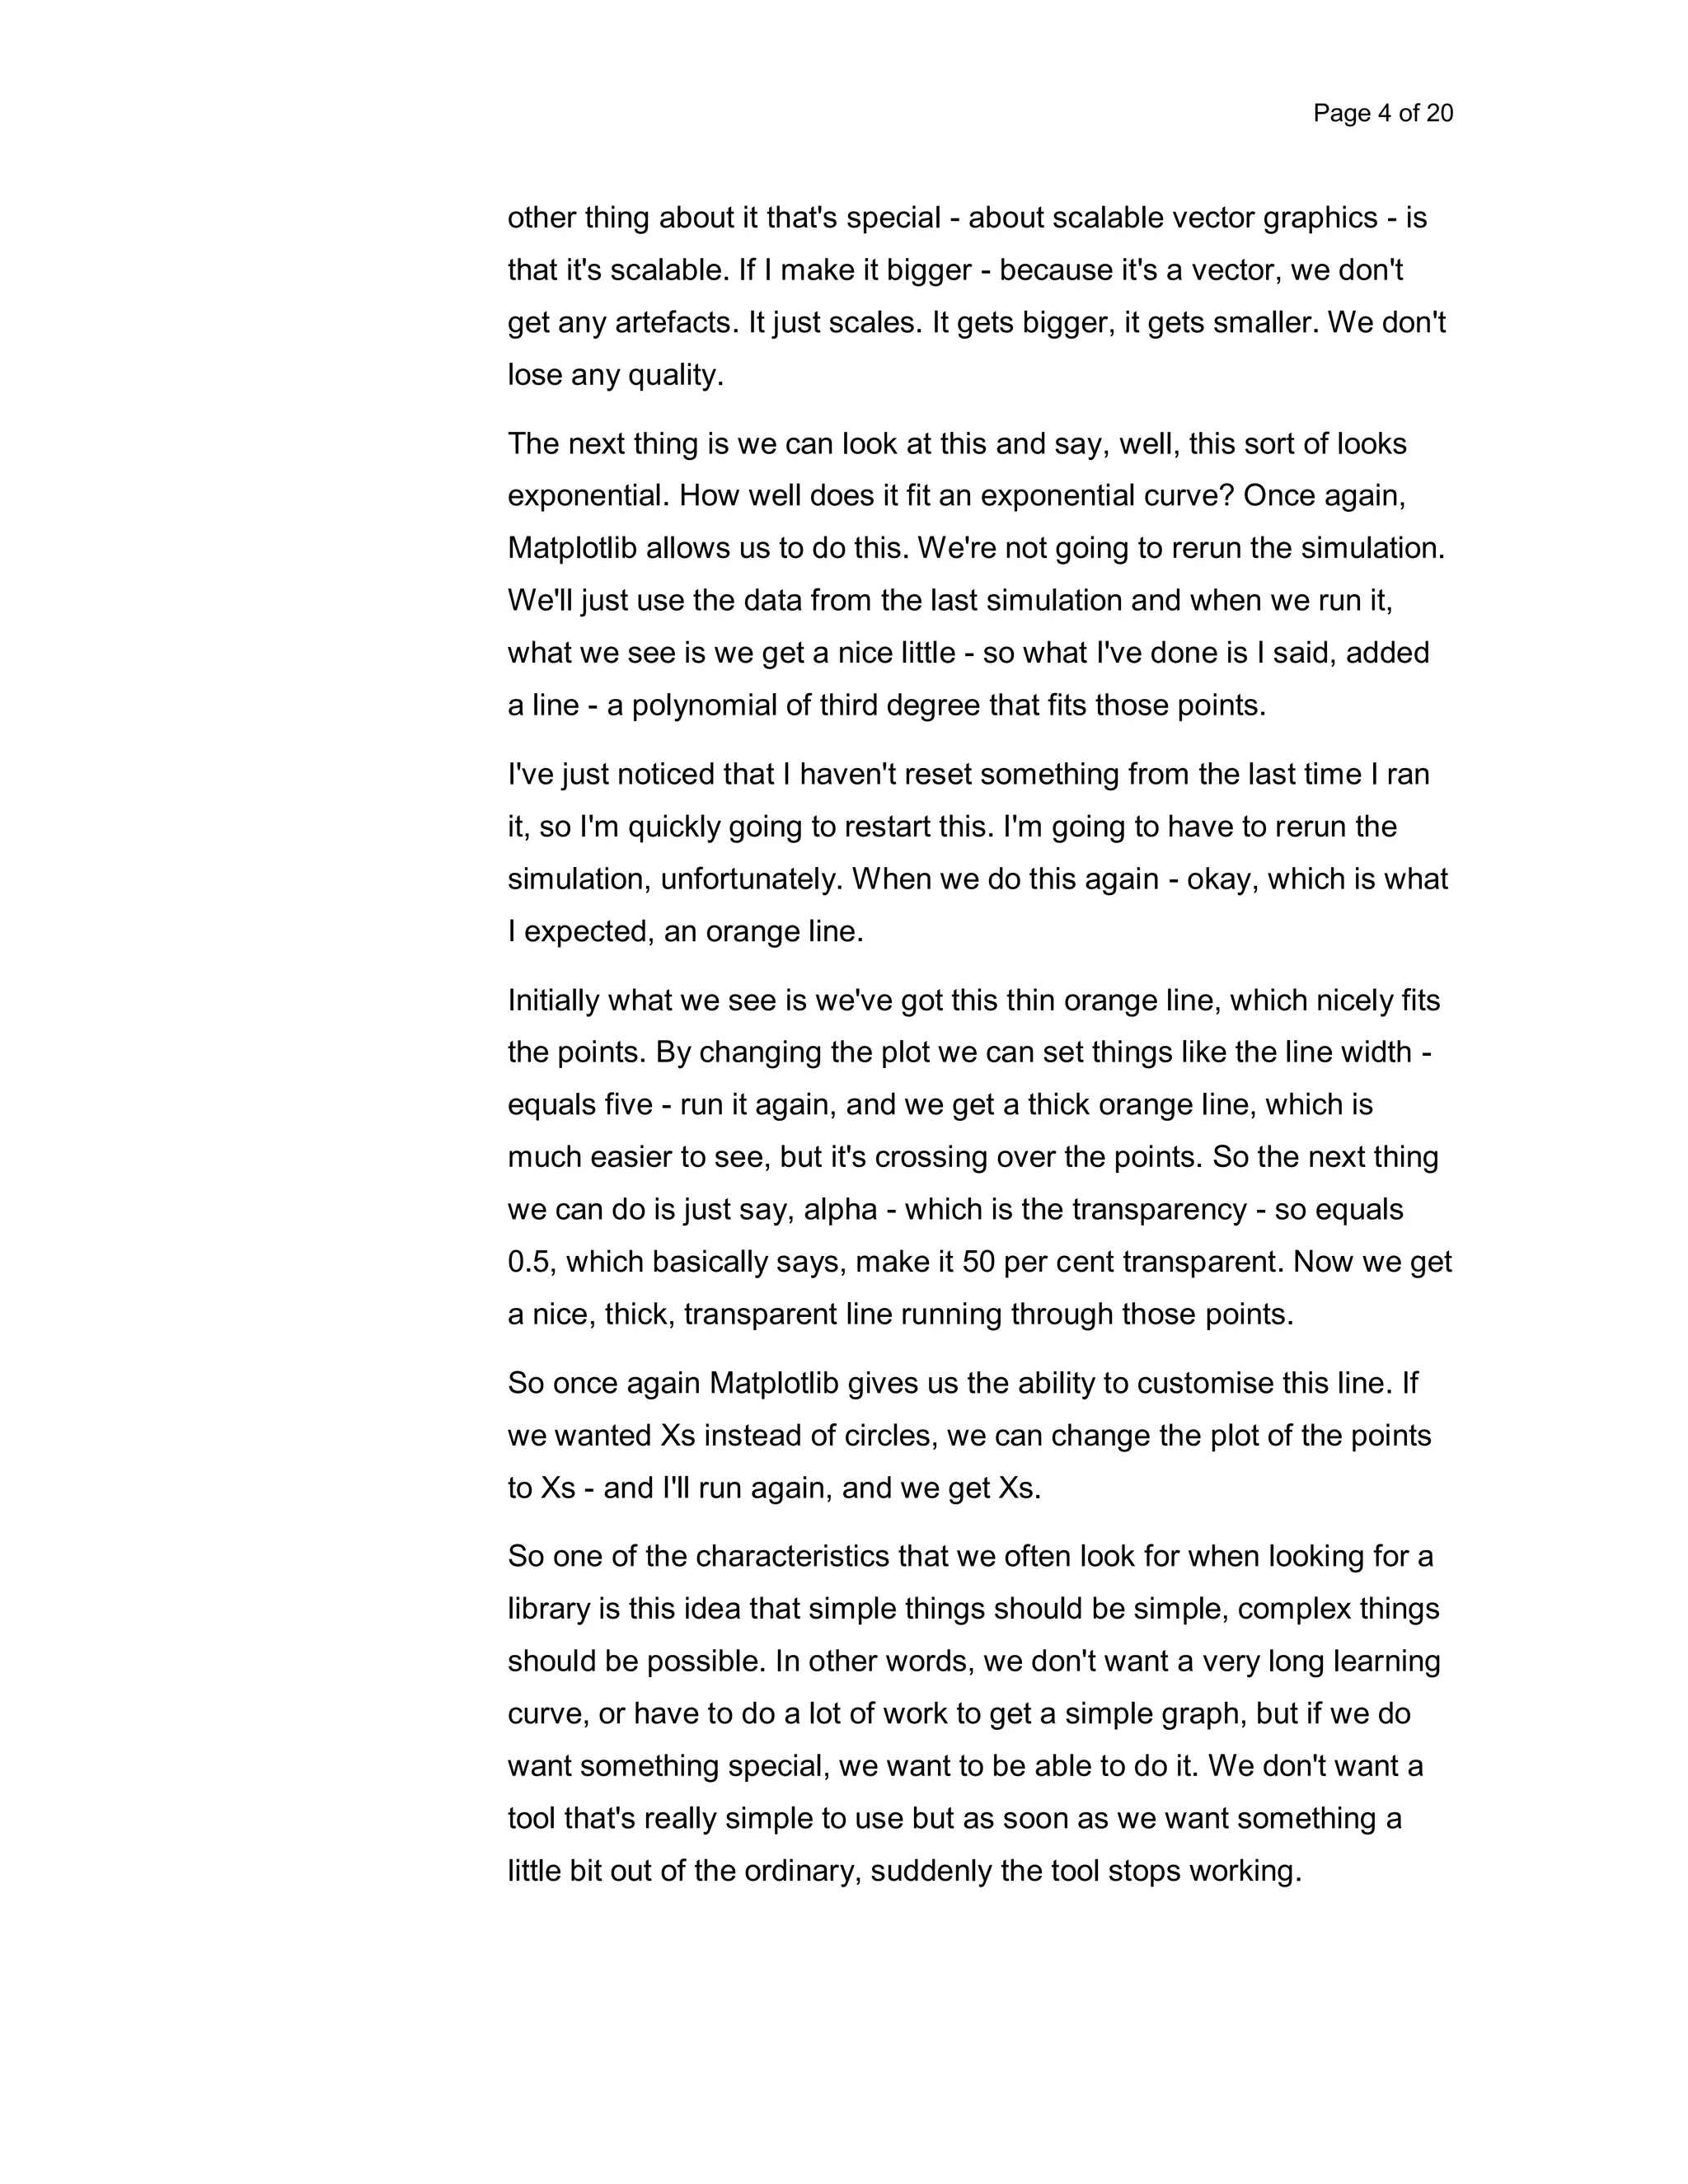
![Page 10 of 20 standard with Python. It's called Basemap. The first one, we're not actually plotting anything, we're just simply drawing a map, so what we should see now. It takes a little bit the first time we run it, but we've plotted a map of the world in a few lines of code. That's pretty much from there to there. The story - what we're really interested in at this stage is Australia, and this projection isn't as useful as what we're going to look at now, which is a sort of [MICATA], so we'll just change some of the parameters and this should give us a map of Australia, which is great. It looks a bit like the ones I draw by hand. What I'm going to demonstrate now is some more visualisation, but it goes back to a problem I was given, oh, about a year or two ago. We have about 112 reference stations around Australia. These are stations with very high-quality data that have a long record - about 50 years or longer. These are very important in - as reference stations, to see what's happening with the climate of Australia. One of the outcomes of this - the reference station set is called Acorn, and we do a publication where we publish the names of each station. One of the things we also publish is for each station which are the closest three stations to that station. I wrote some code that worked out what the closest three stations were, to each station. This was the file I was given - once again, I'm using Pandas to read it. So we've got, for example, Halls Creek, we've got the latitude, longitude, the altitude and the date it was opened. As you can see, these all have a very long record. The first thing is I plot these, so using Matplotlib - the first parts we've seen. That draws the map. This line, after having read the file, plots the data on a map, so we'll just quickly plot those stations. The black dots of course are the stations, and there are 112 of them around Australia. The question I was asked is - after saying, okay, here's a list - for each station these are the closest three stations to that particular station.](https://image.slidesharecdn.com/transcript-datavisualisation-toolsandtechniques-180615031321/75/Transcript-Data-Visualisation-Tools-and-Techniques-10-2048.jpg)
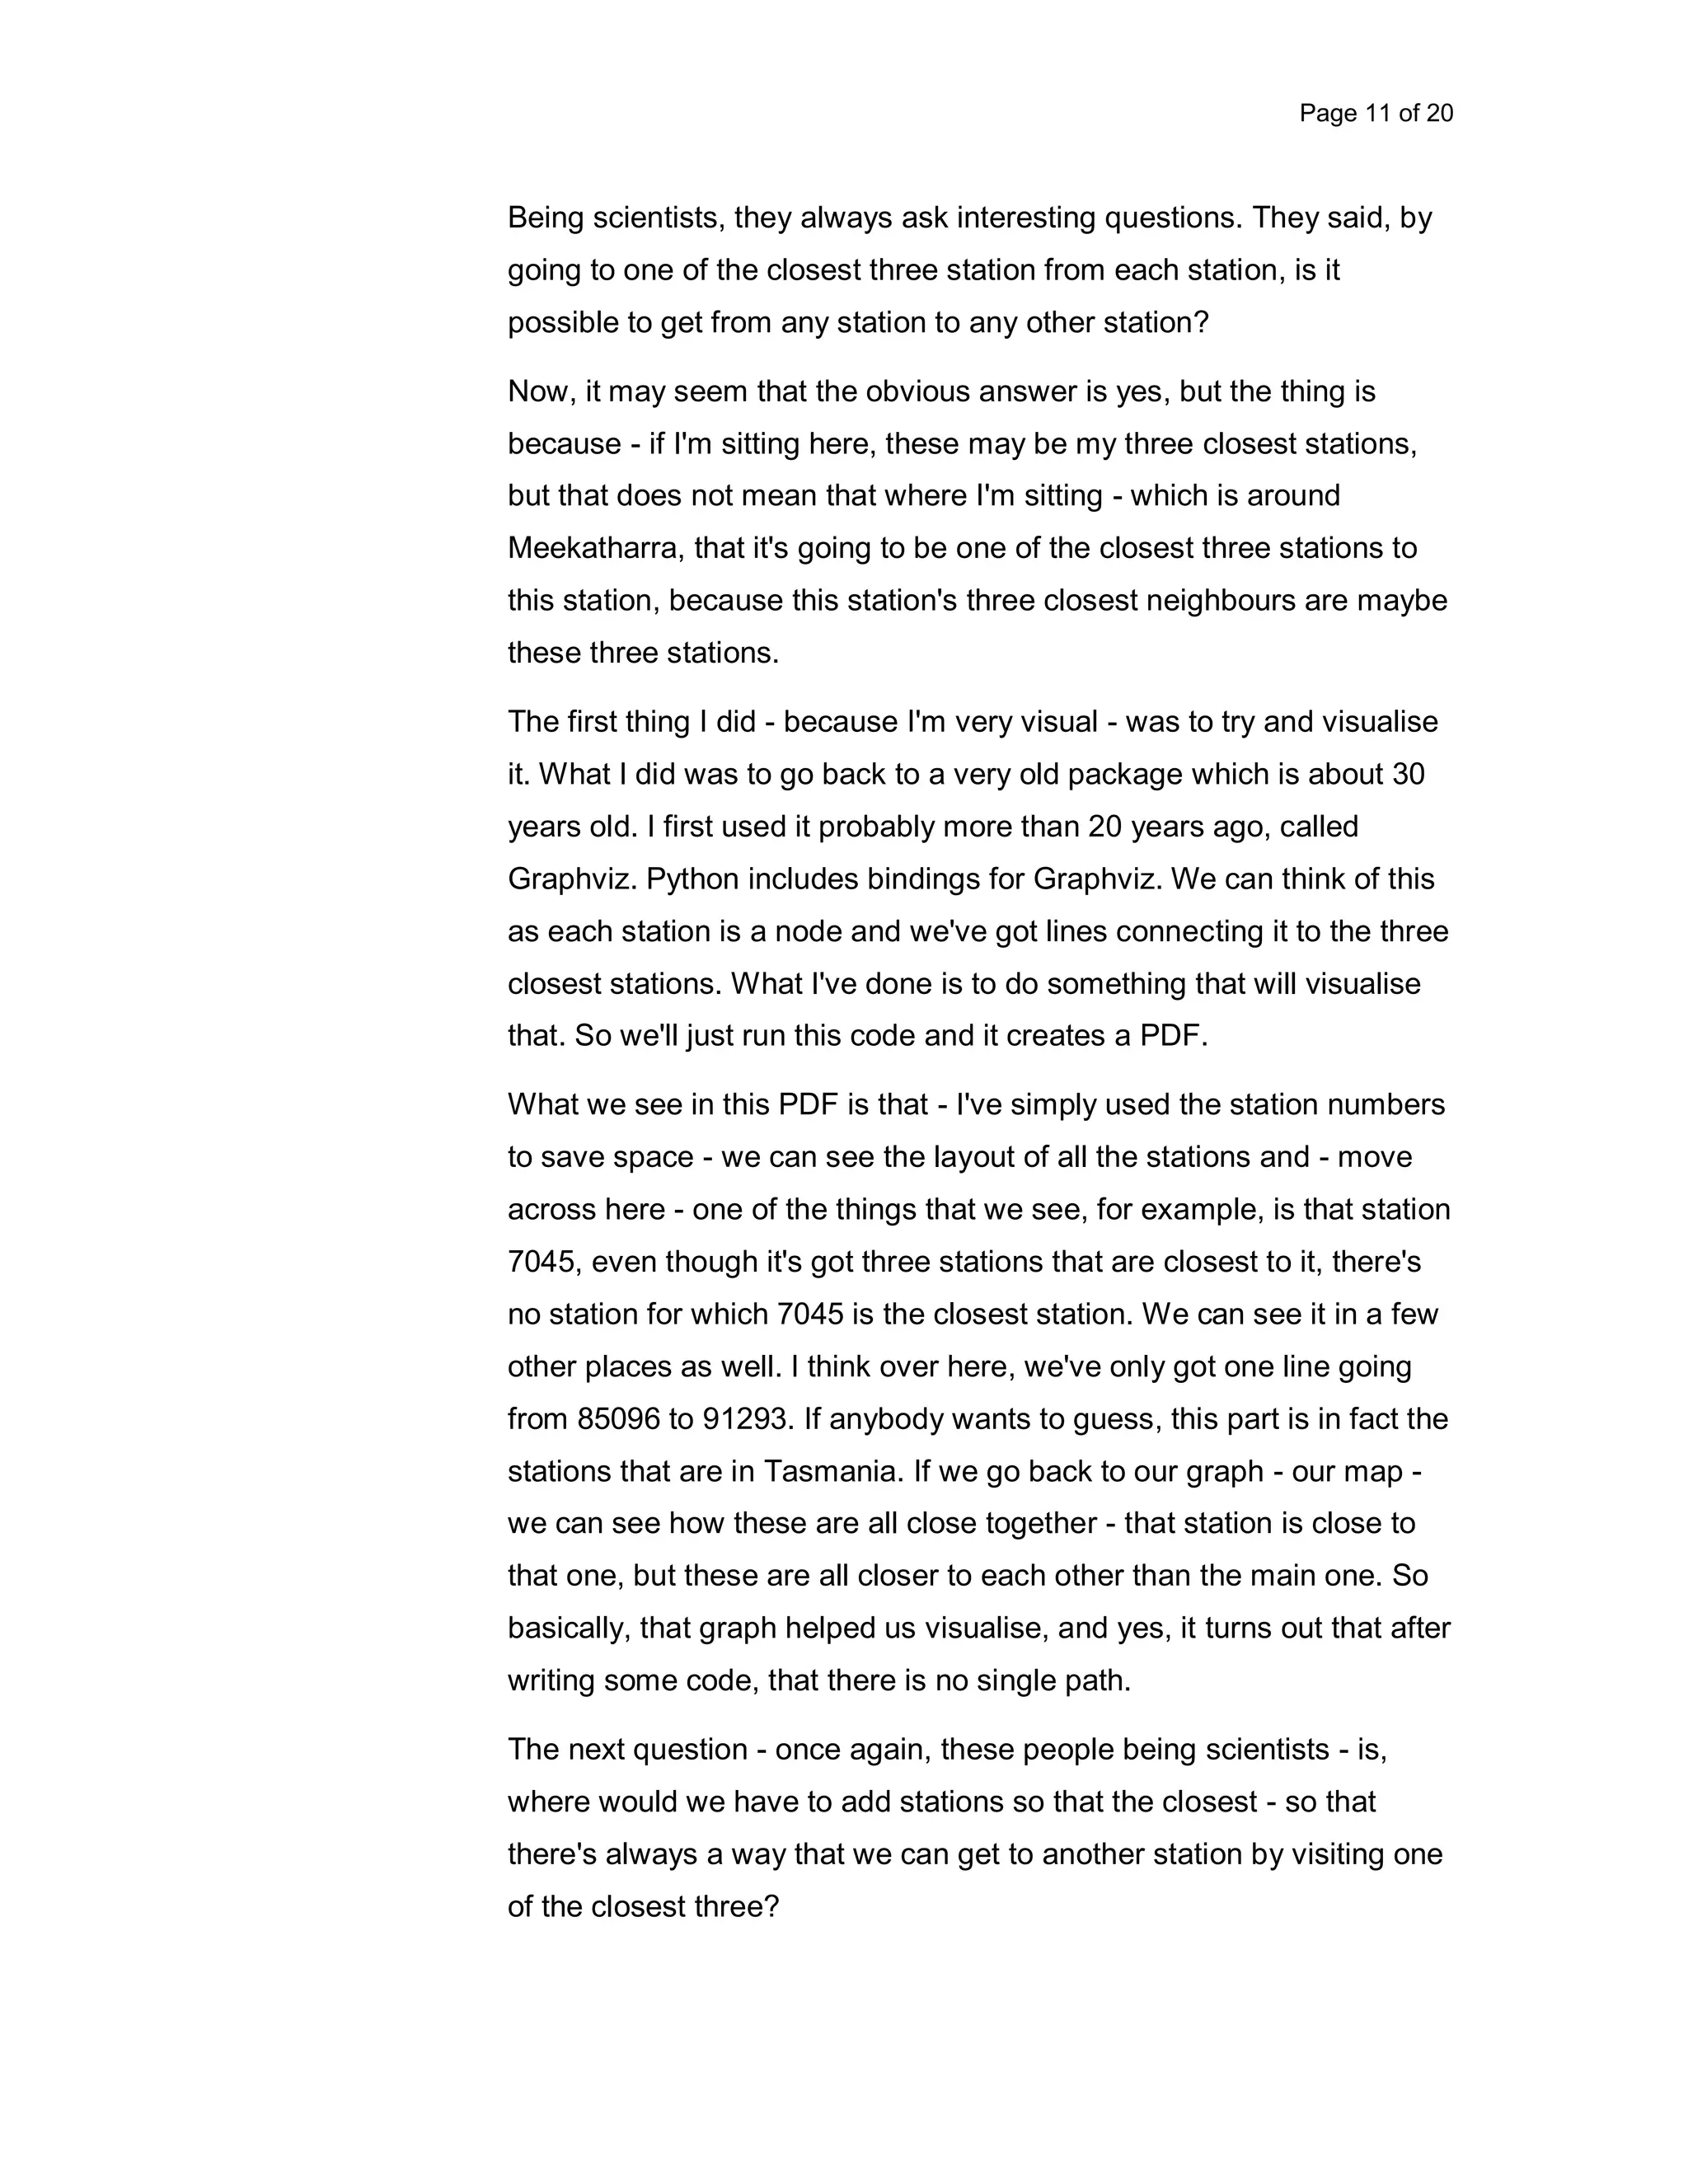
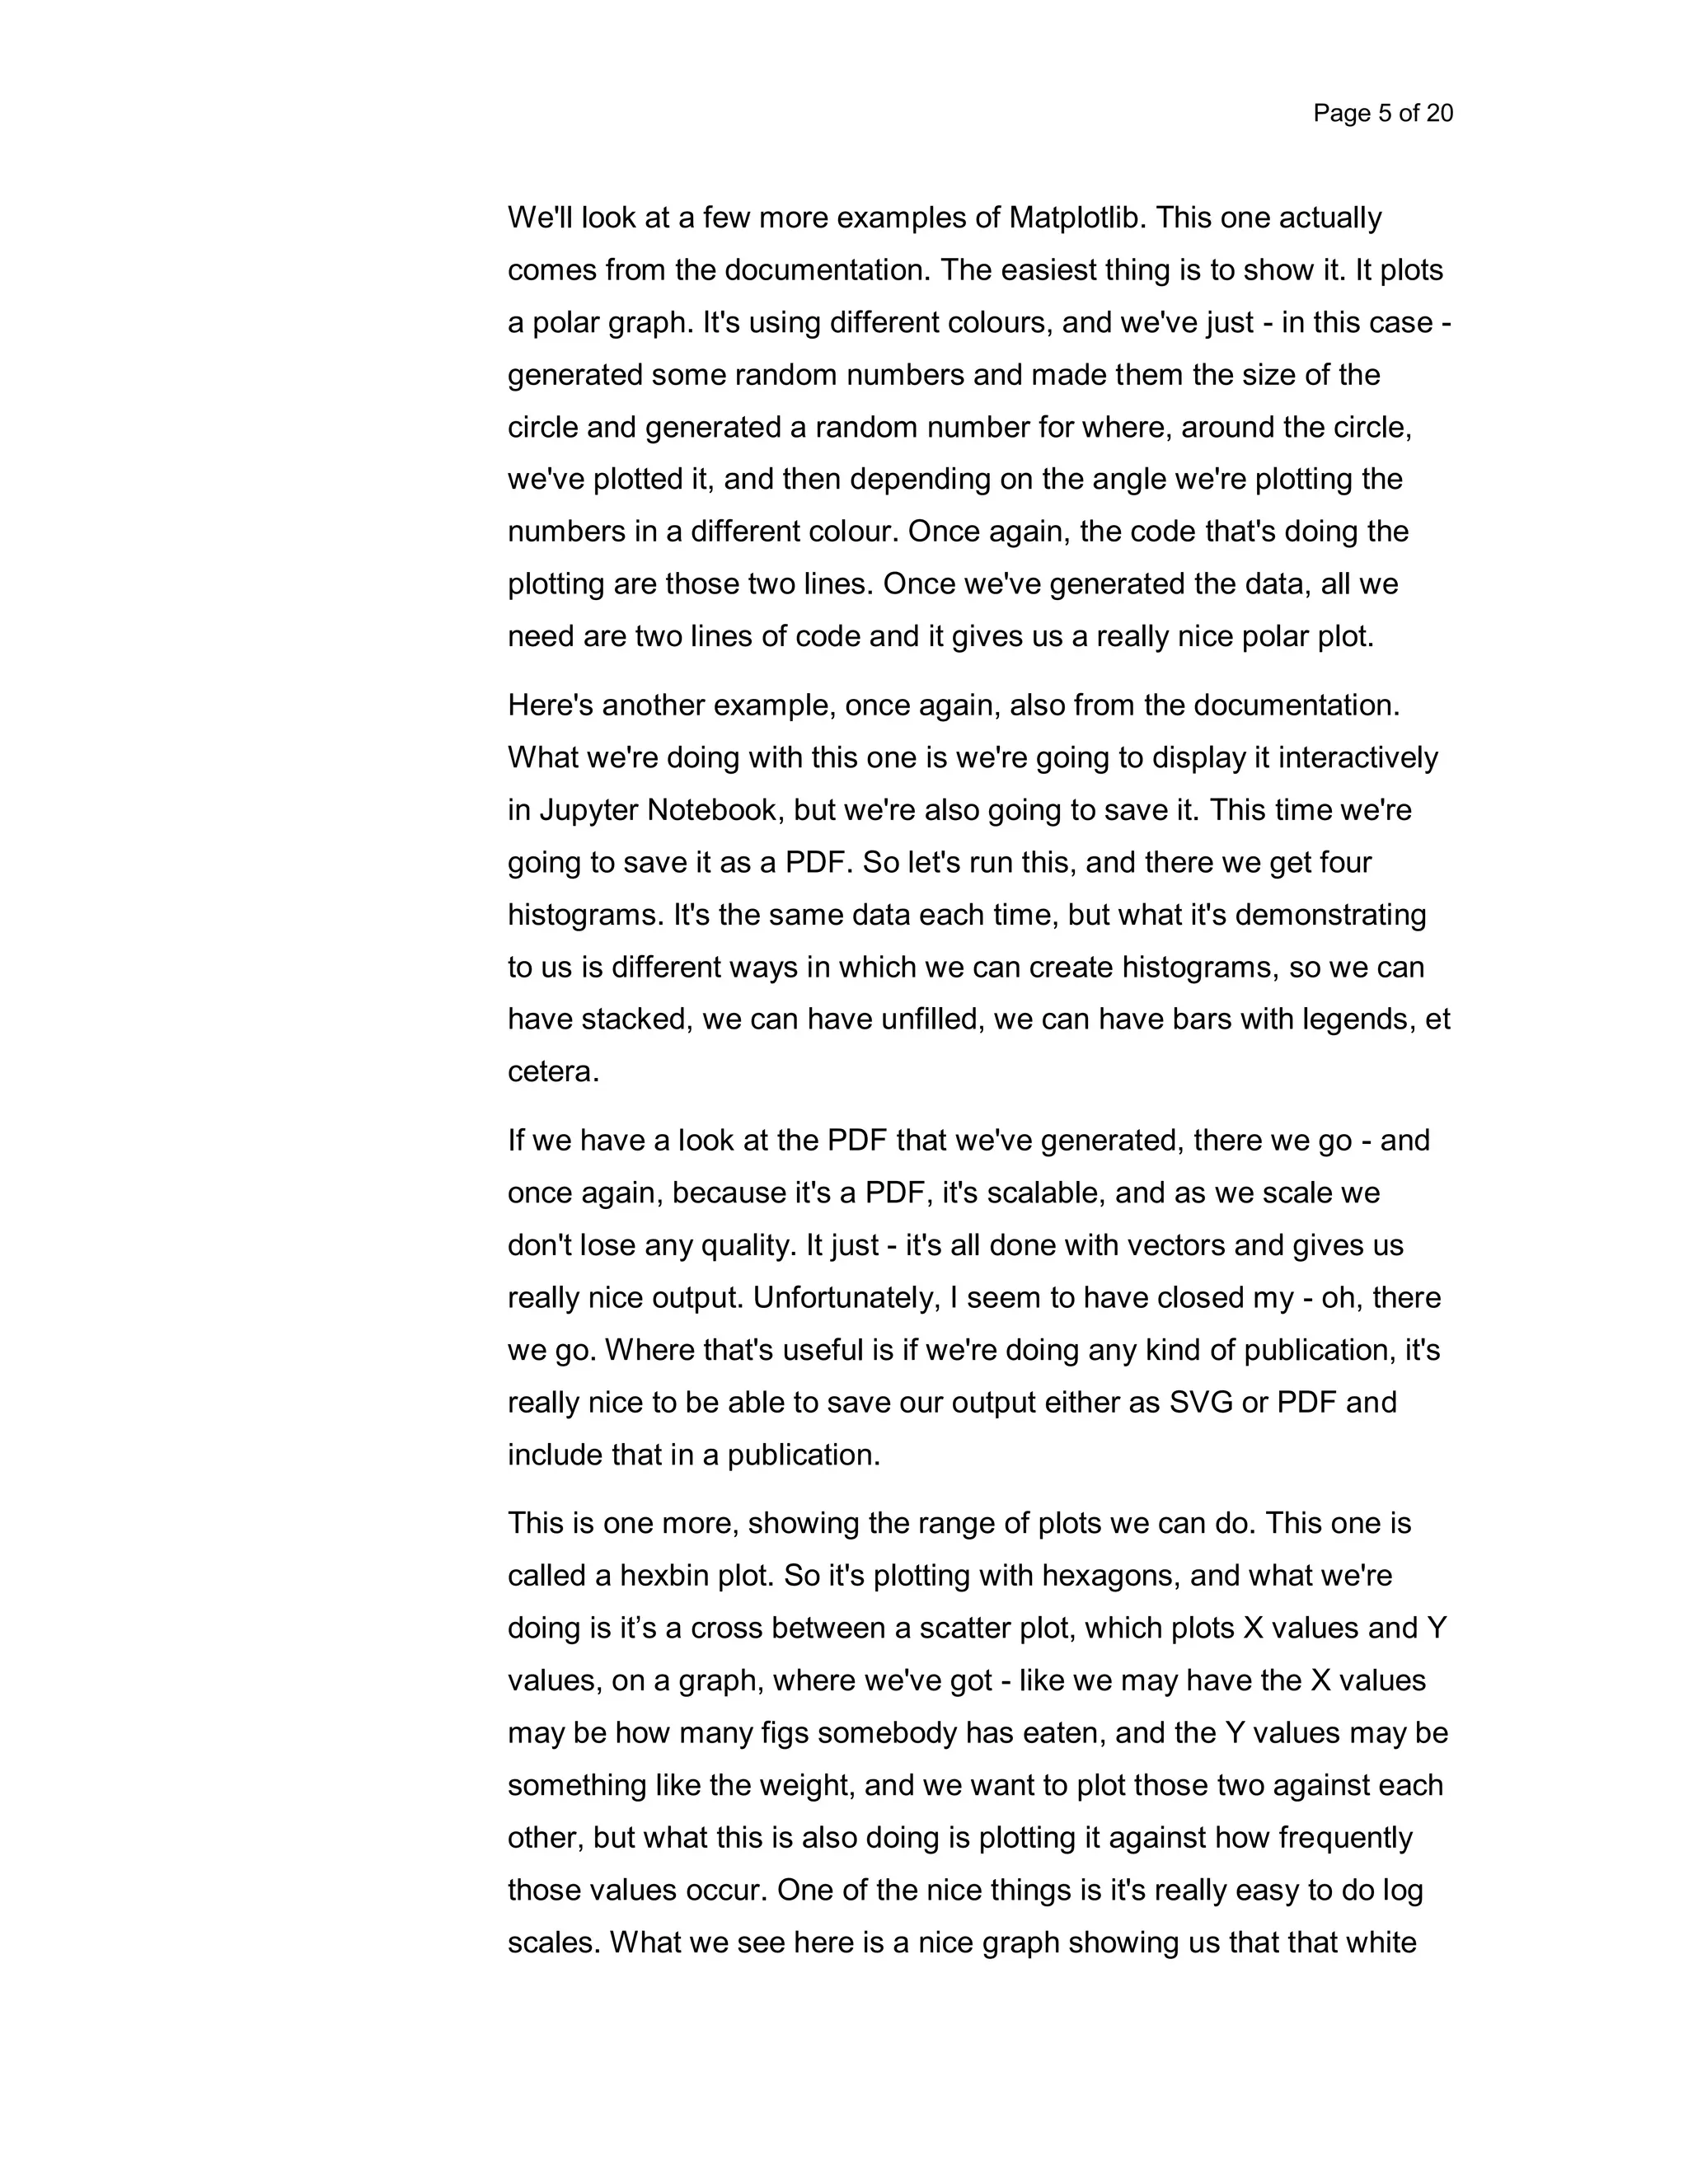
![Page 13 of 20 of the original drawings of it, for example, in [Tufter's] book, this is very close to the original, so it was very easy to - well, it required some work to make it similar, but we could - it was flexible enough that we could. I'll quickly show another one, which is another famous machine learning data set, which is Irises. This one is plotting. So what we're plotting is the petal width of different species against the petal length. We see that some species are down her, some species - the green ones - are up here, and some over here. The thing about Bokeh is it allows us some interactivity, so we can do things like zoom, you can also pan, and if we put the output on a web page, the web page can have these same tools. There's a wheel zoom. We can go back to what it looked like initially. So that's Bokeh. Here's one that also came from that last one, called Joyplots. The thing about this is we're plotting a whole lot of variables against a common set of axes. I'll just for the moment skip over Plotly, because I want to look at a few tools that are useful in web development - so we're leaving Python for a moment. The first one is one that I wrote a few years ago. This is using Google Maps and I'm putting some data on it. These are the Acorn Sat stations once again. When we click on one, we get a graph of the climatology, the average monthly temperature, so let's go to Melbourne. We're now in April, to the average maximum temperature for Melbourne is normally 21 degrees. This is the average rainfall for Melbourne - around 50 millimetres. We can also get a time series and we can zoom in on the time series. This graph and the time series were done using a tool called Highcharts. Highcharts is available free for non-commercial use, but it does require licence for any kind of commercial use, and government use is also considered to be commercial. Having said that, if you are](https://image.slidesharecdn.com/transcript-datavisualisation-toolsandtechniques-180615031321/75/Transcript-Data-Visualisation-Tools-and-Techniques-13-2048.jpg)


Martin Schweitzer presents on data visualization tools and techniques. He demonstrates Matplotlib, Pandas, Seaborn, Bokeh, Plotly, and Basemap. With Matplotlib, he creates simple plots with just one or two lines of code, as well as more advanced plots. Pandas allows plotting data from CSV files easily. Seaborn builds on Matplotlib to provide publication-ready styling and includes sample datasets. Web-based tools like Bokeh and Plotly allow interactive visualizations. Basemap supports geographic data visualization.