

![¡ Log-linear models of the form: Pr( 𝑋= 𝑥) =exp{ 𝜃↑′ 𝑧( 𝑥)}/𝐾( 𝜃) ¡ The problem is the normalizing constant ¡ Solution: log-linear → logit. ¡ Consider conditional log-odds for a network x and a pair (i,j) of nodes: § 𝑋↓𝑖𝑗 ↓↑𝑐 : status of all pairs in x other than (i,j) § 𝑋↓𝑖𝑗 ↓↑+ : same network as x but 𝑥↓𝑖𝑗 =1 § 𝑋↓𝑖𝑗 ↓↑− : same network as x but 𝑥↓𝑖𝑗 = 0 𝑃( 𝑋↓𝑖𝑗 =1| 𝑋↓𝑖𝑗 ↓↑𝑐 )/𝑃( 𝑋↓𝑖𝑗 =0| 𝑋↓𝑖𝑗 ↓↑𝑐 ) =exp{ 𝜃↑+ 𝑠( 𝑋↓𝑖𝑗 ↓↑+ )}/exp{ 𝜃↑+ 𝑠( 𝑋↓𝑖𝑗 ↓↑− )} =exp( 𝜃↑+ [𝑠( 𝑋↓𝑖𝑗 ↓↑+ )− 𝑠( 𝑋↓𝑖𝑗 ↓↑− )]) log( 𝑃 𝑋↓𝑖𝑗 =1 𝑋↓𝑖𝑗 ↓↑𝑐 /𝑃 𝑋↓𝑖𝑗 =0 𝑋↓𝑖𝑗 ↓↑𝑐 ) = 𝜃↑+ [𝑠( 𝑋↓𝑖𝑗 ↓↑+ )− 𝑠( 𝑋↓𝑖𝑗 ↓↑− )] Exponential random graph modelling (p*)](https://image.slidesharecdn.com/burcupresentation-160316123322/75/Synthetic-Data-Generation-using-exponential-random-Graph-modeling-4-2048.jpg)

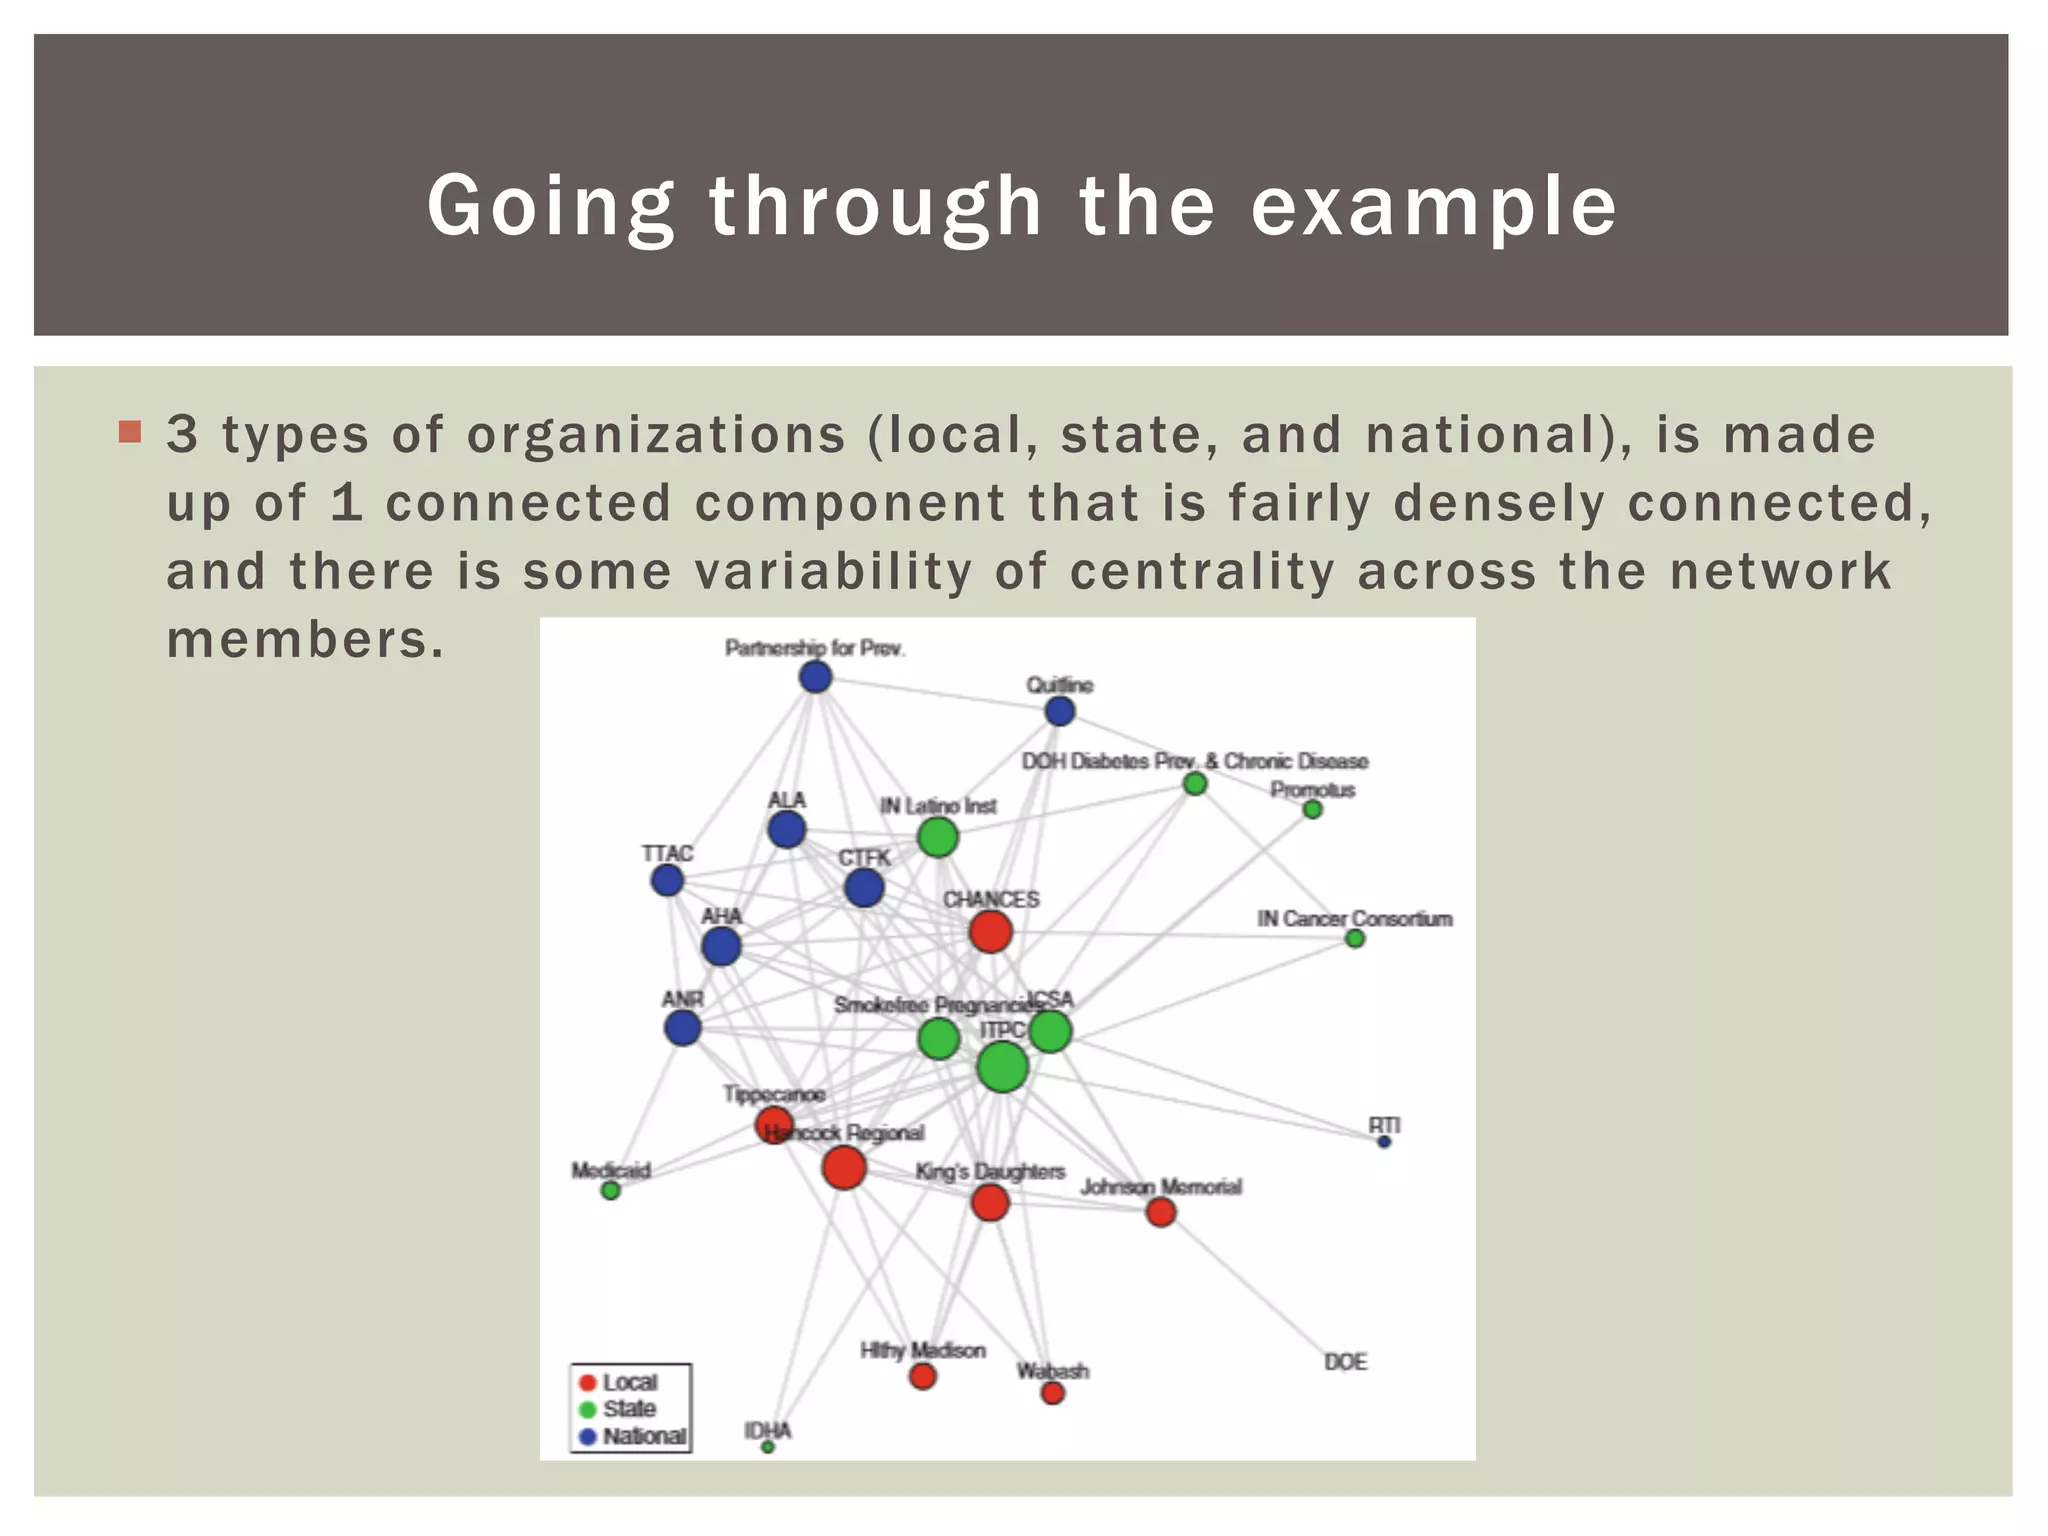
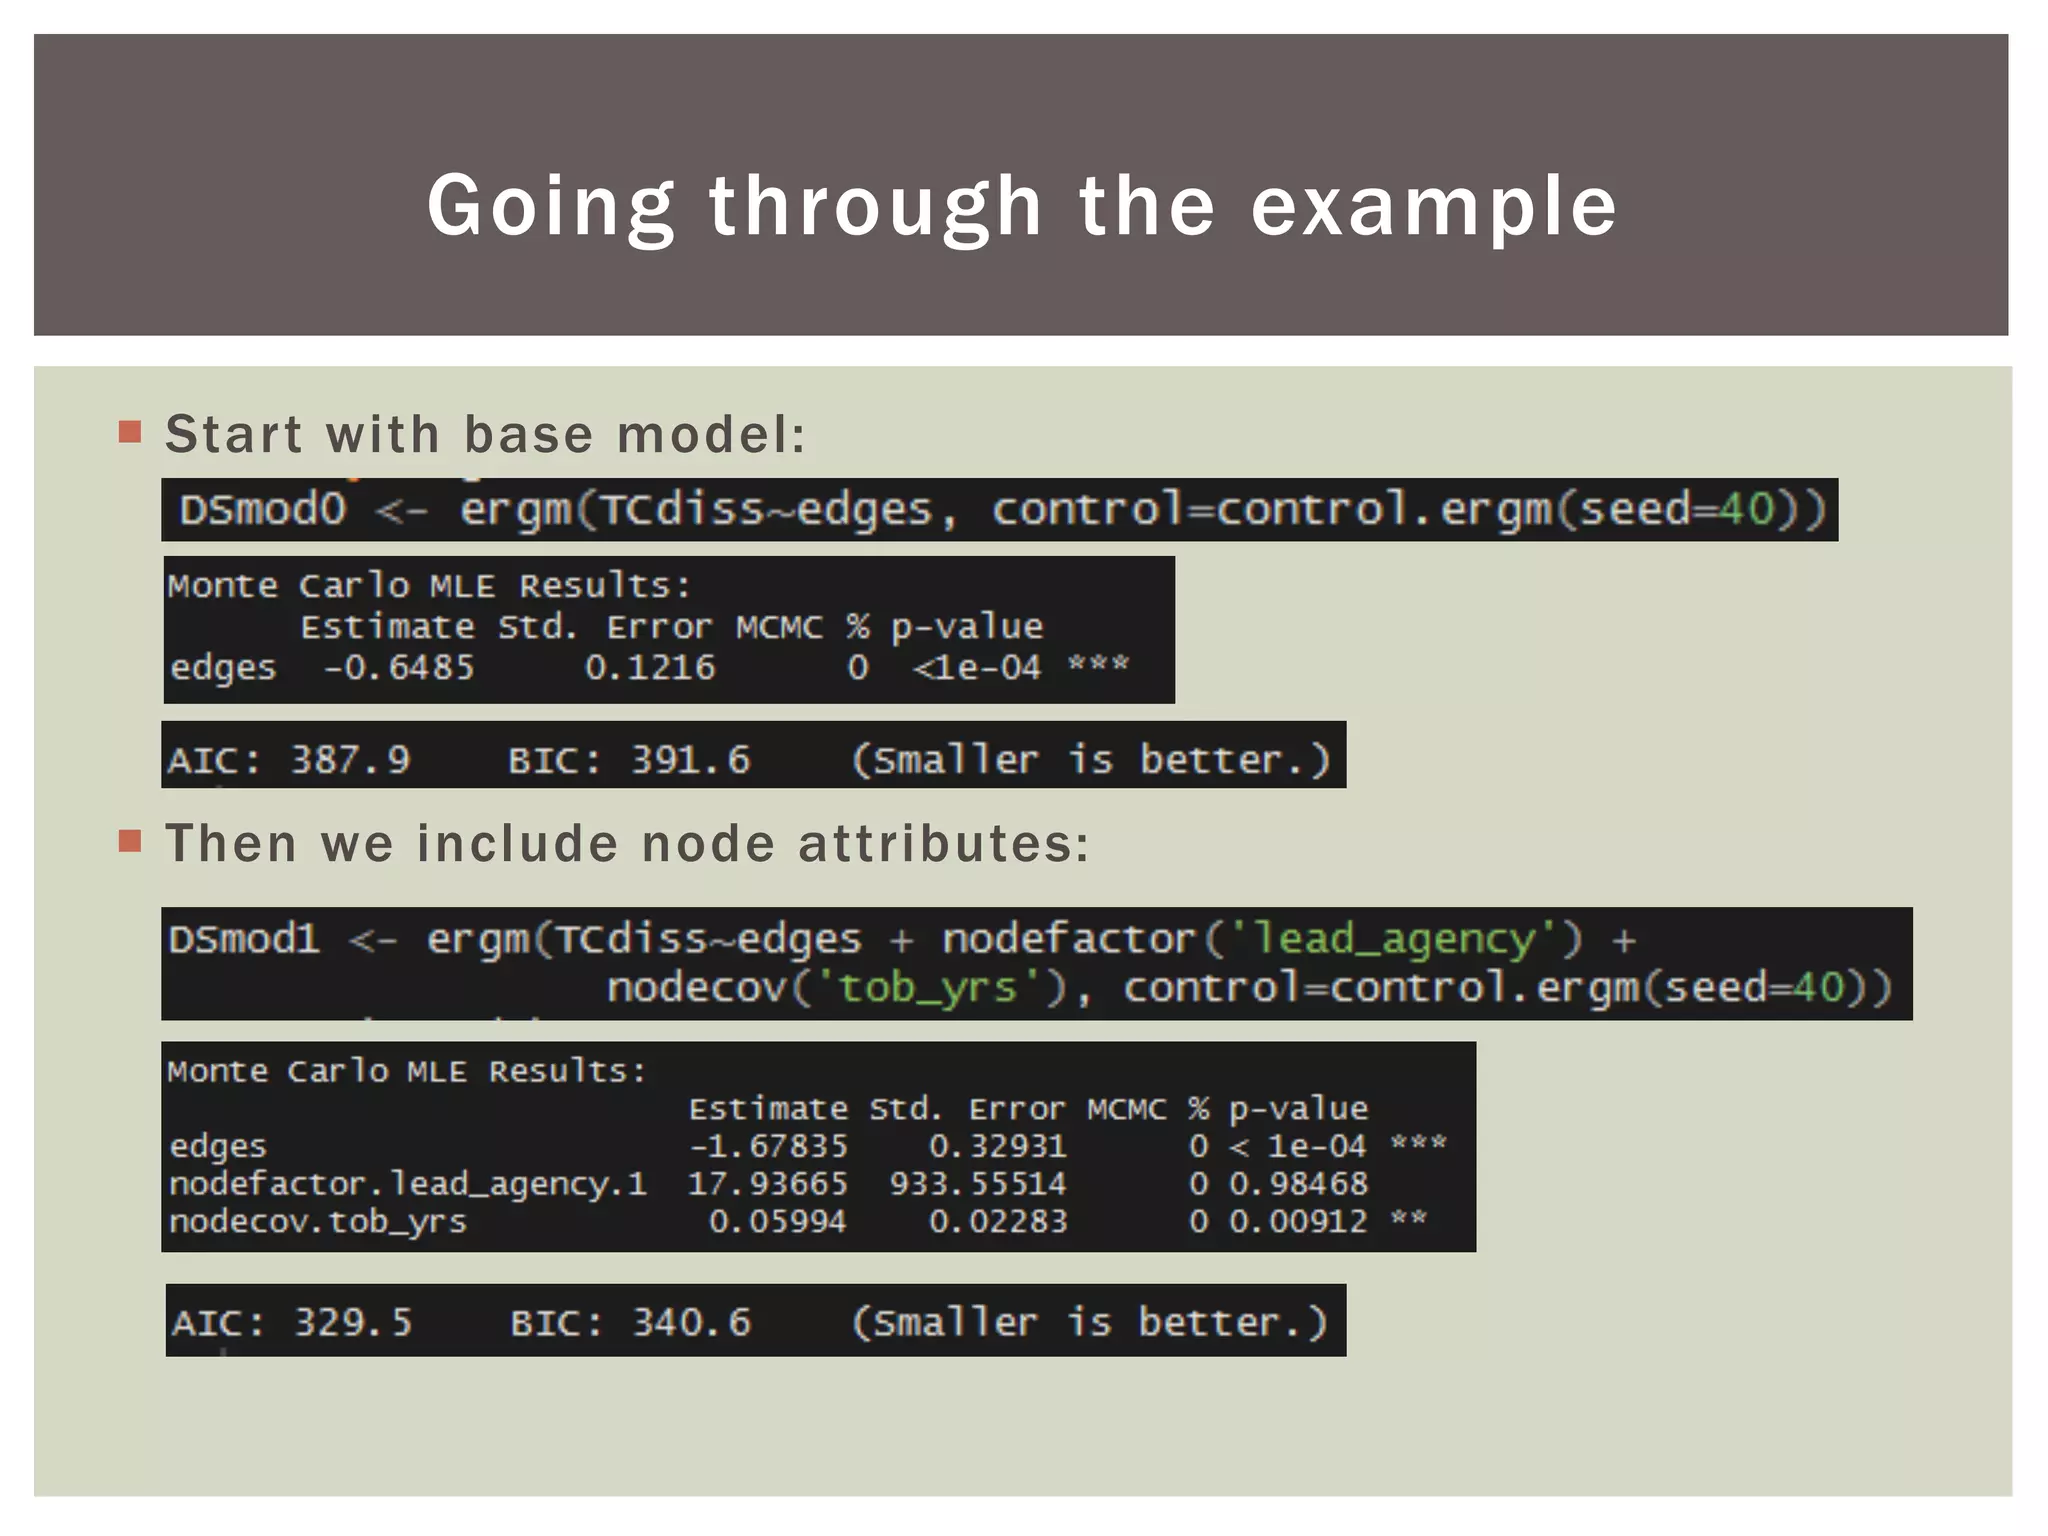
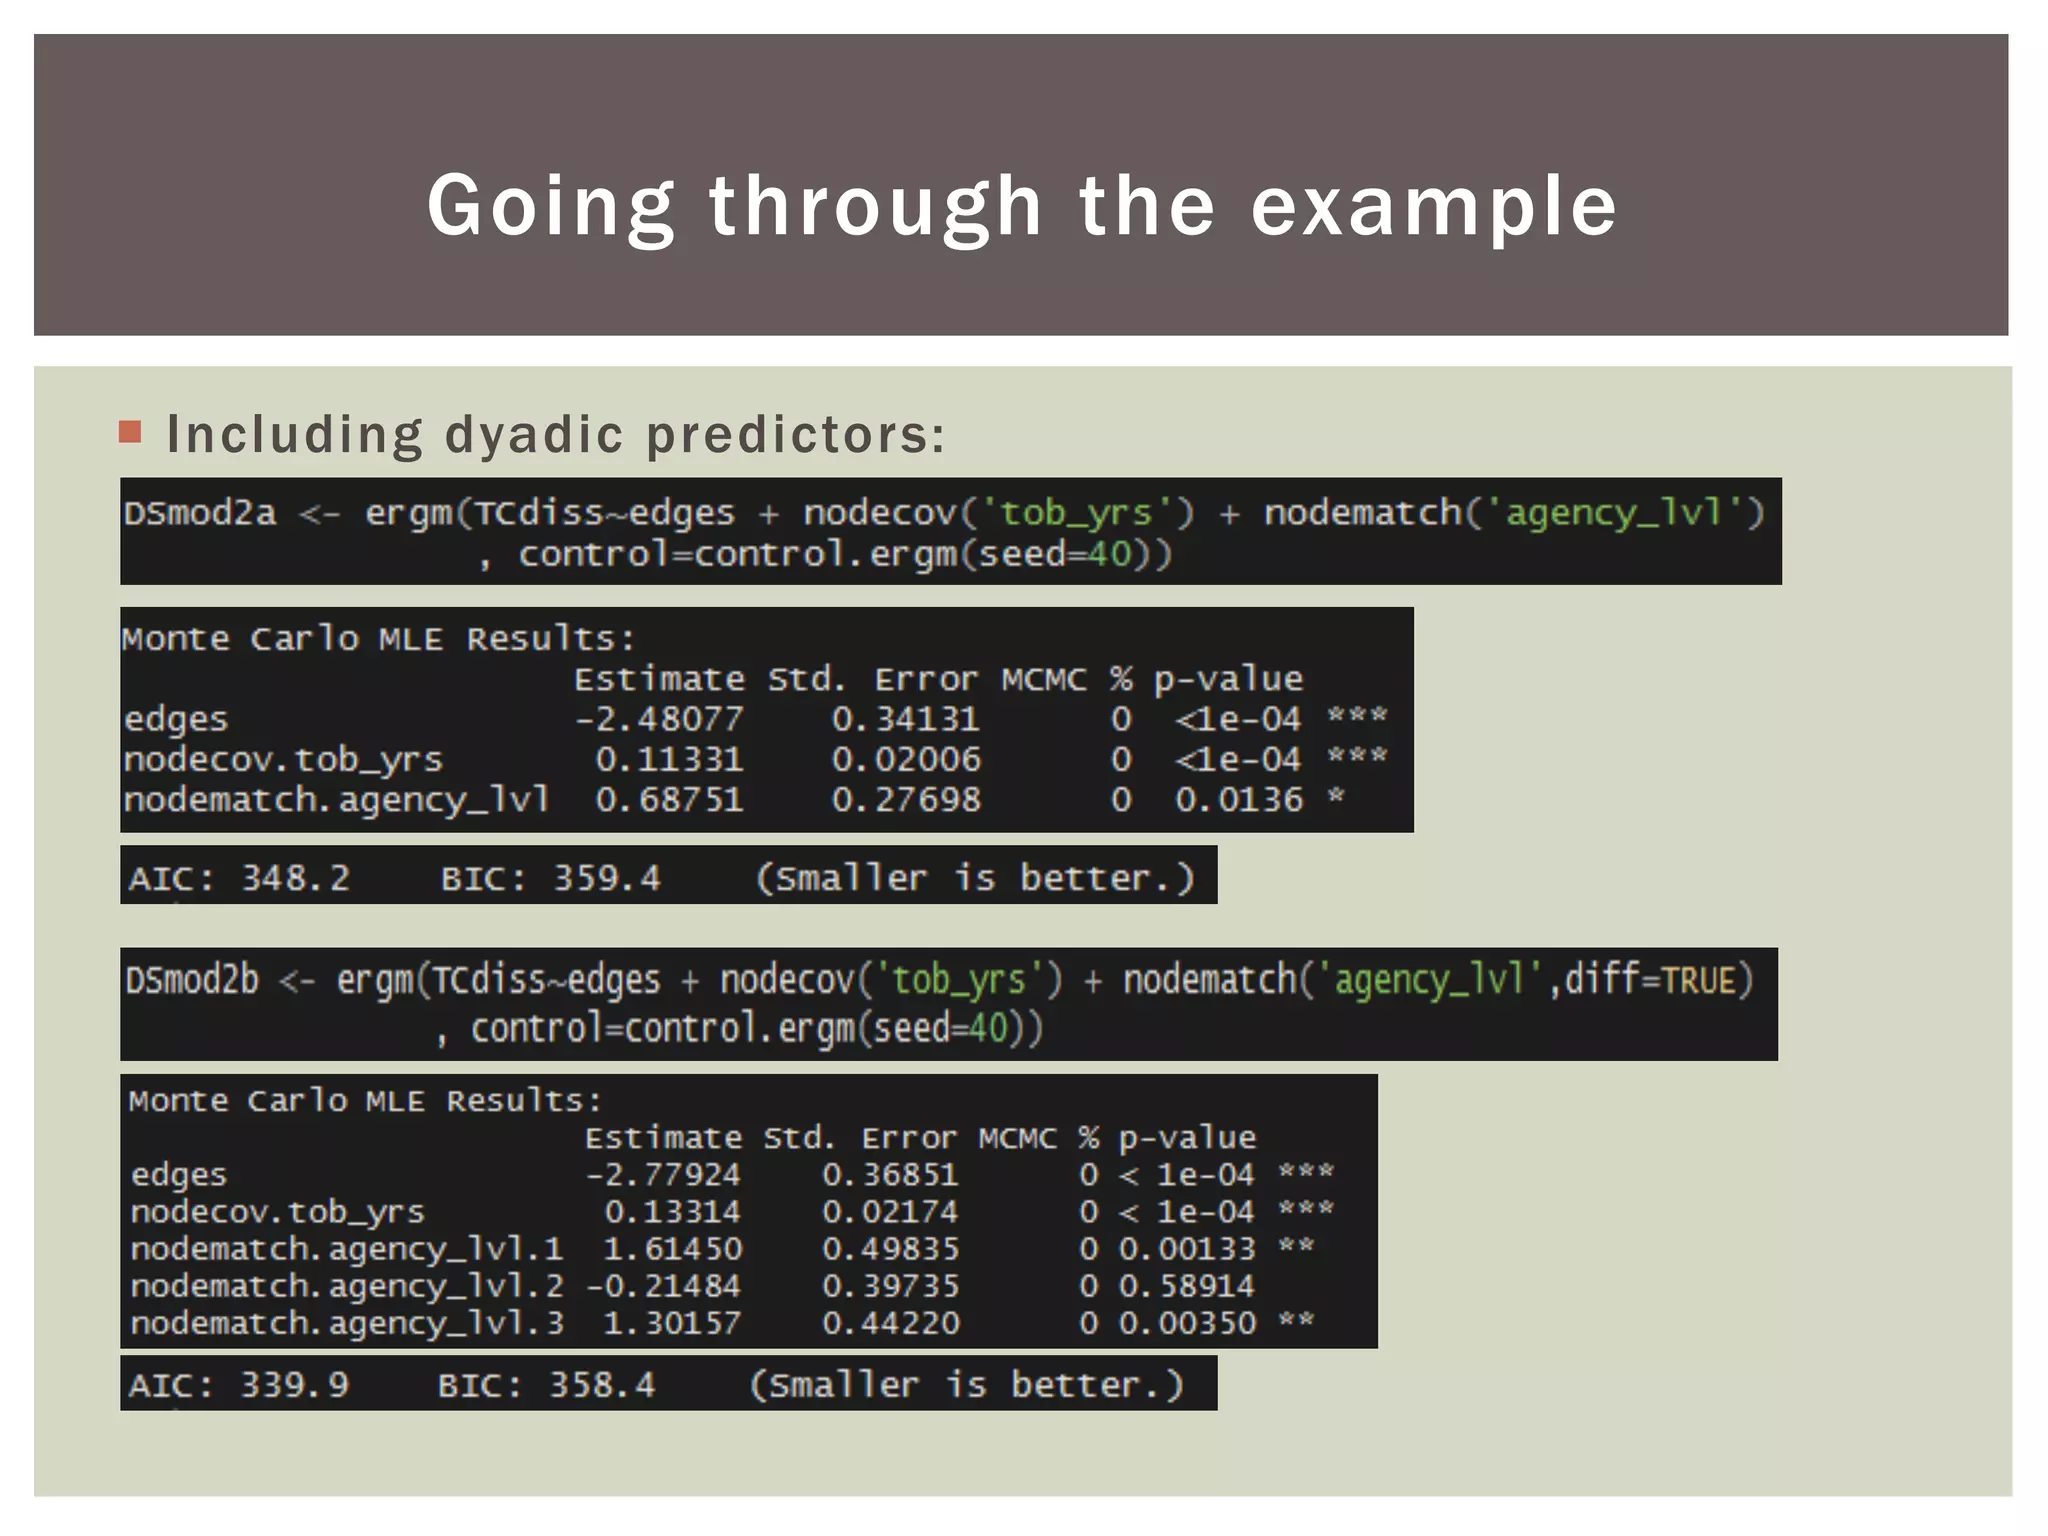
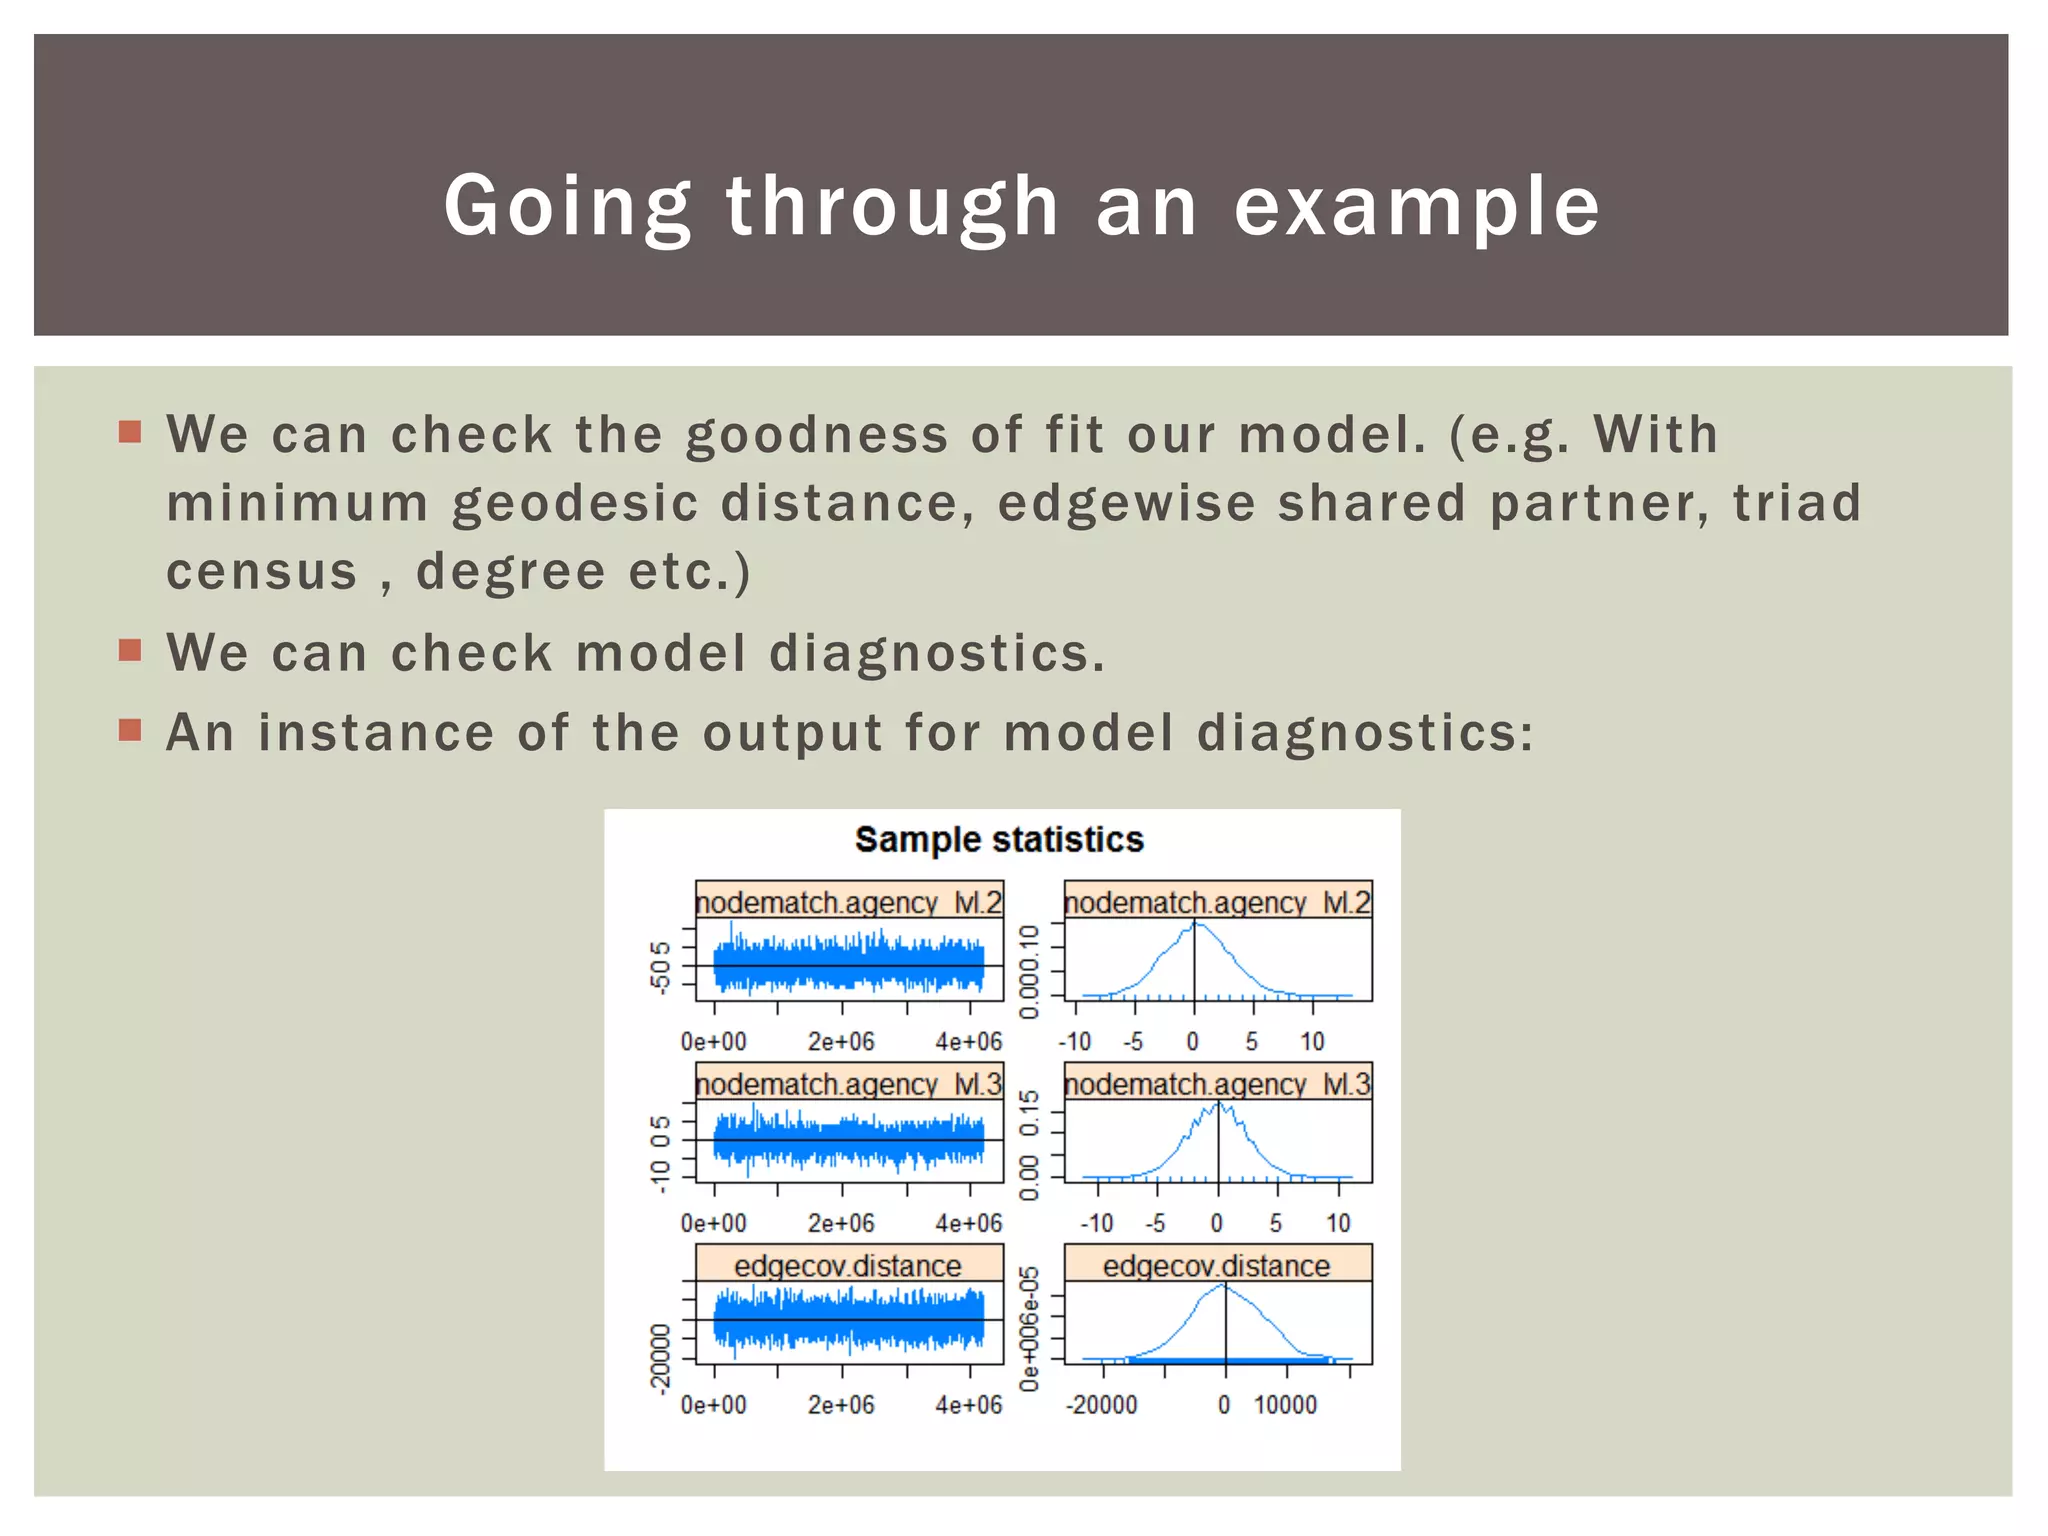
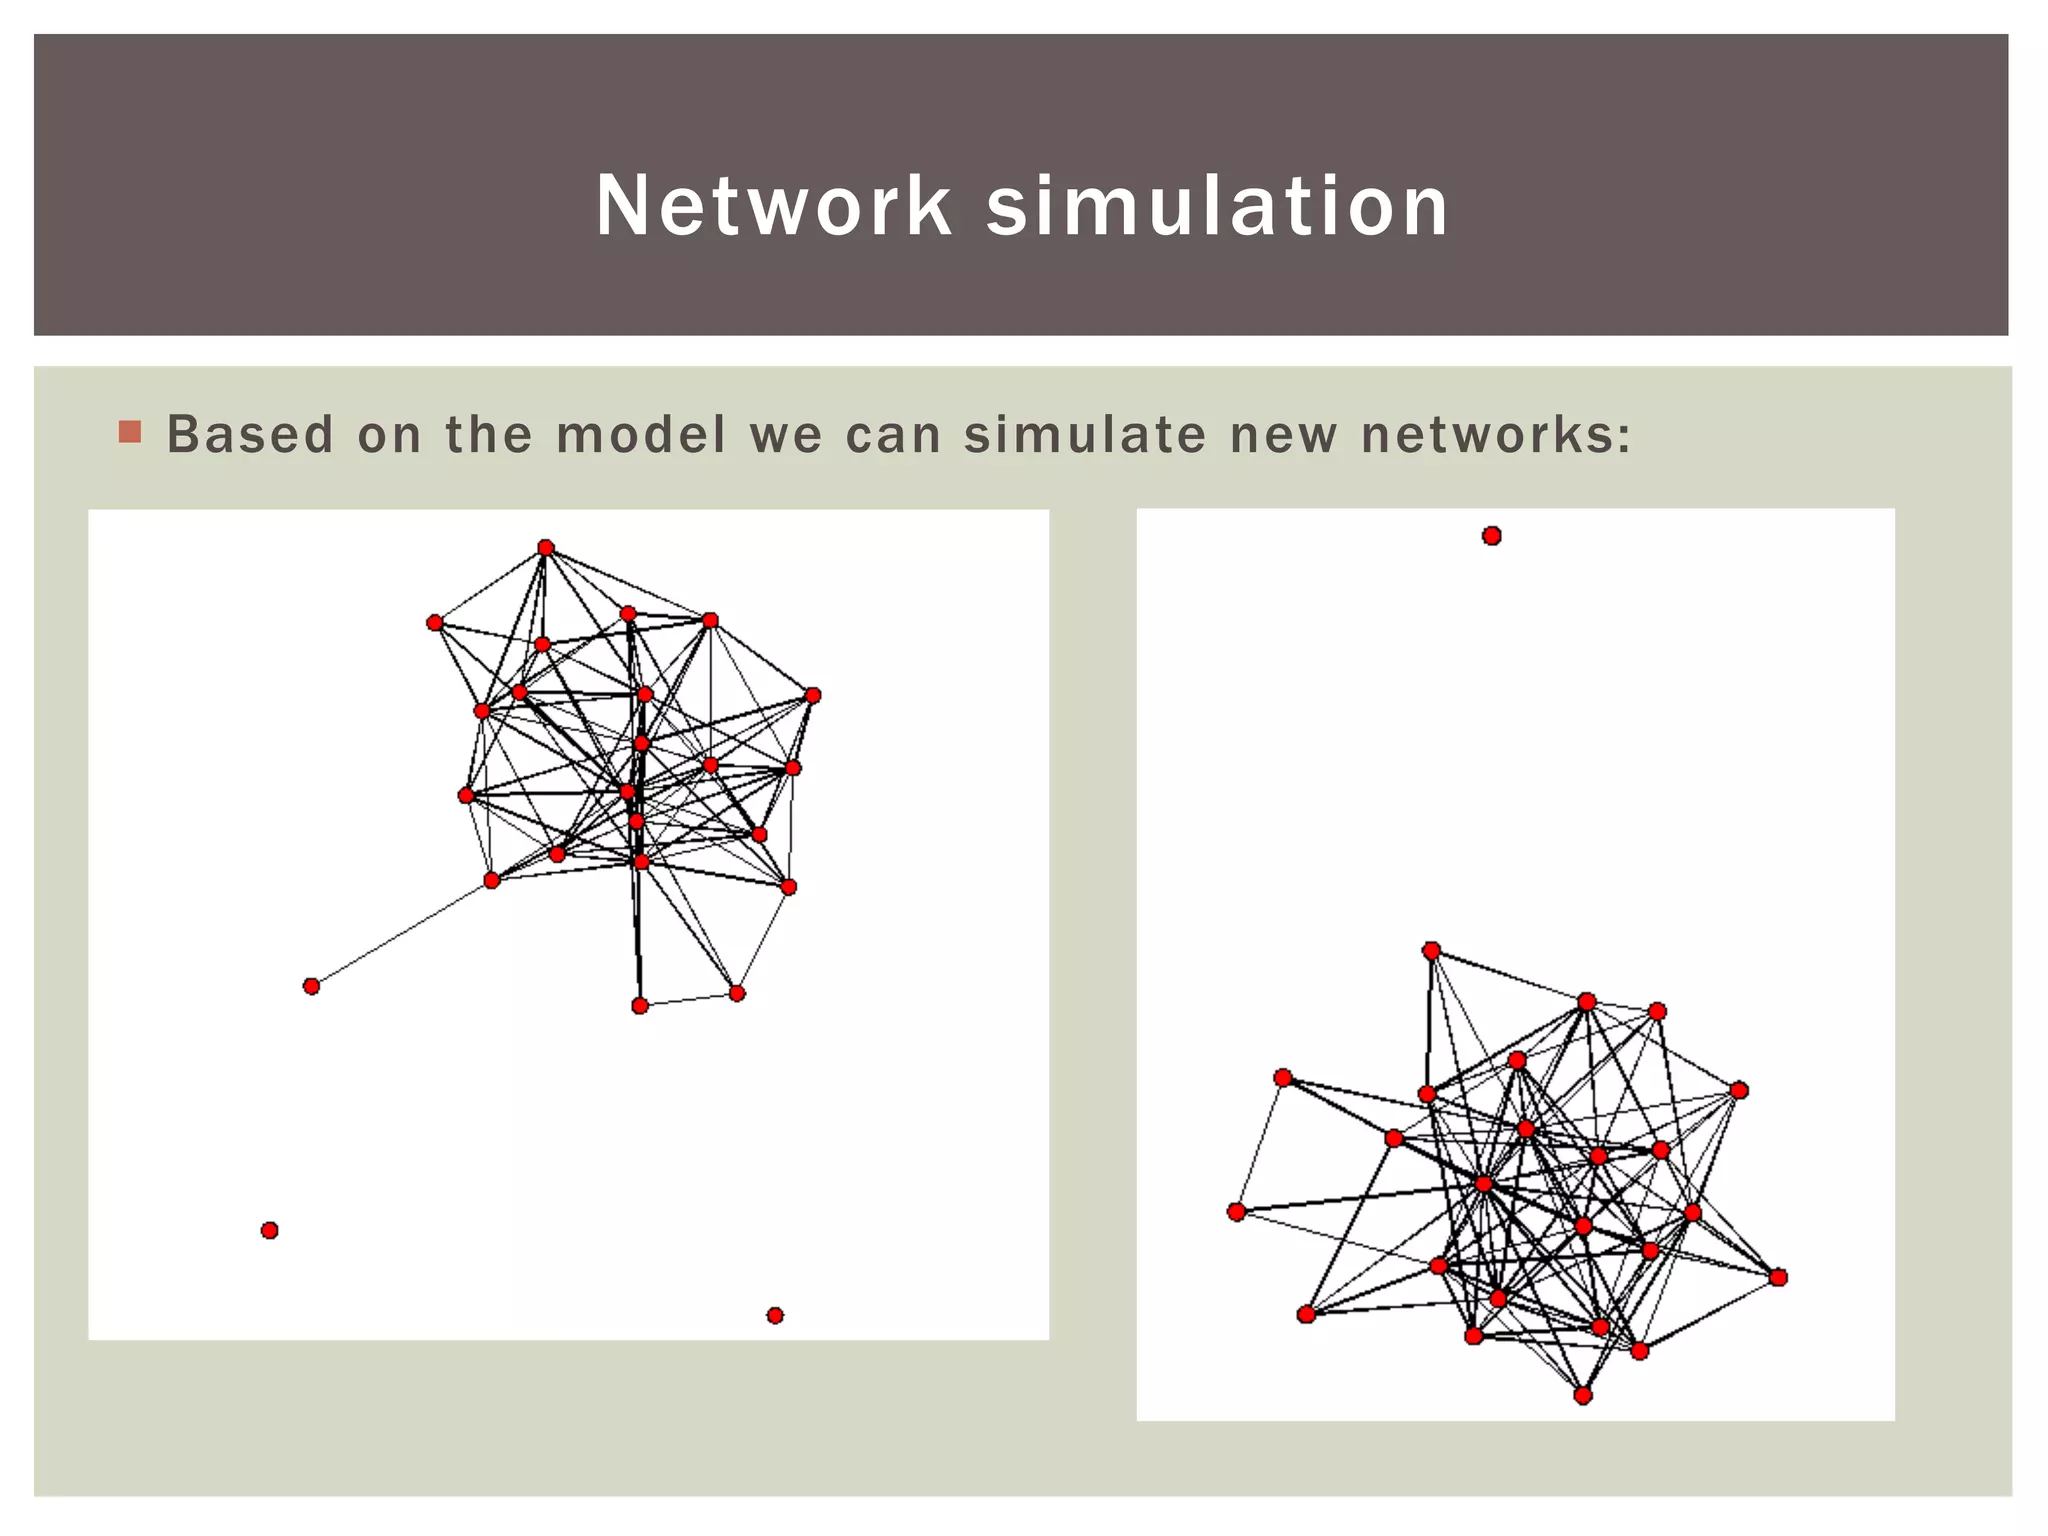


This document discusses using exponential random graph modeling to generate synthetic network data. It introduces exponential random graph models and how they use log-linear models and conditional log-odds to model network formation. An example network of tobacco control agencies is analyzed, including adding node attributes, edge attributes, and structural effects to the model. Model diagnostics and goodness of fit are evaluated. Finally, the trained model can be used to simulate new synthetic networks.