Weather & Transportation Streaming the Data, Finding Correlations Provide capability to Data for Democracy democratizing_weather_data University of Washington Professional & Continuing Education BIG DATA 230 B Su 17: Emerging Technologies In Big Data Team D-Hawks John Bever, Karunakar Kotha, Leo Salemann, Shiva Vuppala, Wenfan Xu
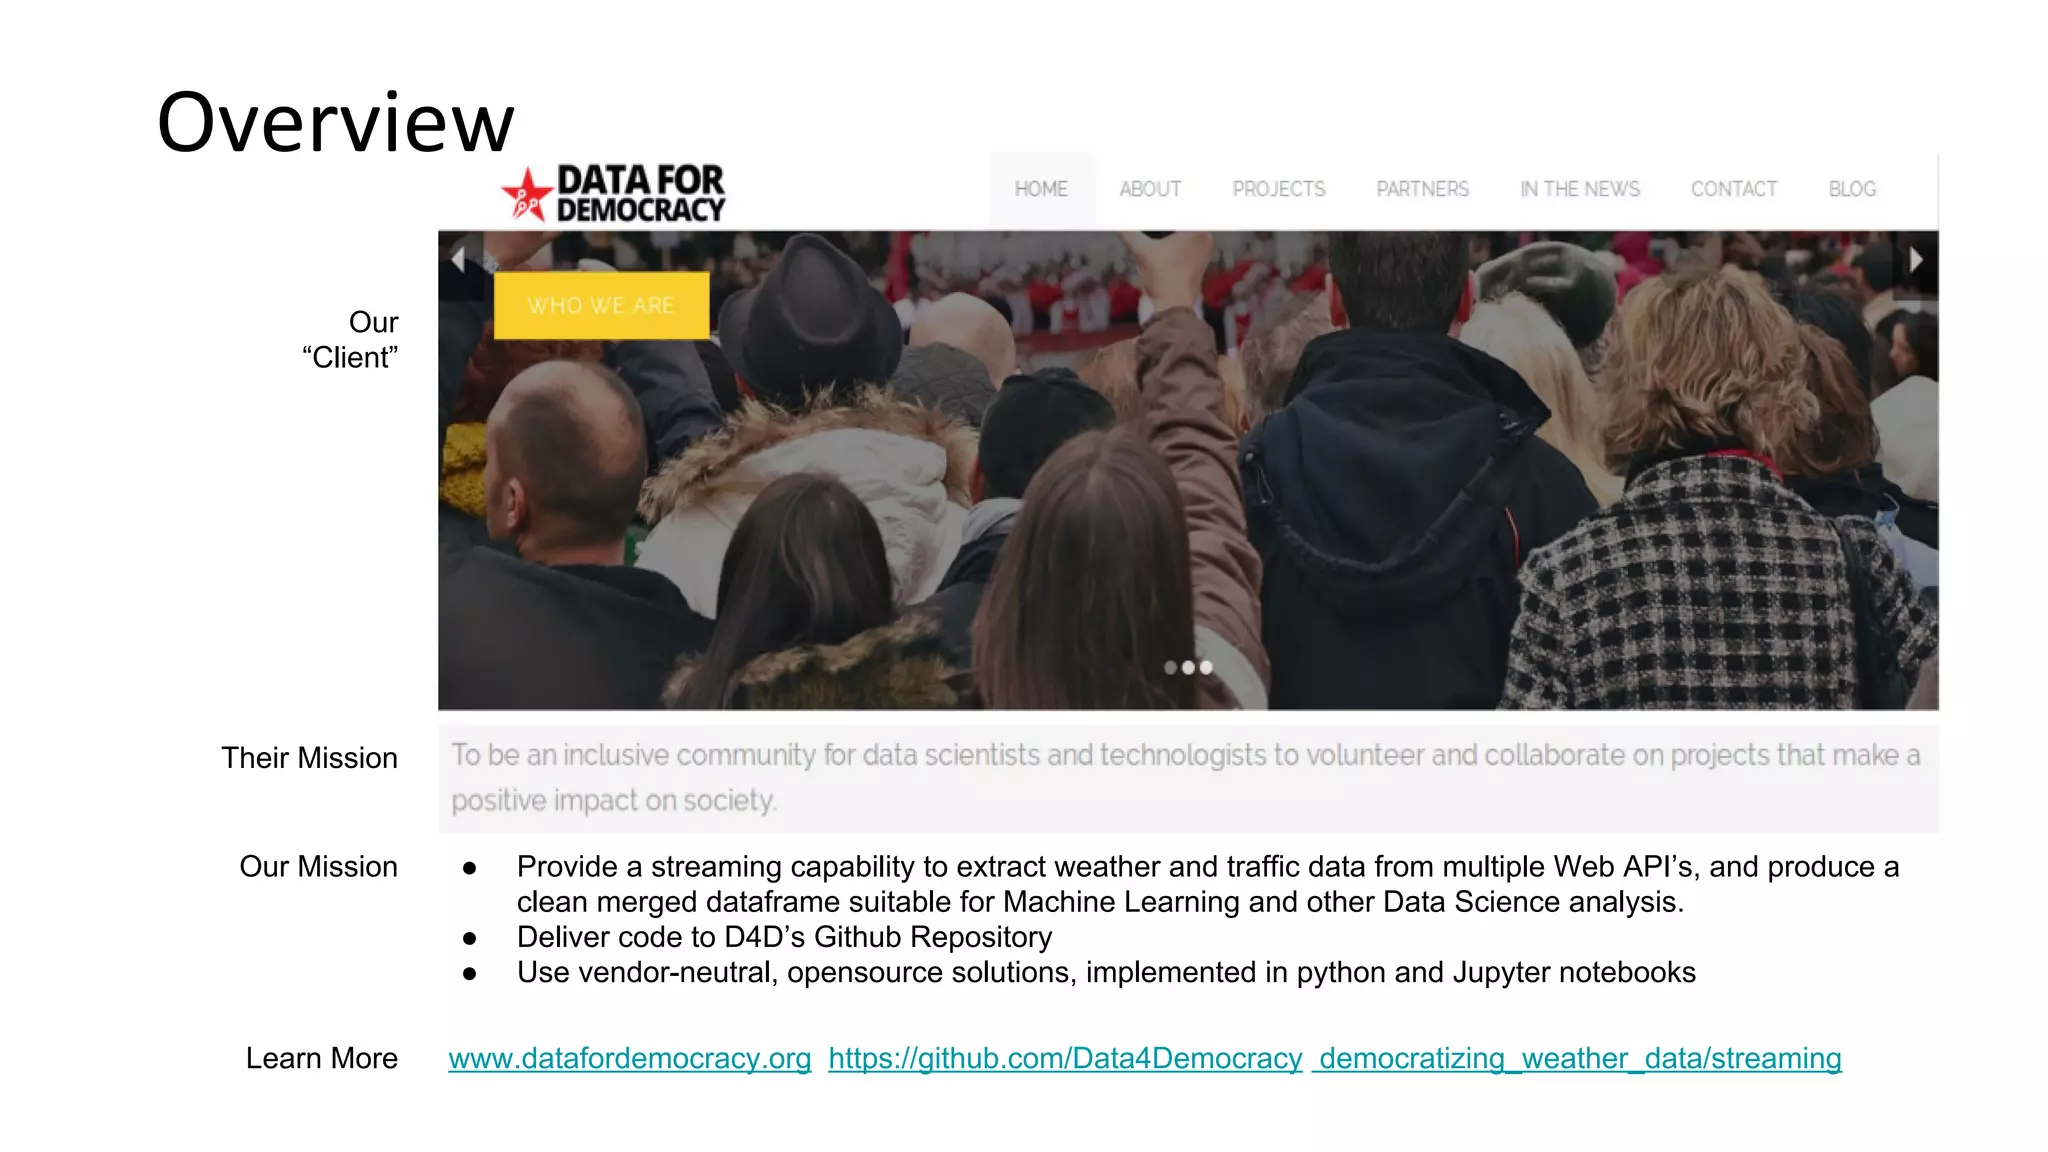
Overview Our “Client” Their Mission Learn More www.datafordemocracy.org https://github.com/Data4Democracy democratizing_weather_data/streaming Our Mission ● Provide a streaming capability to extract weather and traffic data from multiple Web API’s, and produce a clean merged dataframe suitable for Machine Learning and other Data Science analysis. ● Deliver code to D4D’s Github Repository ● Use vendor-neutral, opensource solutions, implemented in python and Jupyter notebooks
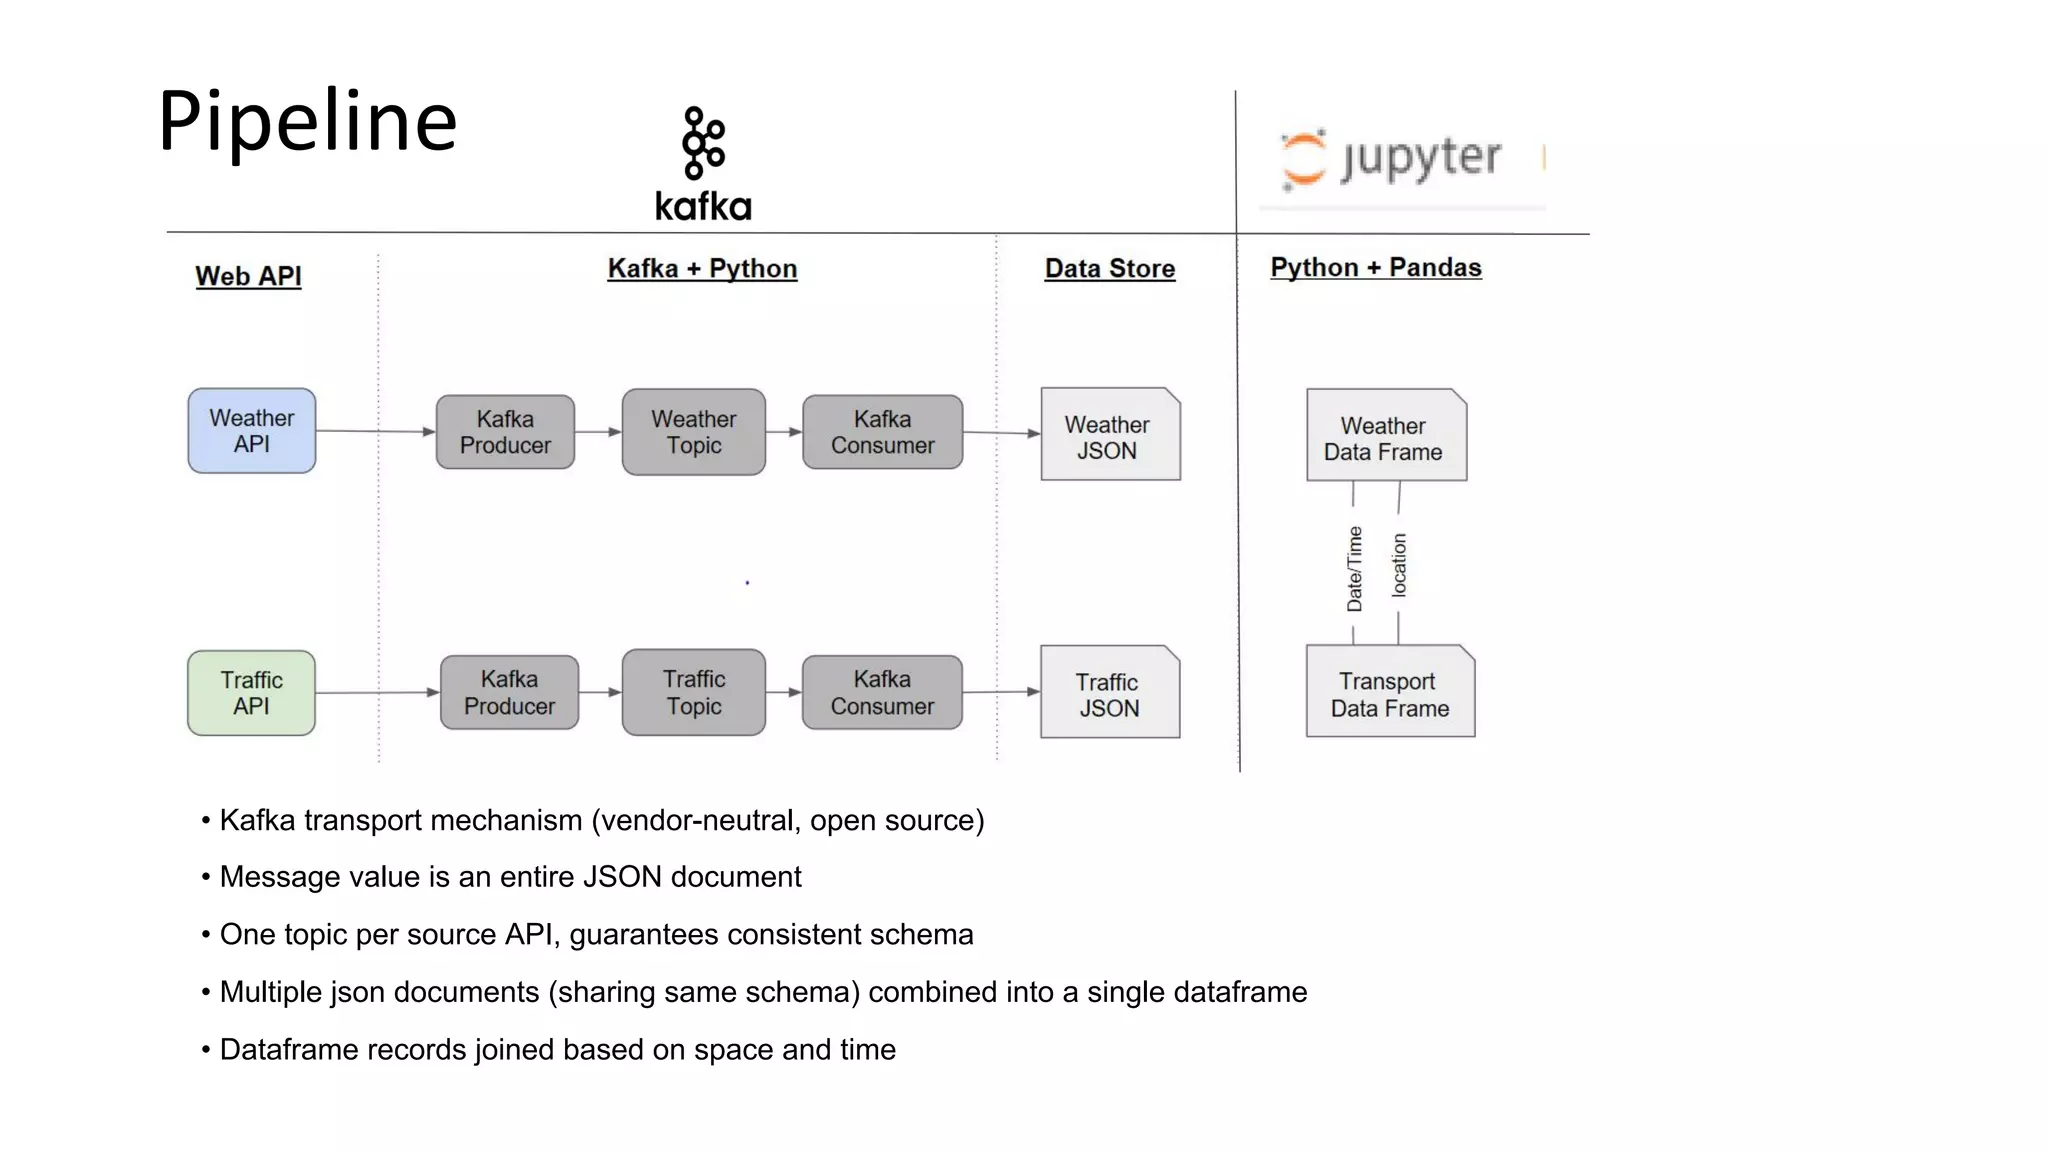
Pipeline • Kafka transport mechanism (vendor-neutral, open source) • Message value is an entire JSON document • One topic per source API, guarantees consistent schema • Multiple json documents (sharing same schema) combined into a single dataframe • Dataframe records joined based on space and time
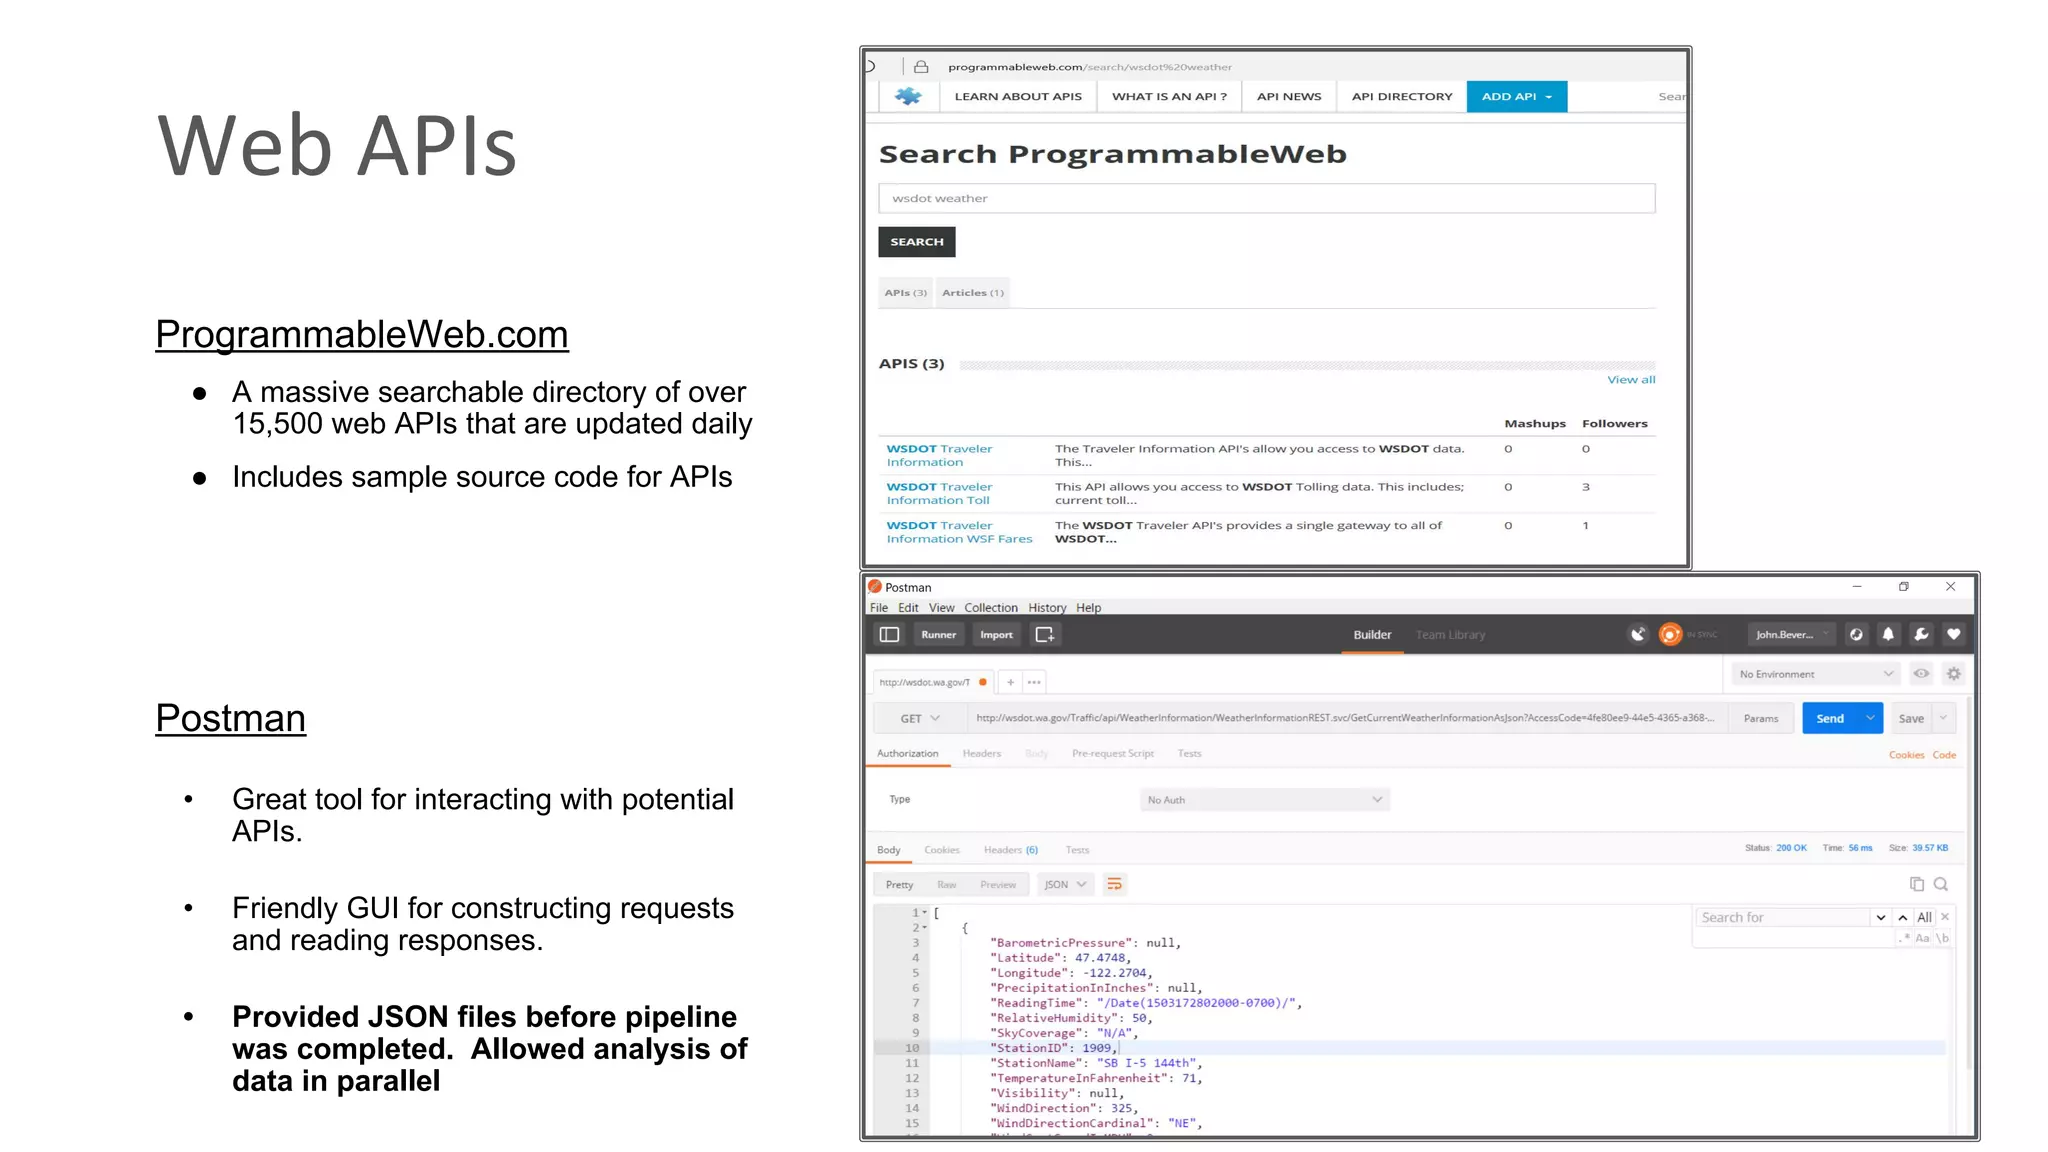
Web APIs Postman • Great tool for interacting with potential APIs. • Friendly GUI for constructing requests and reading responses. • Provided JSON files before pipeline was completed. Allowed analysis of data in parallel ProgrammableWeb.com ● A massive searchable directory of over 15,500 web APIs that are updated daily ● Includes sample source code for APIs
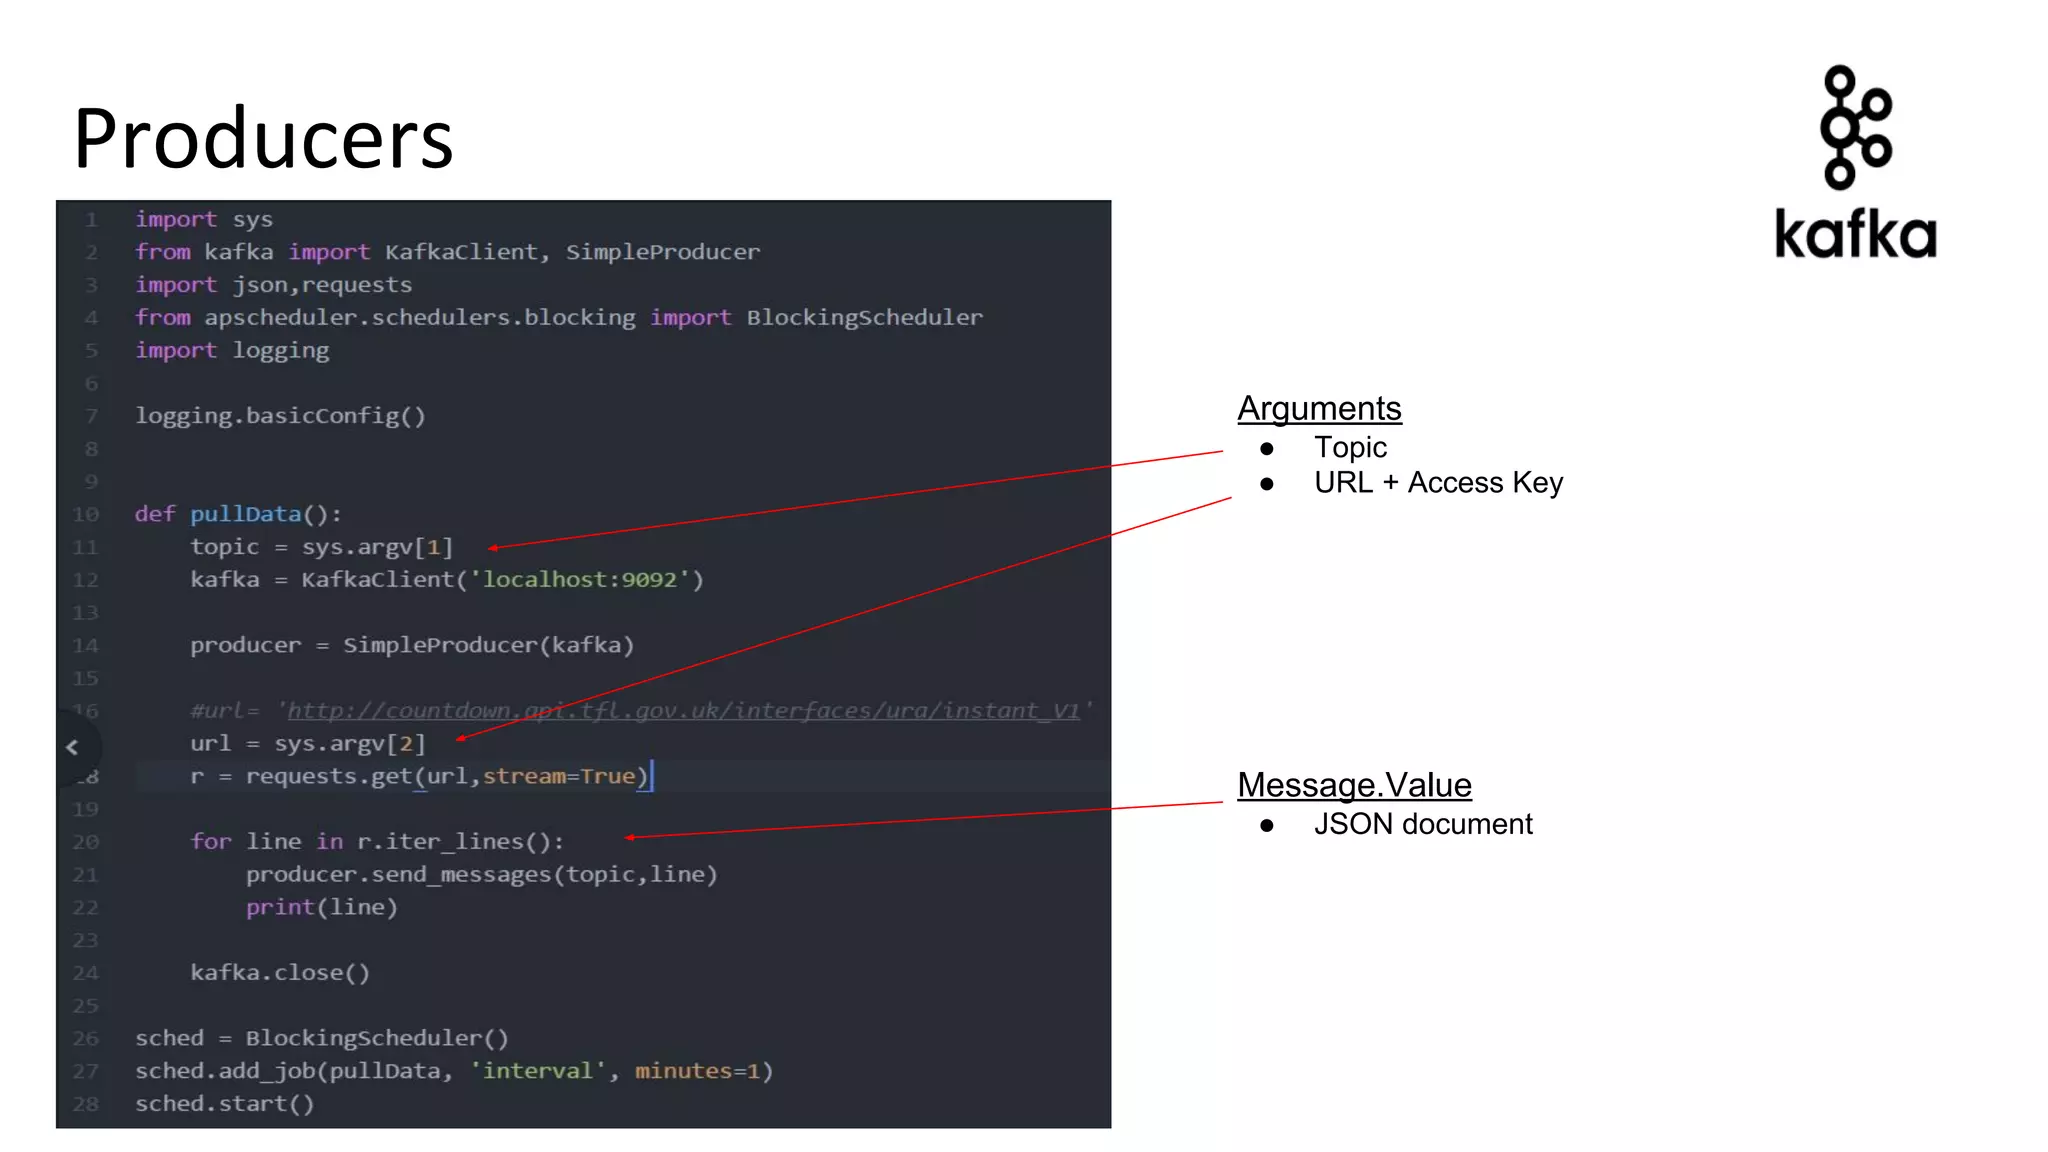
Producers Arguments ● Topic ● URL + Access Key Message.Value ● JSON document
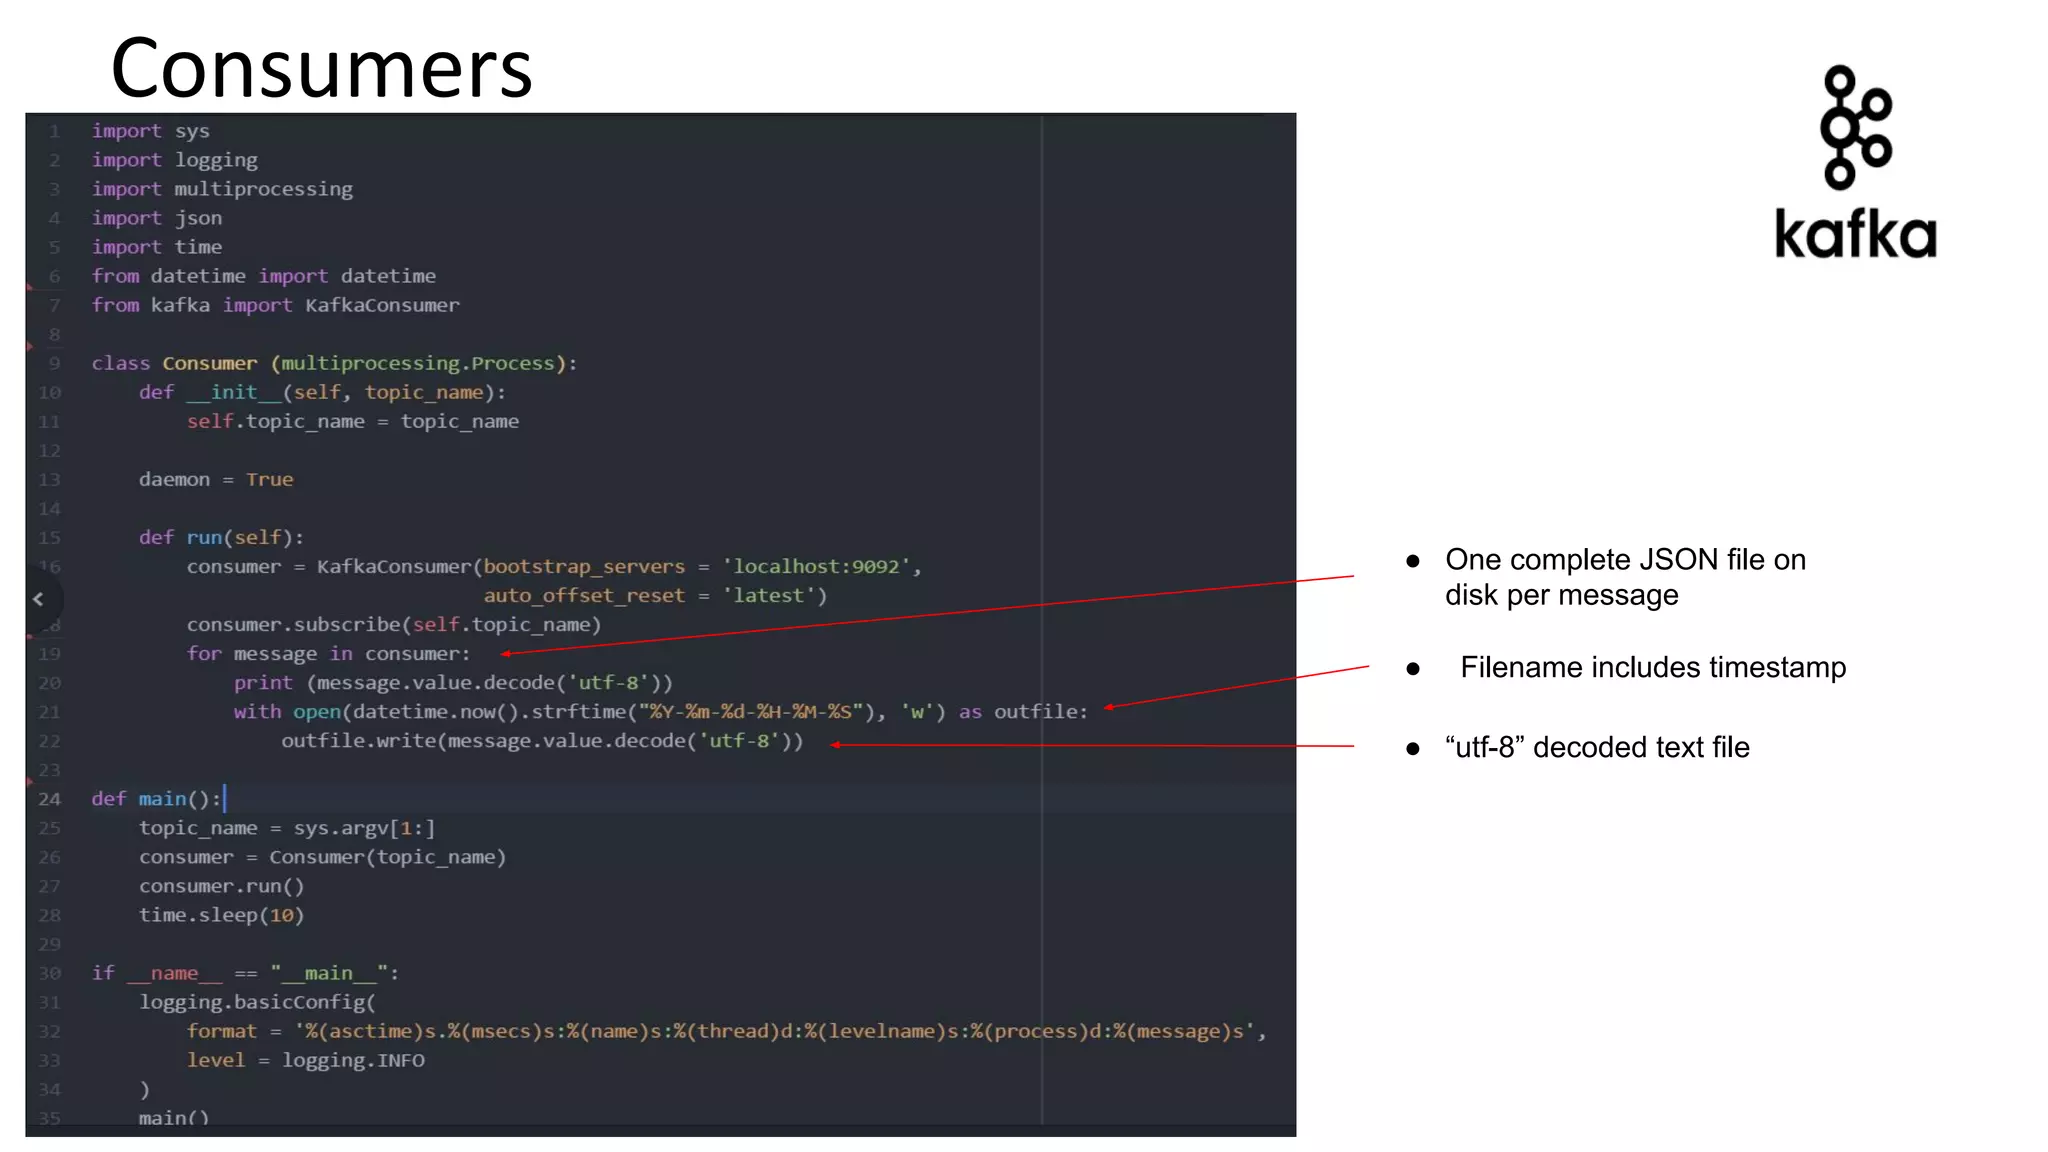
Consumers ● Filename includes timestamp ● “utf-8” decoded text file ● One complete JSON file on disk per message
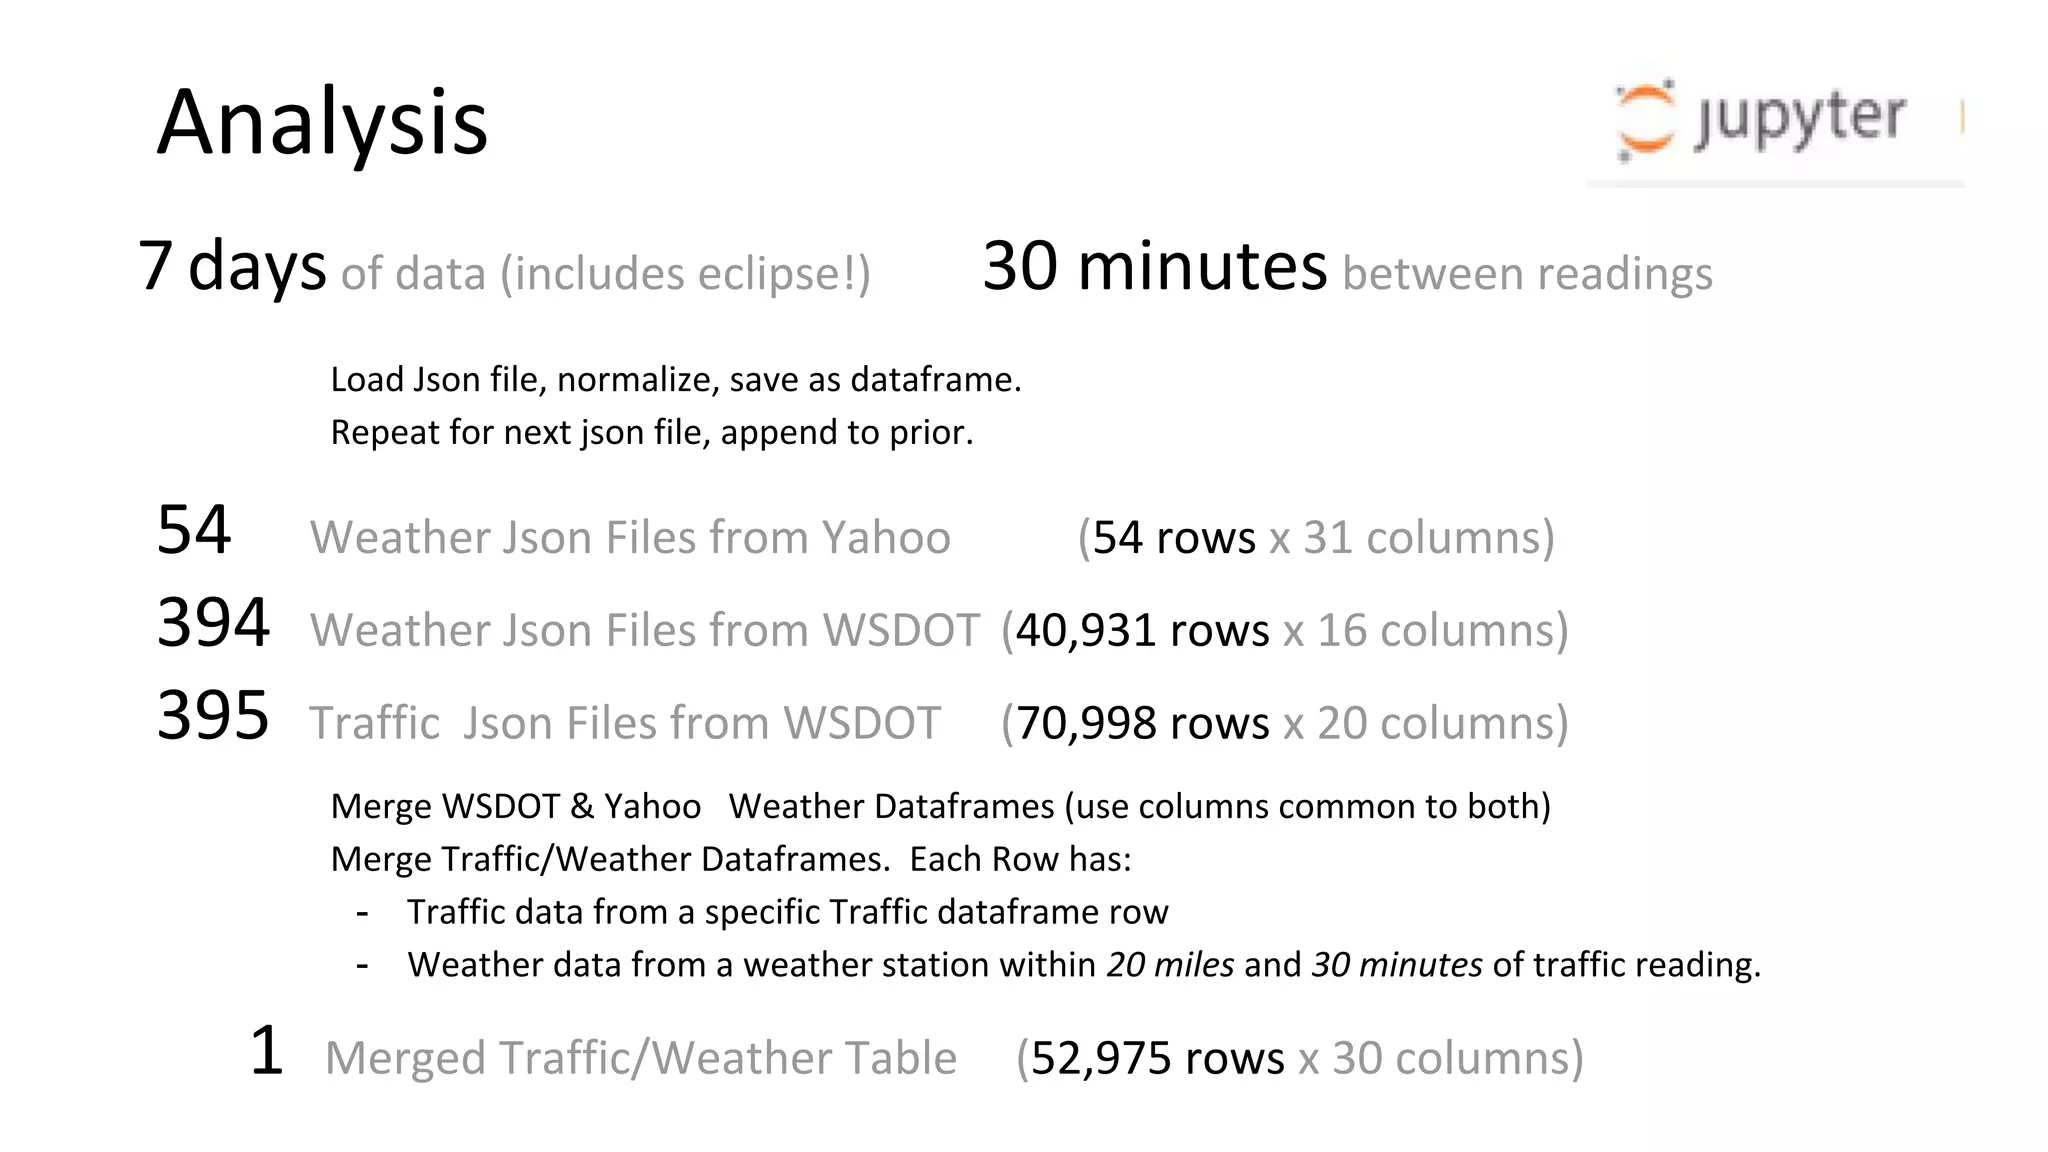
Analysis Load Json file, normalize, save as dataframe. Repeat for next json file, append to prior. 7 days of data (includes eclipse!) 30 minutes between readings 1 Merged Traffic/Weather Table (52,975 rows x 30 columns) 54 Weather Json Files from Yahoo (54 rows x 31 columns) 394 Weather Json Files from WSDOT (40,931 rows x 16 columns) 395 Traffic Json Files from WSDOT (70,998 rows x 20 columns) Merge WSDOT & Yahoo Weather Dataframes (use columns common to both) Merge Traffic/Weather Dataframes. Each Row has: - Traffic data from a specific Traffic dataframe row - Weather data from a weather station within 20 miles and 30 minutes of traffic reading.
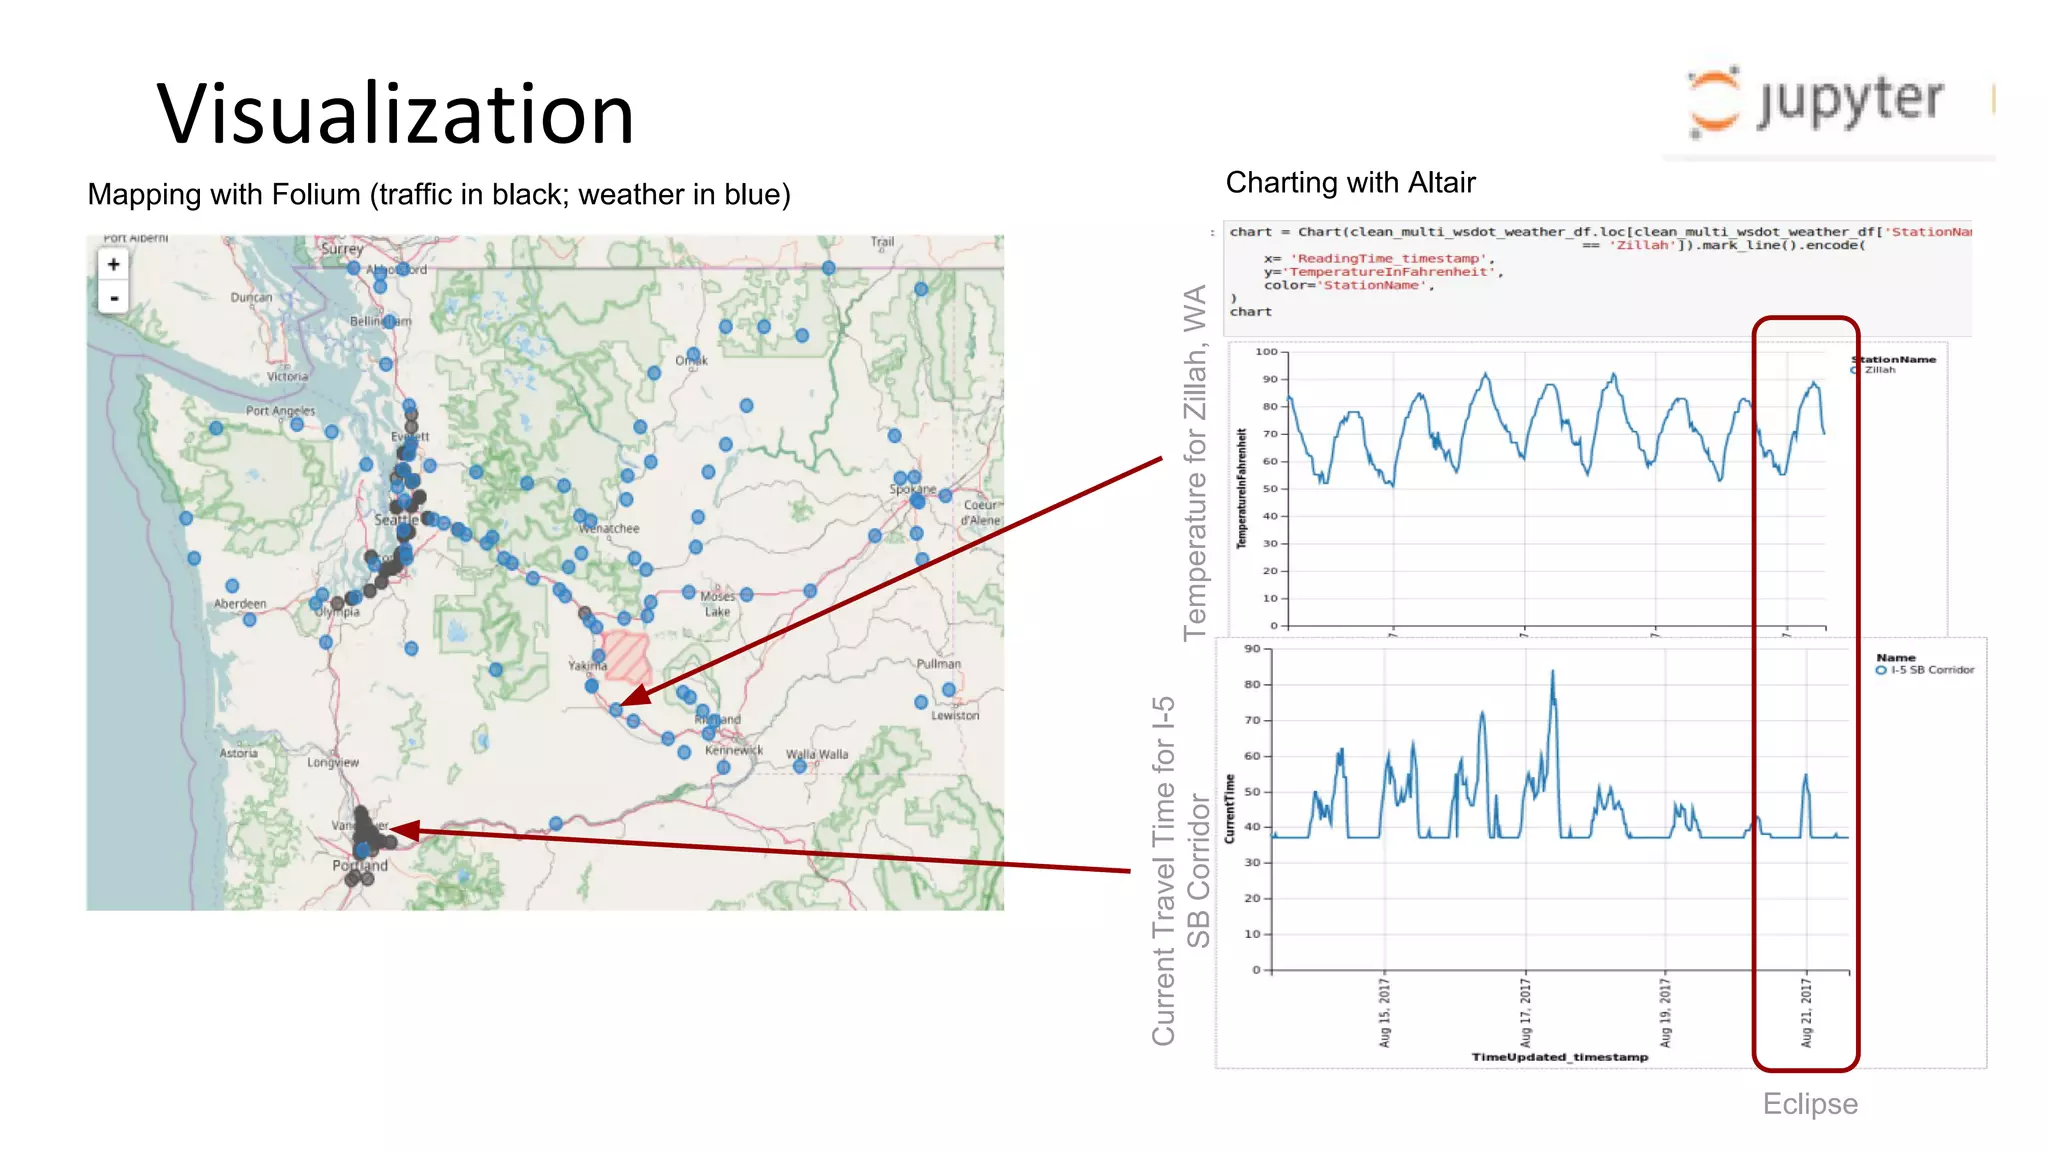
Visualization Charting with AltairMapping with Folium (traffic in black; weather in blue) TemperatureforZillah,WA CurrentTravelTimeforI-5 SBCorridor Eclipse
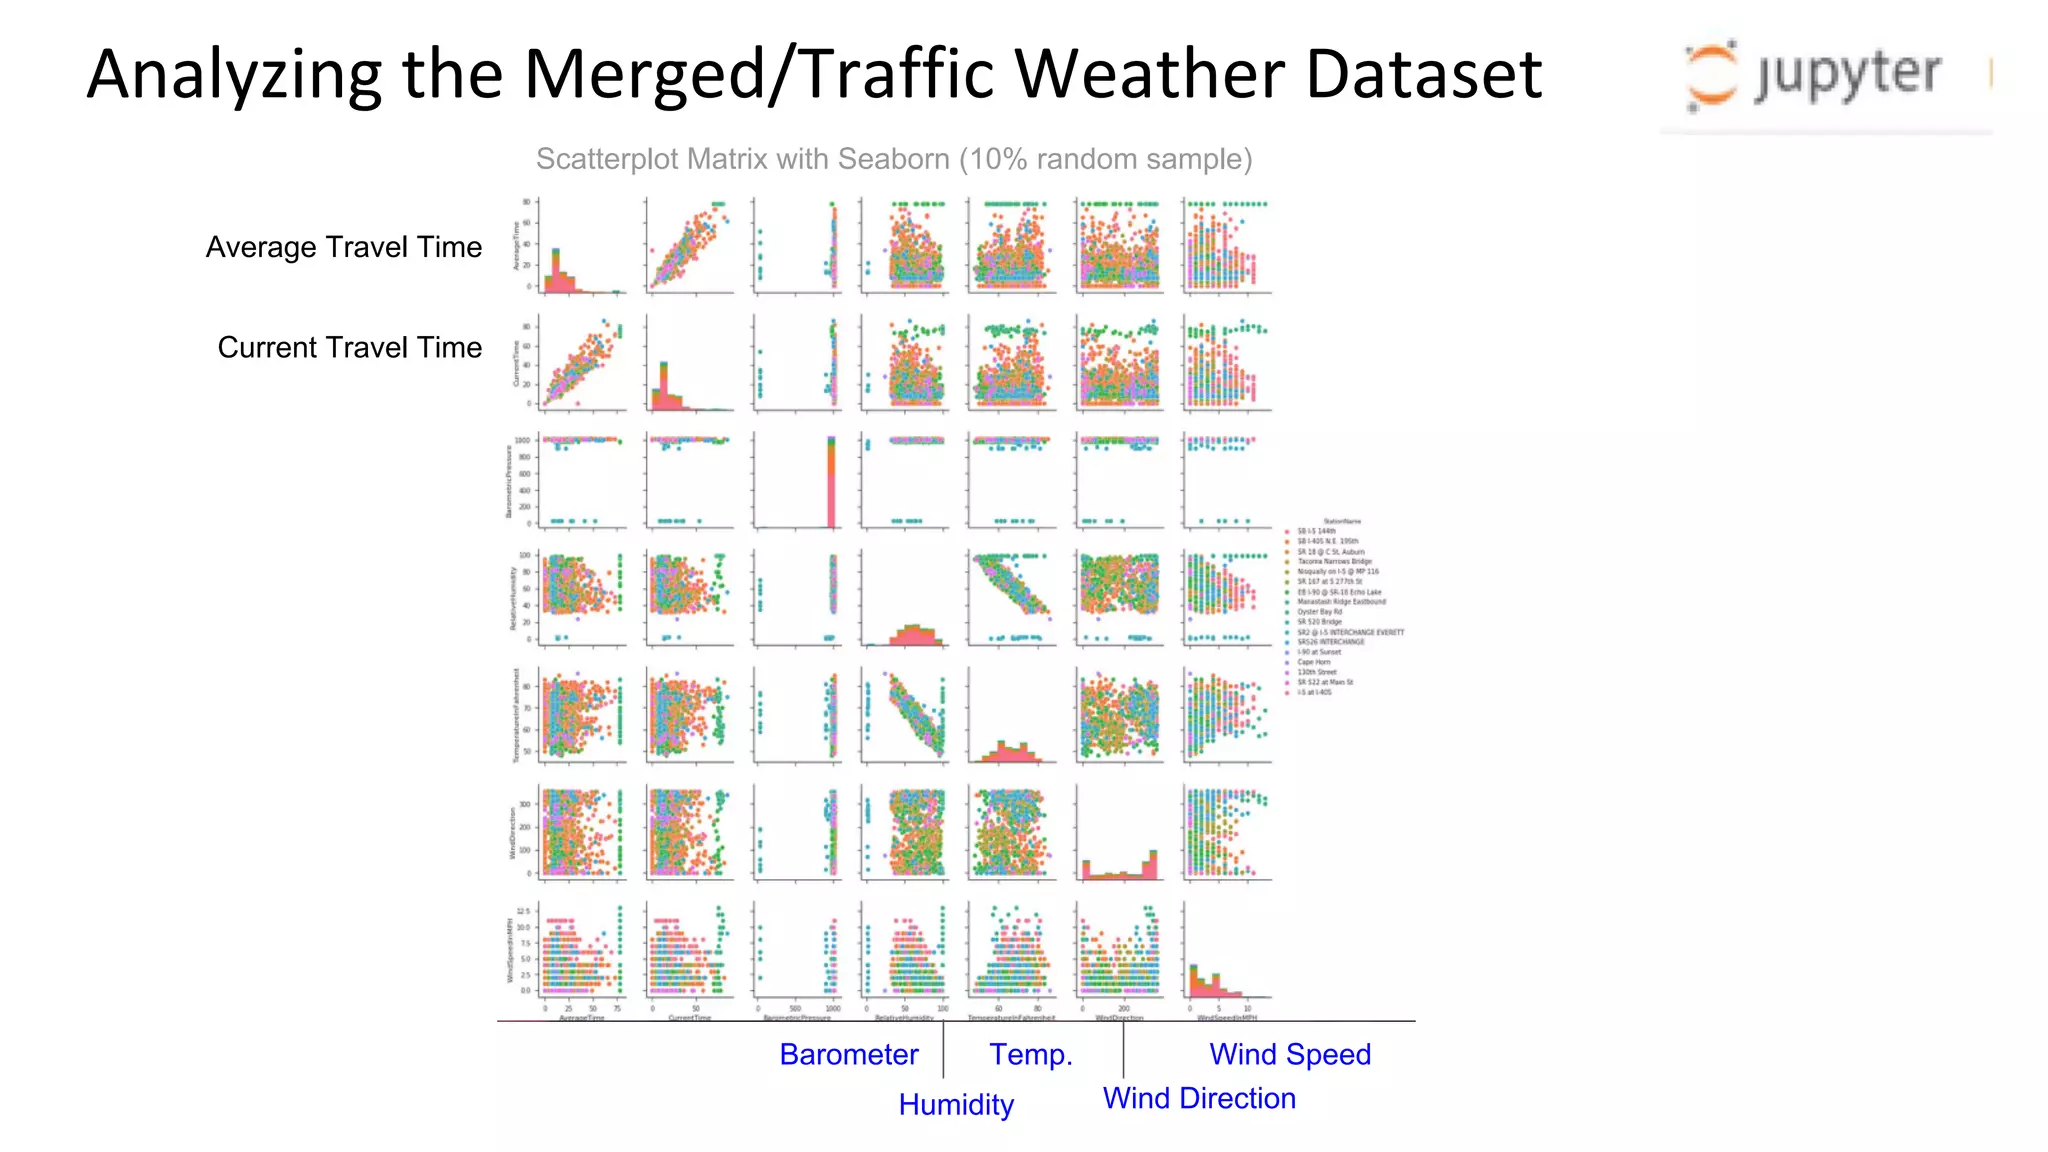
Analyzing the Merged/Traffic Weather Dataset Scatterplot Matrix with Seaborn (10% random sample) Average Travel Time Current Travel Time Wind Direction Wind SpeedTemp. Humidity Barometer
Wrapping Up ... Key Takeaways • Choose your python libraries carefully (2 lines of code for a fully-labeled lineplot vs. dozens) • Spatial plots first, data-joins later (I-5 traffic data vs. statewide weather, also Portland) • The fastest way to count records in a dataframe is df.shape[0] Conclusion • Data for Democracy has a repeatable way to extract weather and transportation data from WSDOT and Yahoo • Jupyter Notebook provides a teaching/coding environment • Bitnami provides low-cost simple Kafka infrastructure Further Work • Upload csv and zipped json’s to data.world • Better parameters for Producer scripts (ex. Longitude, Latitude, Date, Time) • Config files for access keys • More matrix plots, Data Science, Machine Learning •Gather data for longer time frames (fewer readings per day?) •Isolate matrix plots to specific locations and/or time.
THANKYOU!

Streaming Weather Data from Web APIs to Jupyter through Kafka

  • 1.
    Weather & Transportation Streamingthe Data, Finding Correlations Provide capability to Data for Democracy democratizing_weather_data University of Washington Professional & Continuing Education BIG DATA 230 B Su 17: Emerging Technologies In Big Data Team D-Hawks John Bever, Karunakar Kotha, Leo Salemann, Shiva Vuppala, Wenfan Xu
  • 2.
    Overview Our “Client” Their Mission Learn Morewww.datafordemocracy.org https://github.com/Data4Democracy democratizing_weather_data/streaming Our Mission ● Provide a streaming capability to extract weather and traffic data from multiple Web API’s, and produce a clean merged dataframe suitable for Machine Learning and other Data Science analysis. ● Deliver code to D4D’s Github Repository ● Use vendor-neutral, opensource solutions, implemented in python and Jupyter notebooks
  • 3.
    Pipeline • Kafka transportmechanism (vendor-neutral, open source) • Message value is an entire JSON document • One topic per source API, guarantees consistent schema • Multiple json documents (sharing same schema) combined into a single dataframe • Dataframe records joined based on space and time
  • 4.
    Web APIs Postman • Greattool for interacting with potential APIs. • Friendly GUI for constructing requests and reading responses. • Provided JSON files before pipeline was completed. Allowed analysis of data in parallel ProgrammableWeb.com ● A massive searchable directory of over 15,500 web APIs that are updated daily ● Includes sample source code for APIs
  • 5.
    Producers Arguments ● Topic ● URL+ Access Key Message.Value ● JSON document
  • 6.
    Consumers ● Filename includestimestamp ● “utf-8” decoded text file ● One complete JSON file on disk per message
  • 7.
    Analysis Load Json file,normalize, save as dataframe. Repeat for next json file, append to prior. 7 days of data (includes eclipse!) 30 minutes between readings 1 Merged Traffic/Weather Table (52,975 rows x 30 columns) 54 Weather Json Files from Yahoo (54 rows x 31 columns) 394 Weather Json Files from WSDOT (40,931 rows x 16 columns) 395 Traffic Json Files from WSDOT (70,998 rows x 20 columns) Merge WSDOT & Yahoo Weather Dataframes (use columns common to both) Merge Traffic/Weather Dataframes. Each Row has: - Traffic data from a specific Traffic dataframe row - Weather data from a weather station within 20 miles and 30 minutes of traffic reading.
  • 8.
    Visualization Charting with AltairMappingwith Folium (traffic in black; weather in blue) TemperatureforZillah,WA CurrentTravelTimeforI-5 SBCorridor Eclipse
  • 9.
    Analyzing the Merged/TrafficWeather Dataset Scatterplot Matrix with Seaborn (10% random sample) Average Travel Time Current Travel Time Wind Direction Wind SpeedTemp. Humidity Barometer
  • 10.
    Wrapping Up ... KeyTakeaways • Choose your python libraries carefully (2 lines of code for a fully-labeled lineplot vs. dozens) • Spatial plots first, data-joins later (I-5 traffic data vs. statewide weather, also Portland) • The fastest way to count records in a dataframe is df.shape[0] Conclusion • Data for Democracy has a repeatable way to extract weather and transportation data from WSDOT and Yahoo • Jupyter Notebook provides a teaching/coding environment • Bitnami provides low-cost simple Kafka infrastructure Further Work • Upload csv and zipped json’s to data.world • Better parameters for Producer scripts (ex. Longitude, Latitude, Date, Time) • Config files for access keys • More matrix plots, Data Science, Machine Learning •Gather data for longer time frames (fewer readings per day?) •Isolate matrix plots to specific locations and/or time.
  • 11.