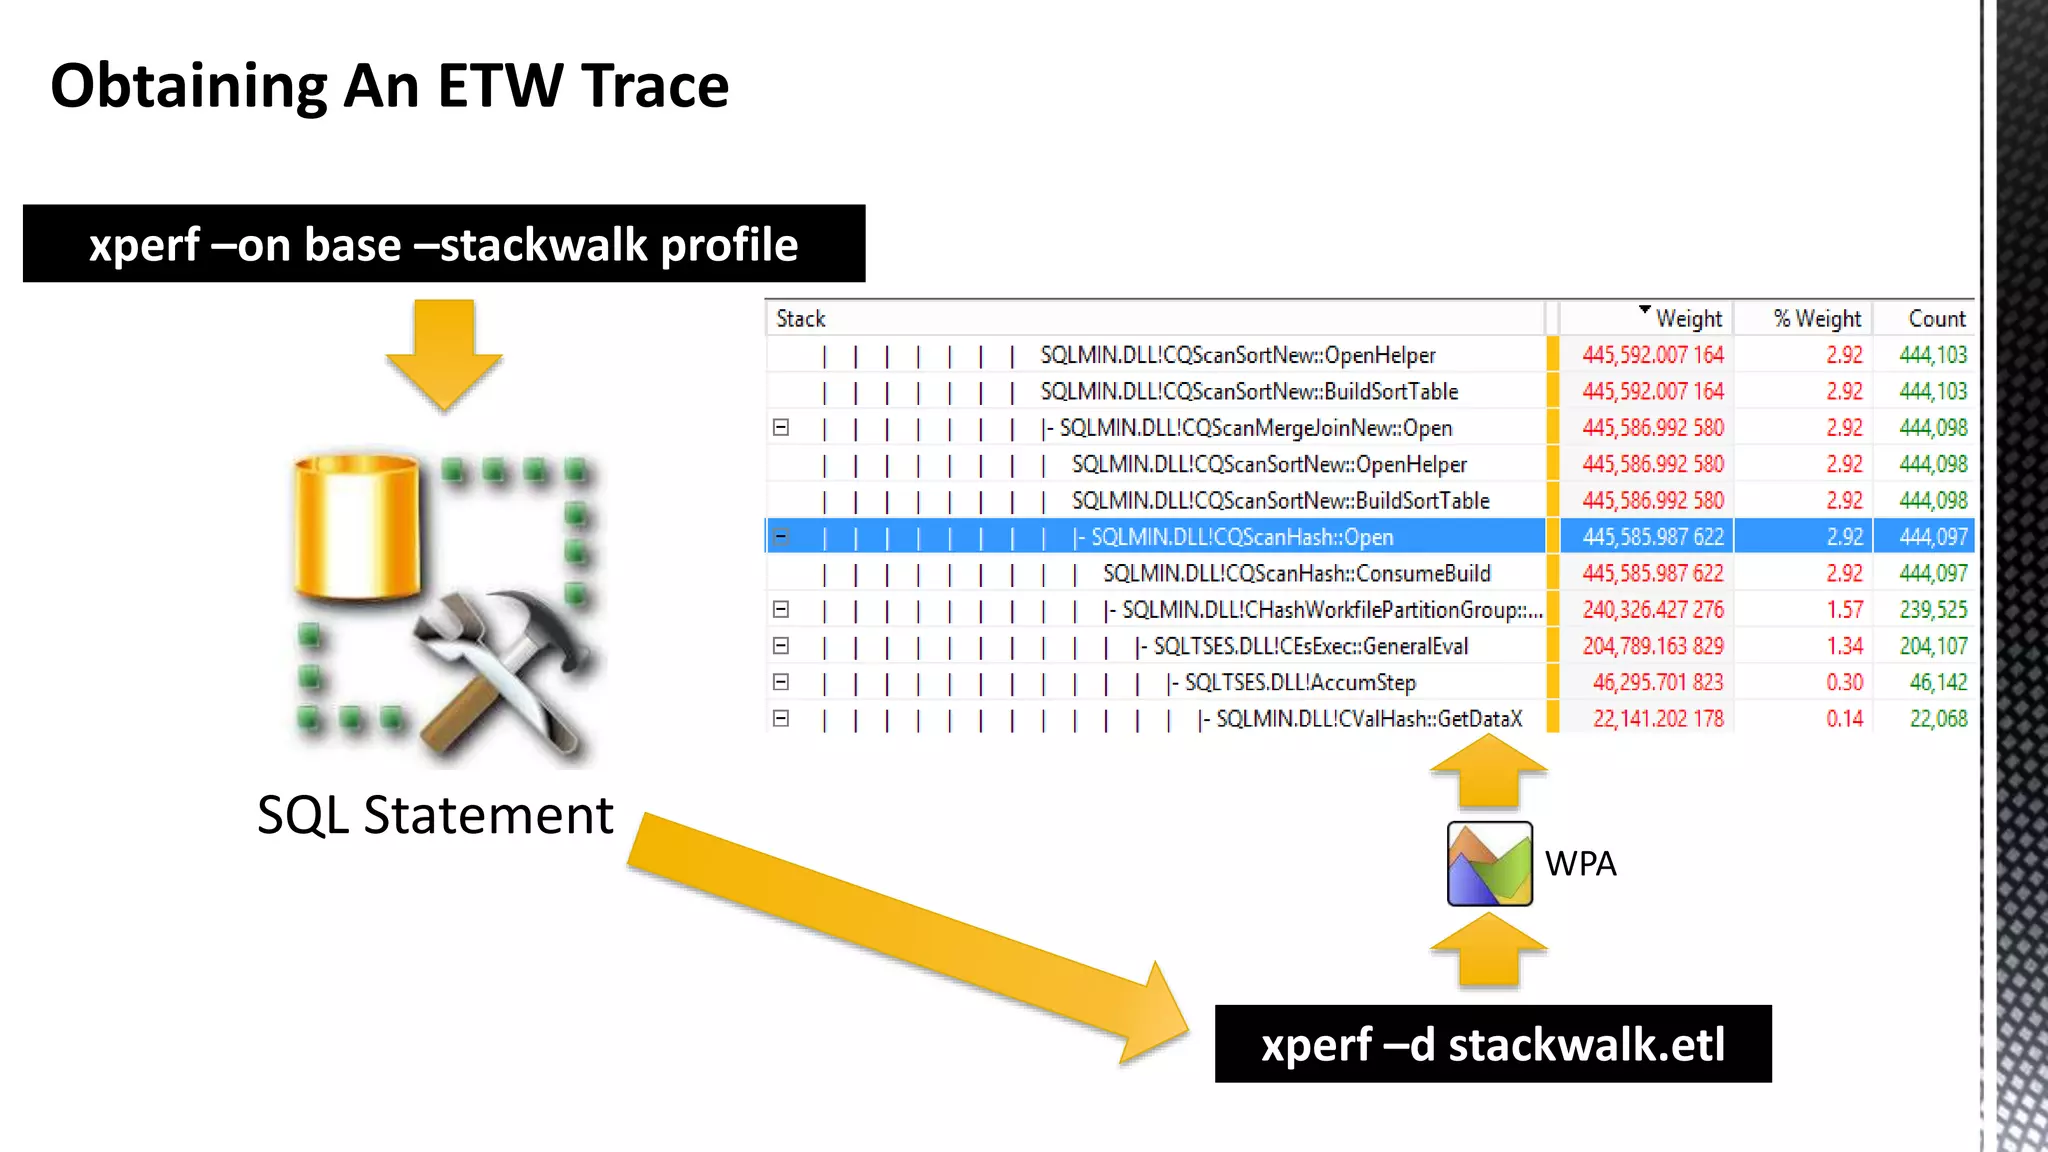
Downloaded 52 times


![Which SELECT Statement Has The Lowest Elapsed Time ? 17.41Mb column store Vs. 51.7Mb column store WITH generator AS ( SELECT TOP 3000 id = Row_Number() OVER (ORDER BY a) FROM (SELECT a = 1 FROM master.dbo.syscolumns) c1 CROSS JOIN master.dbo.syscolumns c2 ) SELECT d.DateKey AS OrderDateKey ,CAST(((id - 1) % 1048576) AS money ) AS Price1 ,CAST(((id - 1) % 1048576) AS money ) AS Price2 ,CAST(((id - 1) % 1048576) AS money ) AS Price3 INTO FactInternetSalesBigNoSort FROM generator CROSS JOIN [dbo].[DimDate] d CREATE CLUSTERED COLUMNSTORE INDEX ccsi ON FactInternetSalesBigNoSort SELECT CalendarQuarter ,SUM([Price1]) ,SUM([Price2]) ,SUM([Price3]) FROM [dbo].[FactInternetSalesBigNoSort] f JOIN [DimDate] d ON f.OrderDateKey = d.DateKey GROUP BY CalendarQuarter WITH generator AS ( SELECT TOP 3000 id = Row_Number() OVER (ORDER BY a) FROM (SELECT a = 1 FROM master.dbo.syscolumns) c1 CROSS JOIN master.dbo.syscolumns c2 ) SELECT d.DateKey AS OrderDateKey ,CAST(((id - 1) % 1048576) AS money ) AS Price1 ,CAST(((id - 1) % 1048576) AS money ) AS Price2 ,CAST(((id - 1) % 1048576) AS money ) AS Price3 INTO FactInternetSalesBigSorted FROM generator CROSS JOIN [dbo].[DimDate] d CREATE CLUSTERED INDEX ccsi ON FactInternetSalesBigNoSorted ( OrderDateKey ) CREATE CLUSTERED COLUMNSTORE INDEX ccsi ON FactInternetSalesBigNoSorted WITH (DROP_EXISTING = ON) SELECT CalendarQuarter ,SUM([Price1]) ,SUM([Price2]) ,SUM([Price3]) FROM [dbo].[FactInternetSalesBigSorted] f JOIN [DimDate] d ON f.OrderDateKey = d.DateKey GROUP BY CalendarQuarter The fastest ? The fastest ?](https://image.slidesharecdn.com/sqlserverenginecpucacheasthenewram-150121092106-conversion-gate01/75/Sql-server-engine-cpu-cache-as-the-new-ram-6-2048.jpg)

![Spin Locks Do Not Provide Any Clues Either Executes in 775 ms for a warm column store object pool 12 cores x 2.0 Ghz x 0.775 = 1,860,000,000 CPU cycles Total spins 293,491 SELECT [CalendarQuarter] ,SUM([Price1]) ,SUM([Price2]) ,SUM([Price3]) FROM [FactInternetSalesBig] f JOIN [DimDate] d ON f.OrderDateKey = d.DateKey GROUP BY CalendarQuarter OPTION (MAXDOP 24)](https://image.slidesharecdn.com/sqlserverenginecpucacheasthenewram-150121092106-conversion-gate01/75/Sql-server-engine-cpu-cache-as-the-new-ram-11-2048.jpg)
![Basic xperf Command Line Syntax xperf –on < kernel flags | kernel groups > [ -stackwalk < stackwalk kernel providers ] Kernel groups are groups of flags and not to be confused with Windows kernel groups Takeaway: kernel groups make life easier](https://image.slidesharecdn.com/sqlserverenginecpucacheasthenewram-150121092106-conversion-gate01/75/Sql-server-engine-cpu-cache-as-the-new-ram-19-2048.jpg)


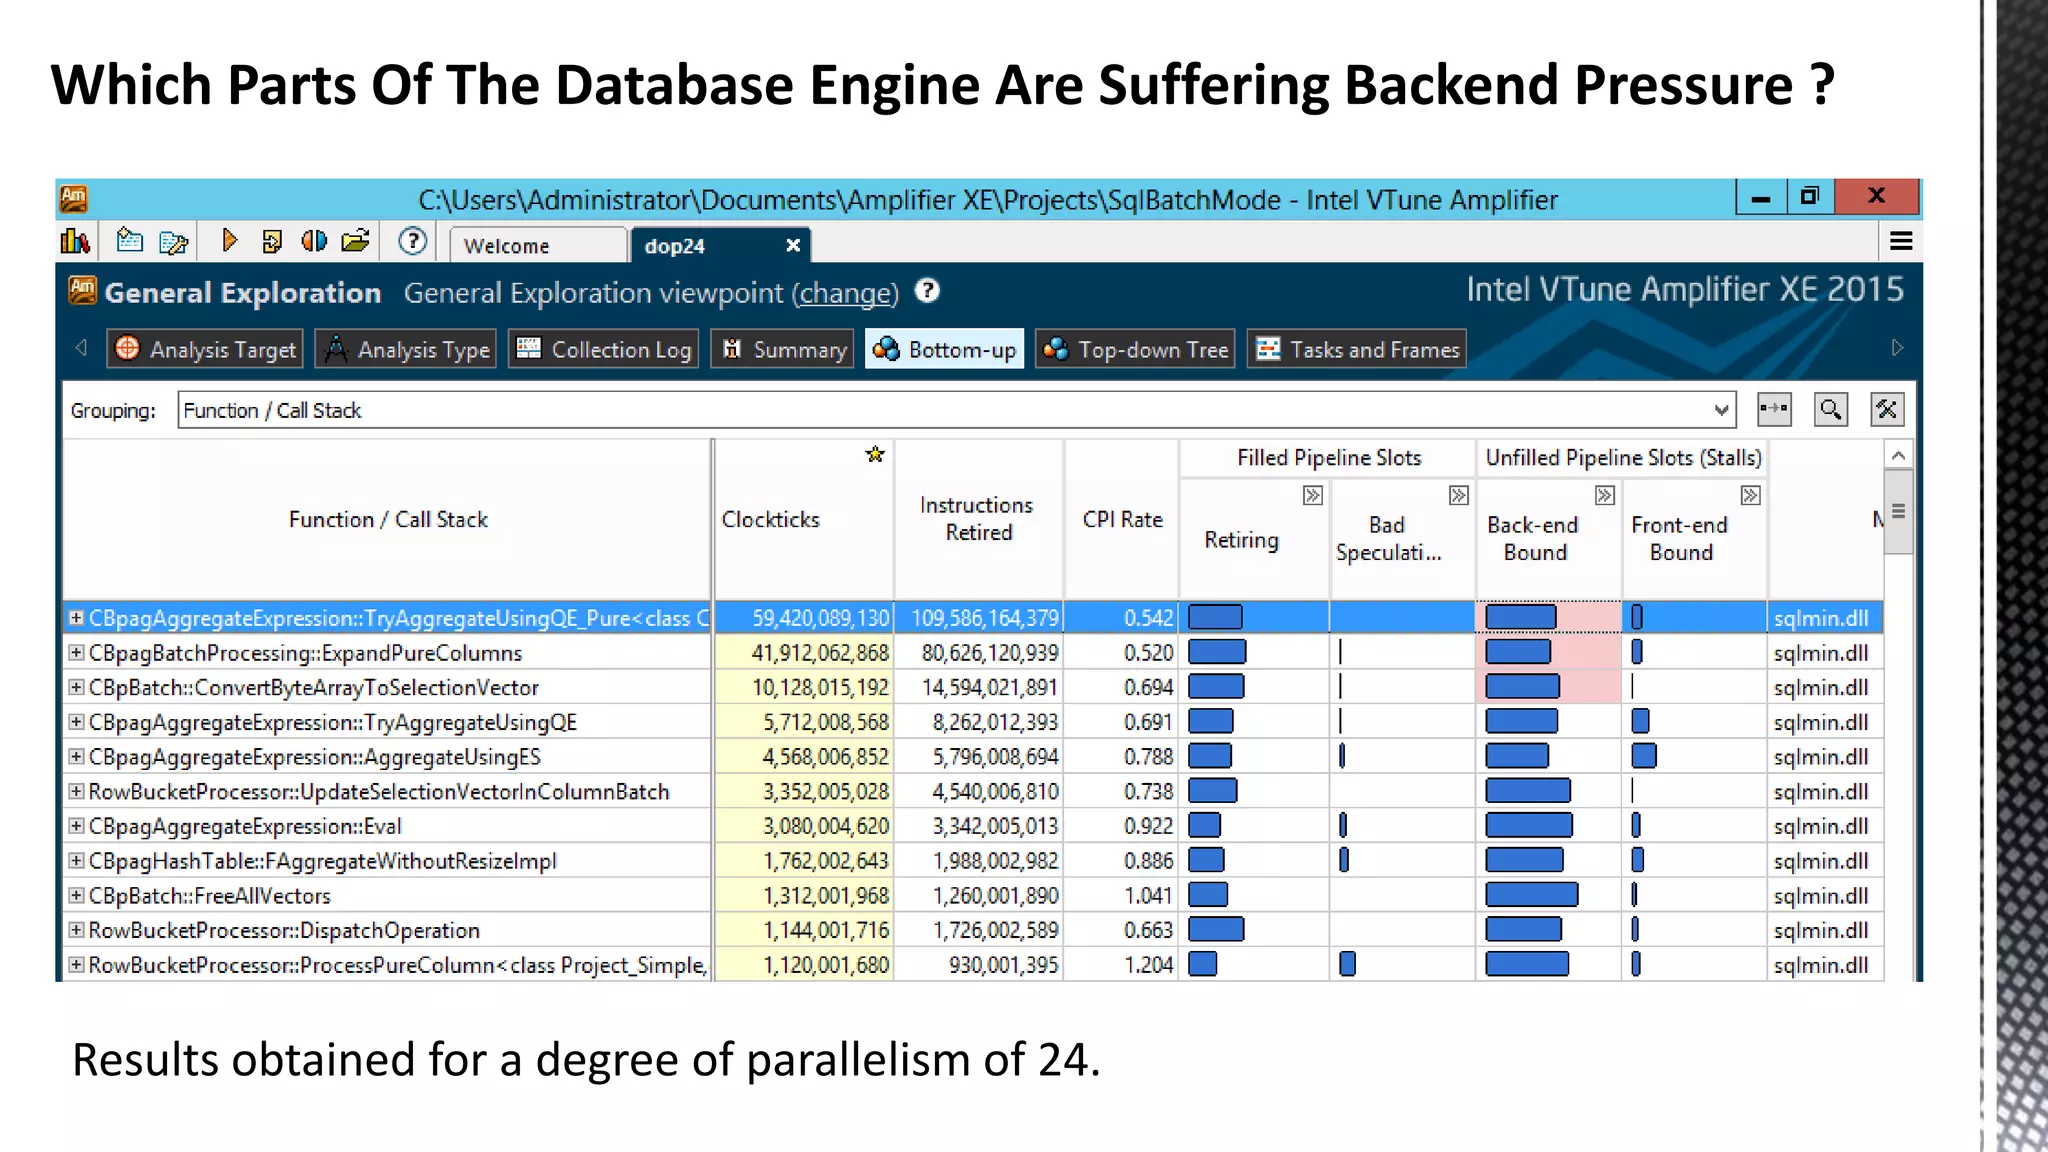
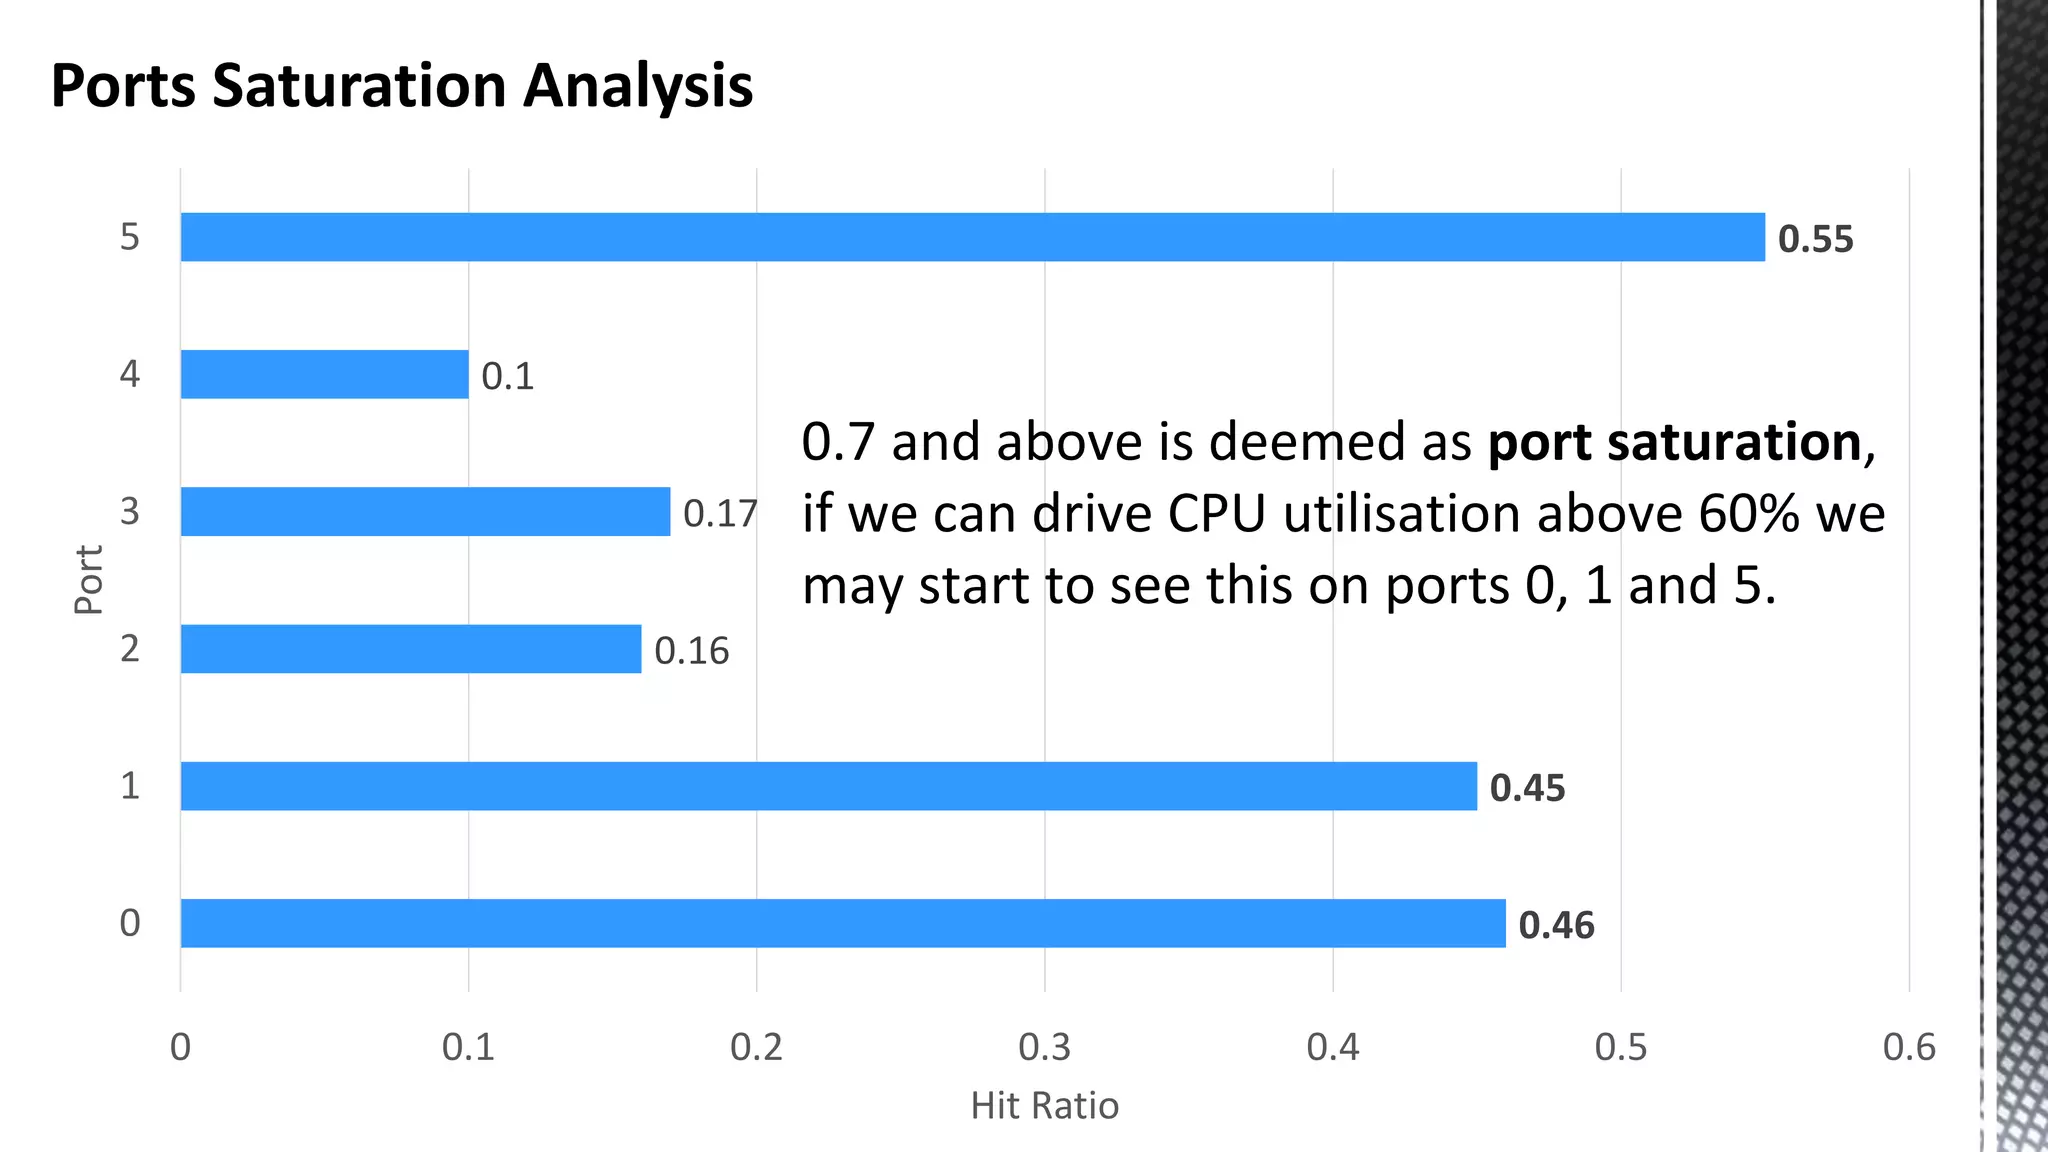
![256-bit FMUL Blend Back end Pressure Can Manifest As “Port Saturation” ( *Sandybridge core) CBagAggregateExpression:: TryAggregateUsingQE_Pure * SELECT [CalendarQuarter] ,SUM([Price1]) ,SUM([Price2]) ,SUM([Price3]) FROM [FactInternetSalesBig] f JOIN [DimDate] d ON f.OrderDateKey = d.DateKey GROUP BY CalendarQuarter OPTION (MAXDOP 24)](https://image.slidesharecdn.com/sqlserverenginecpucacheasthenewram-150121092106-conversion-gate01/75/Sql-server-engine-cpu-cache-as-the-new-ram-79-2048.jpg)


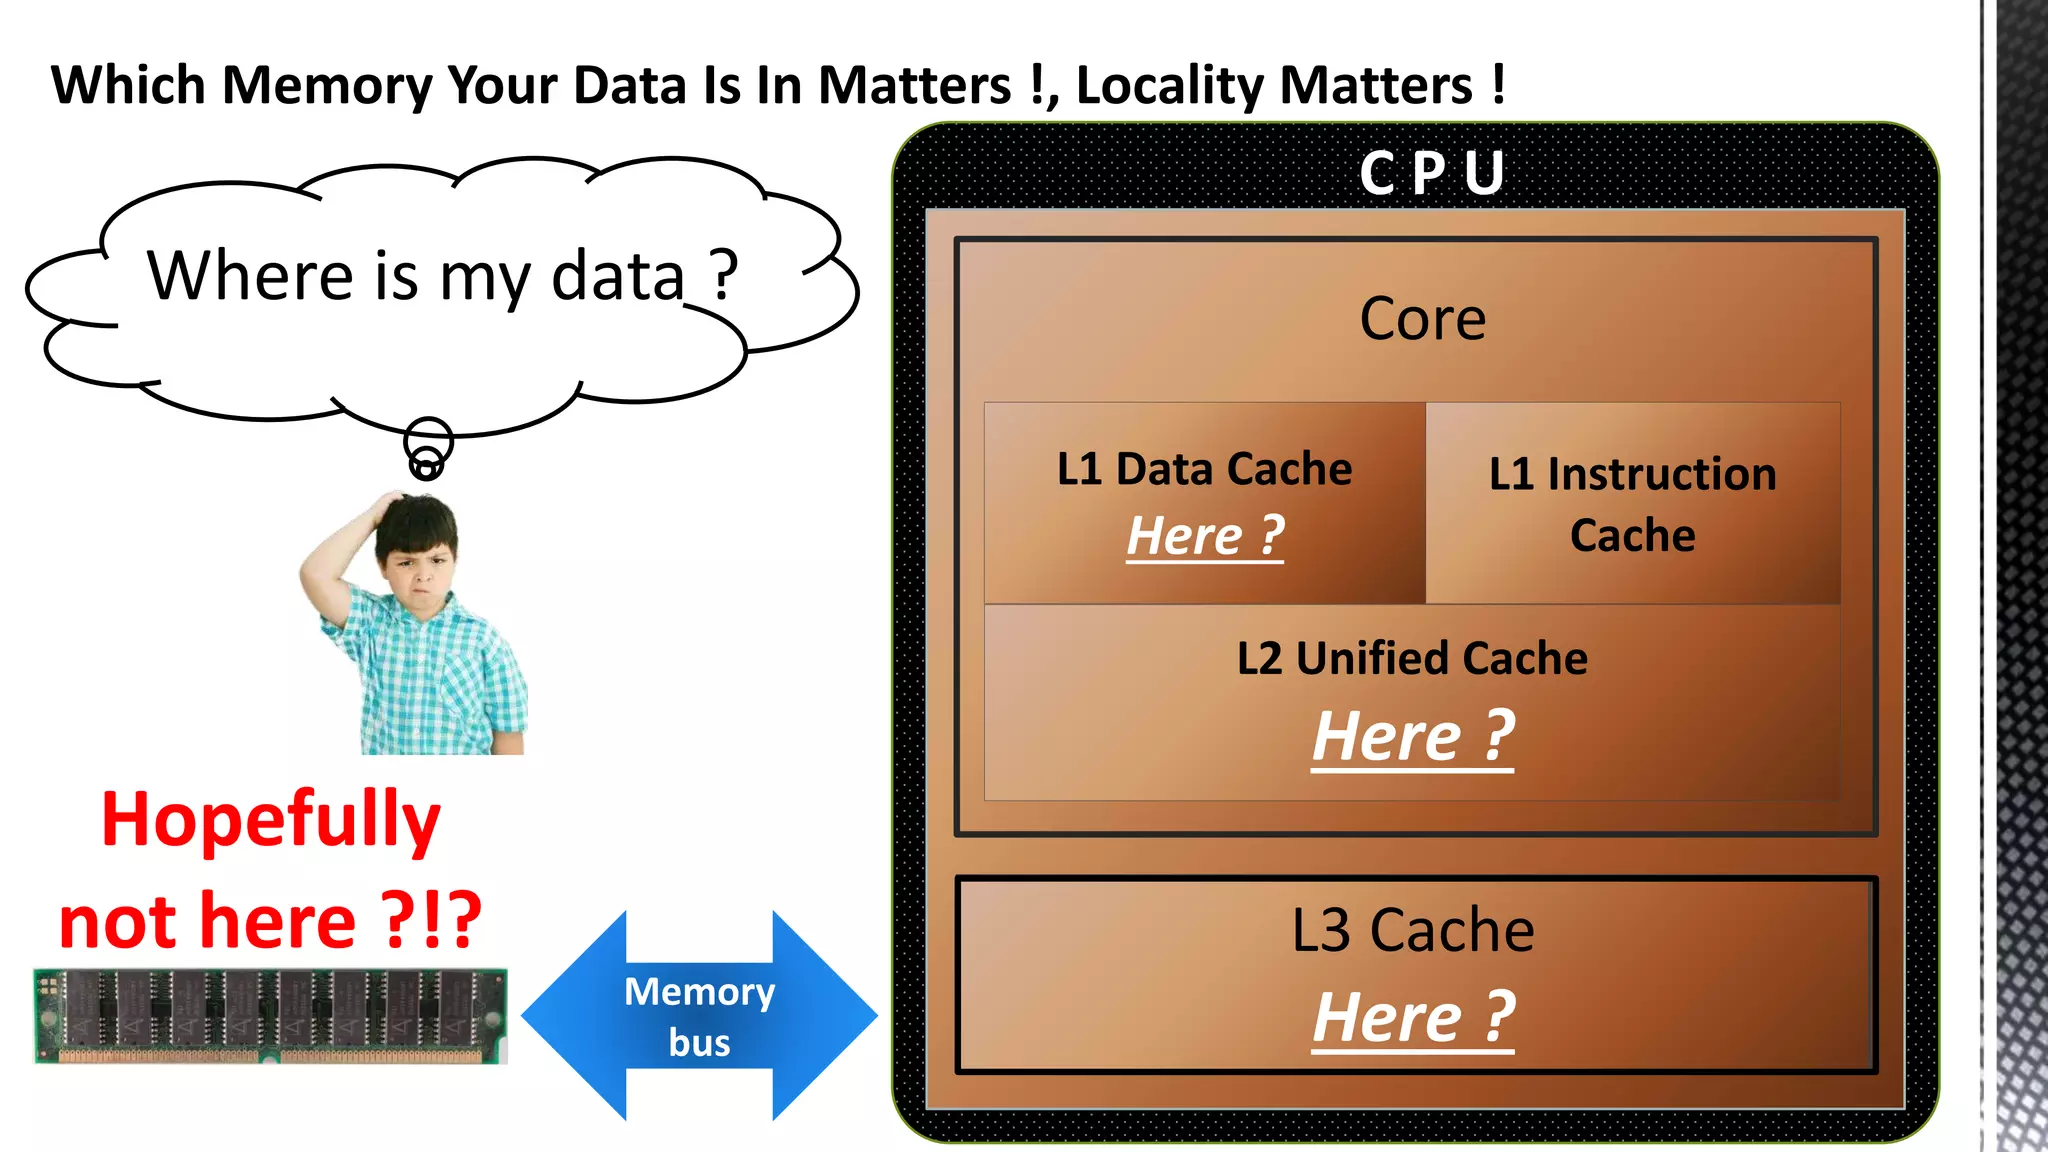
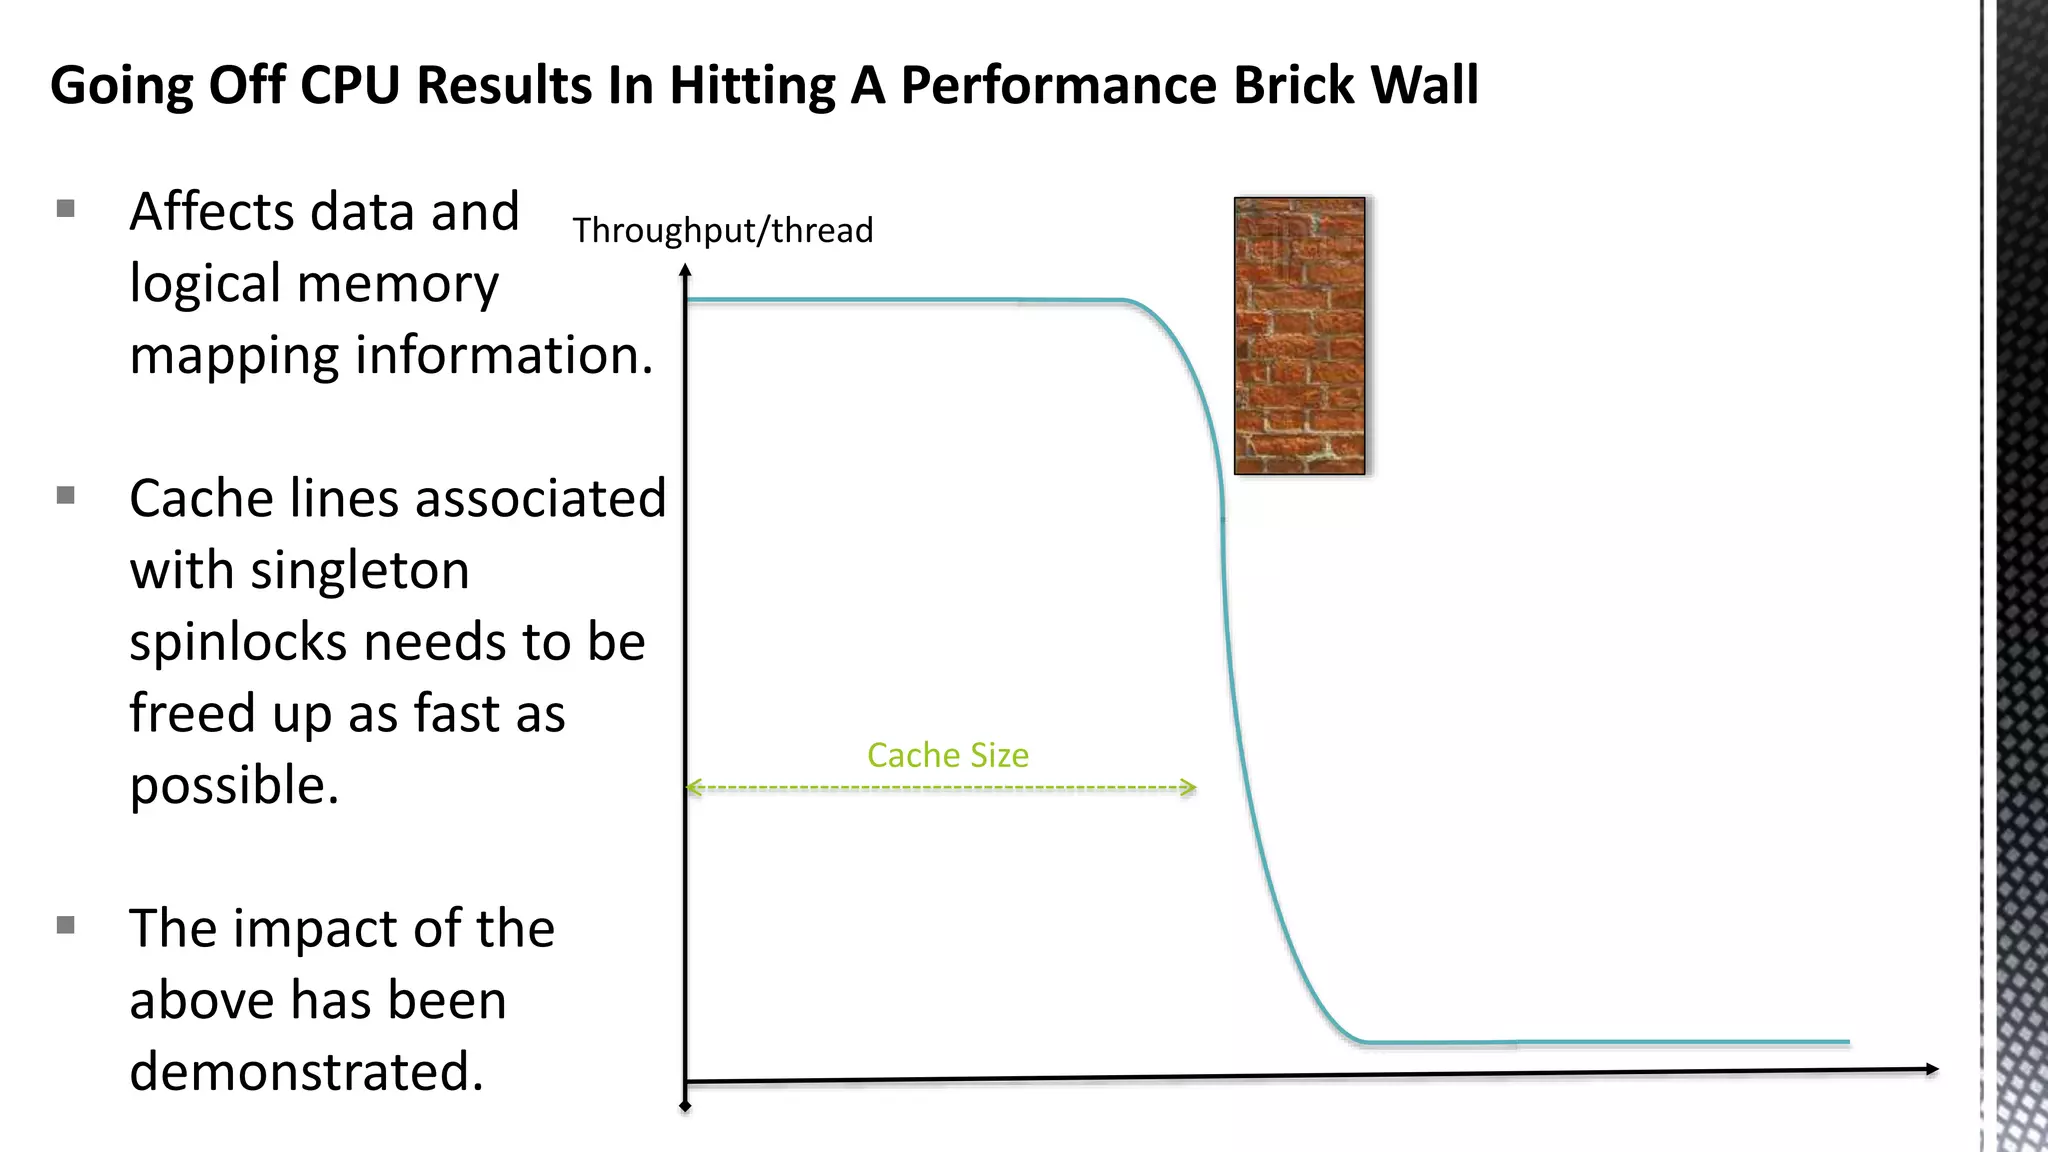


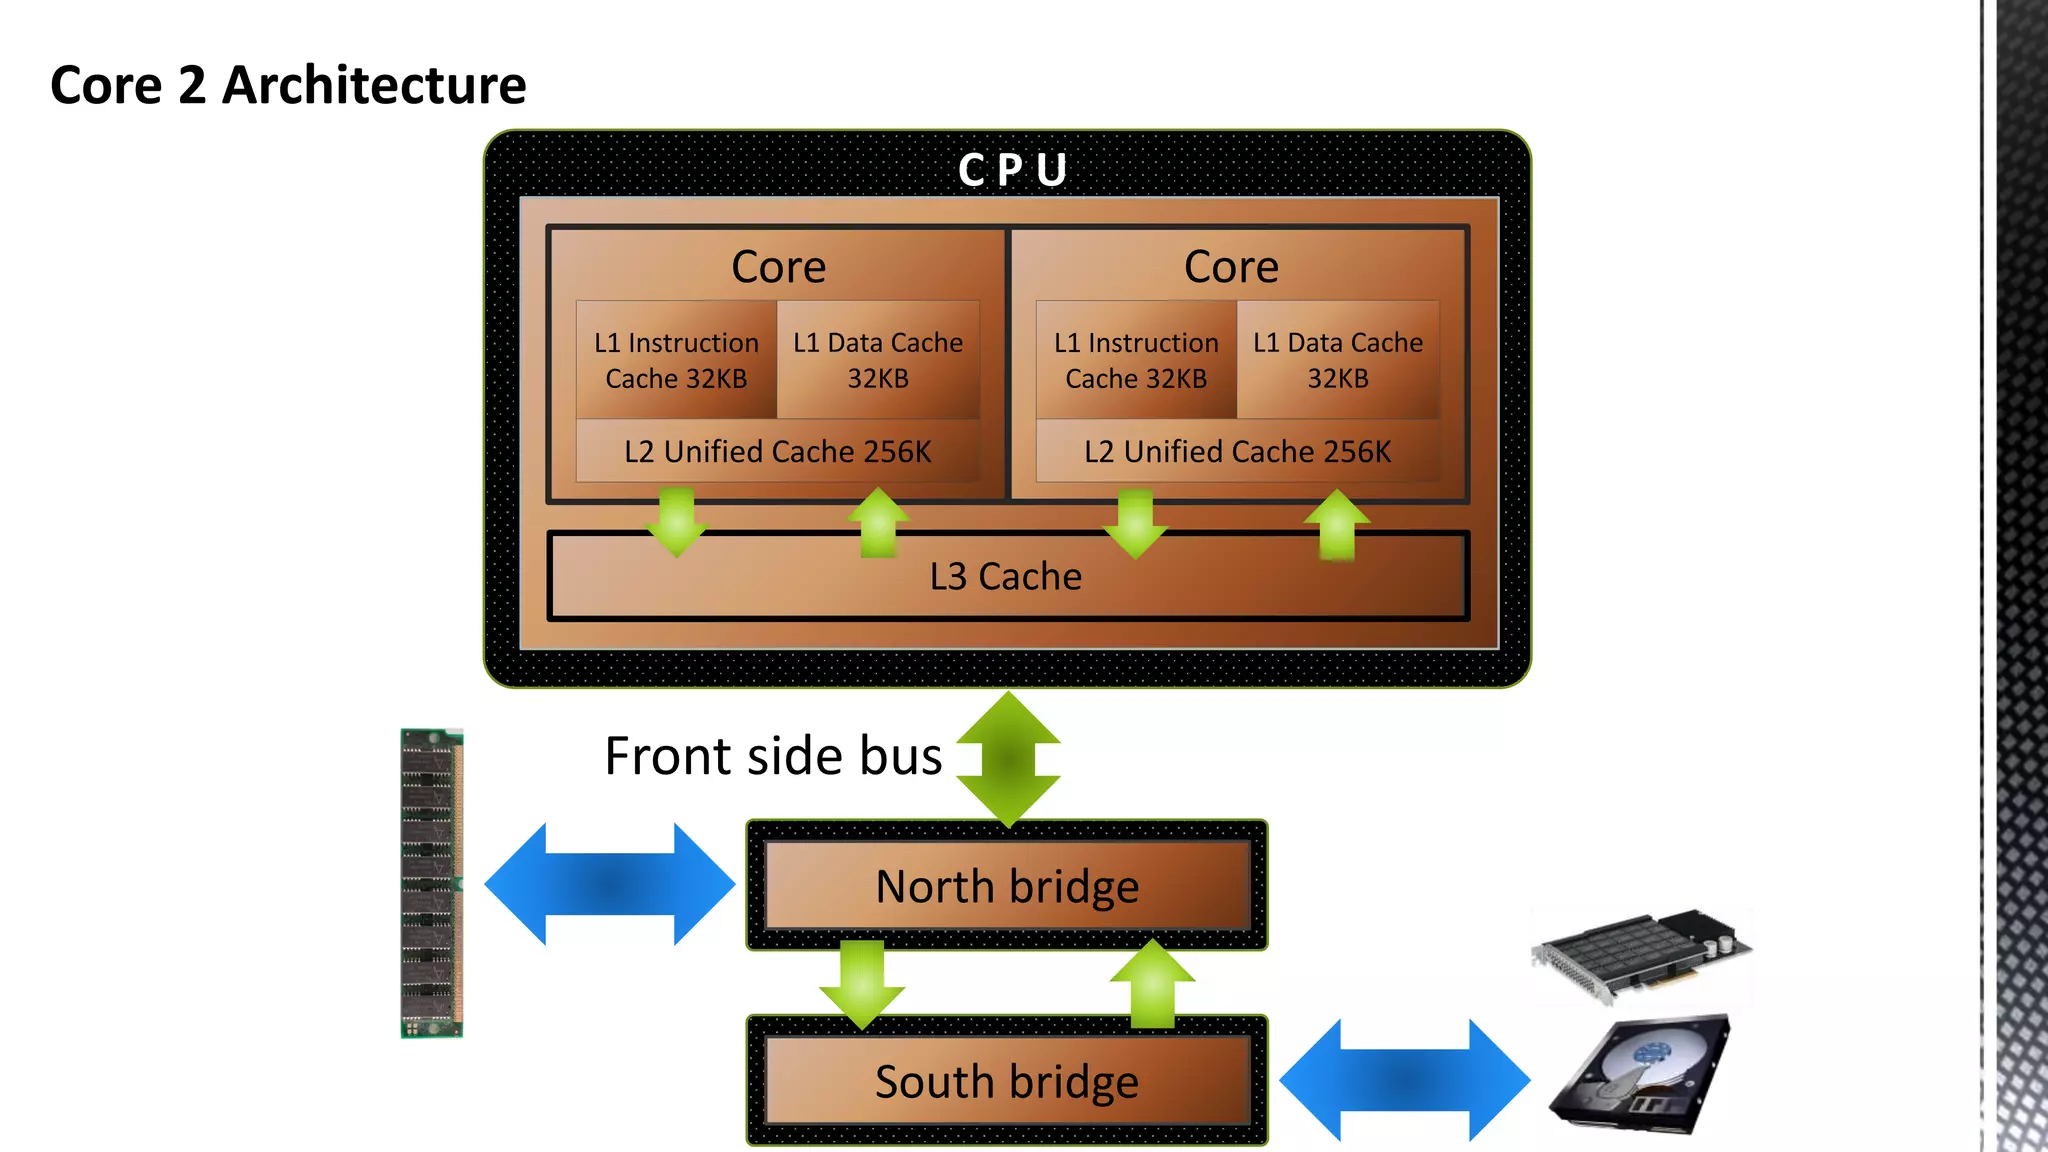
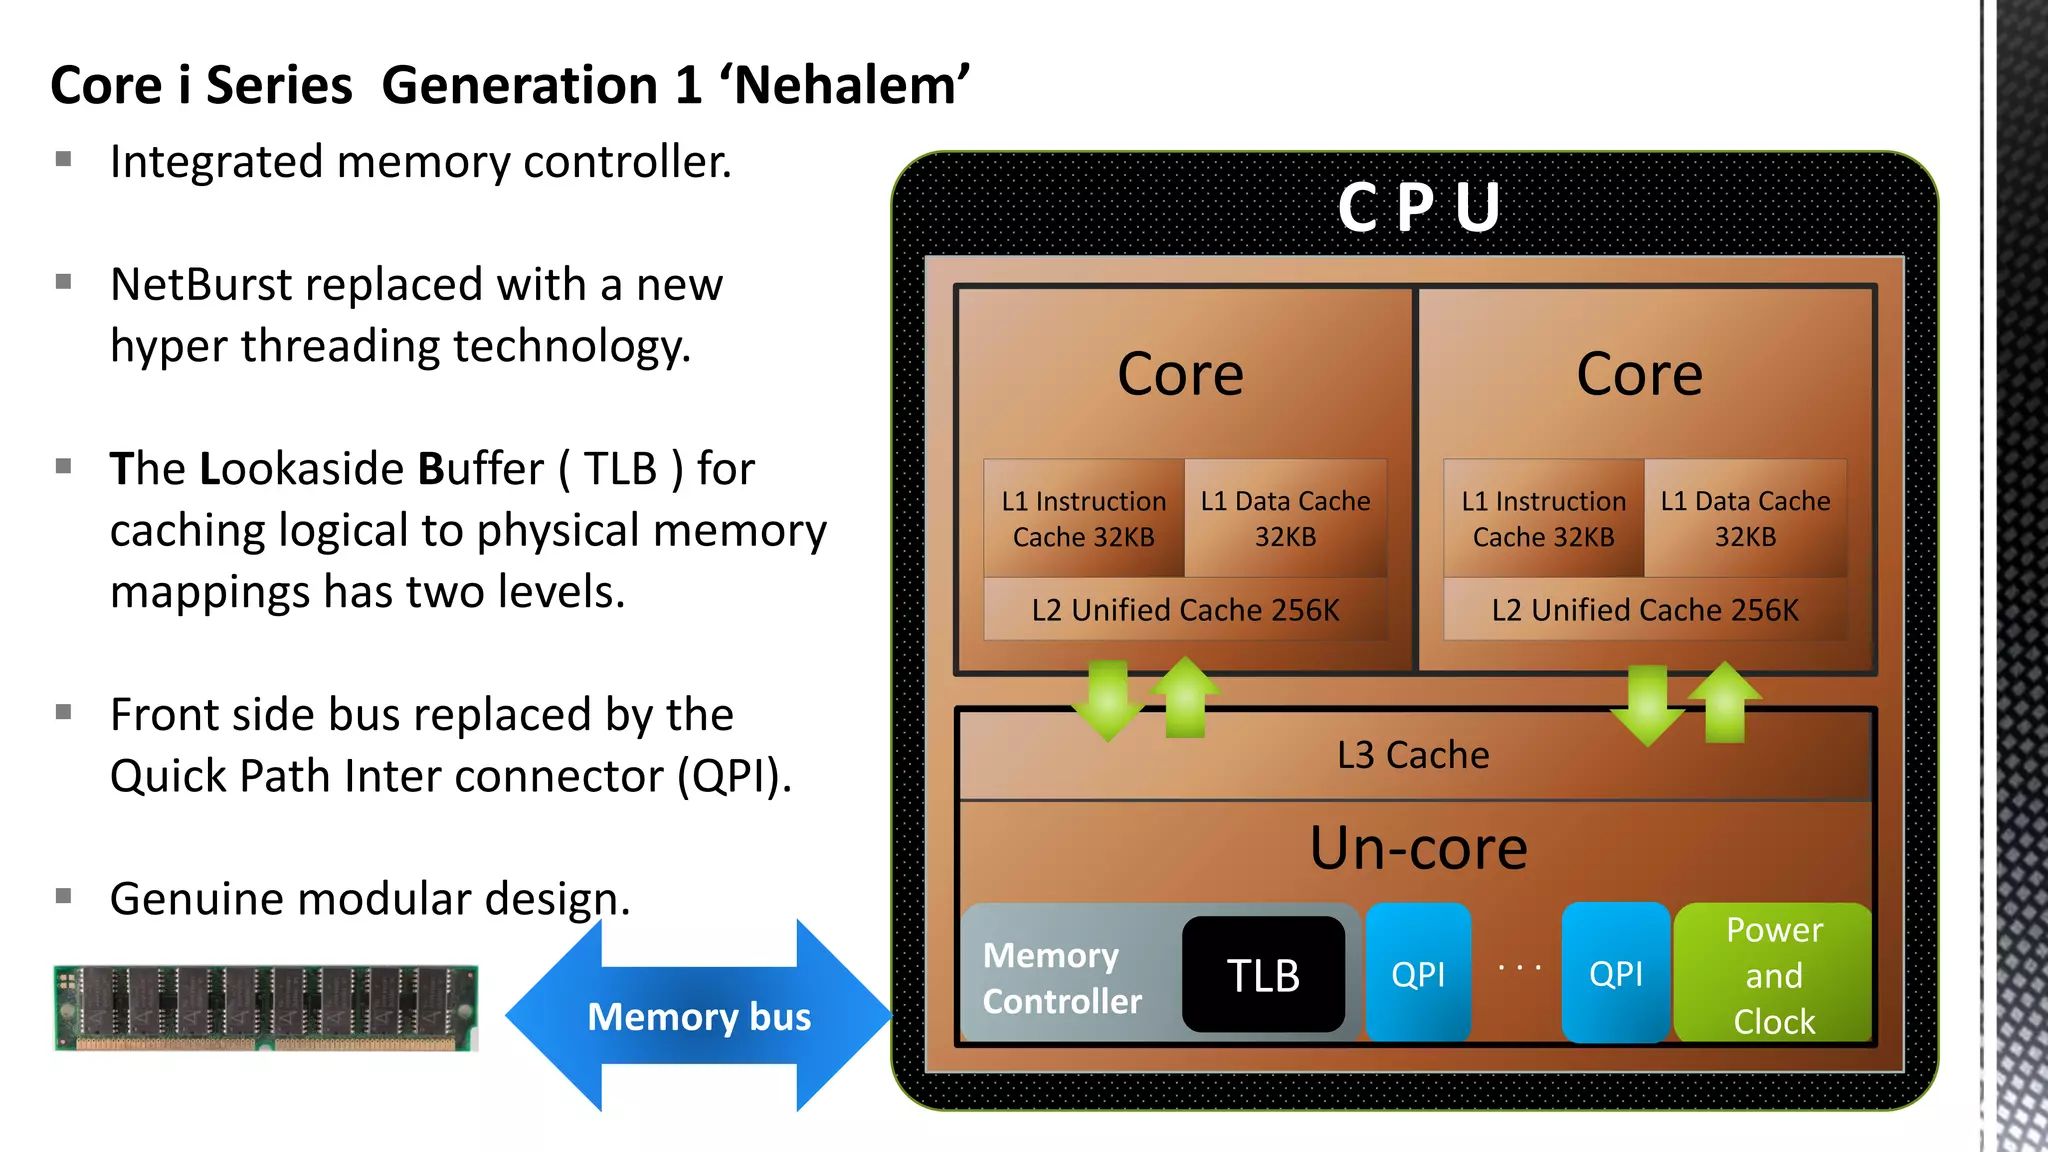
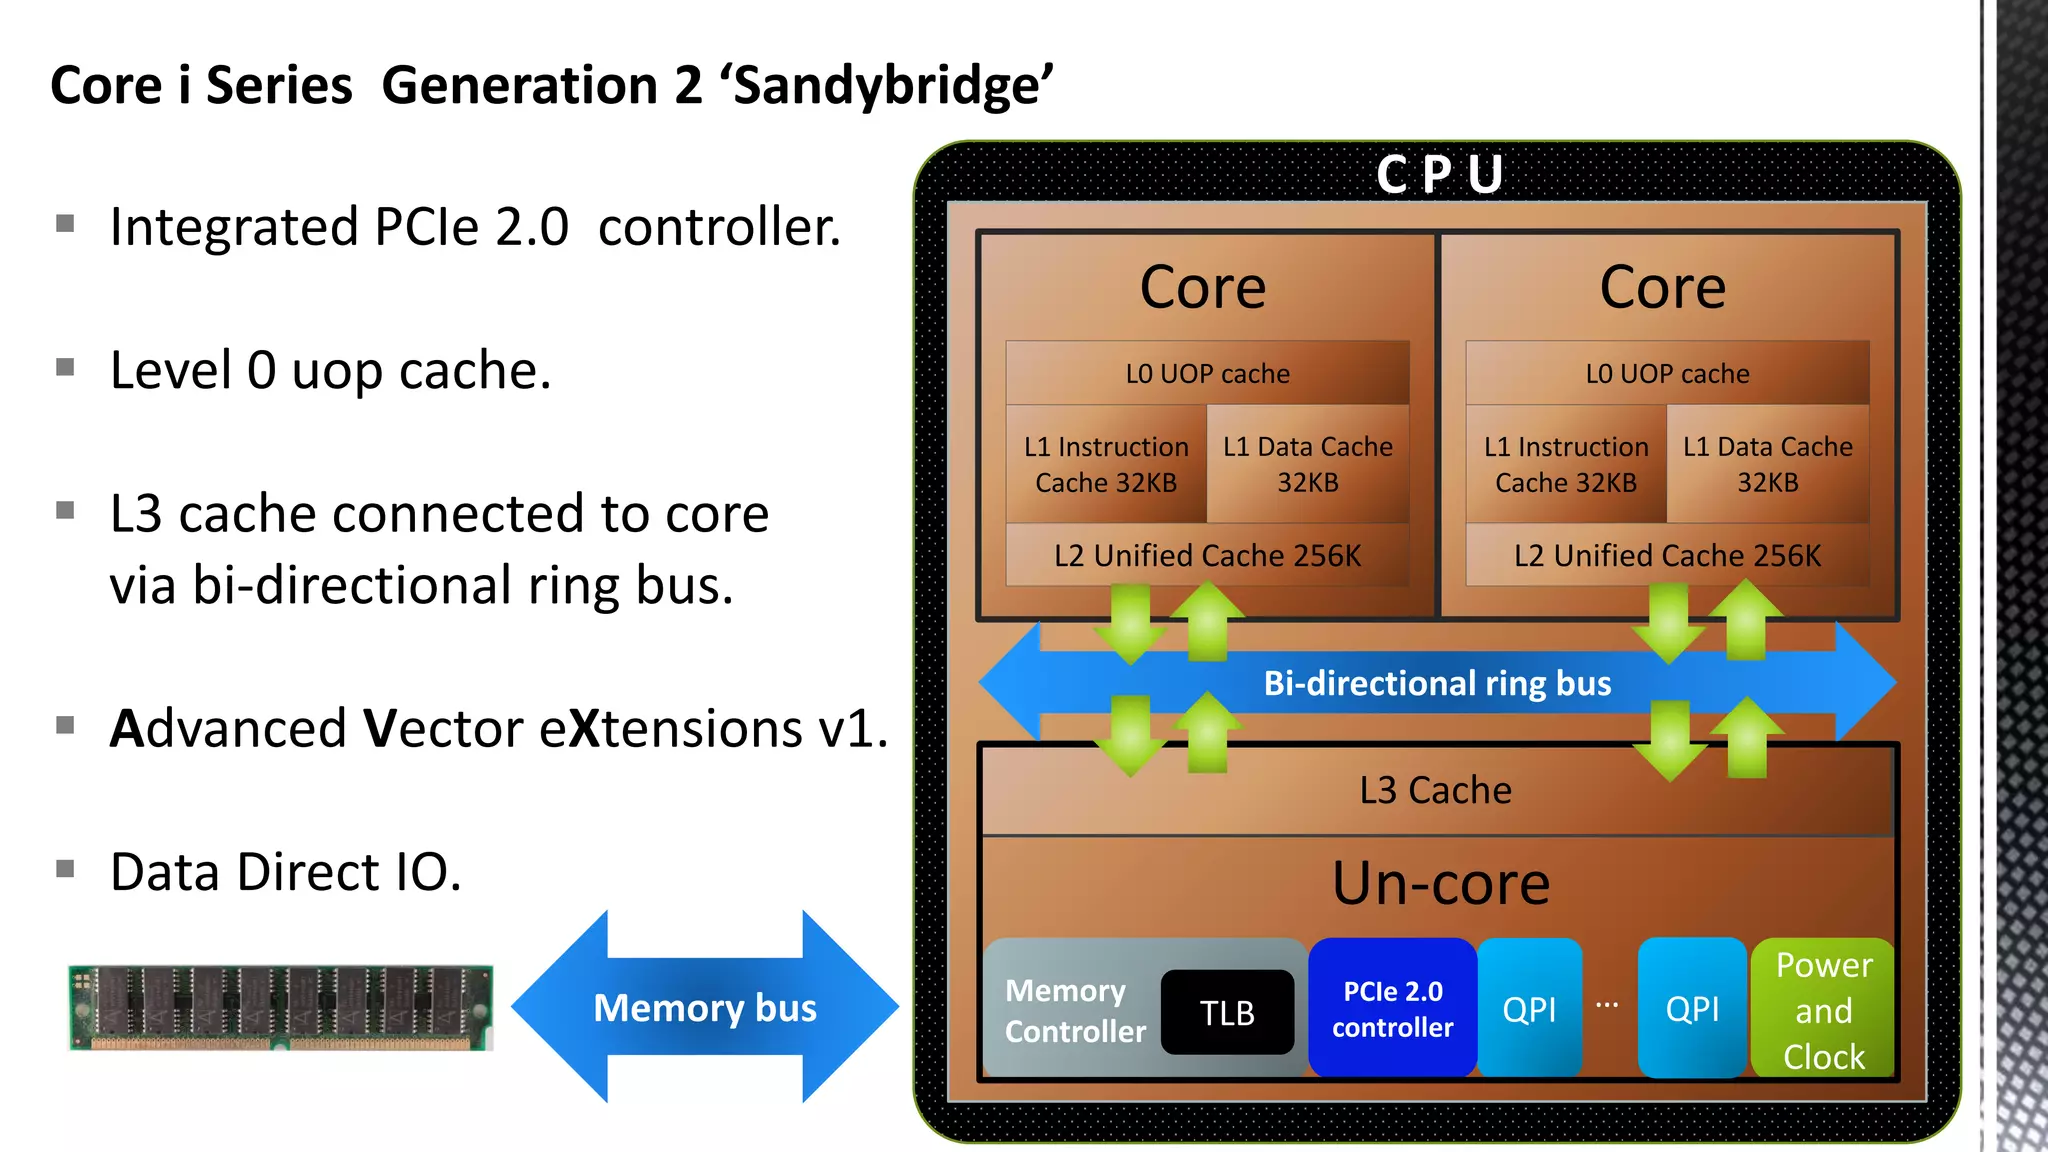
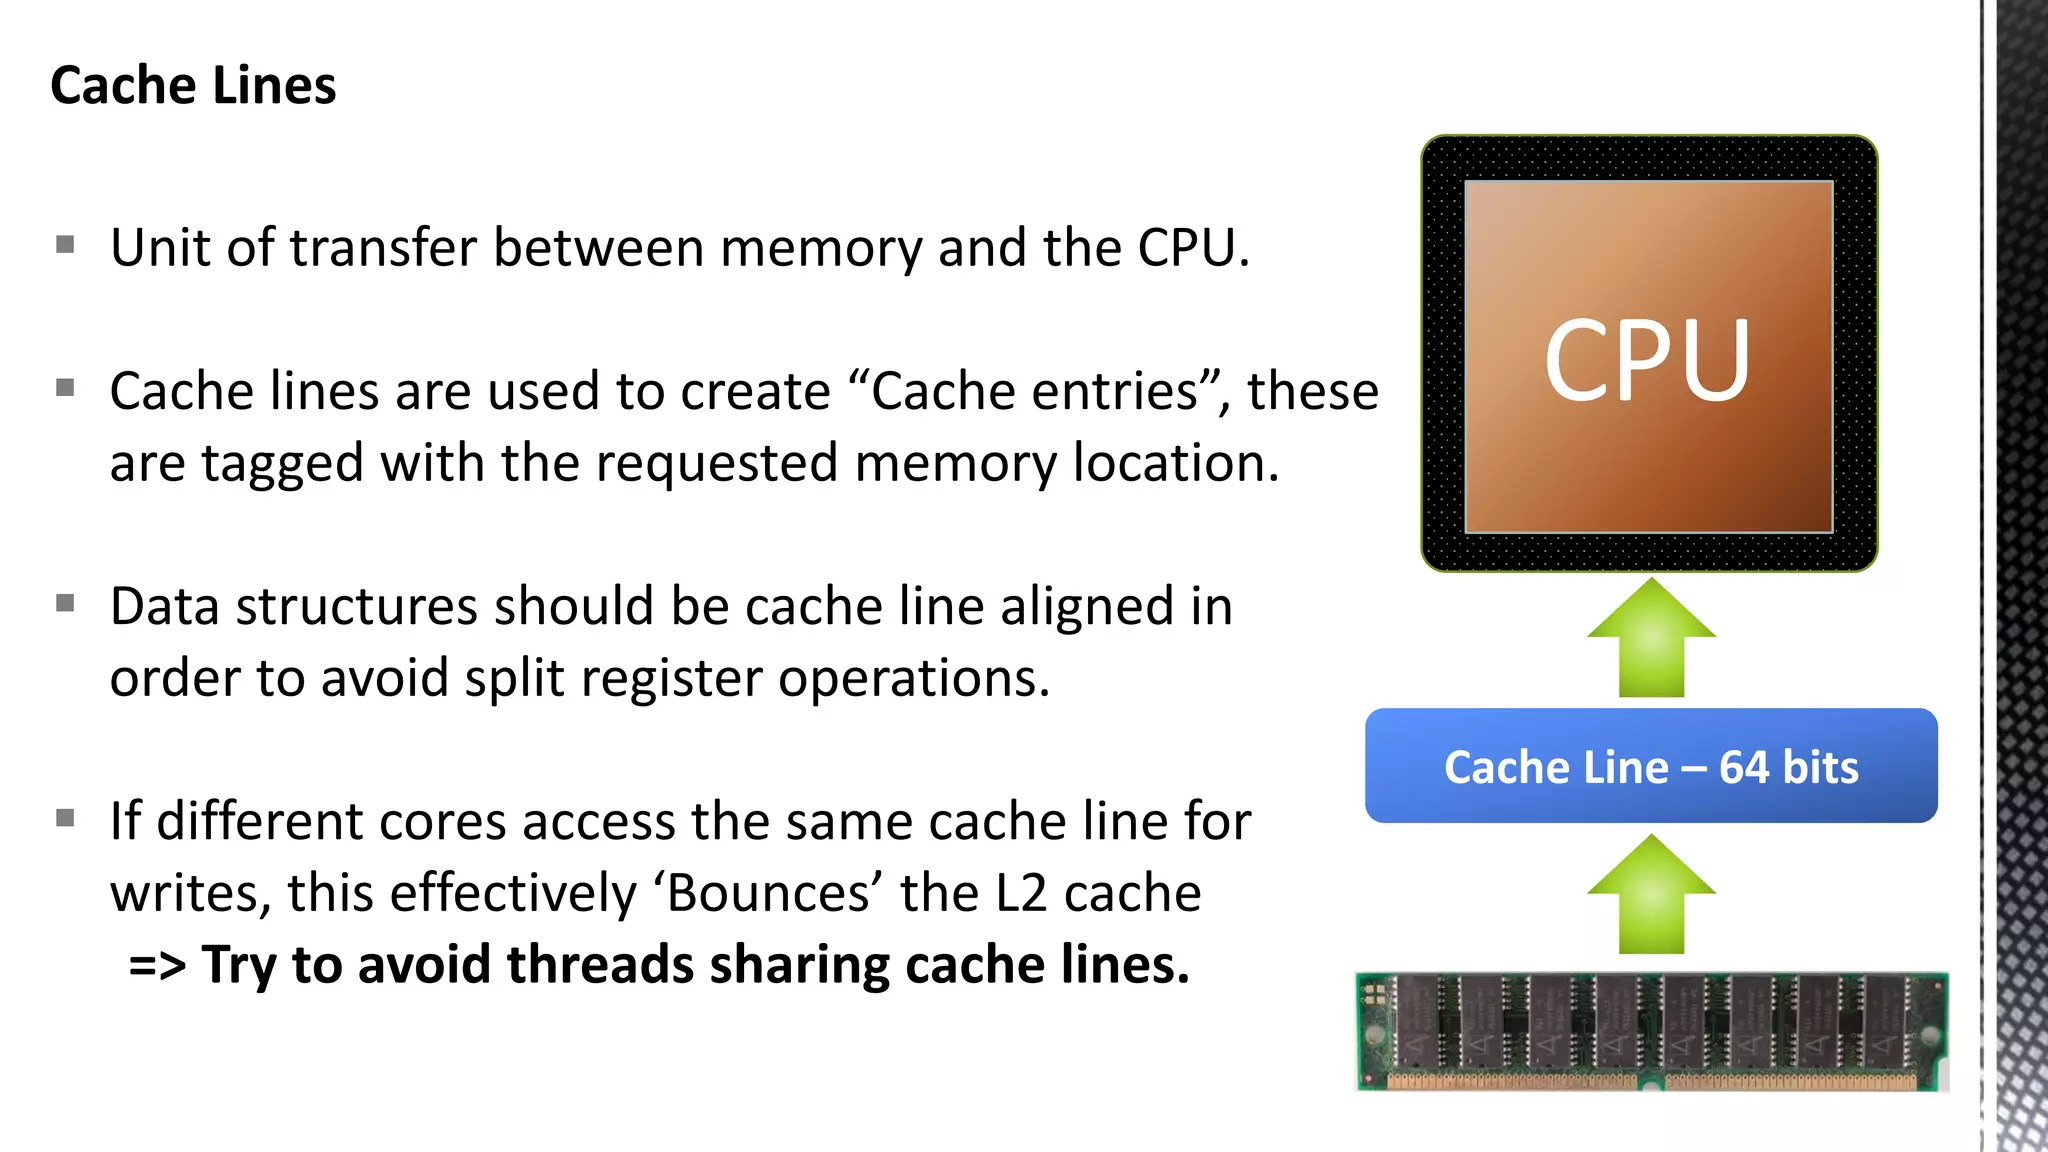
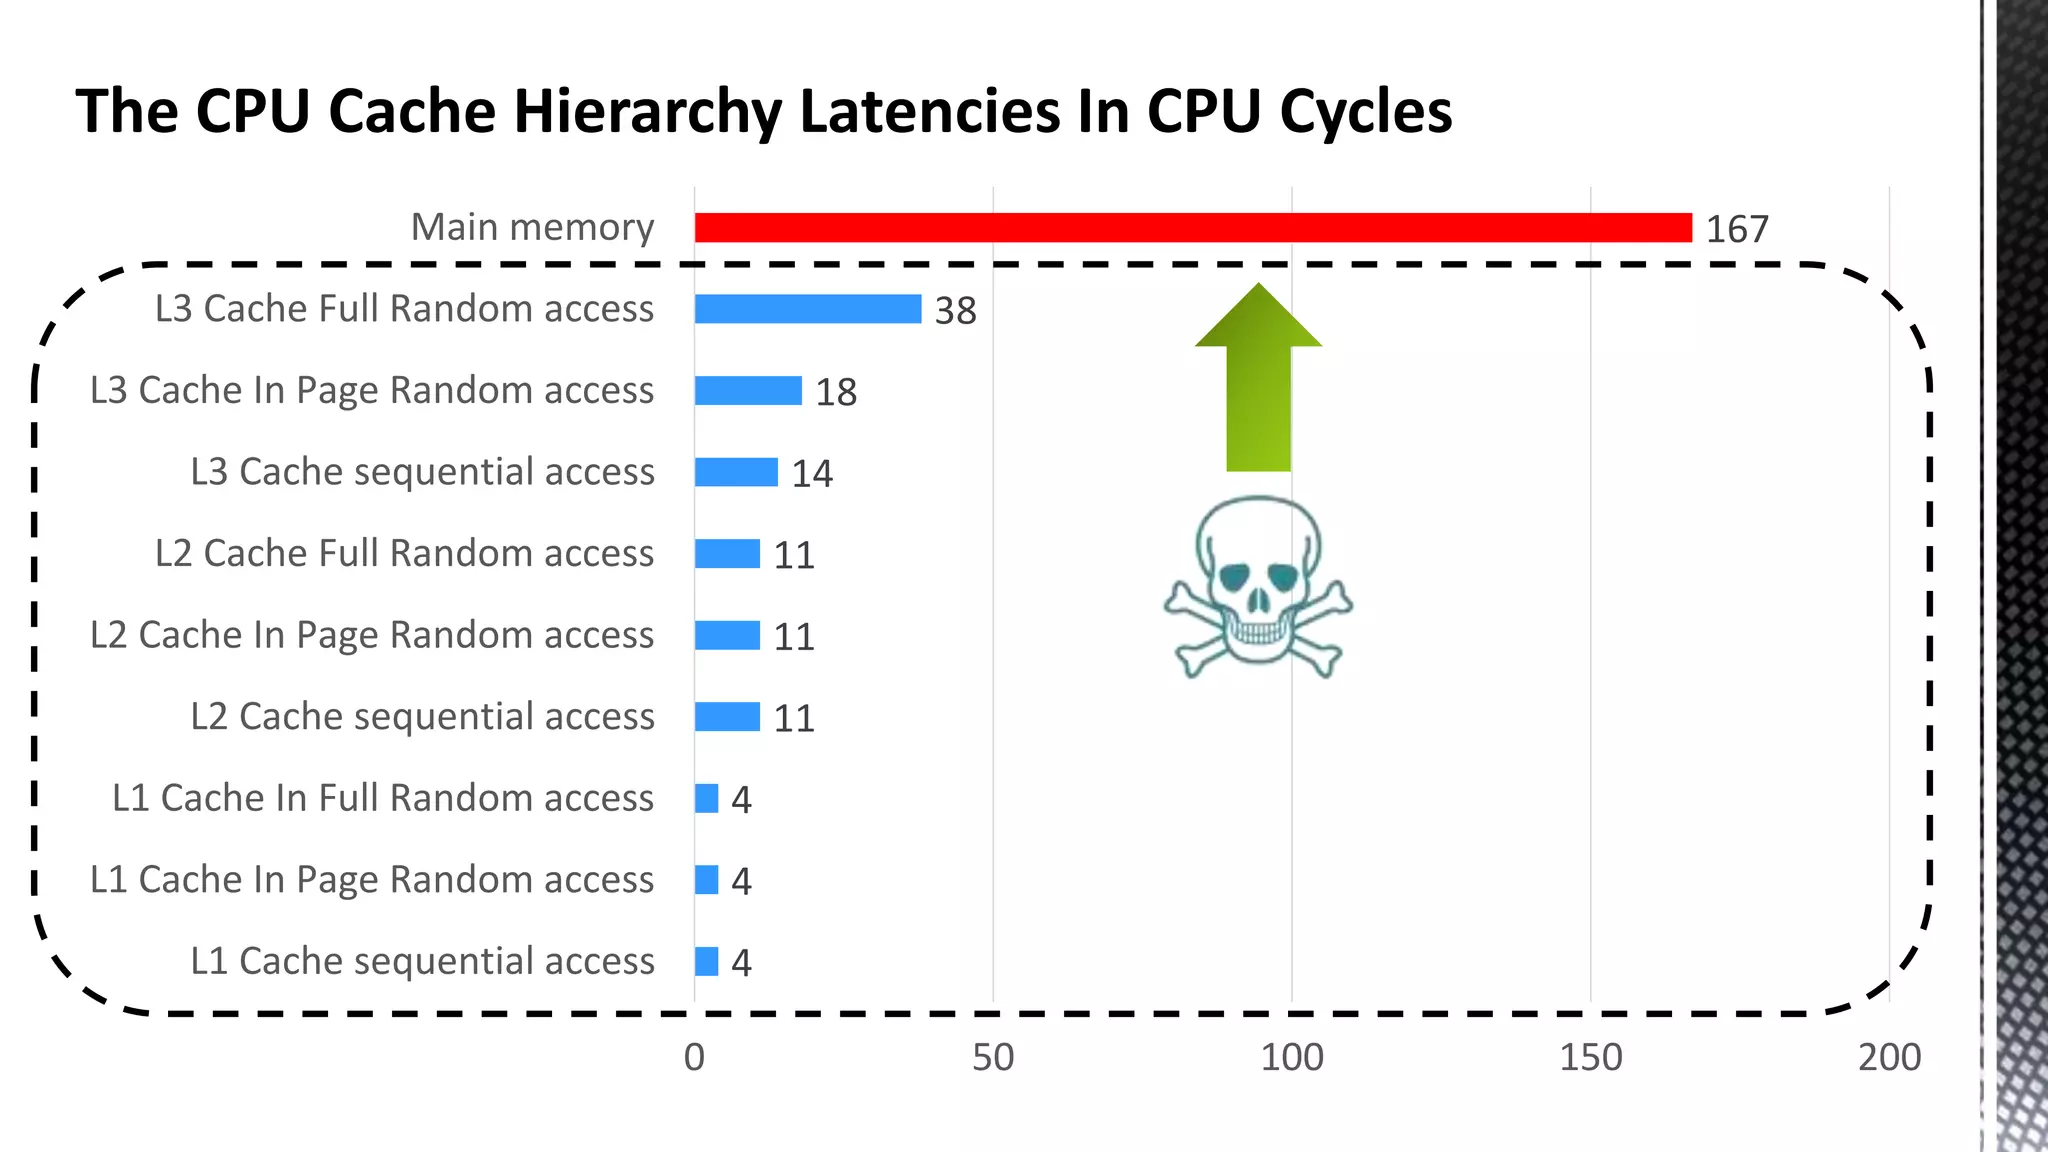
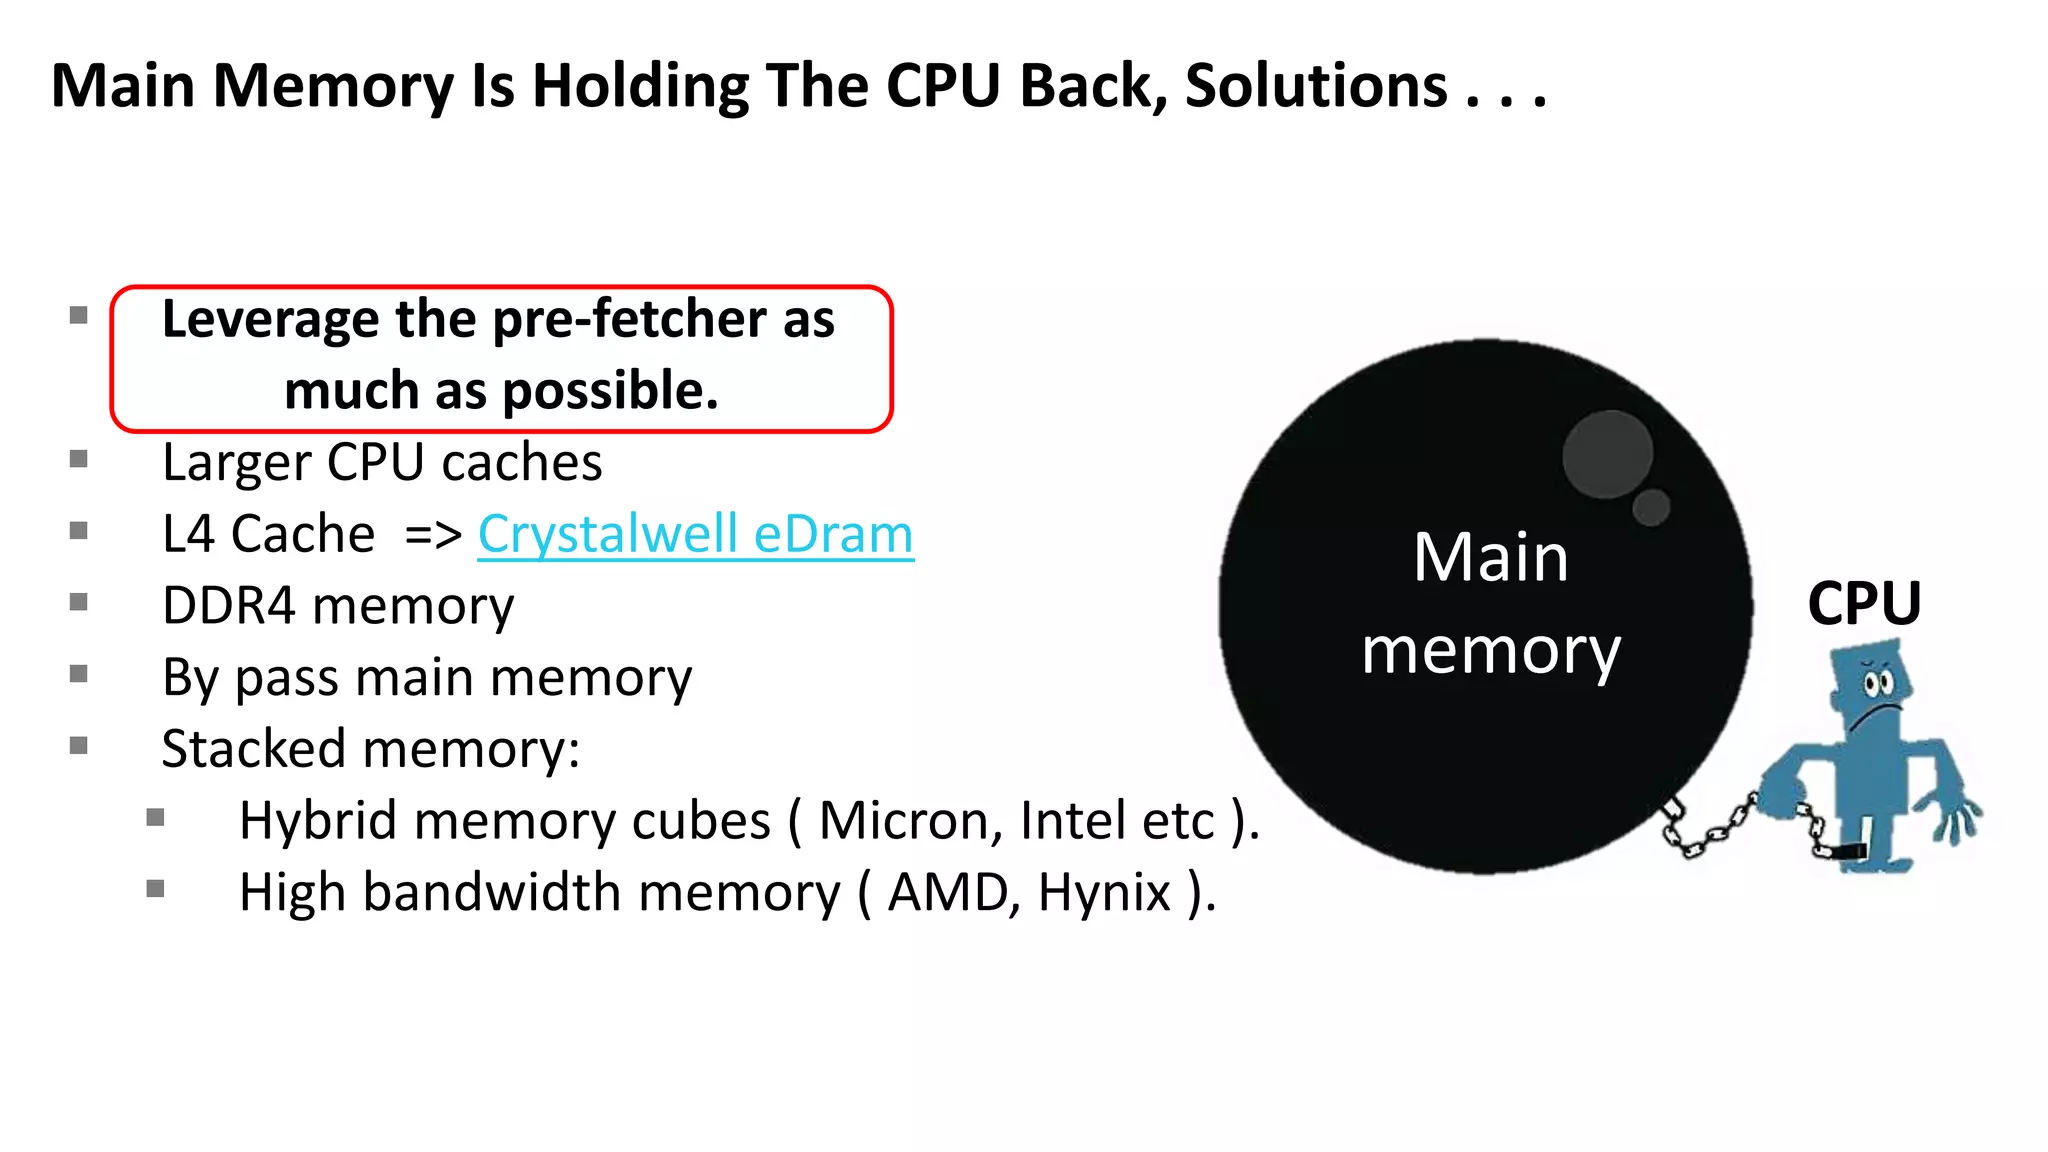
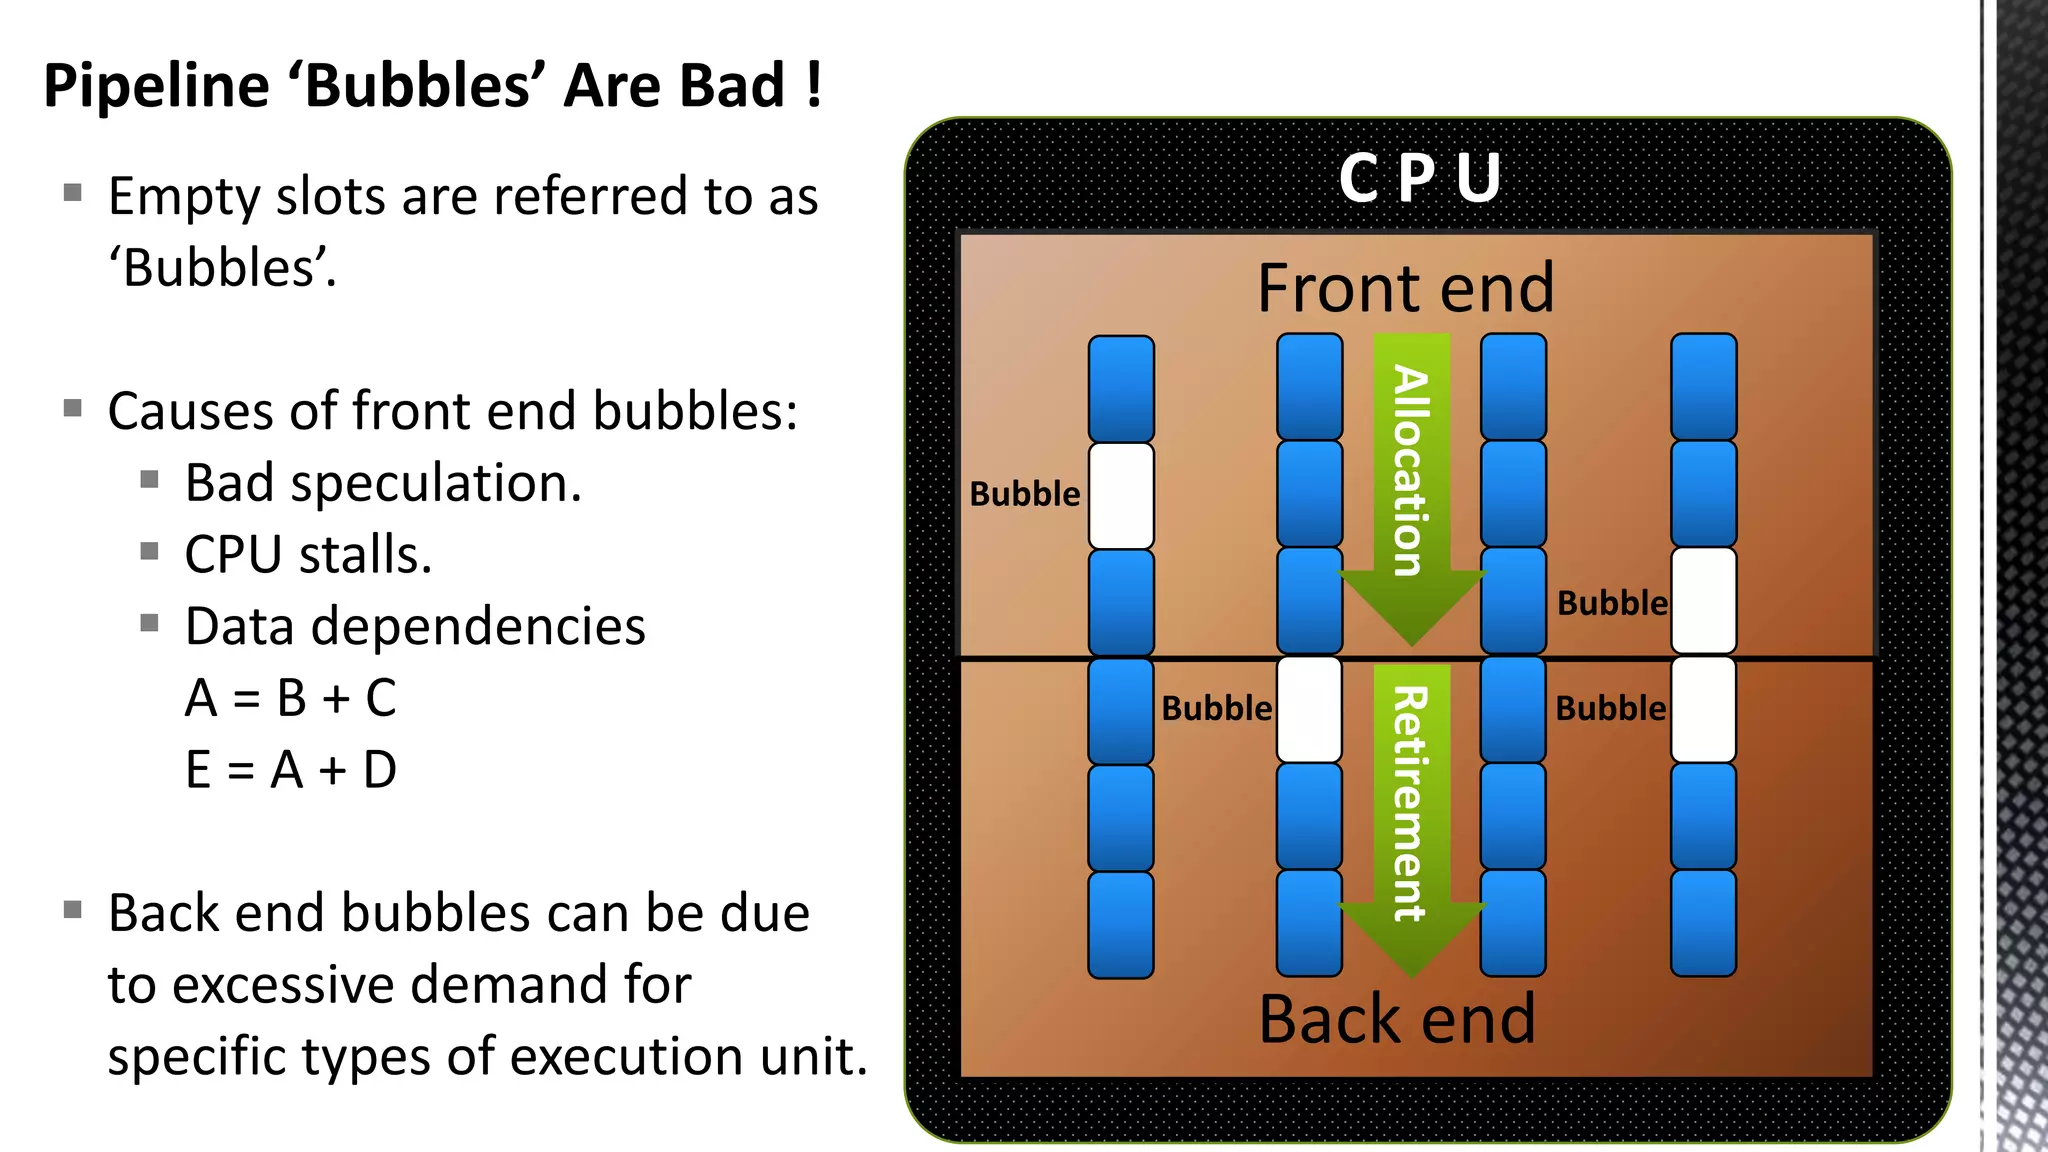
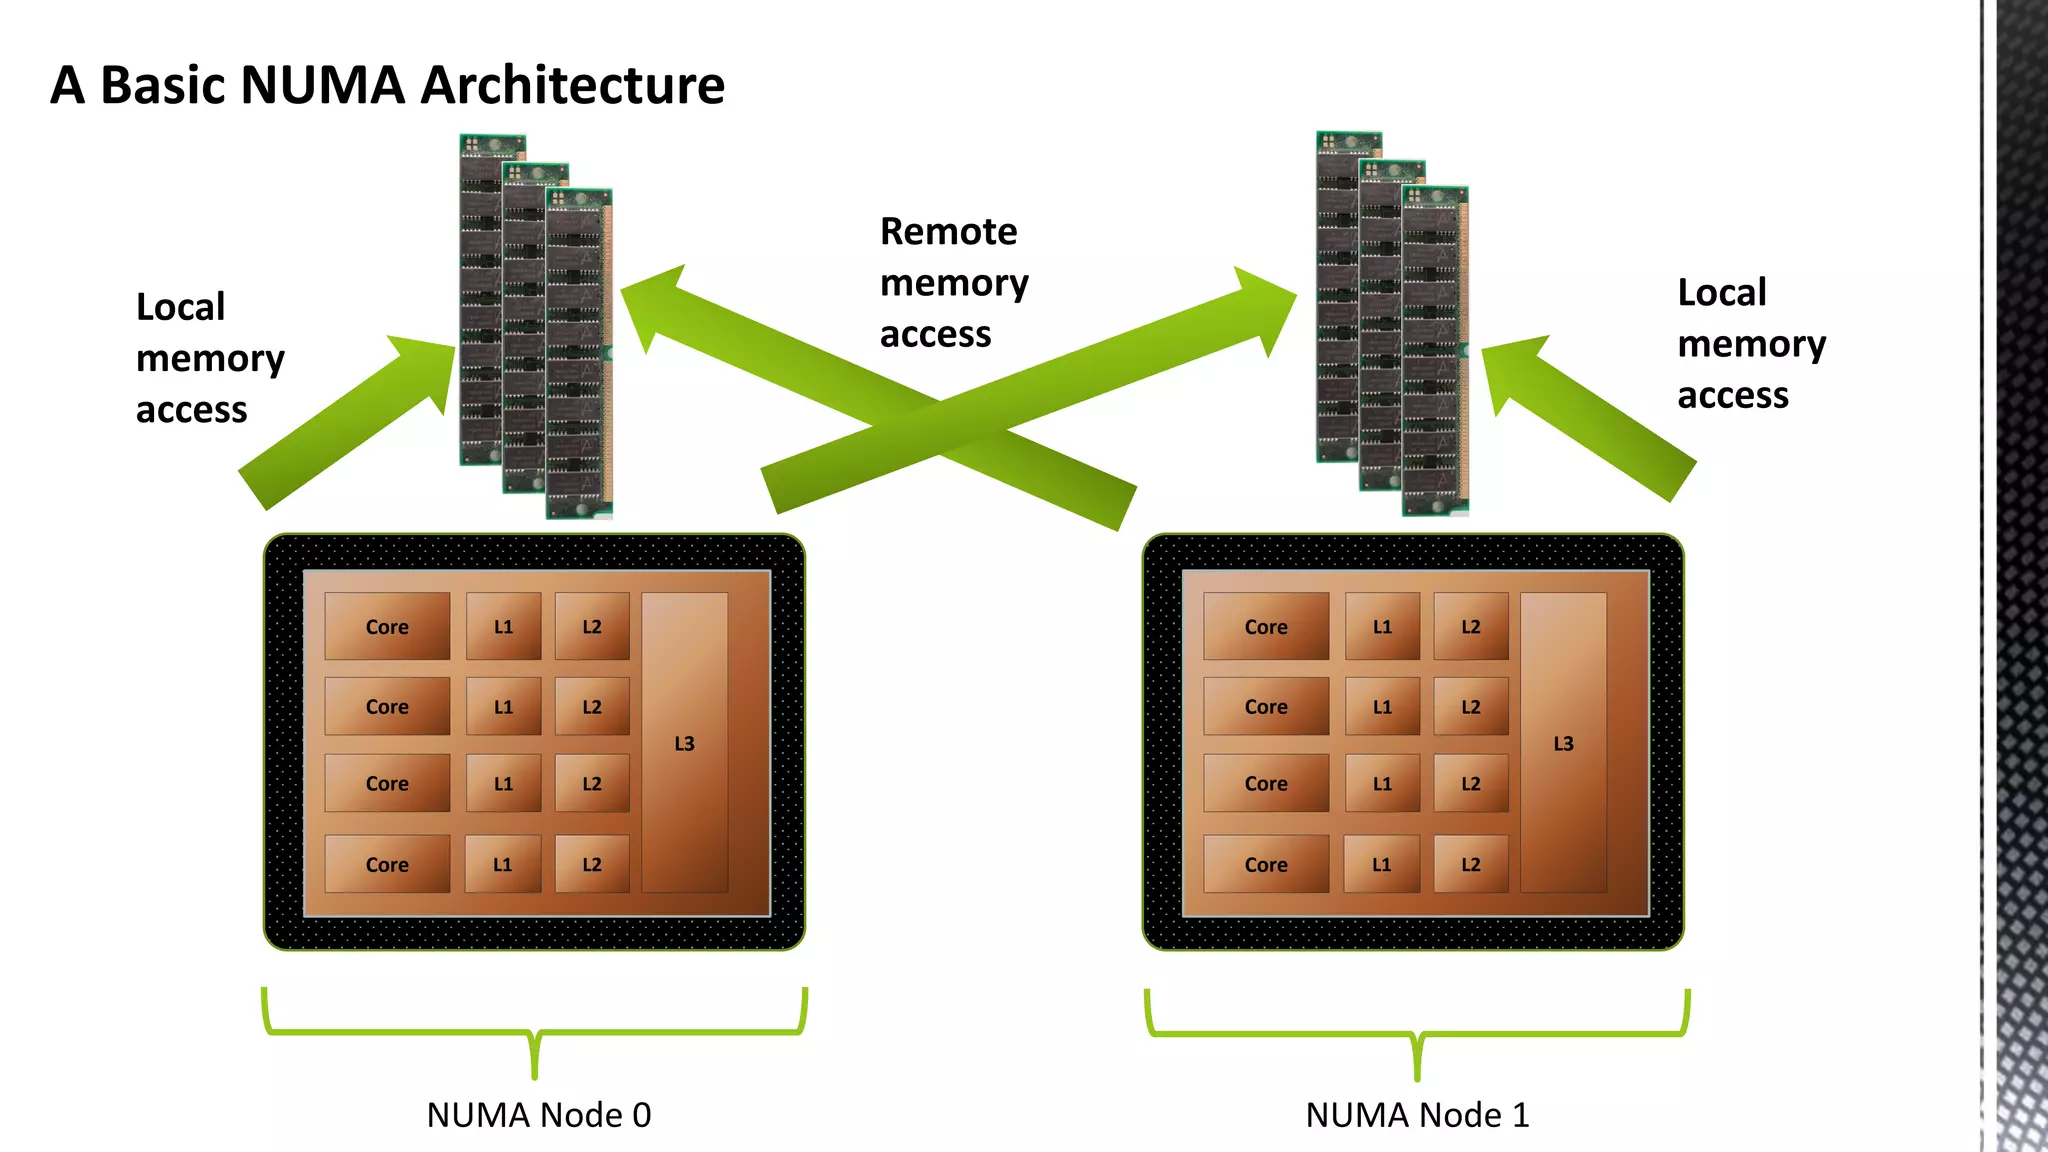
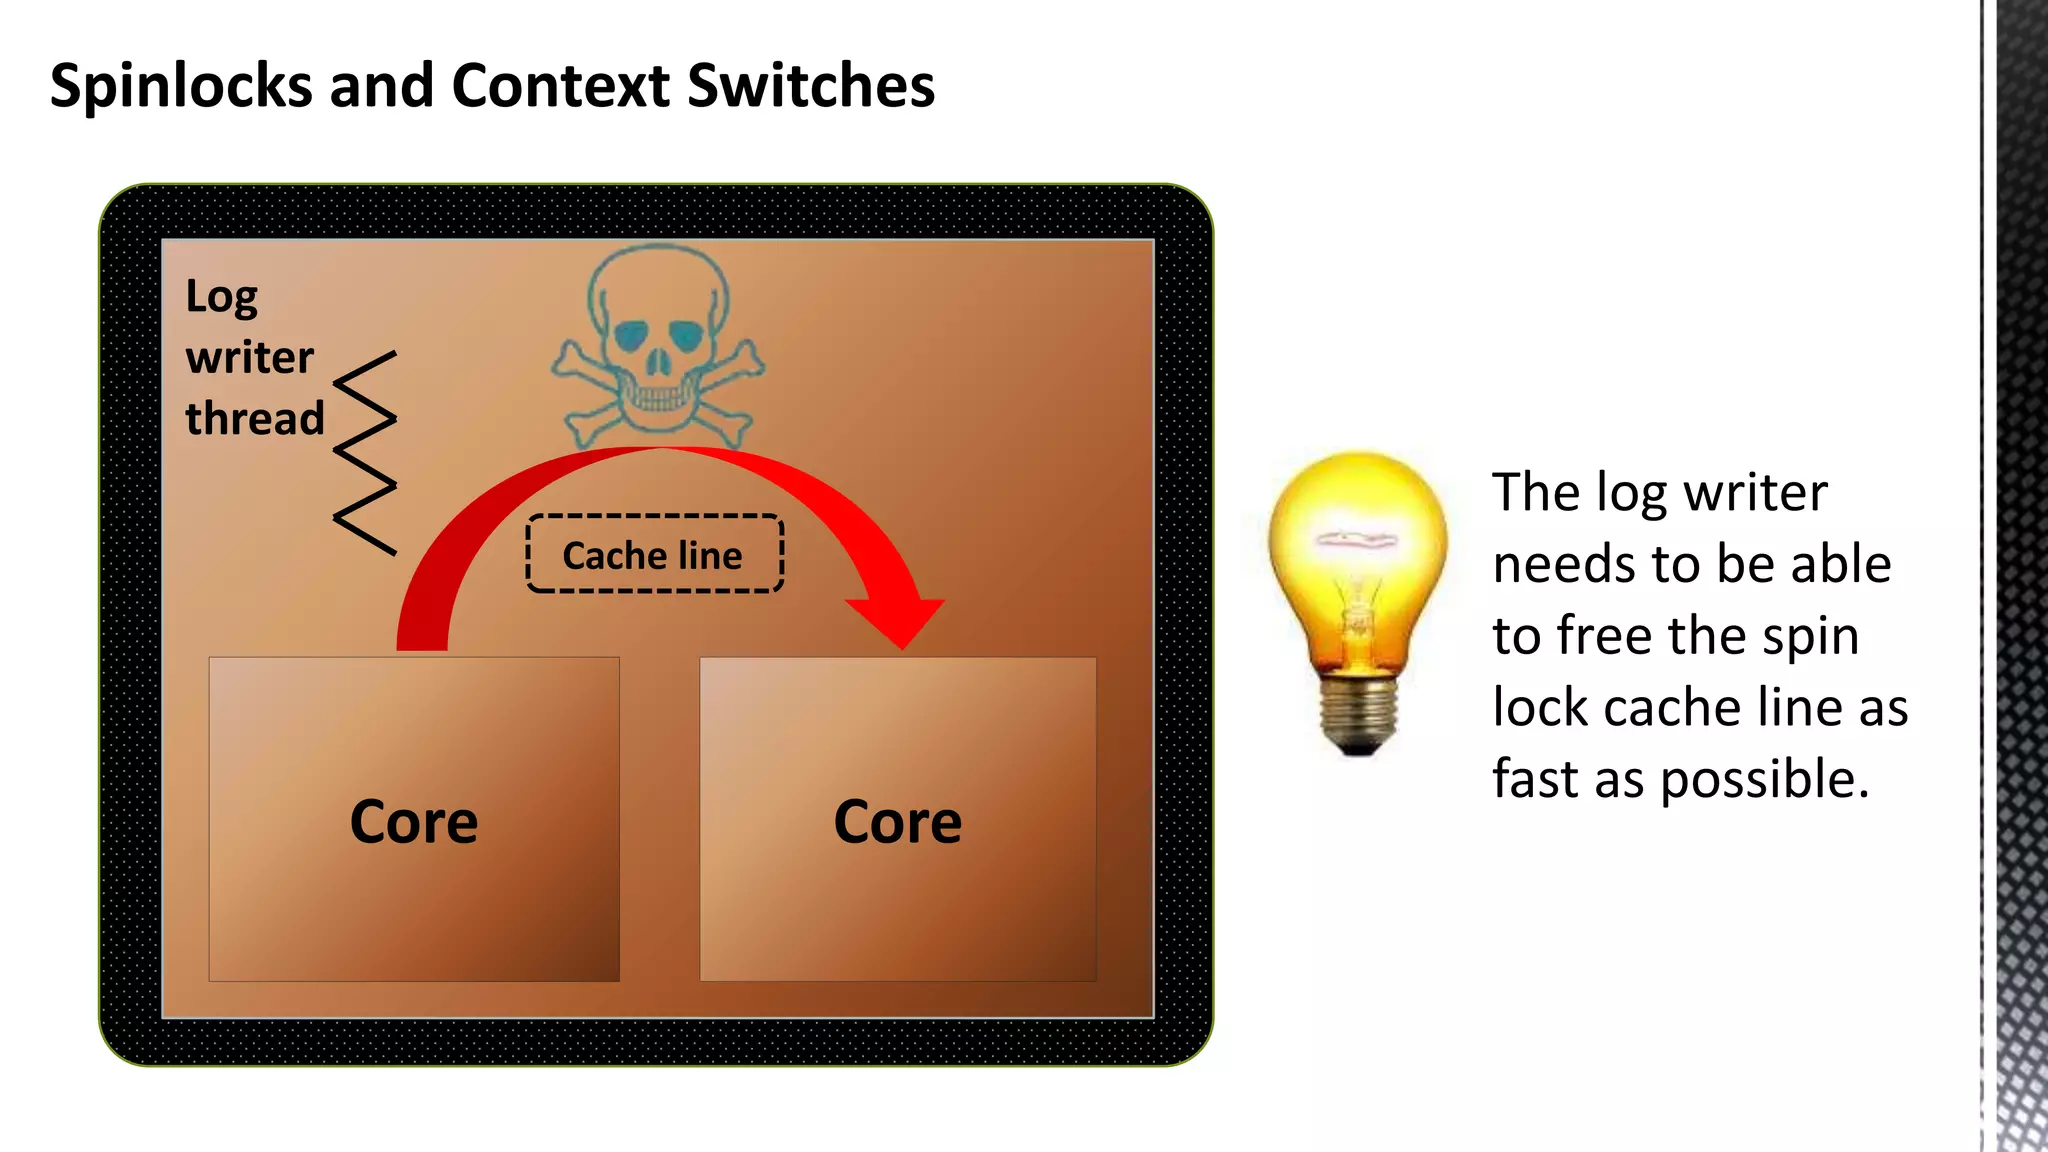
This document discusses CPU cache and memory architectures. It begins with a diagram showing the cache hierarchy from L1 to L3 cache within a CPU. It then discusses how larger CPUs have multiple cores, each with their own L1 and L2 caches sharing a larger L3 cache. The document highlights how main memory bandwidth has not kept up with increasing CPU speeds and caches.