Tanel Poder - Troubleshooting Complex Oracle Performance Issues - Part 2
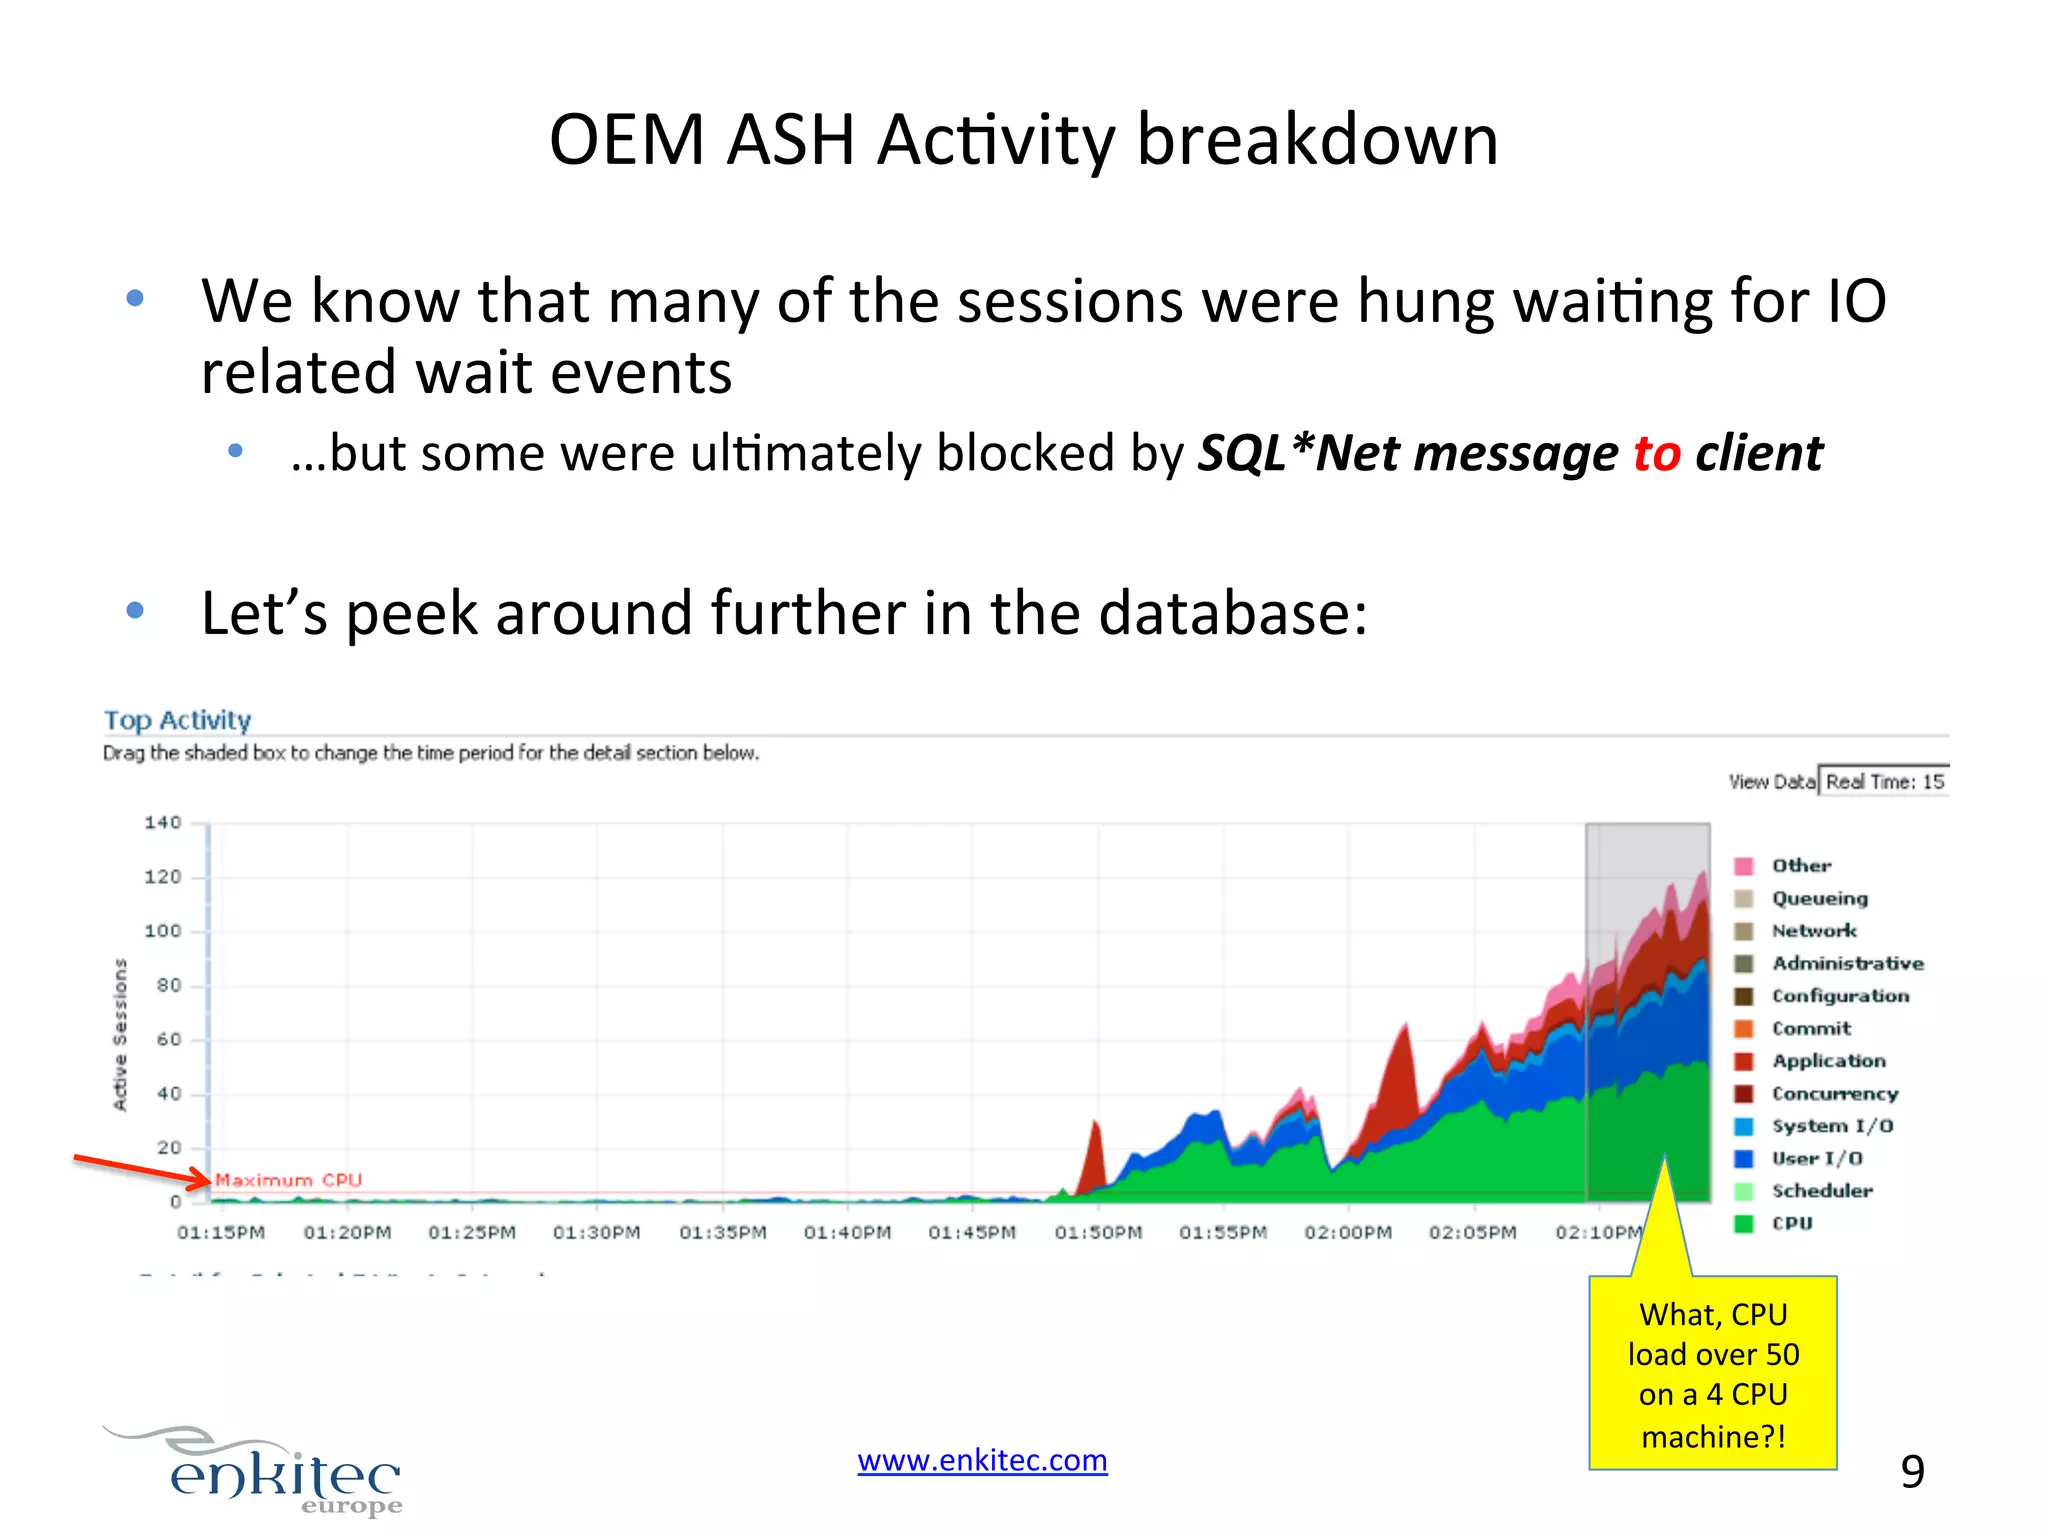
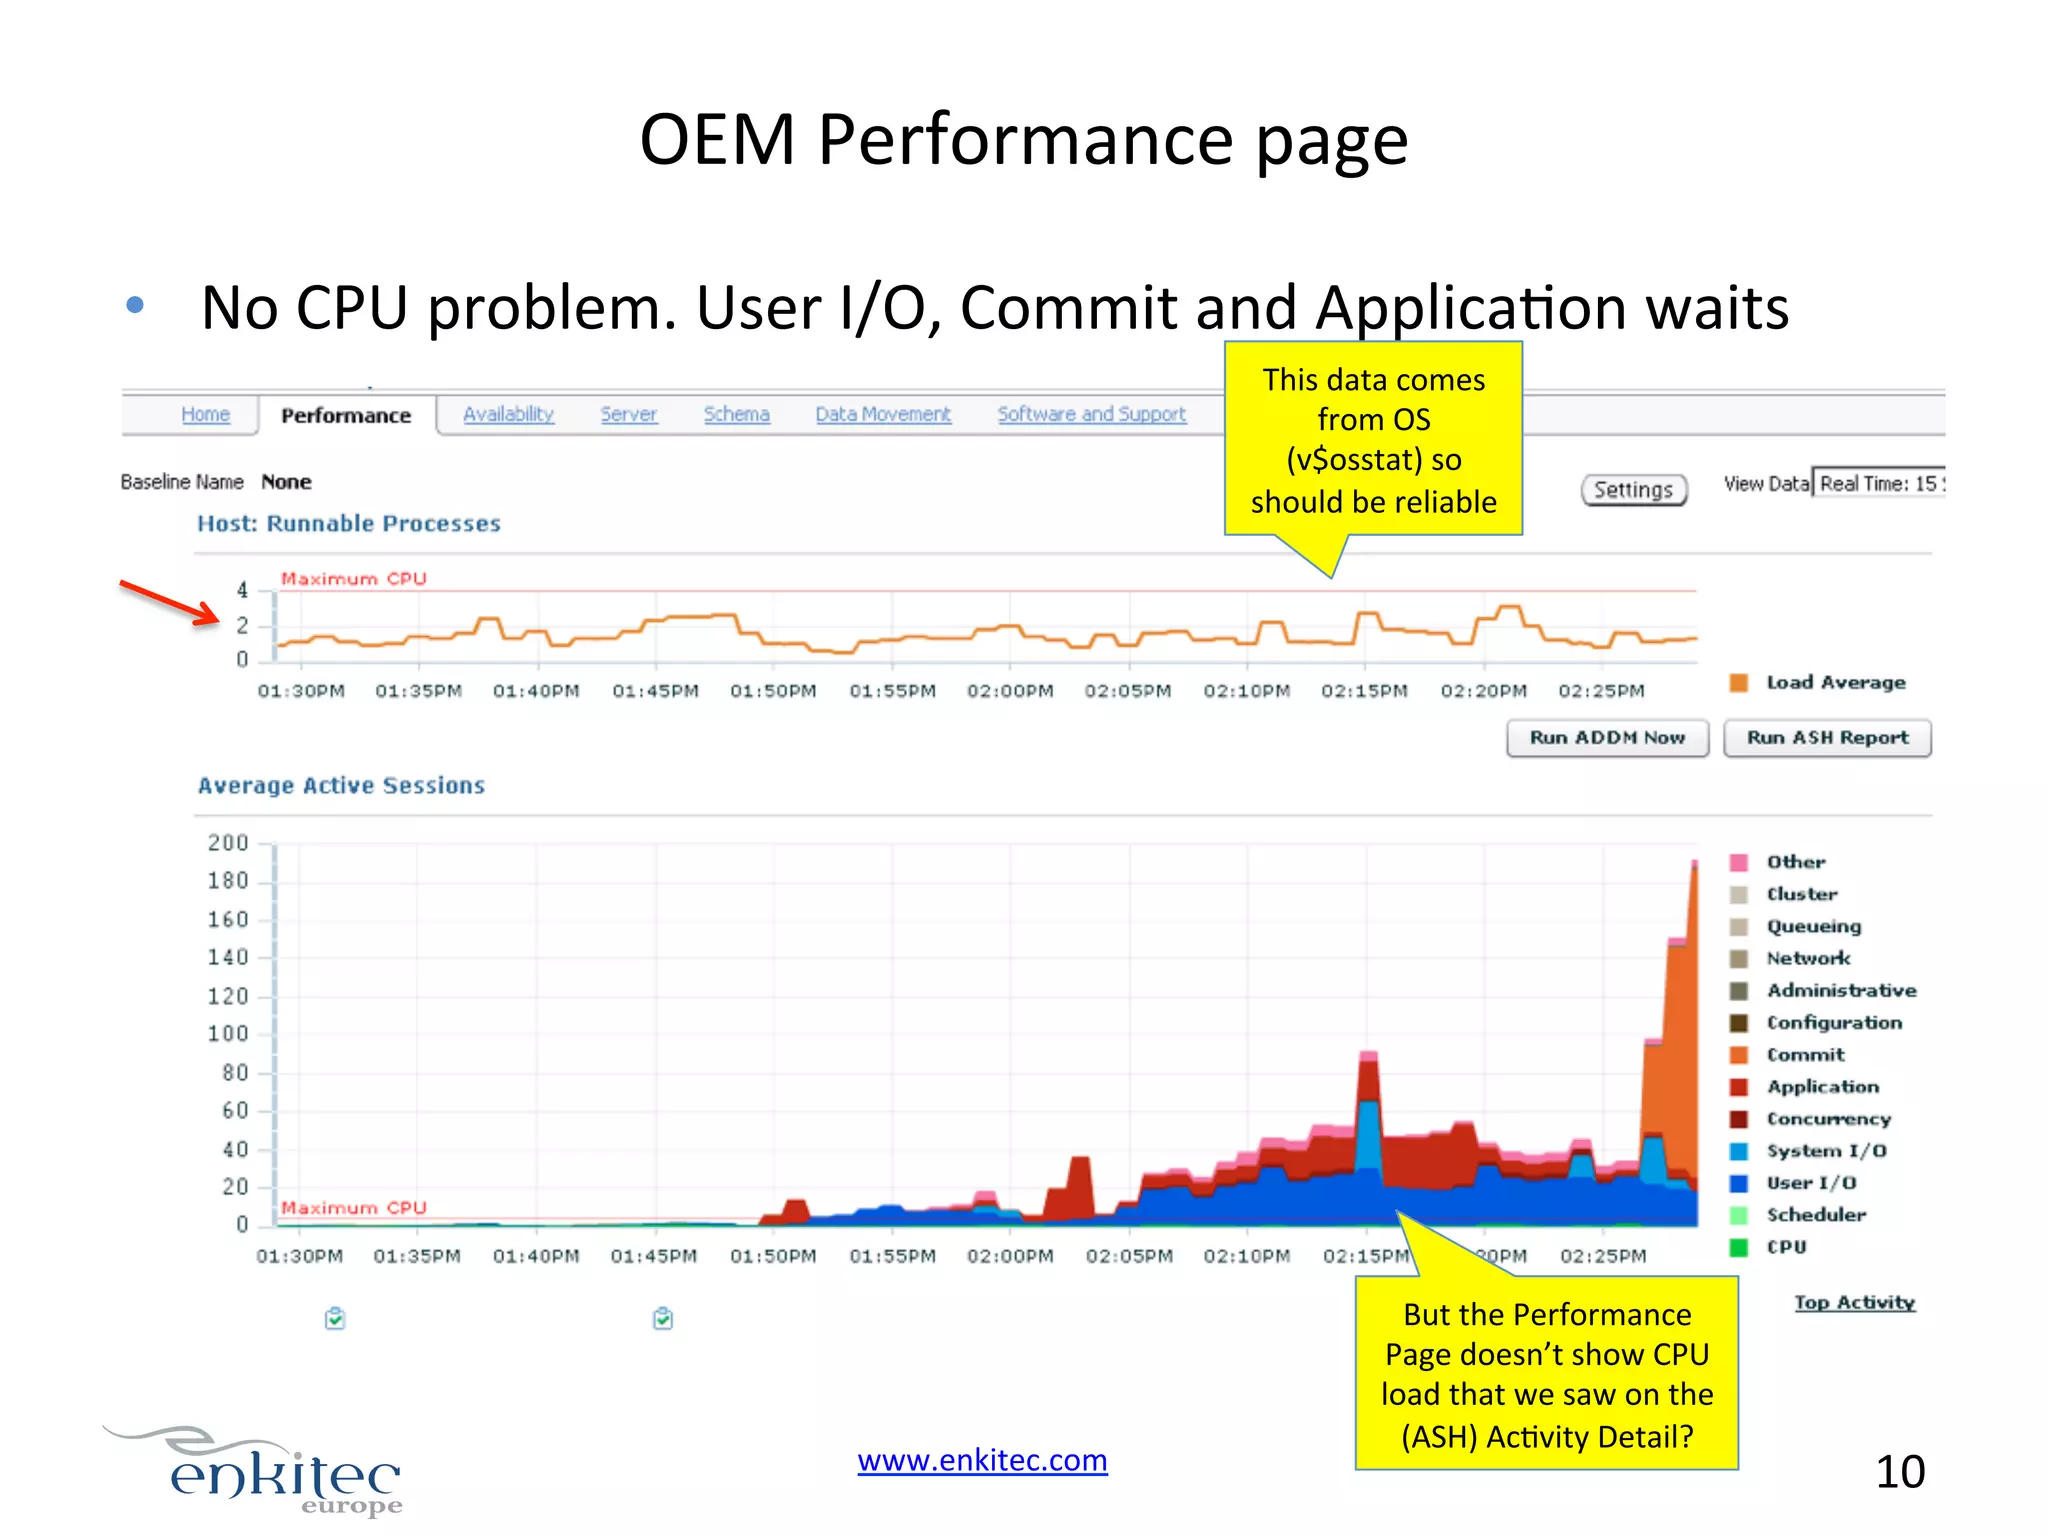
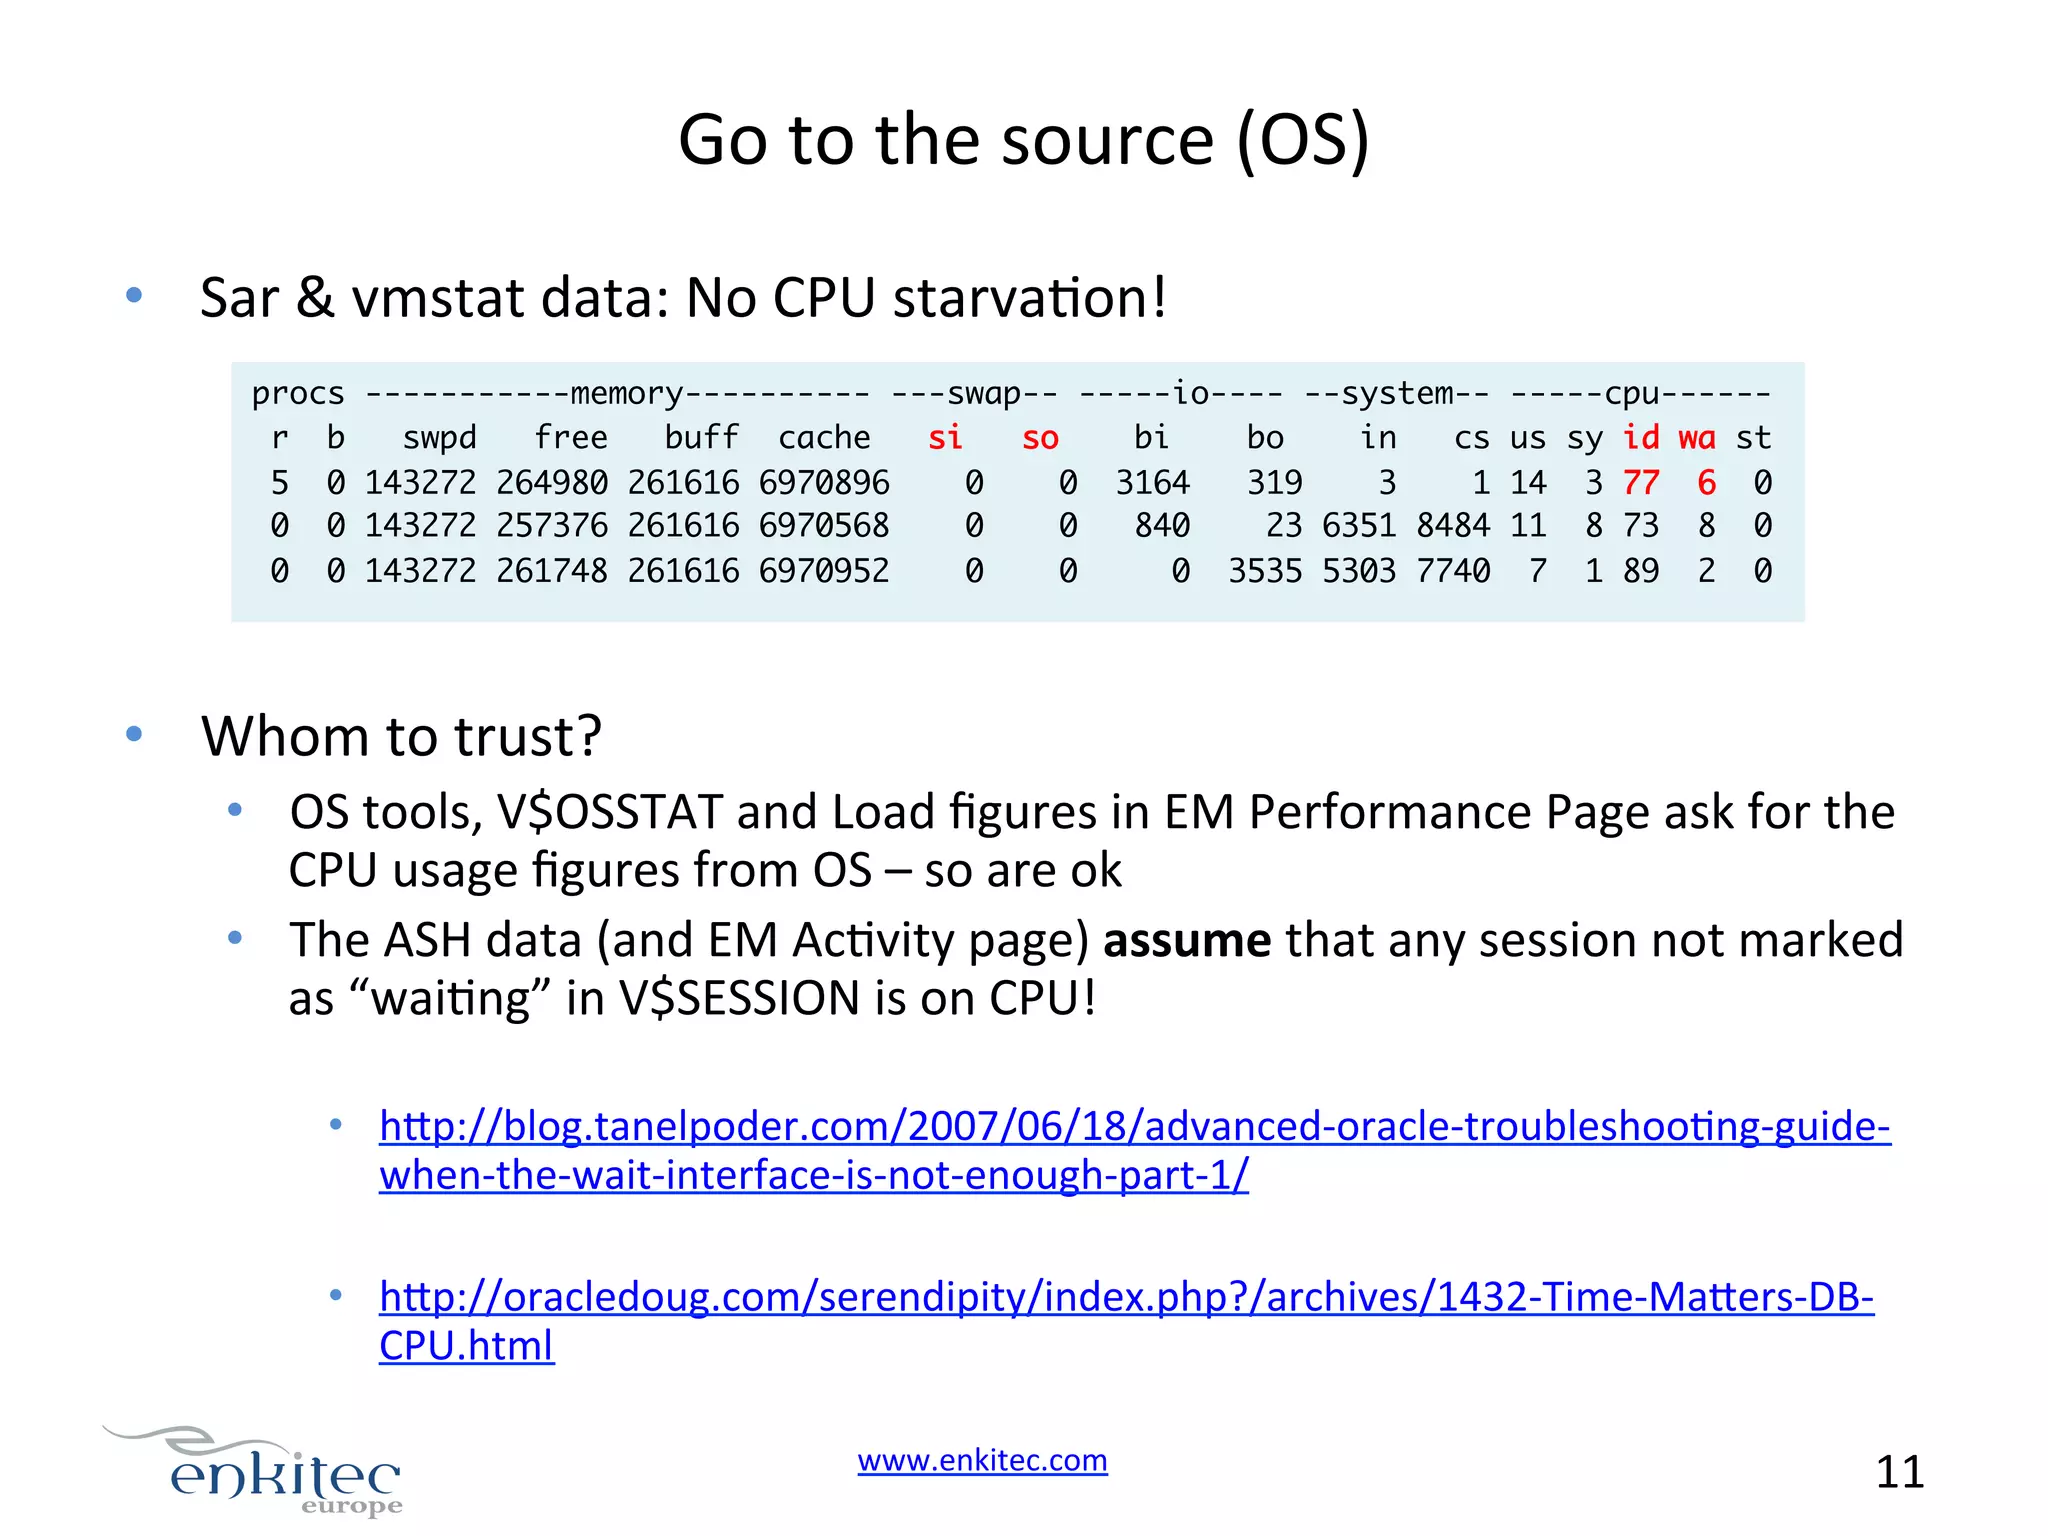
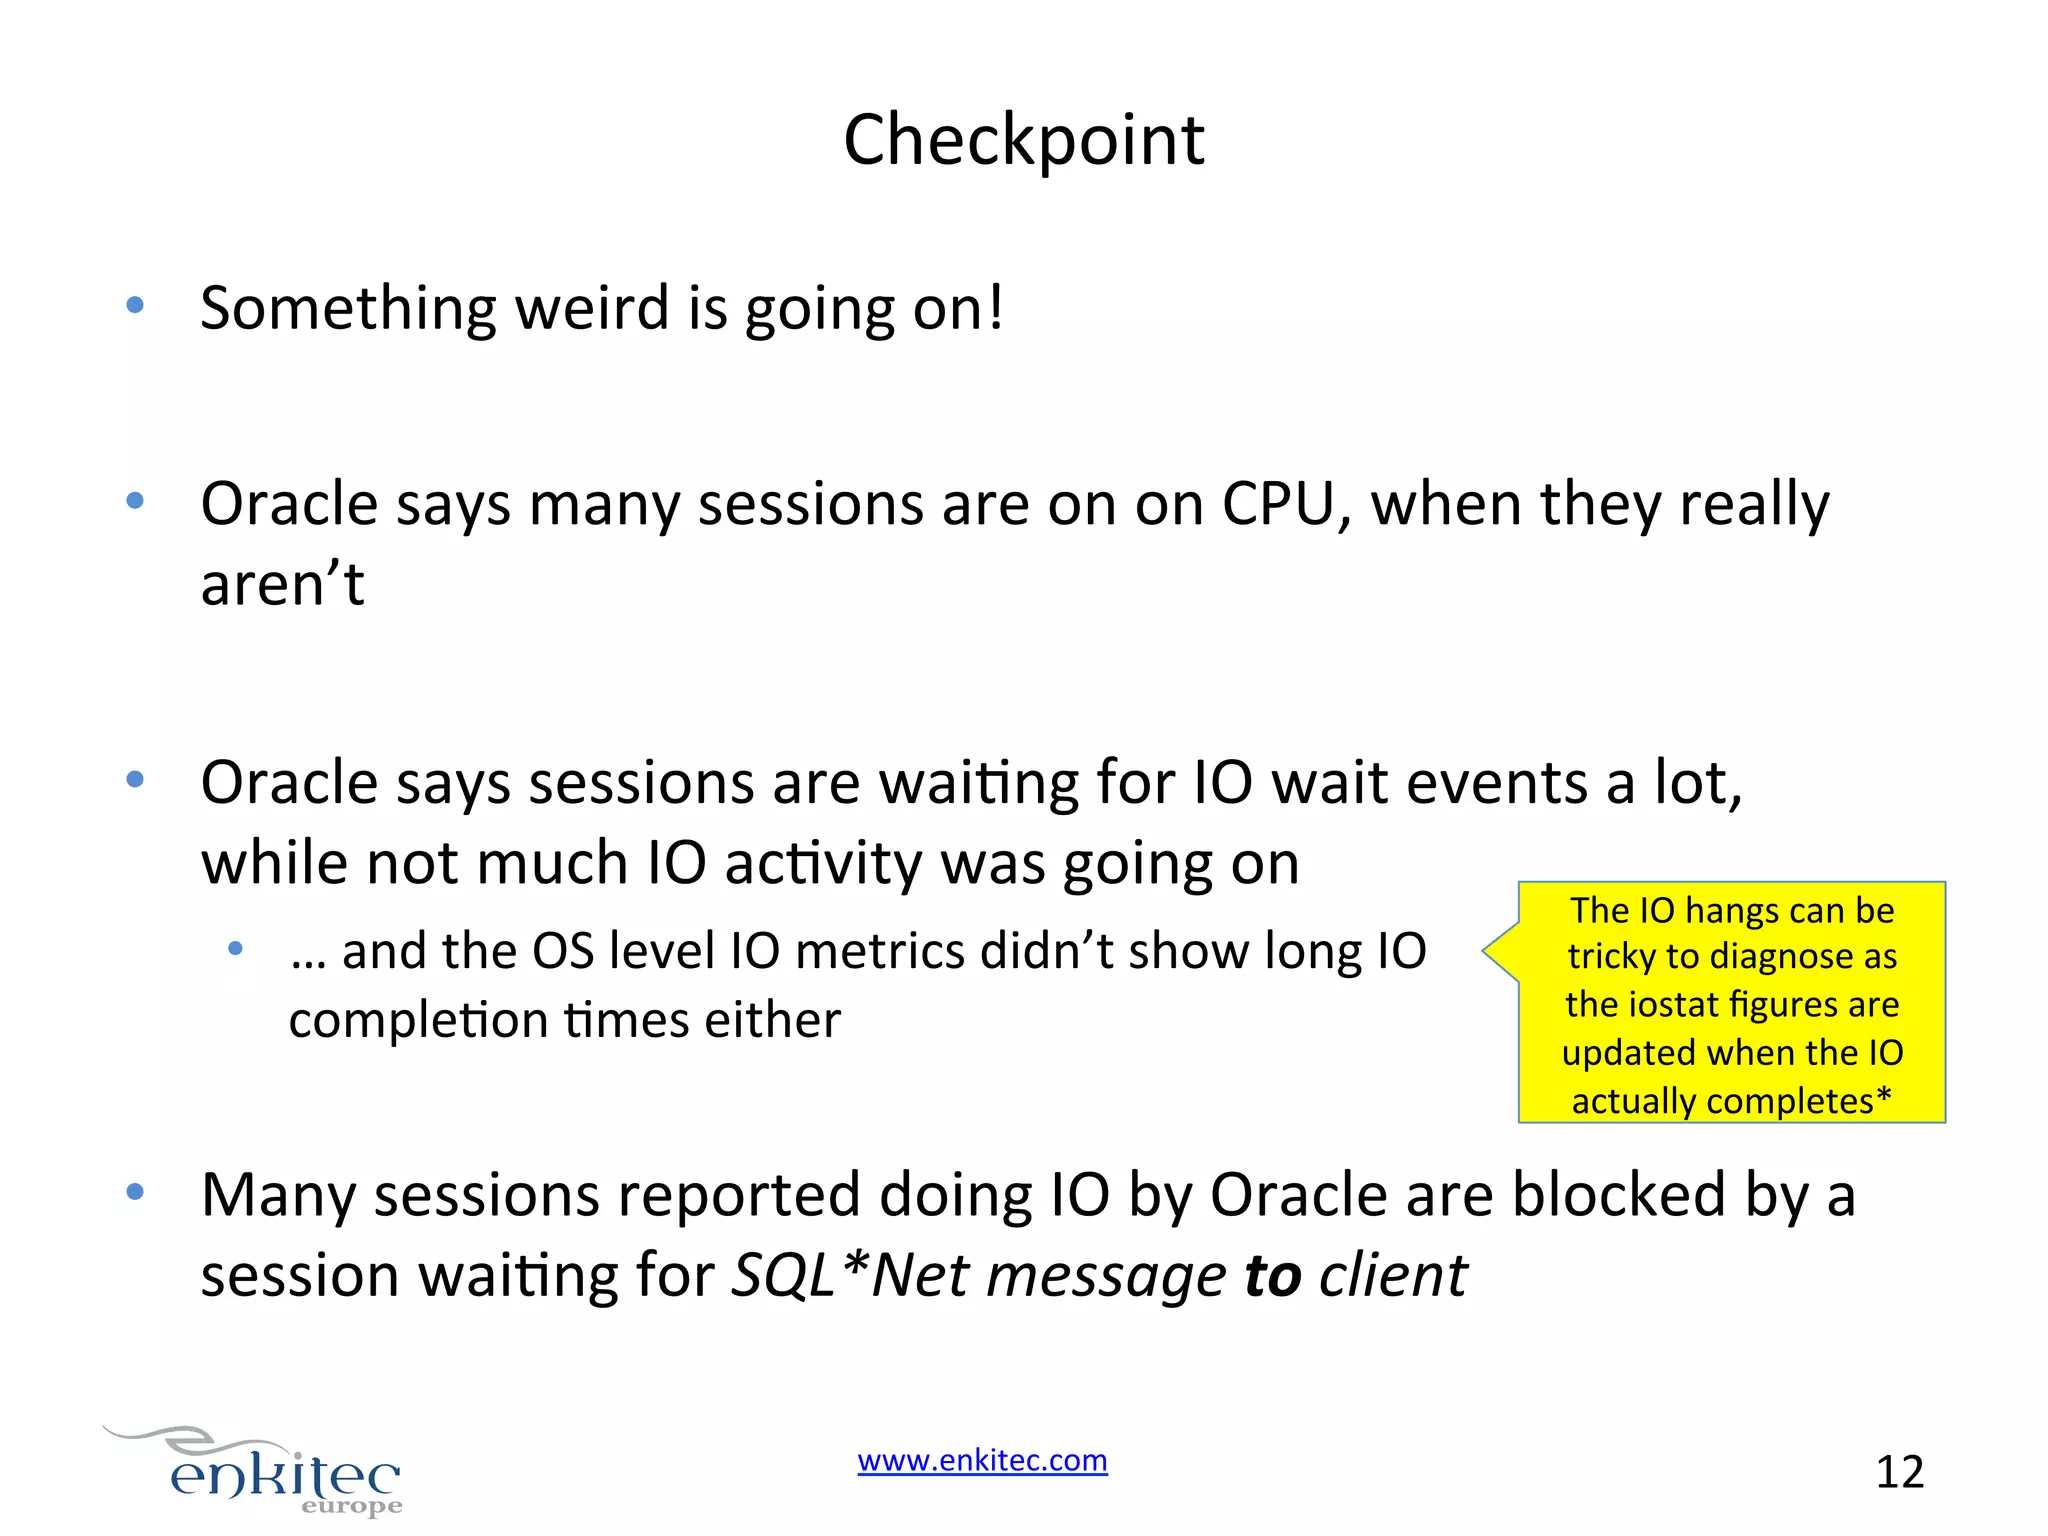
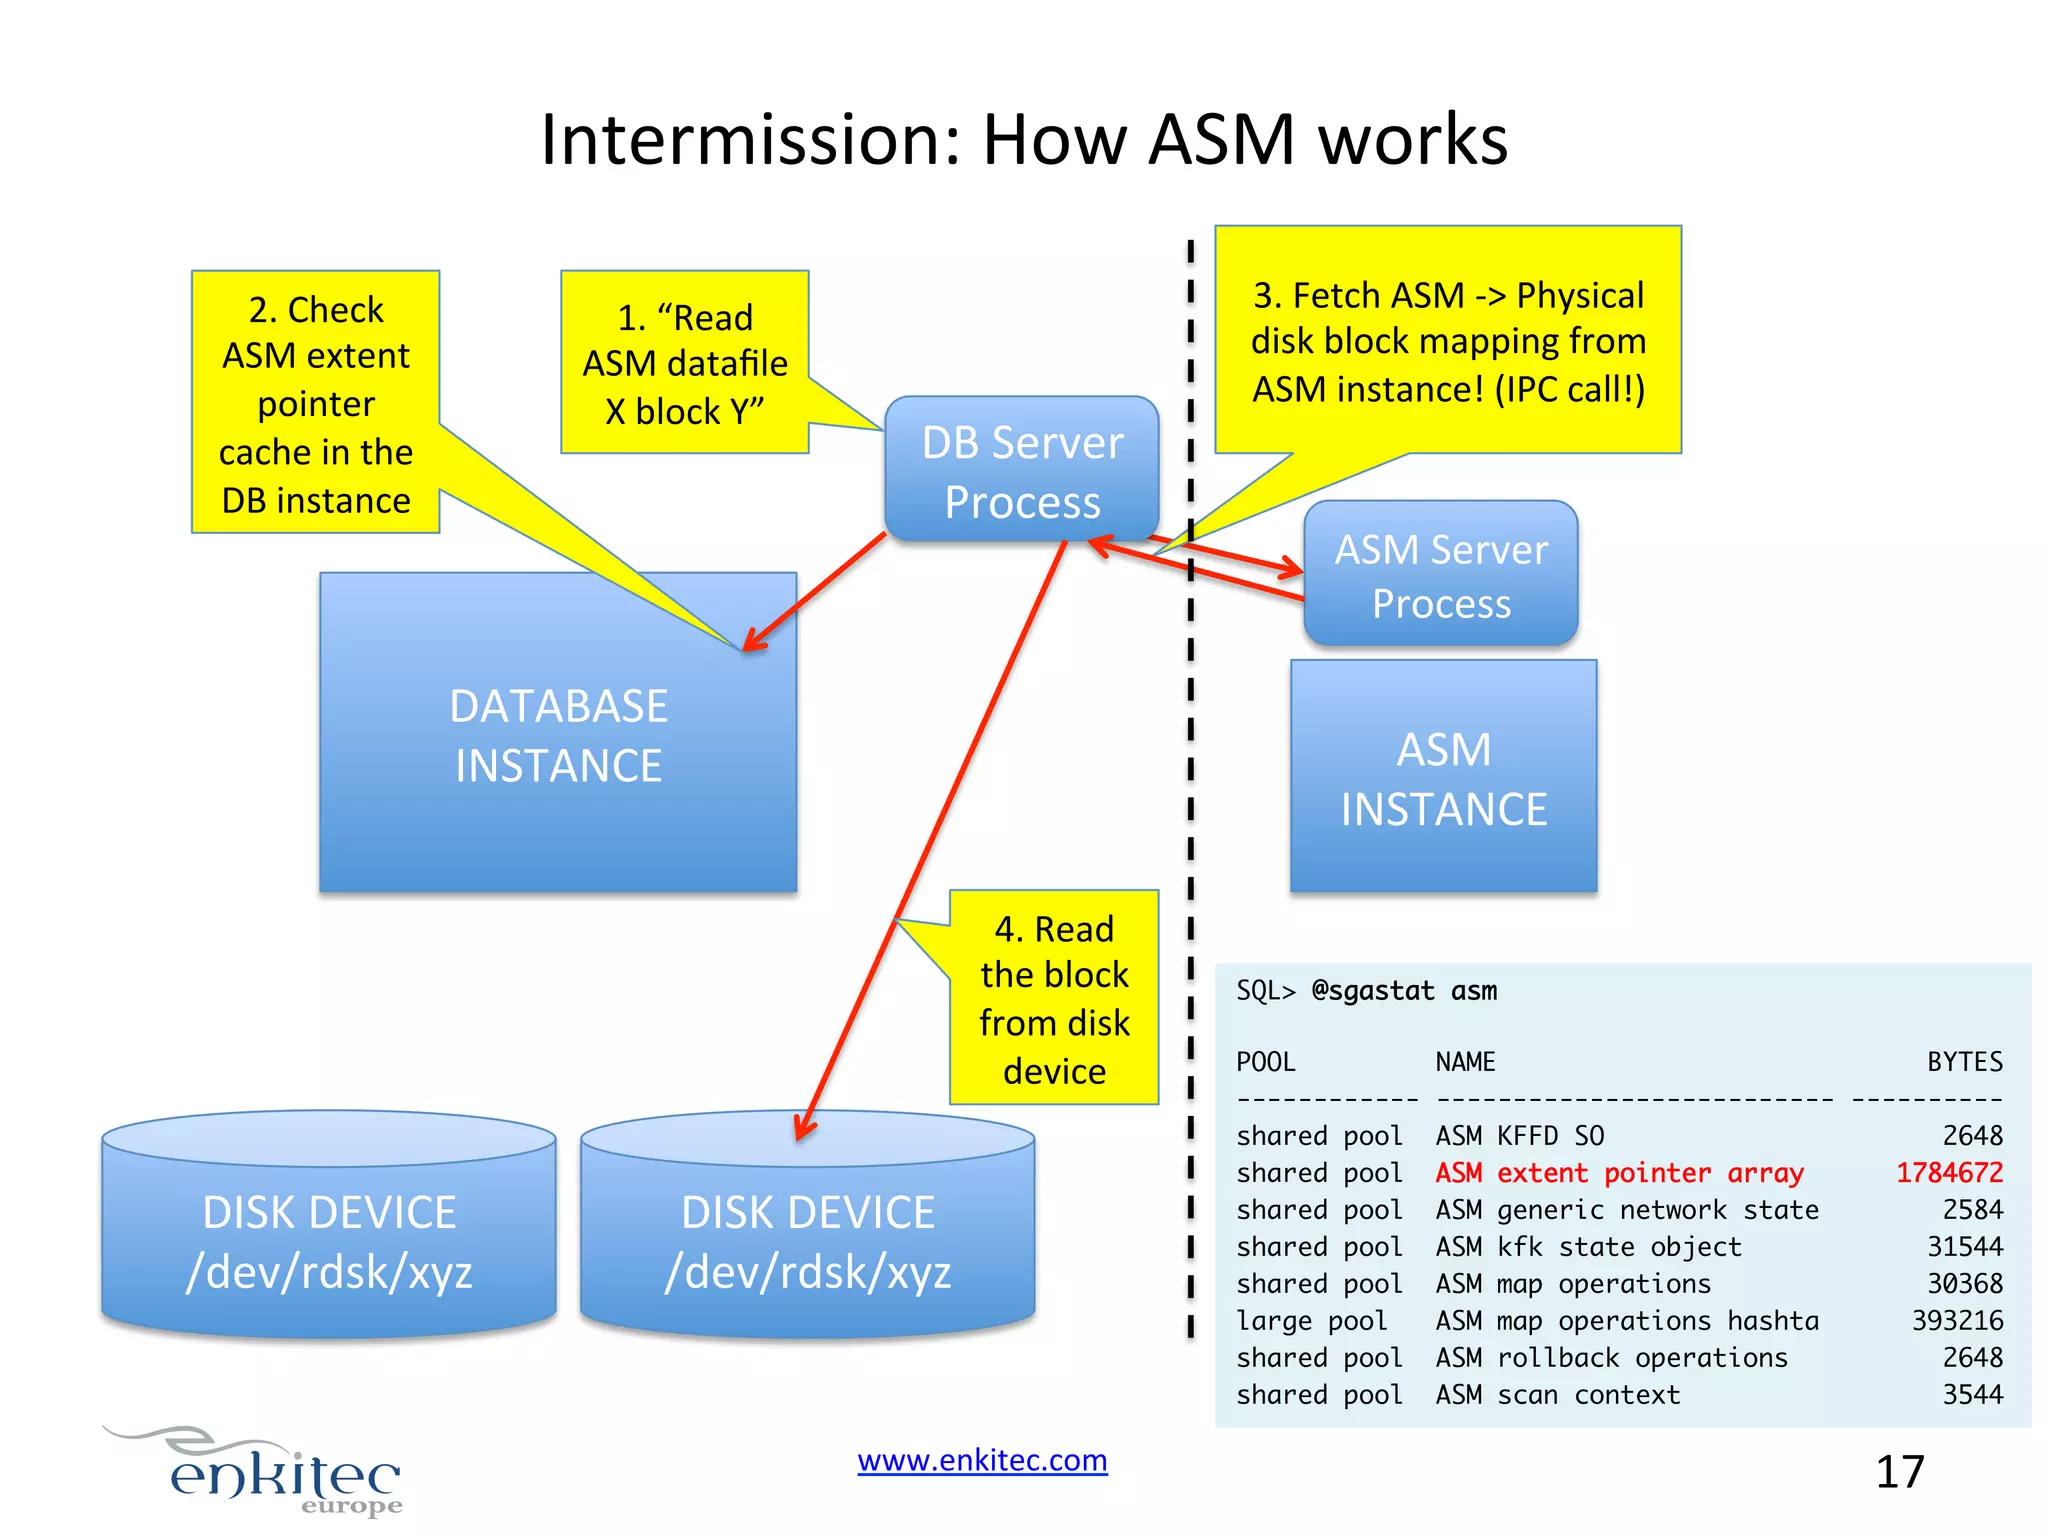
This document summarizes a series of performance issues seen by the author in their work with Oracle Exadata systems. It describes random session hangs occurring across several minutes, with long transaction locks and I/O waits seen. Analysis of AWR reports and blocking trees revealed that many sessions were blocked waiting on I/O, though initial I/O metrics from the OS did not show issues. Further analysis using ASH activity breakdowns and OS tools like sar and vmstat found high apparent CPU usage in ASH that was not reflected in actual low CPU load on the system. This discrepancy was due to the way ASH attributes non-waiting time to CPU. The root cause remained unclear.
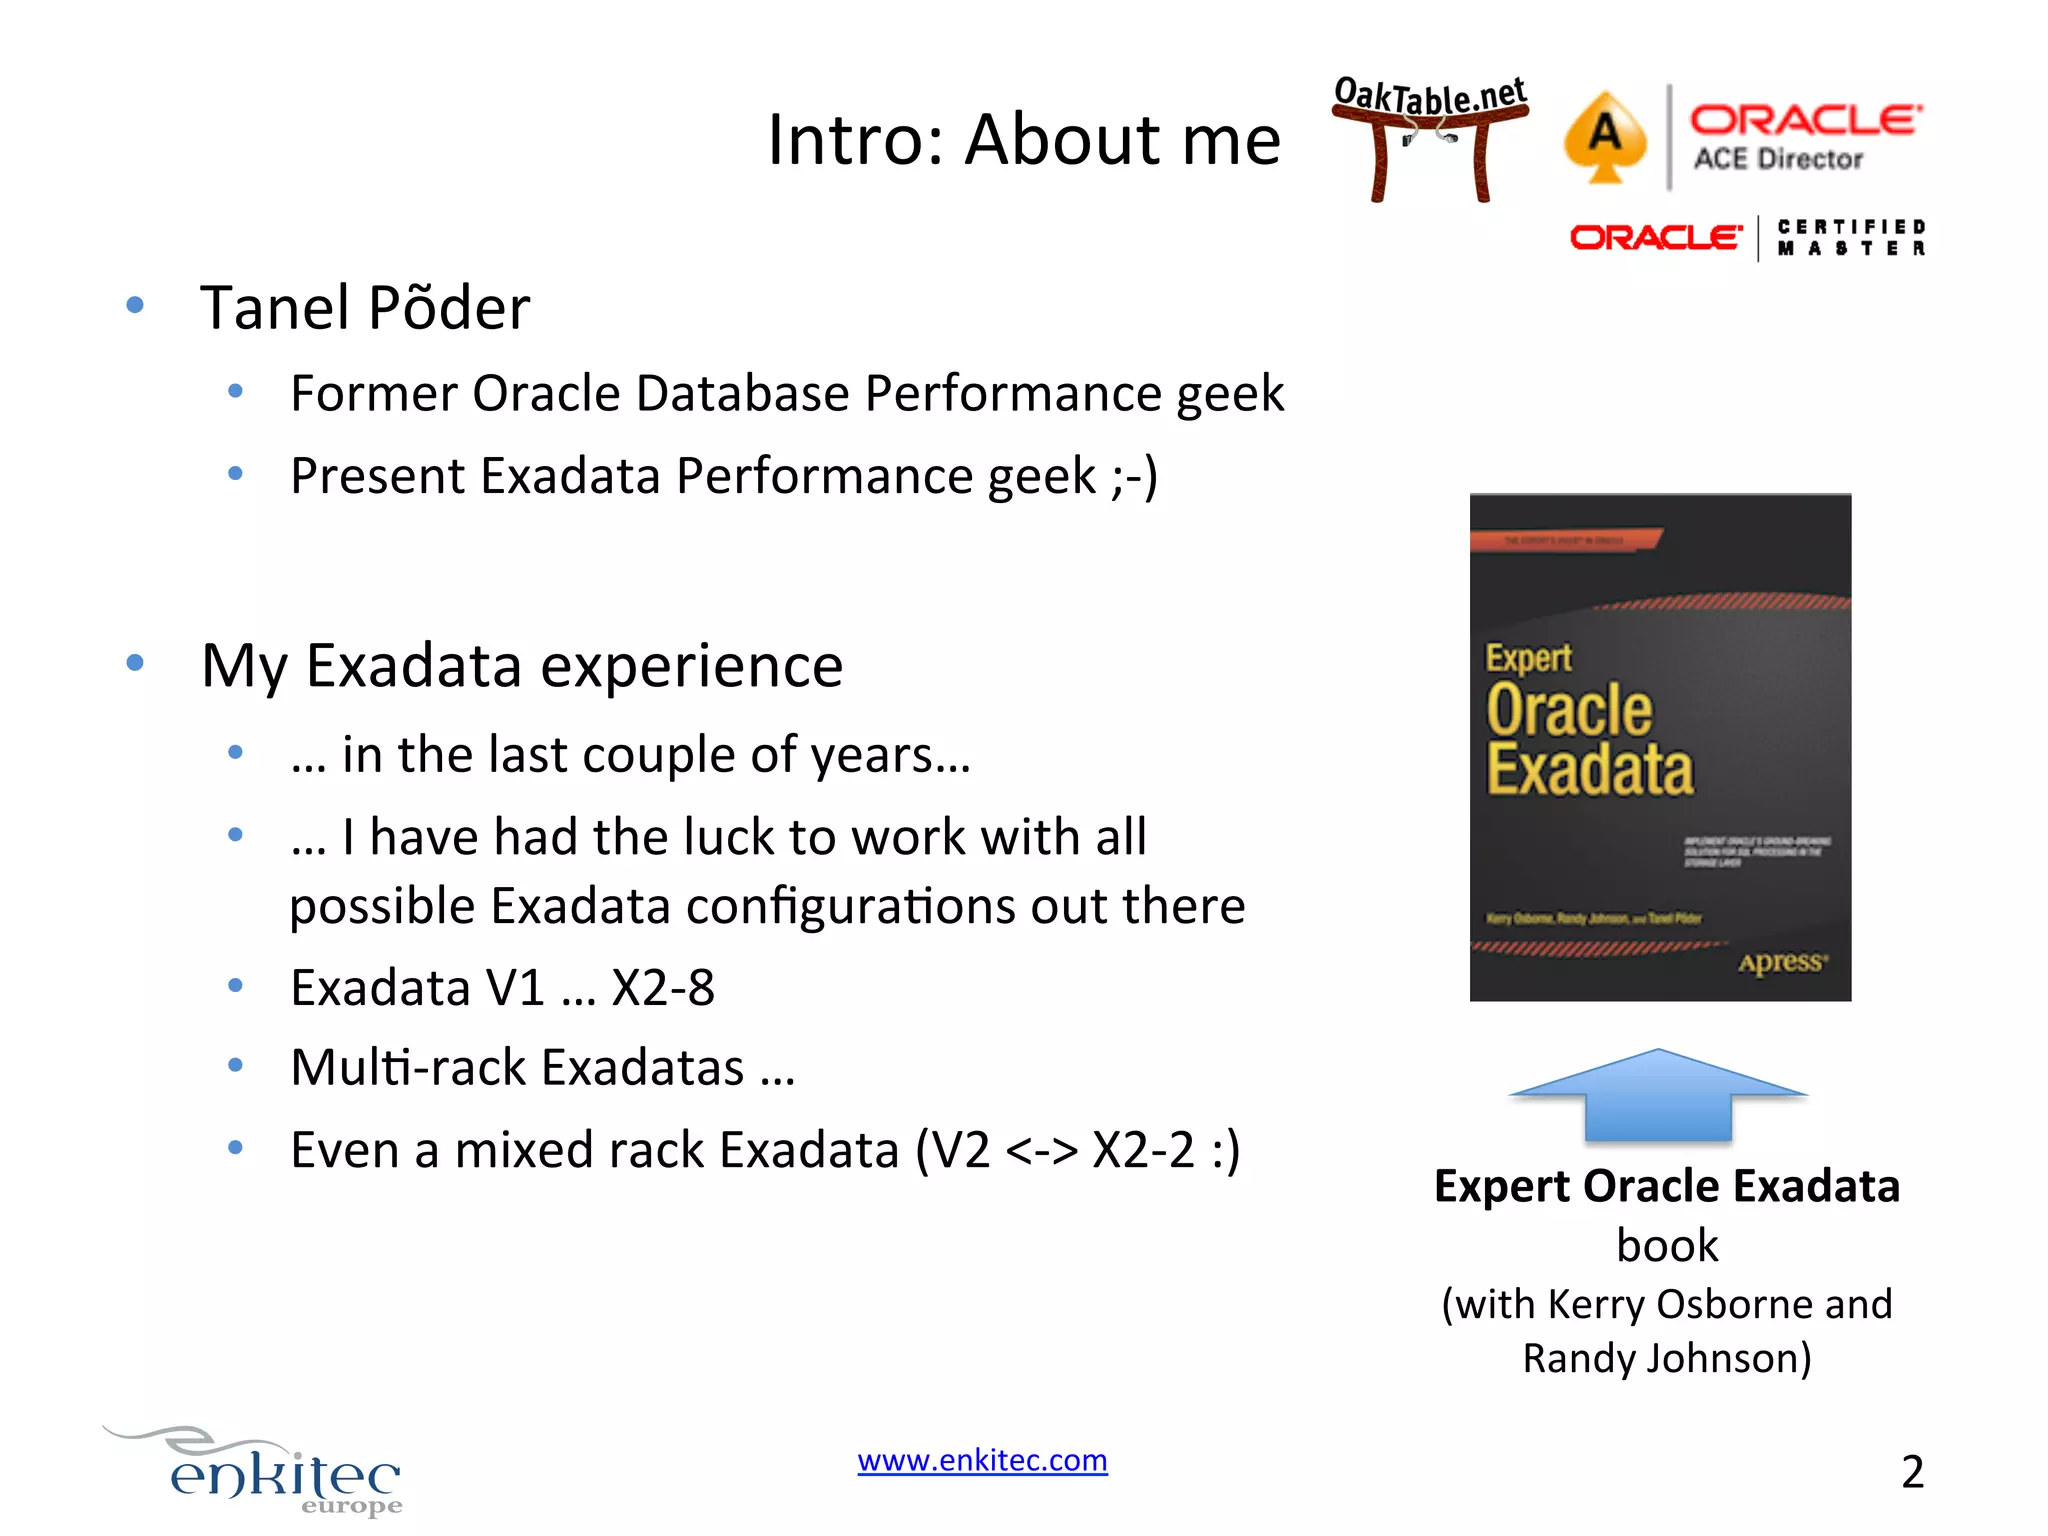
Tanel Põder introduces himself as an expert in Oracle and Exadata performance, sharing his diverse experience with different Exadata configurations.
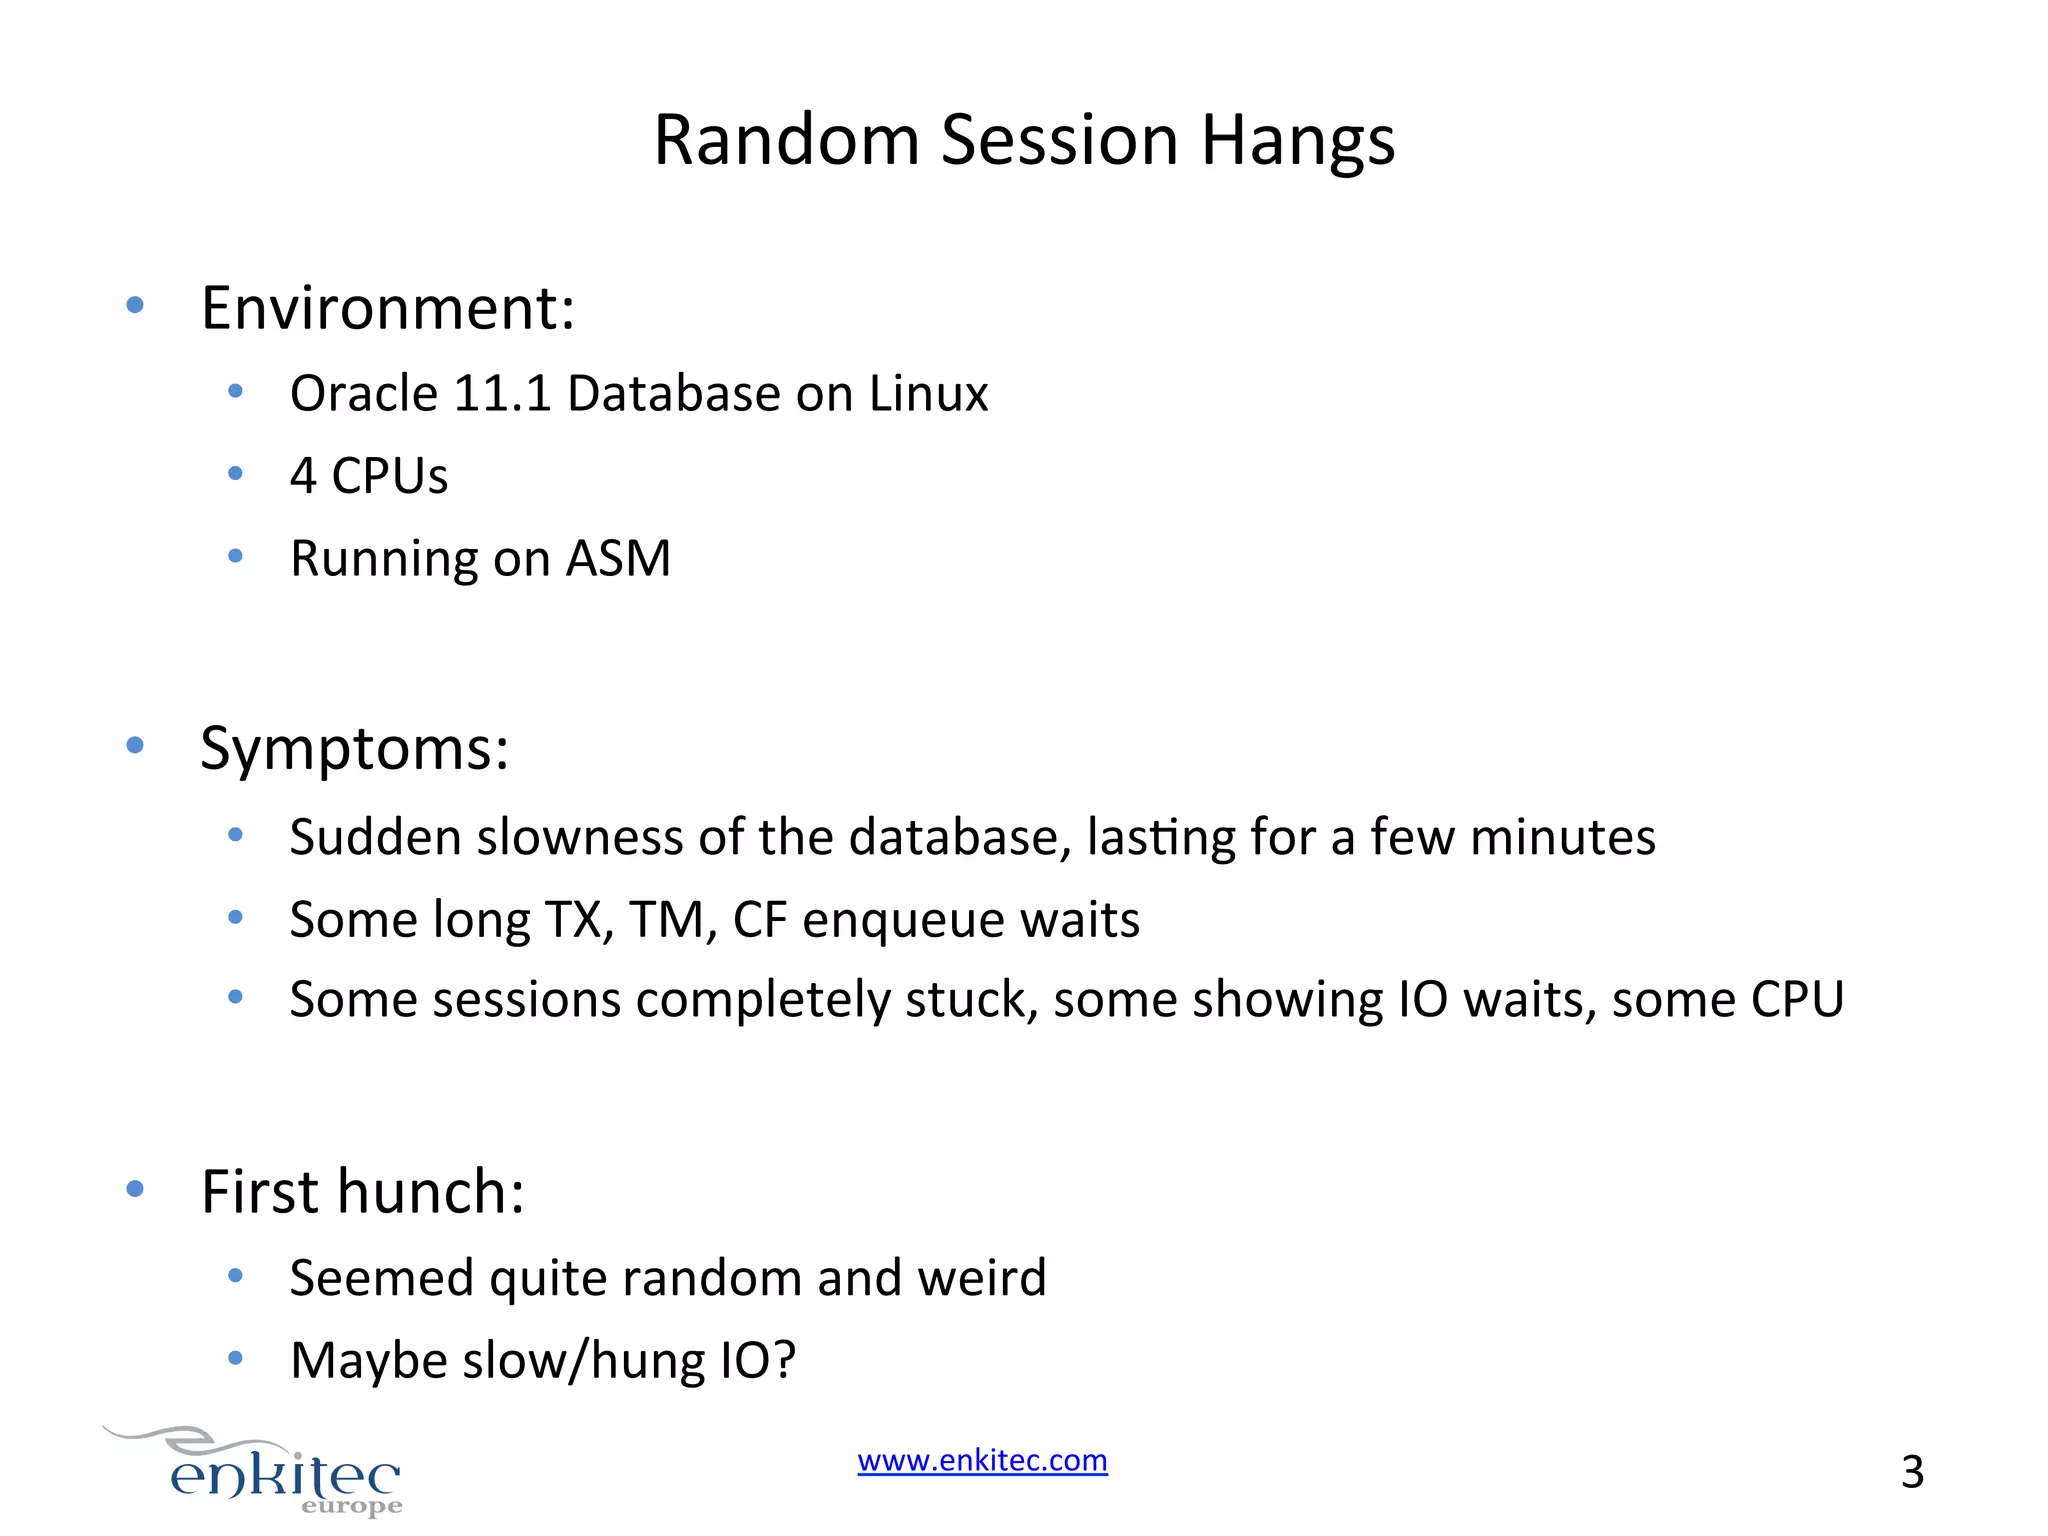
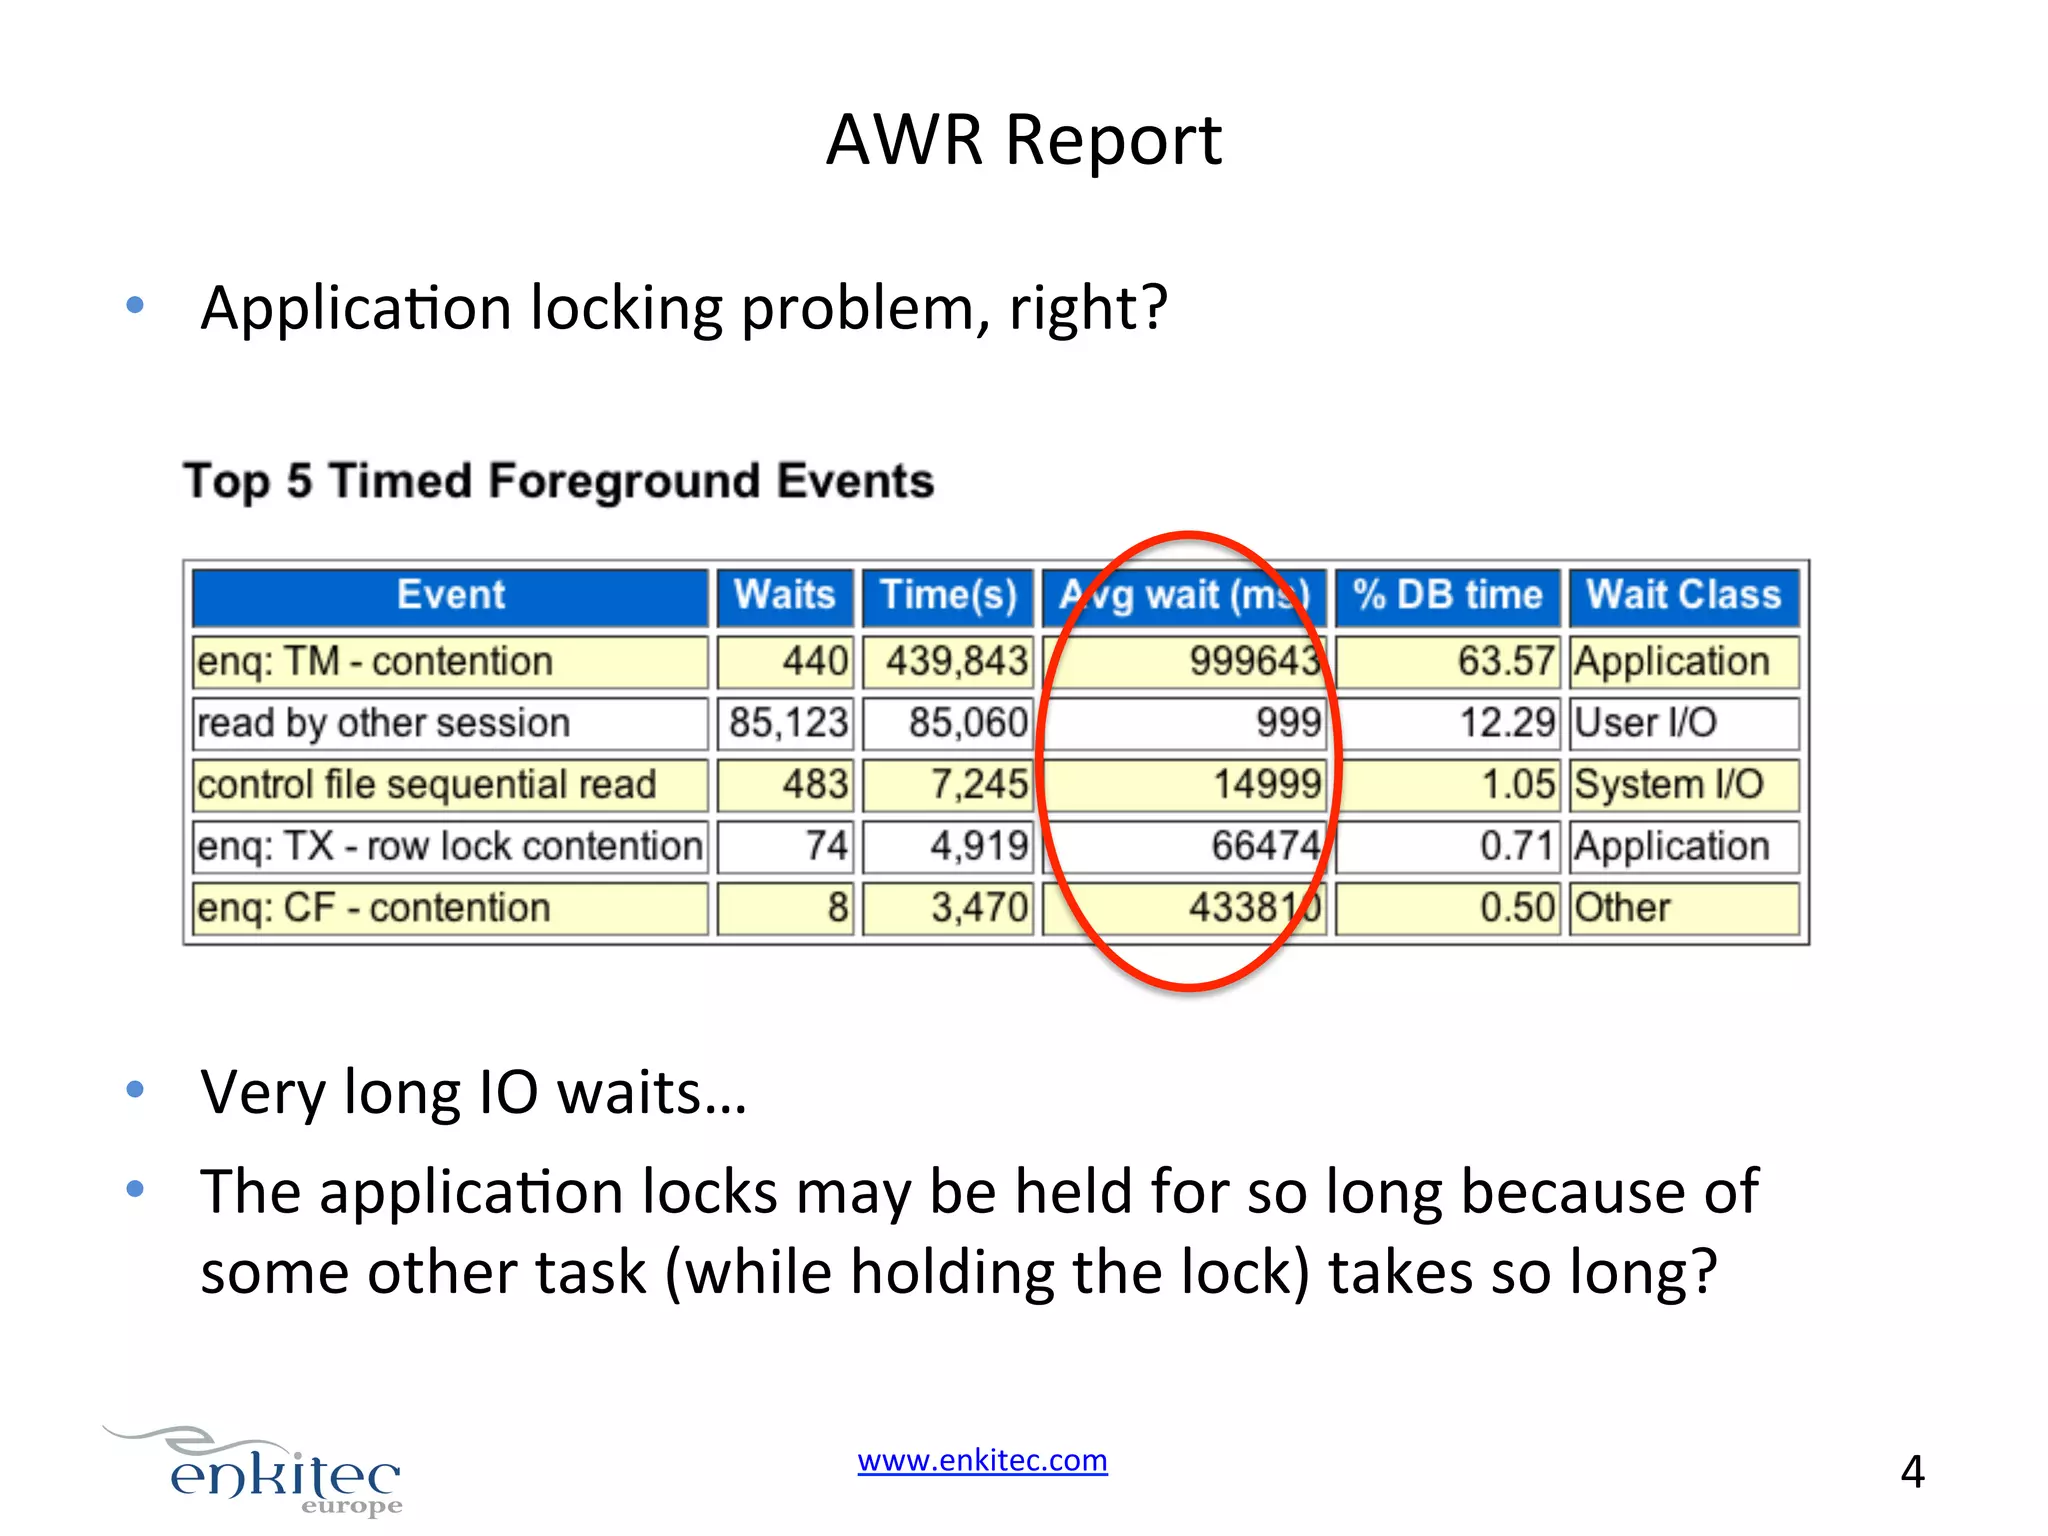
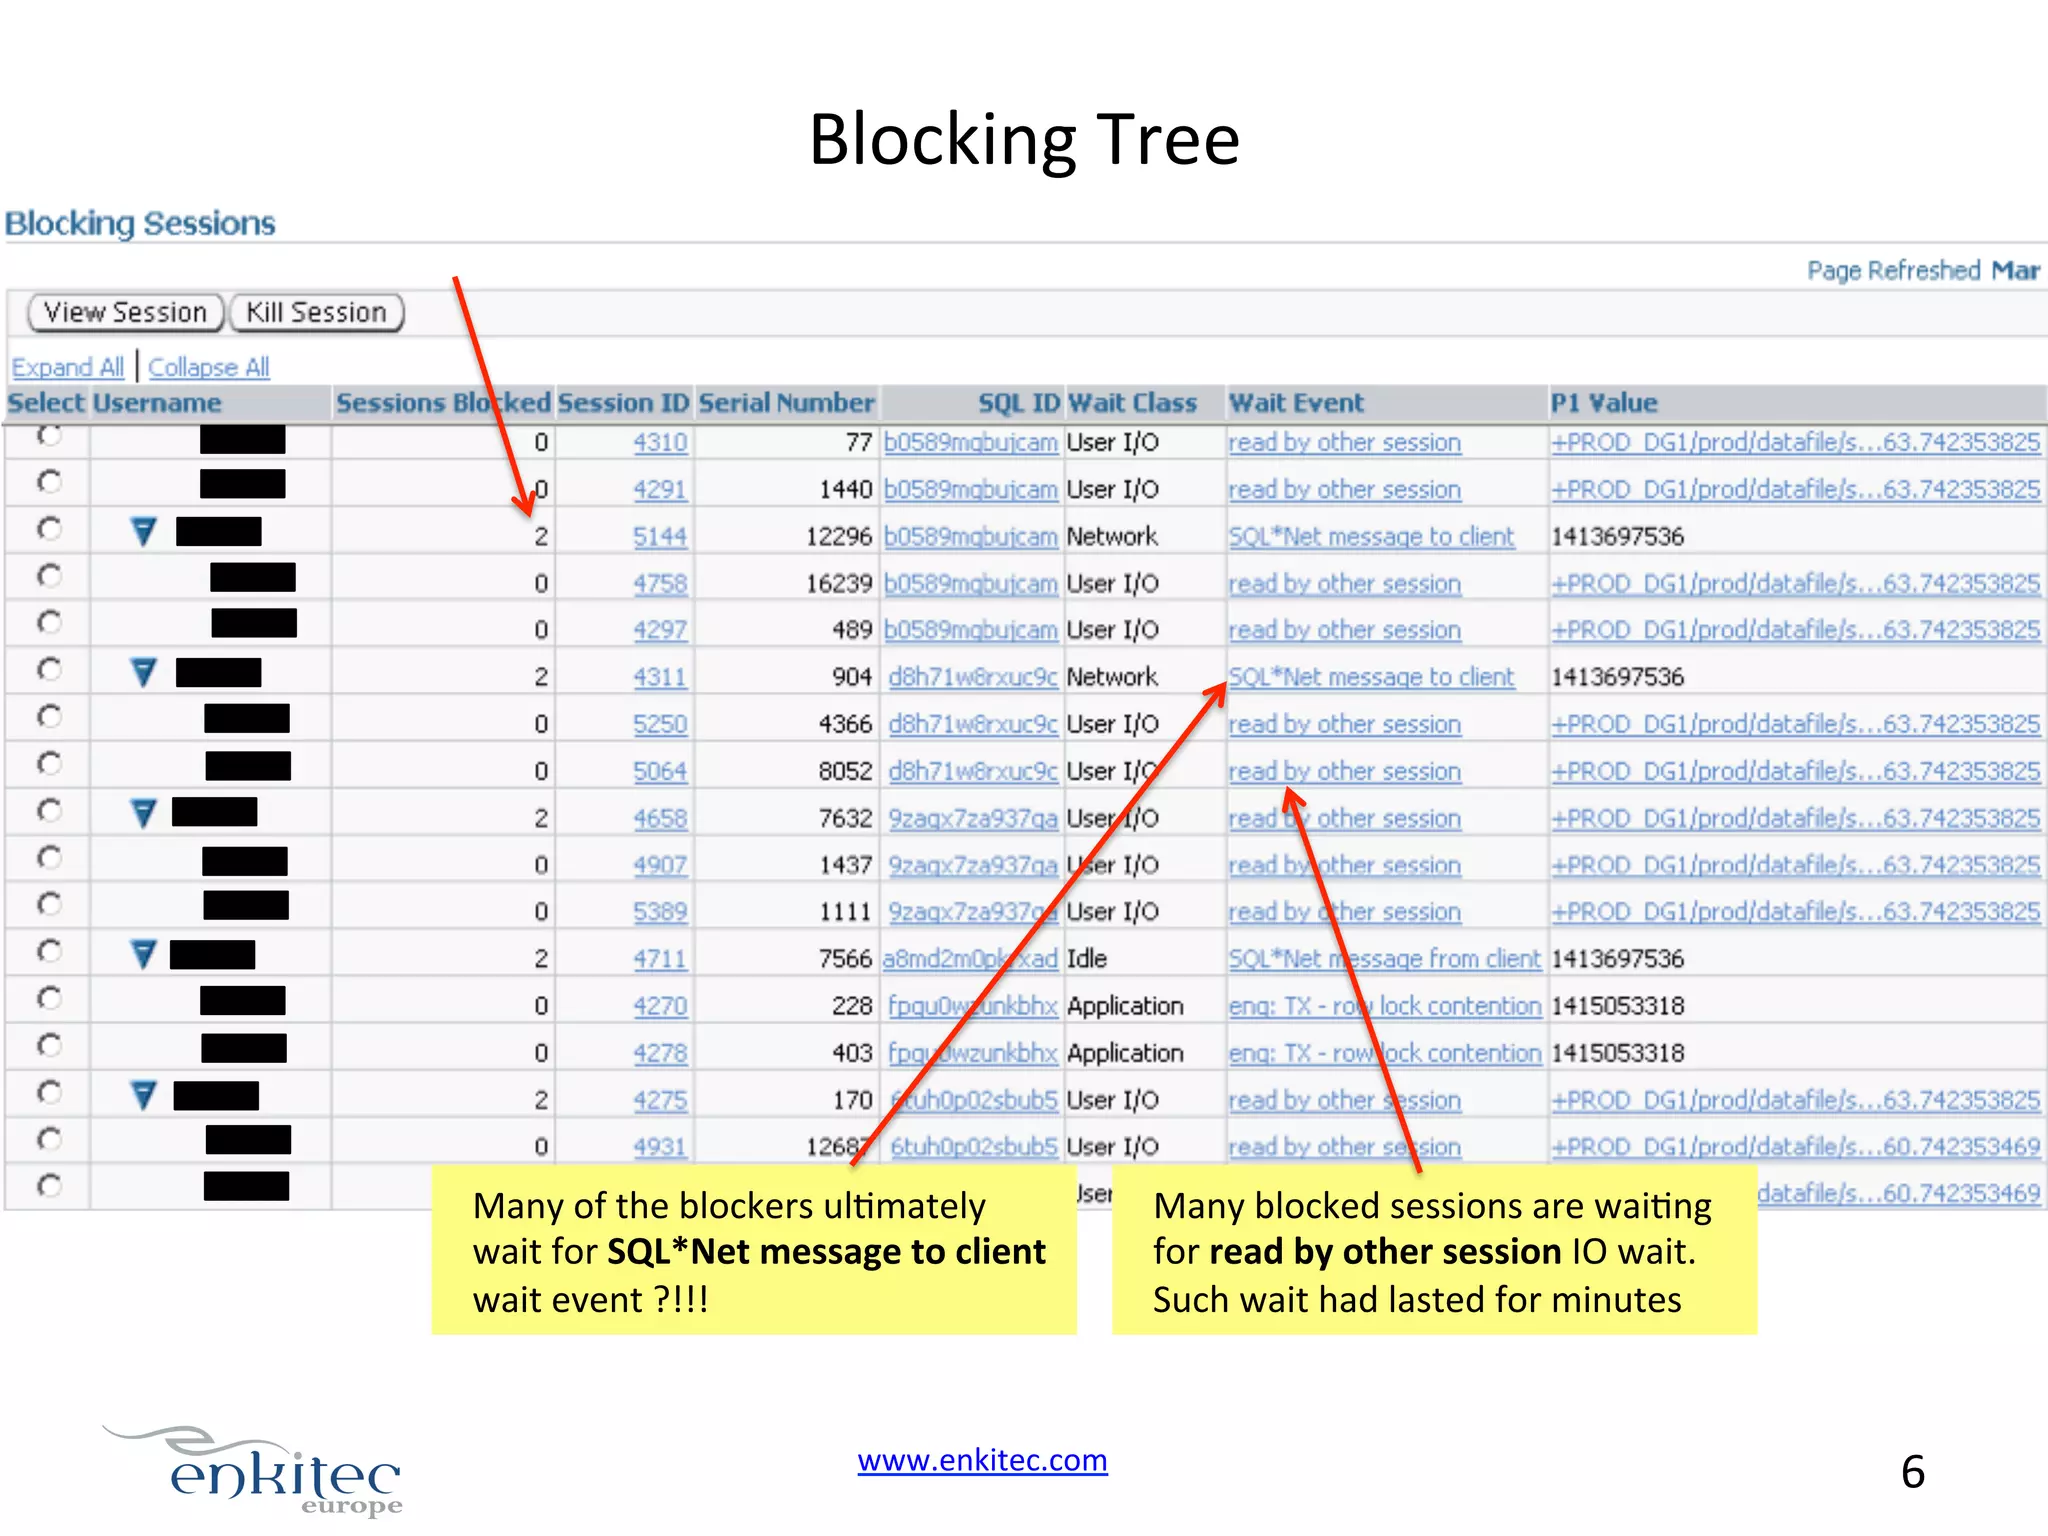
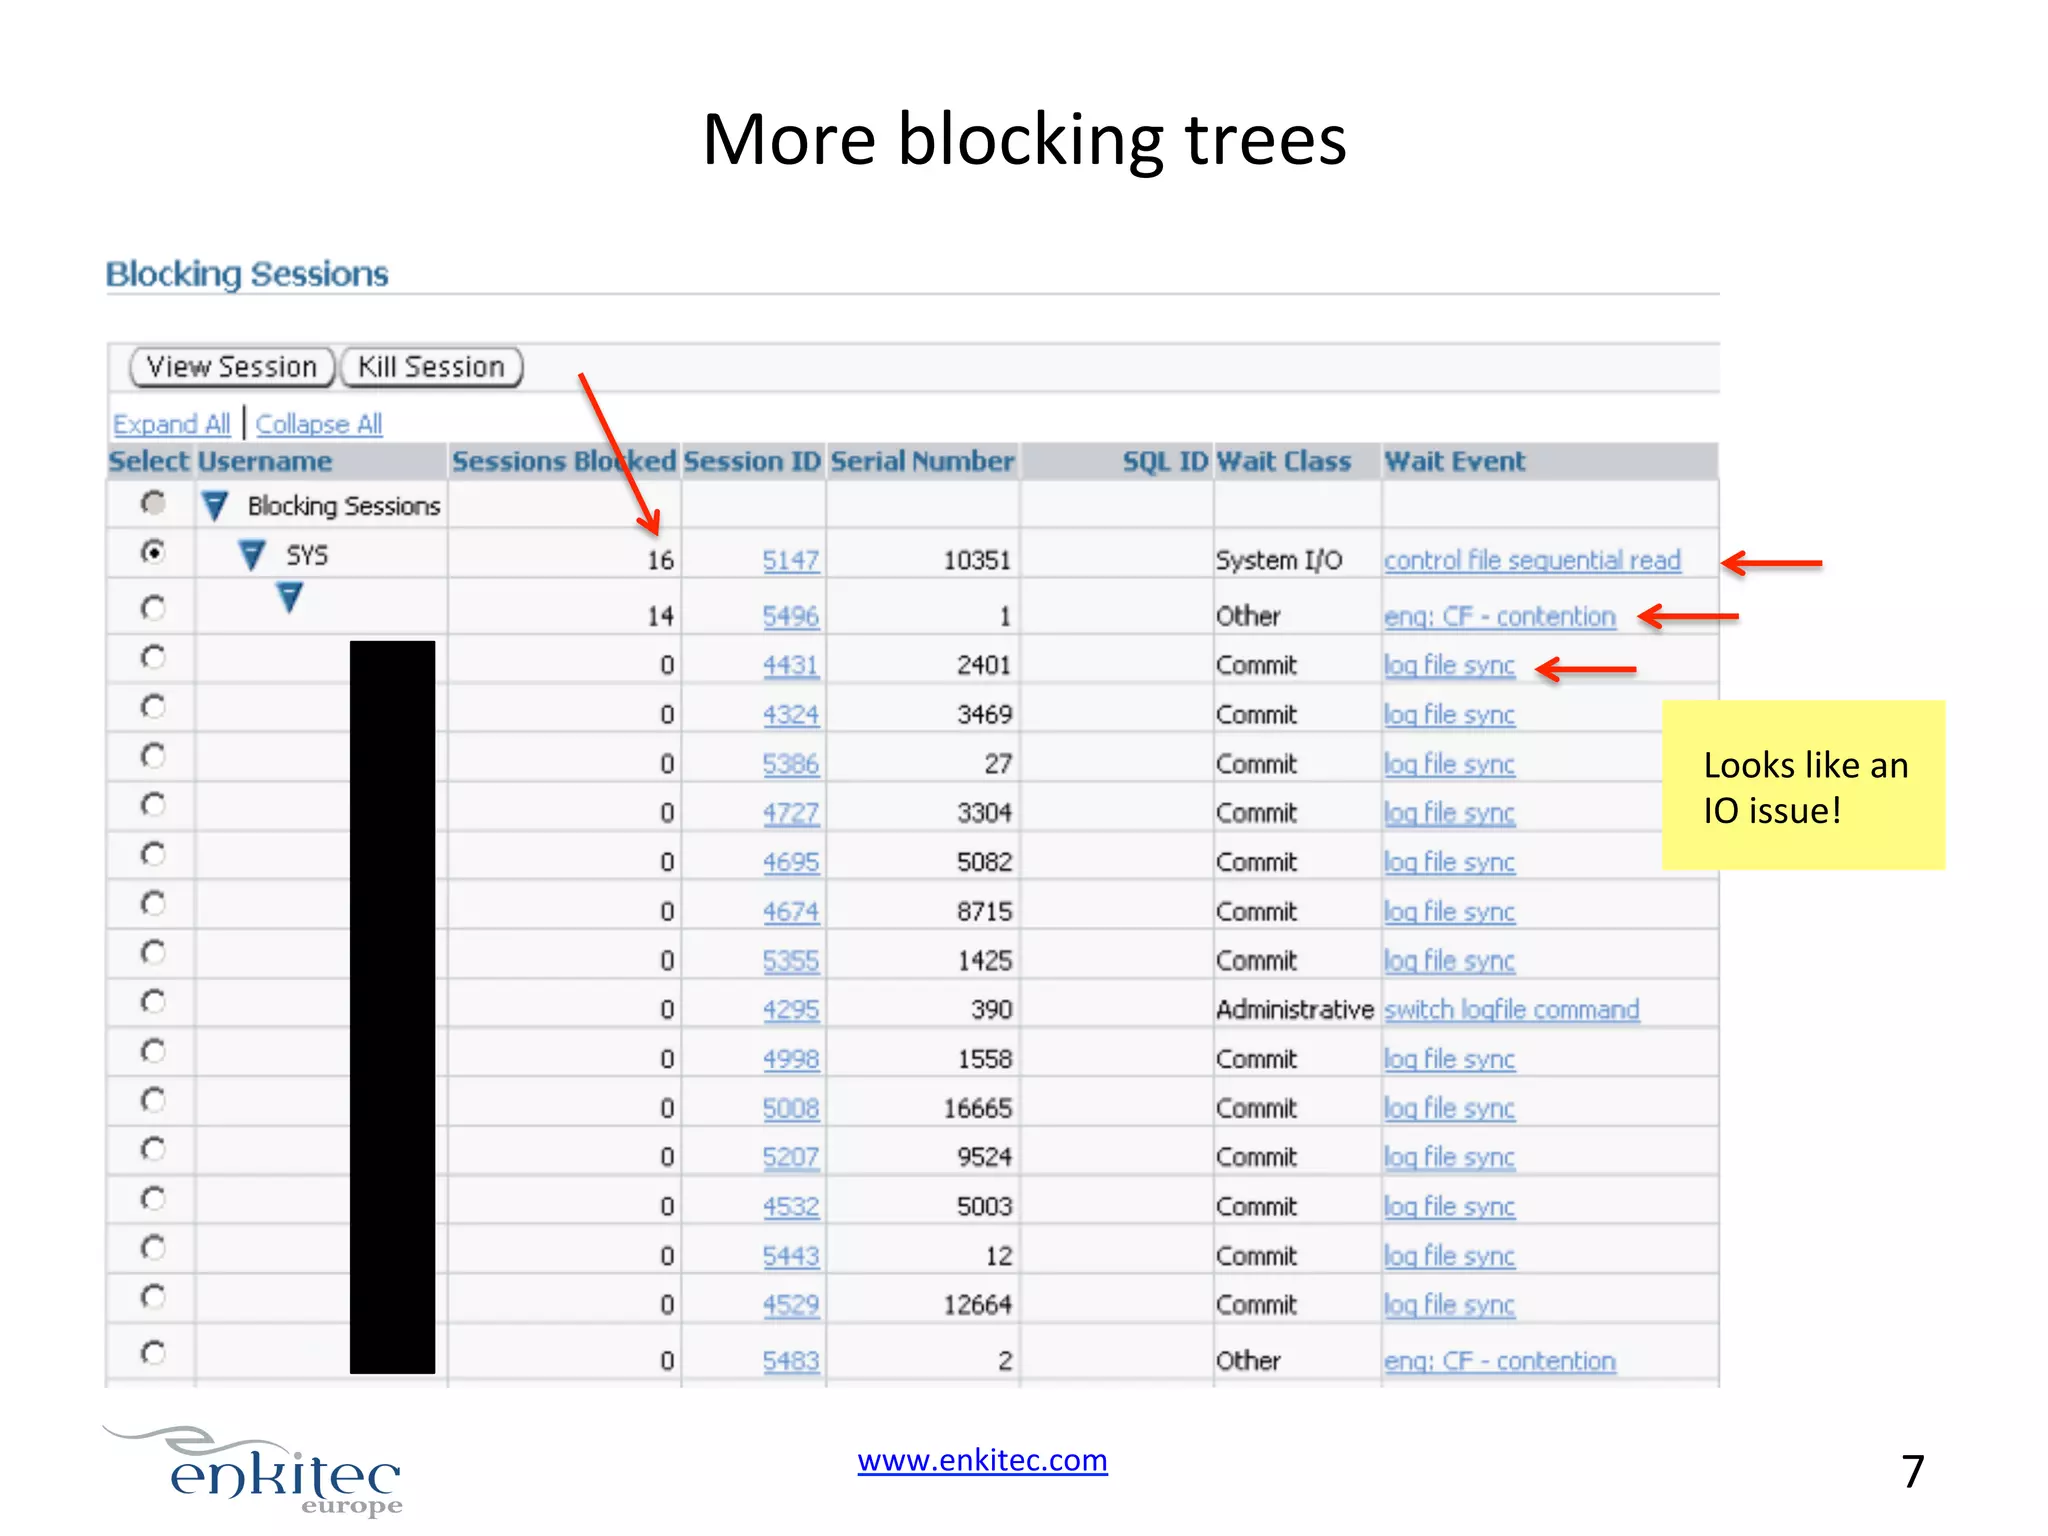
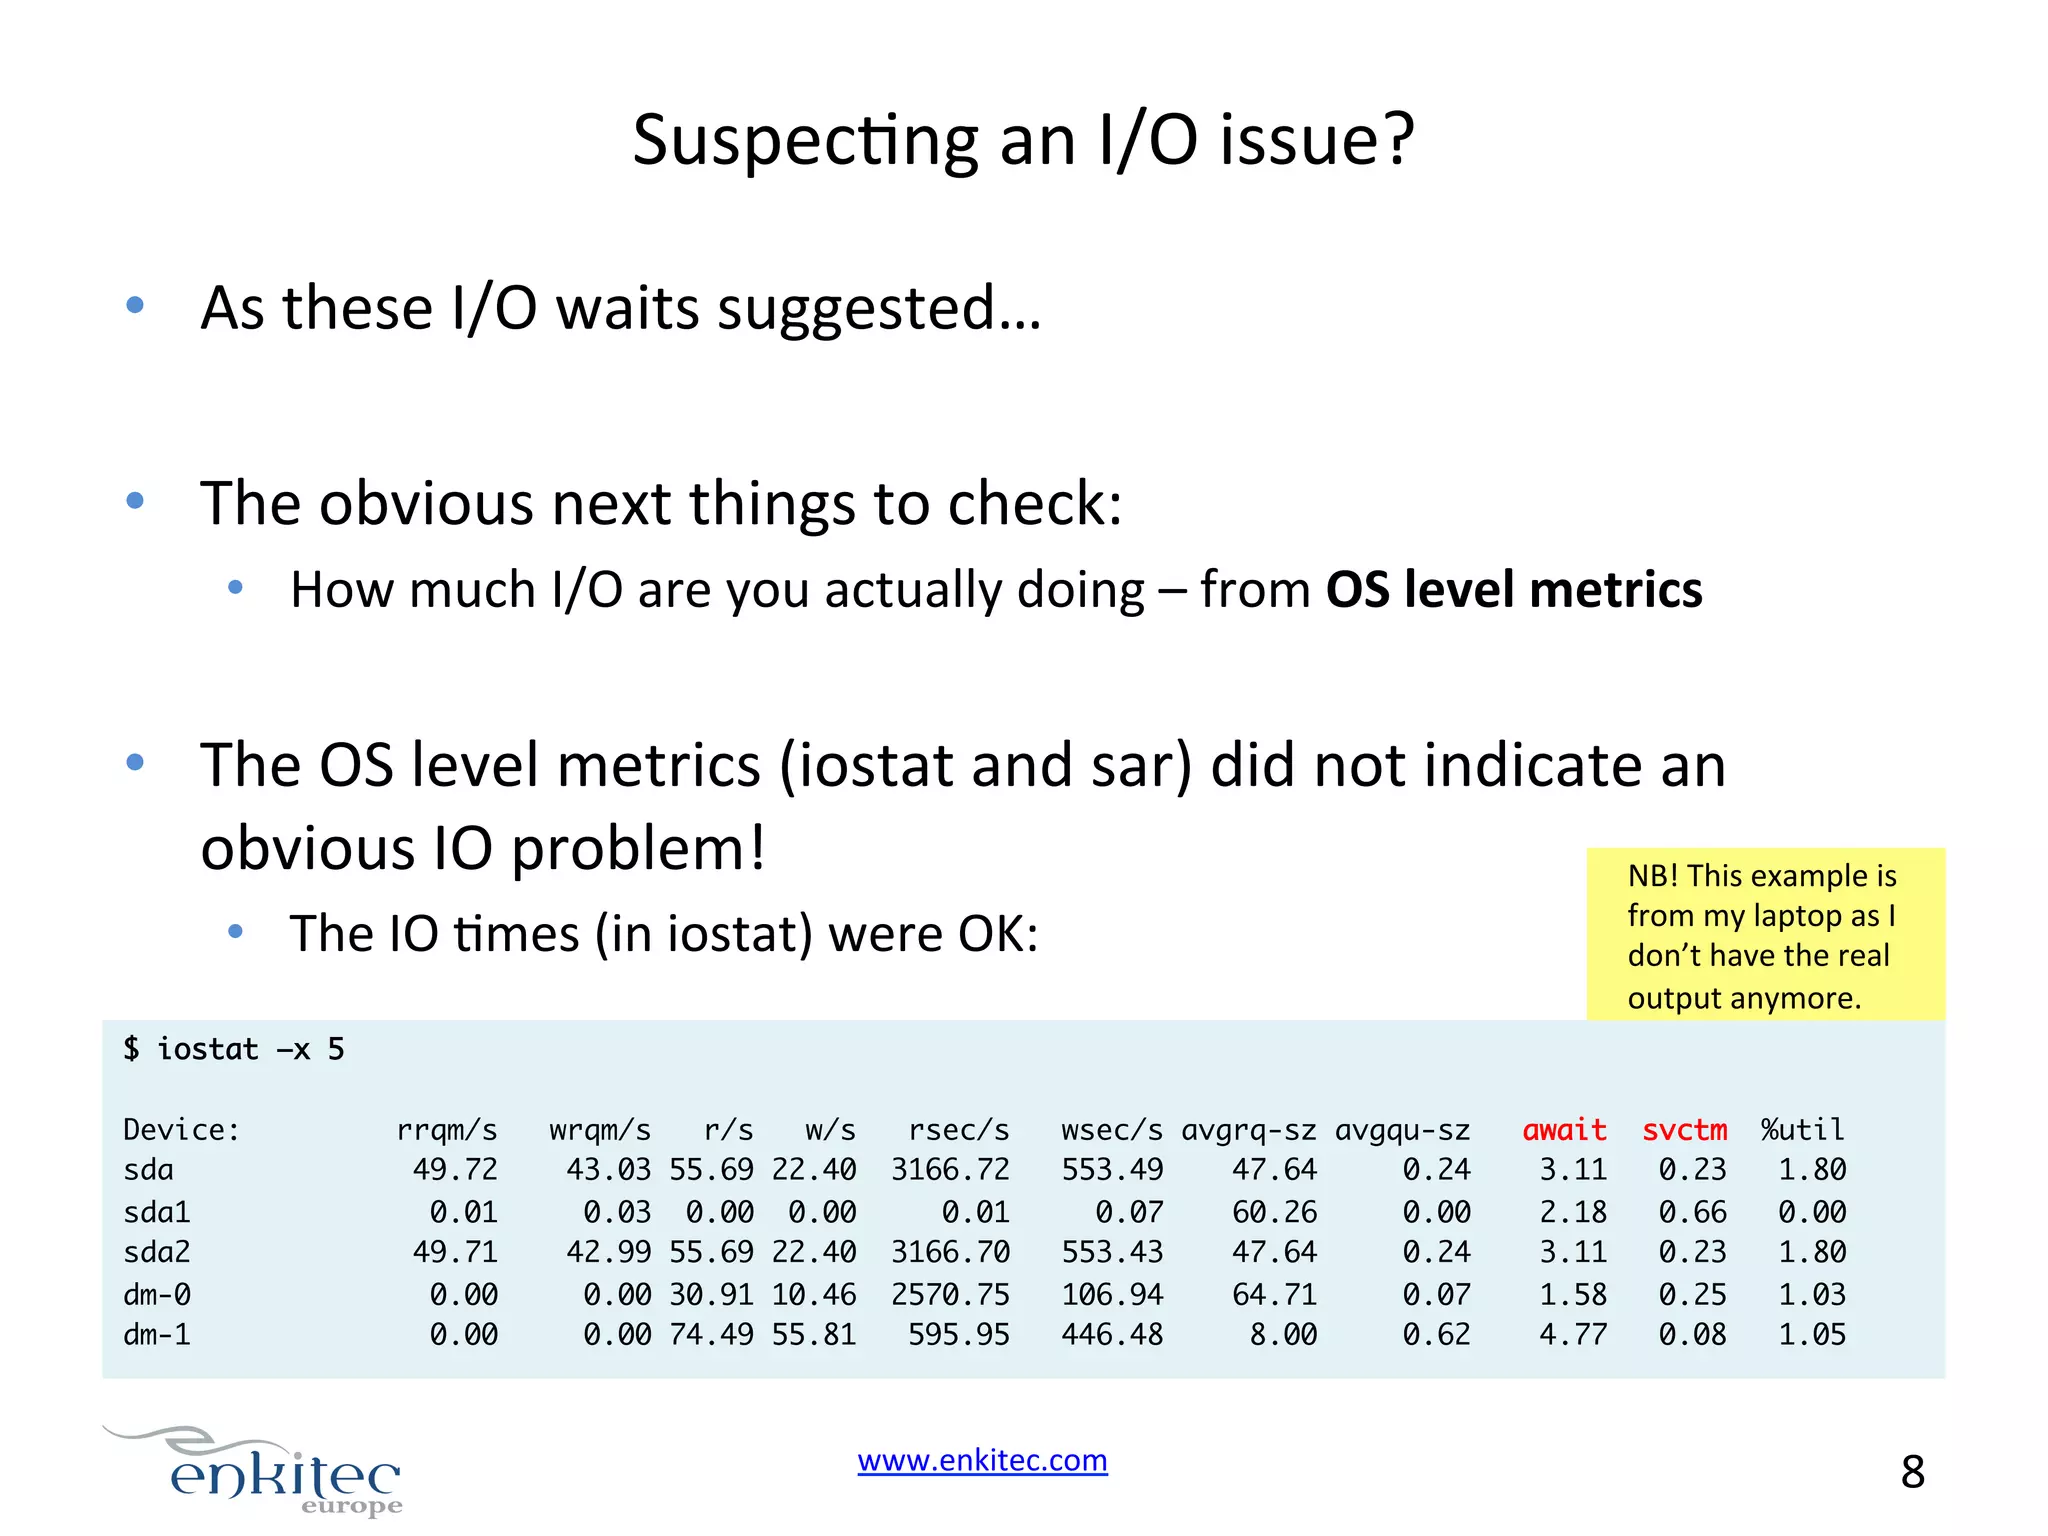
Analyzing random session hangs in an Oracle database environment, noting symptoms like sudden slowness, long enqueue waits, and diagnosing potential I/O issues.Exploring I/O wait metrics using OS-level tools (iostat, sar) to examine active sessions and debunking CPU issues during apparent hangs in performance monitoring.
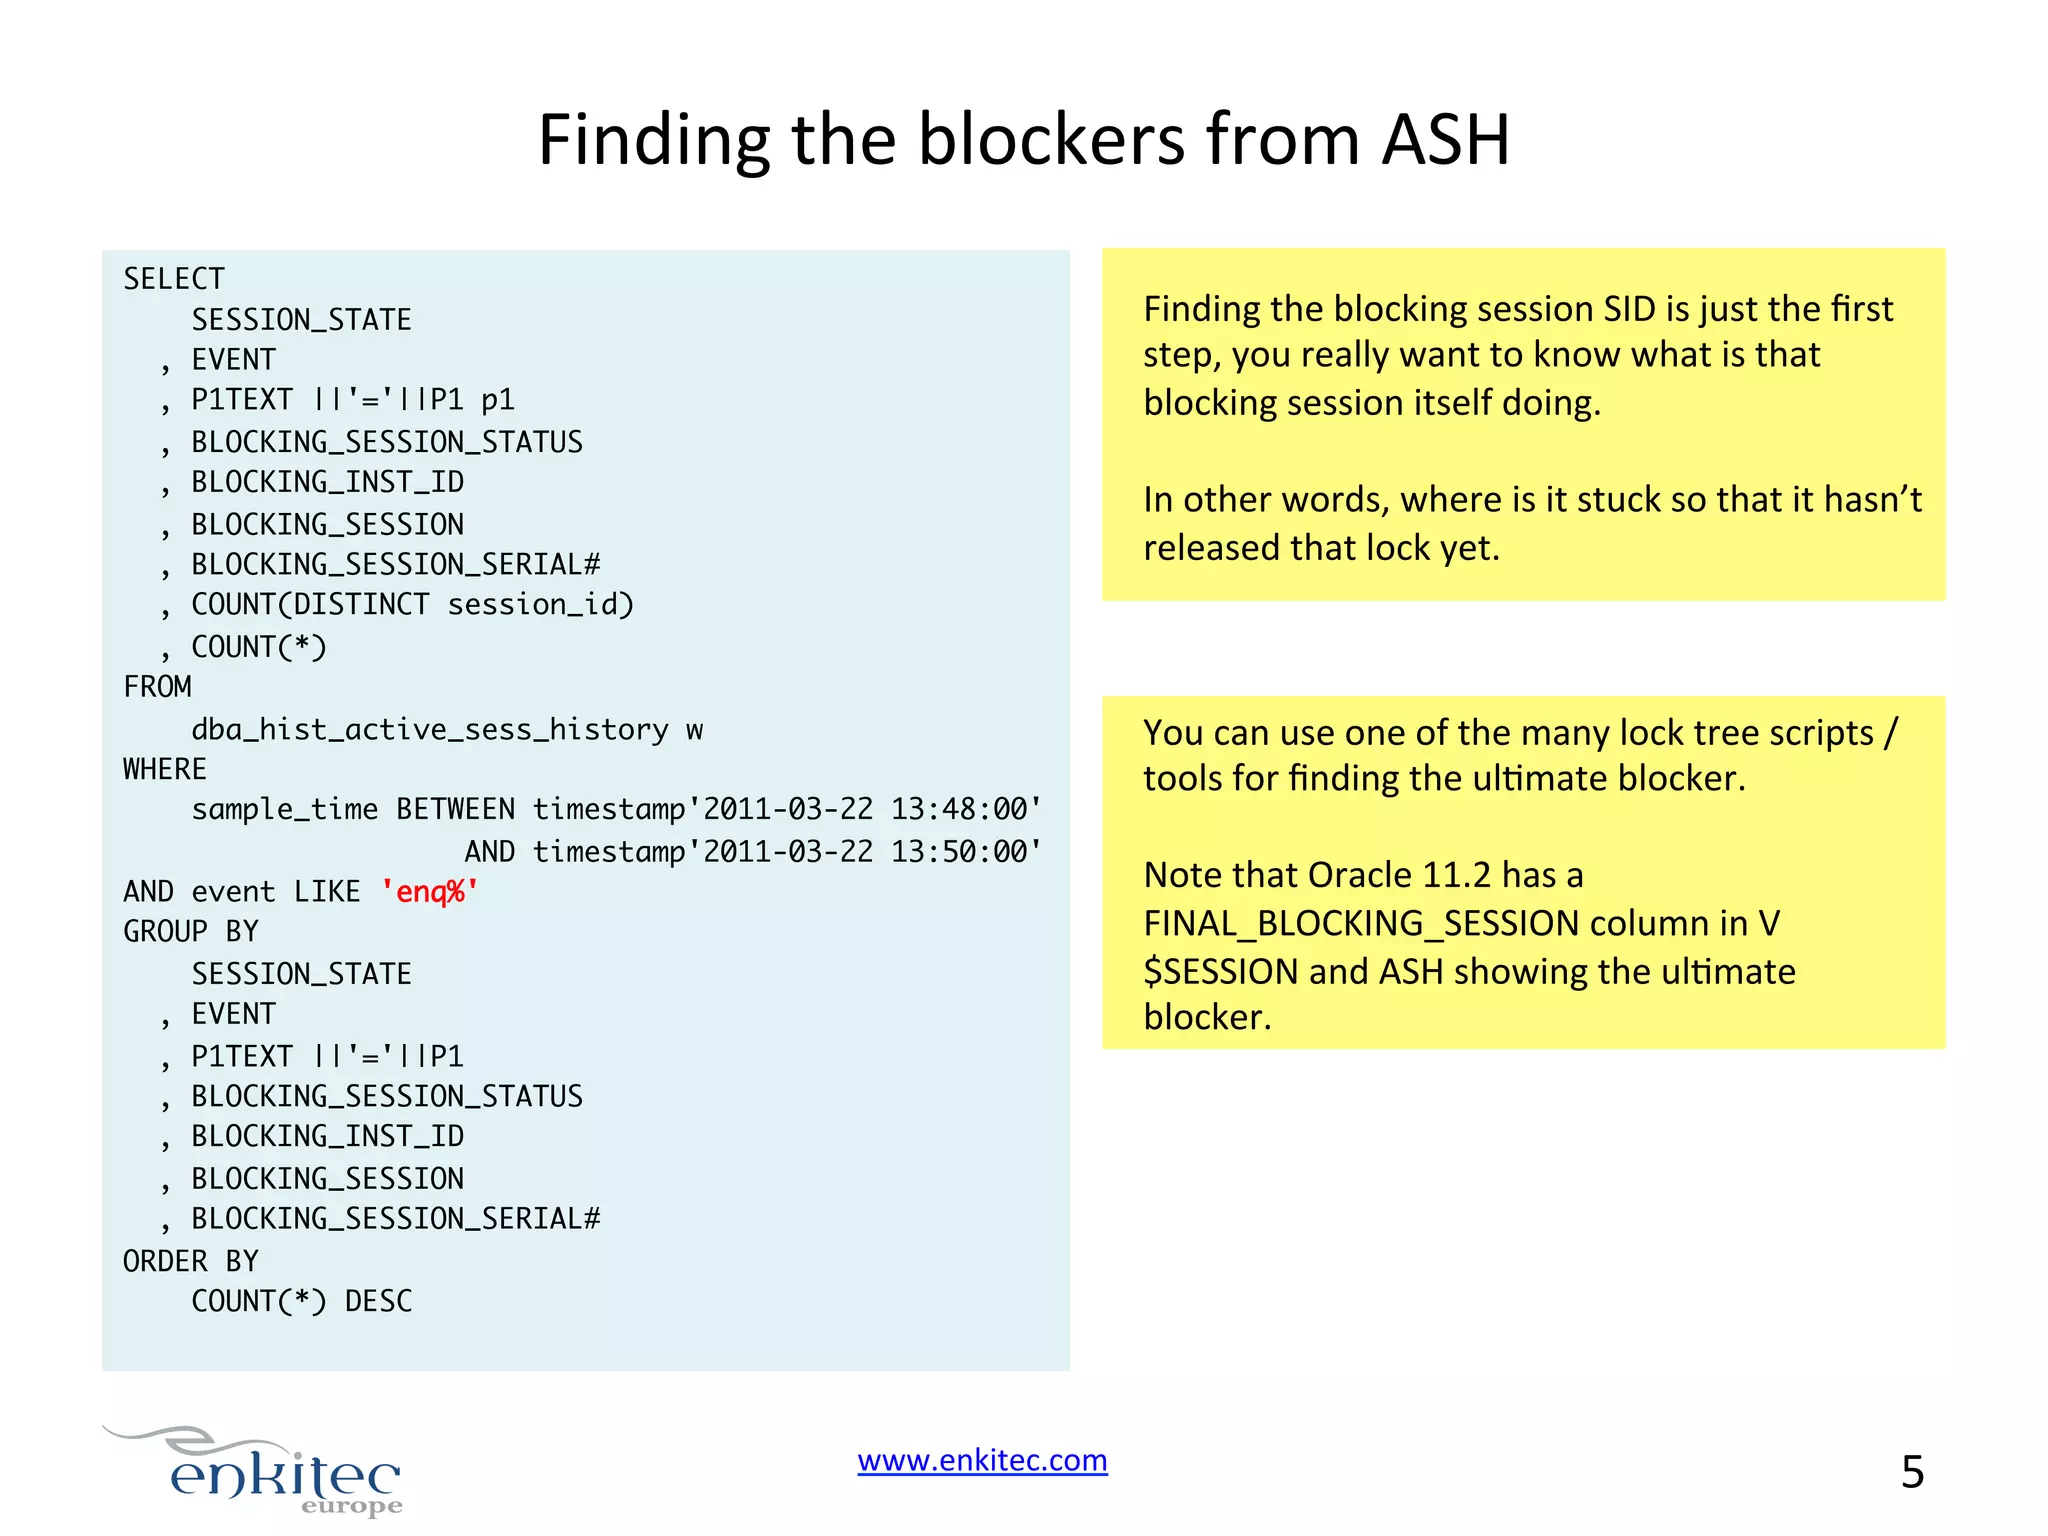
Addressing discrepancies between Oracle’s session states and actual behaviors, suggesting that sessions reported as running may actually be blocked.
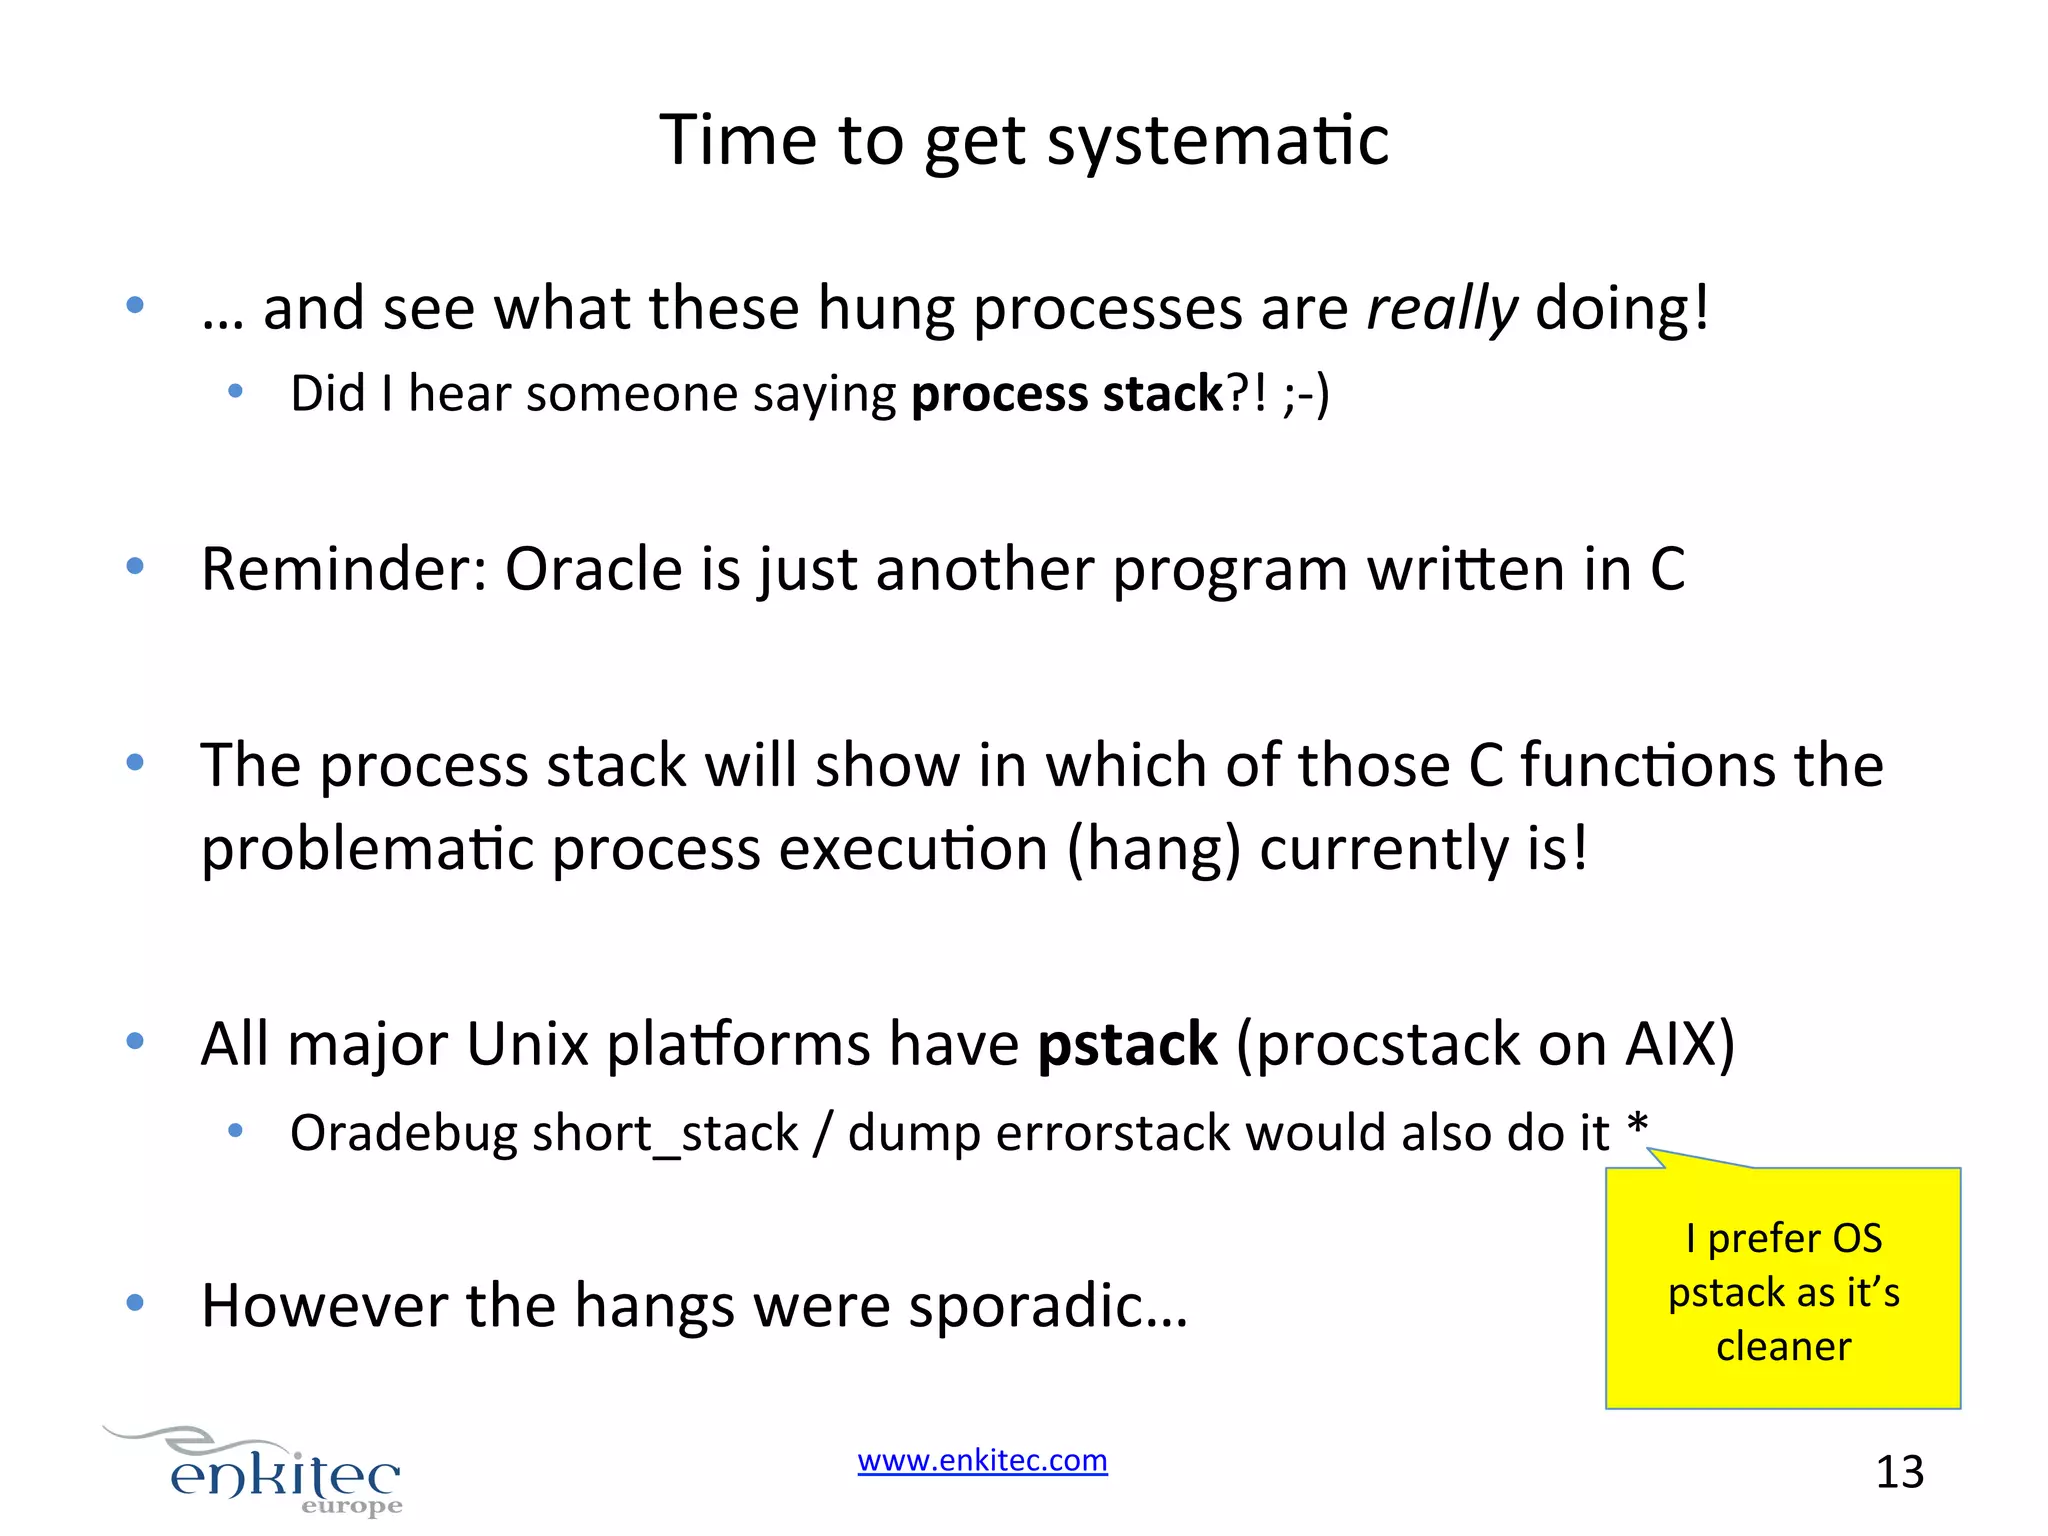
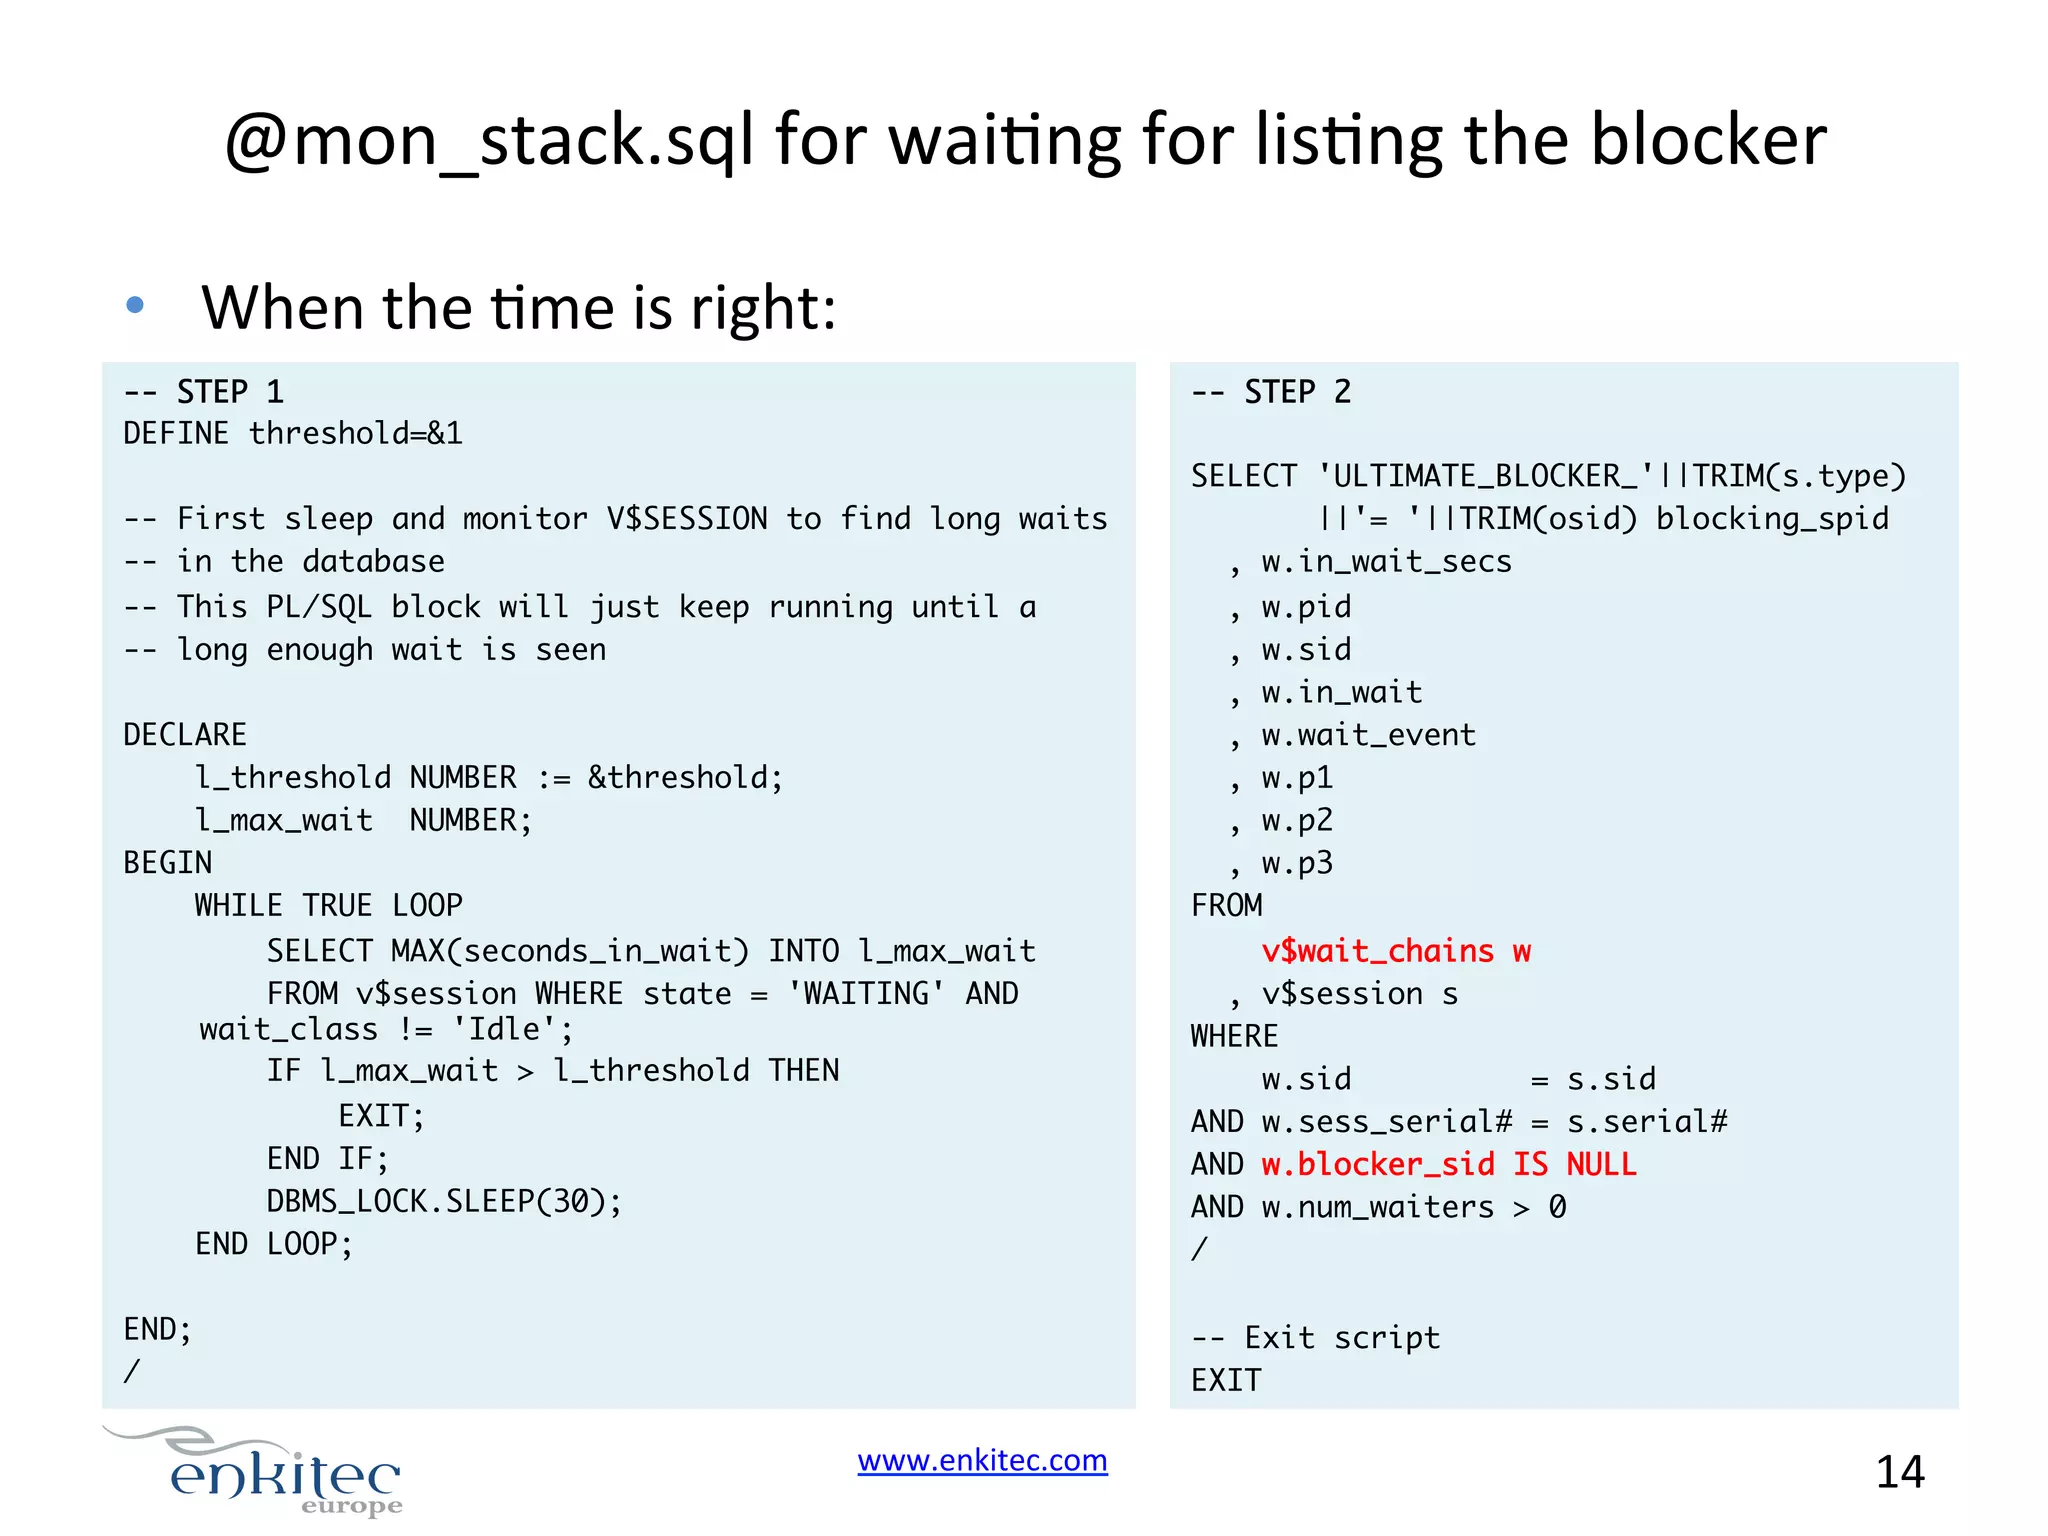
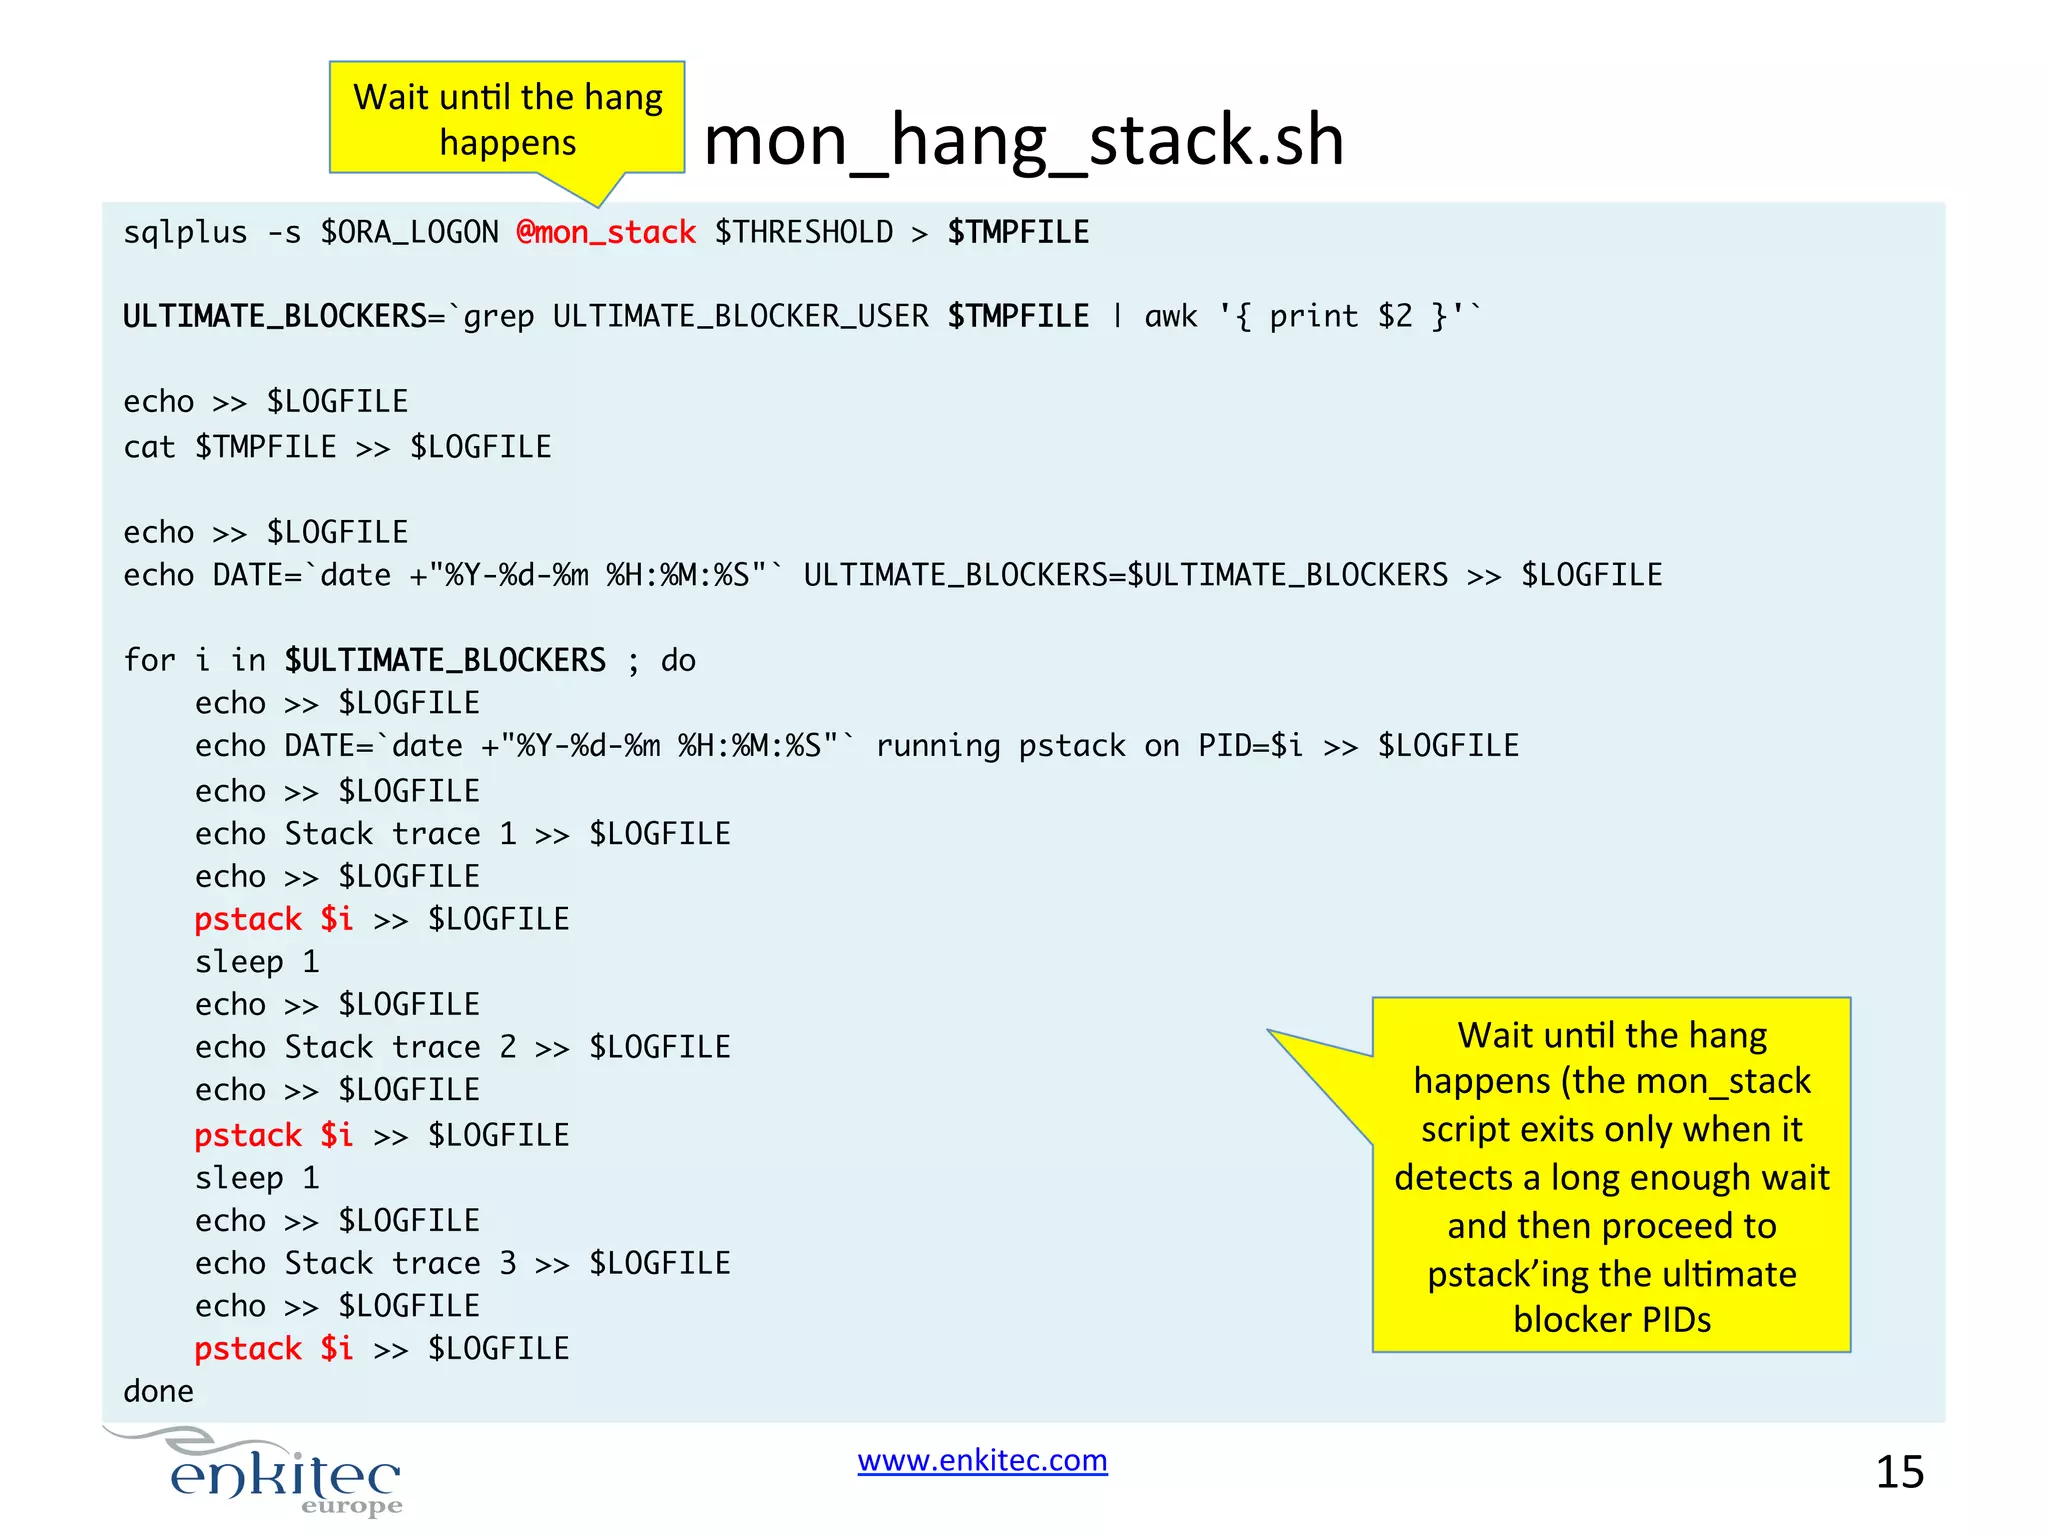
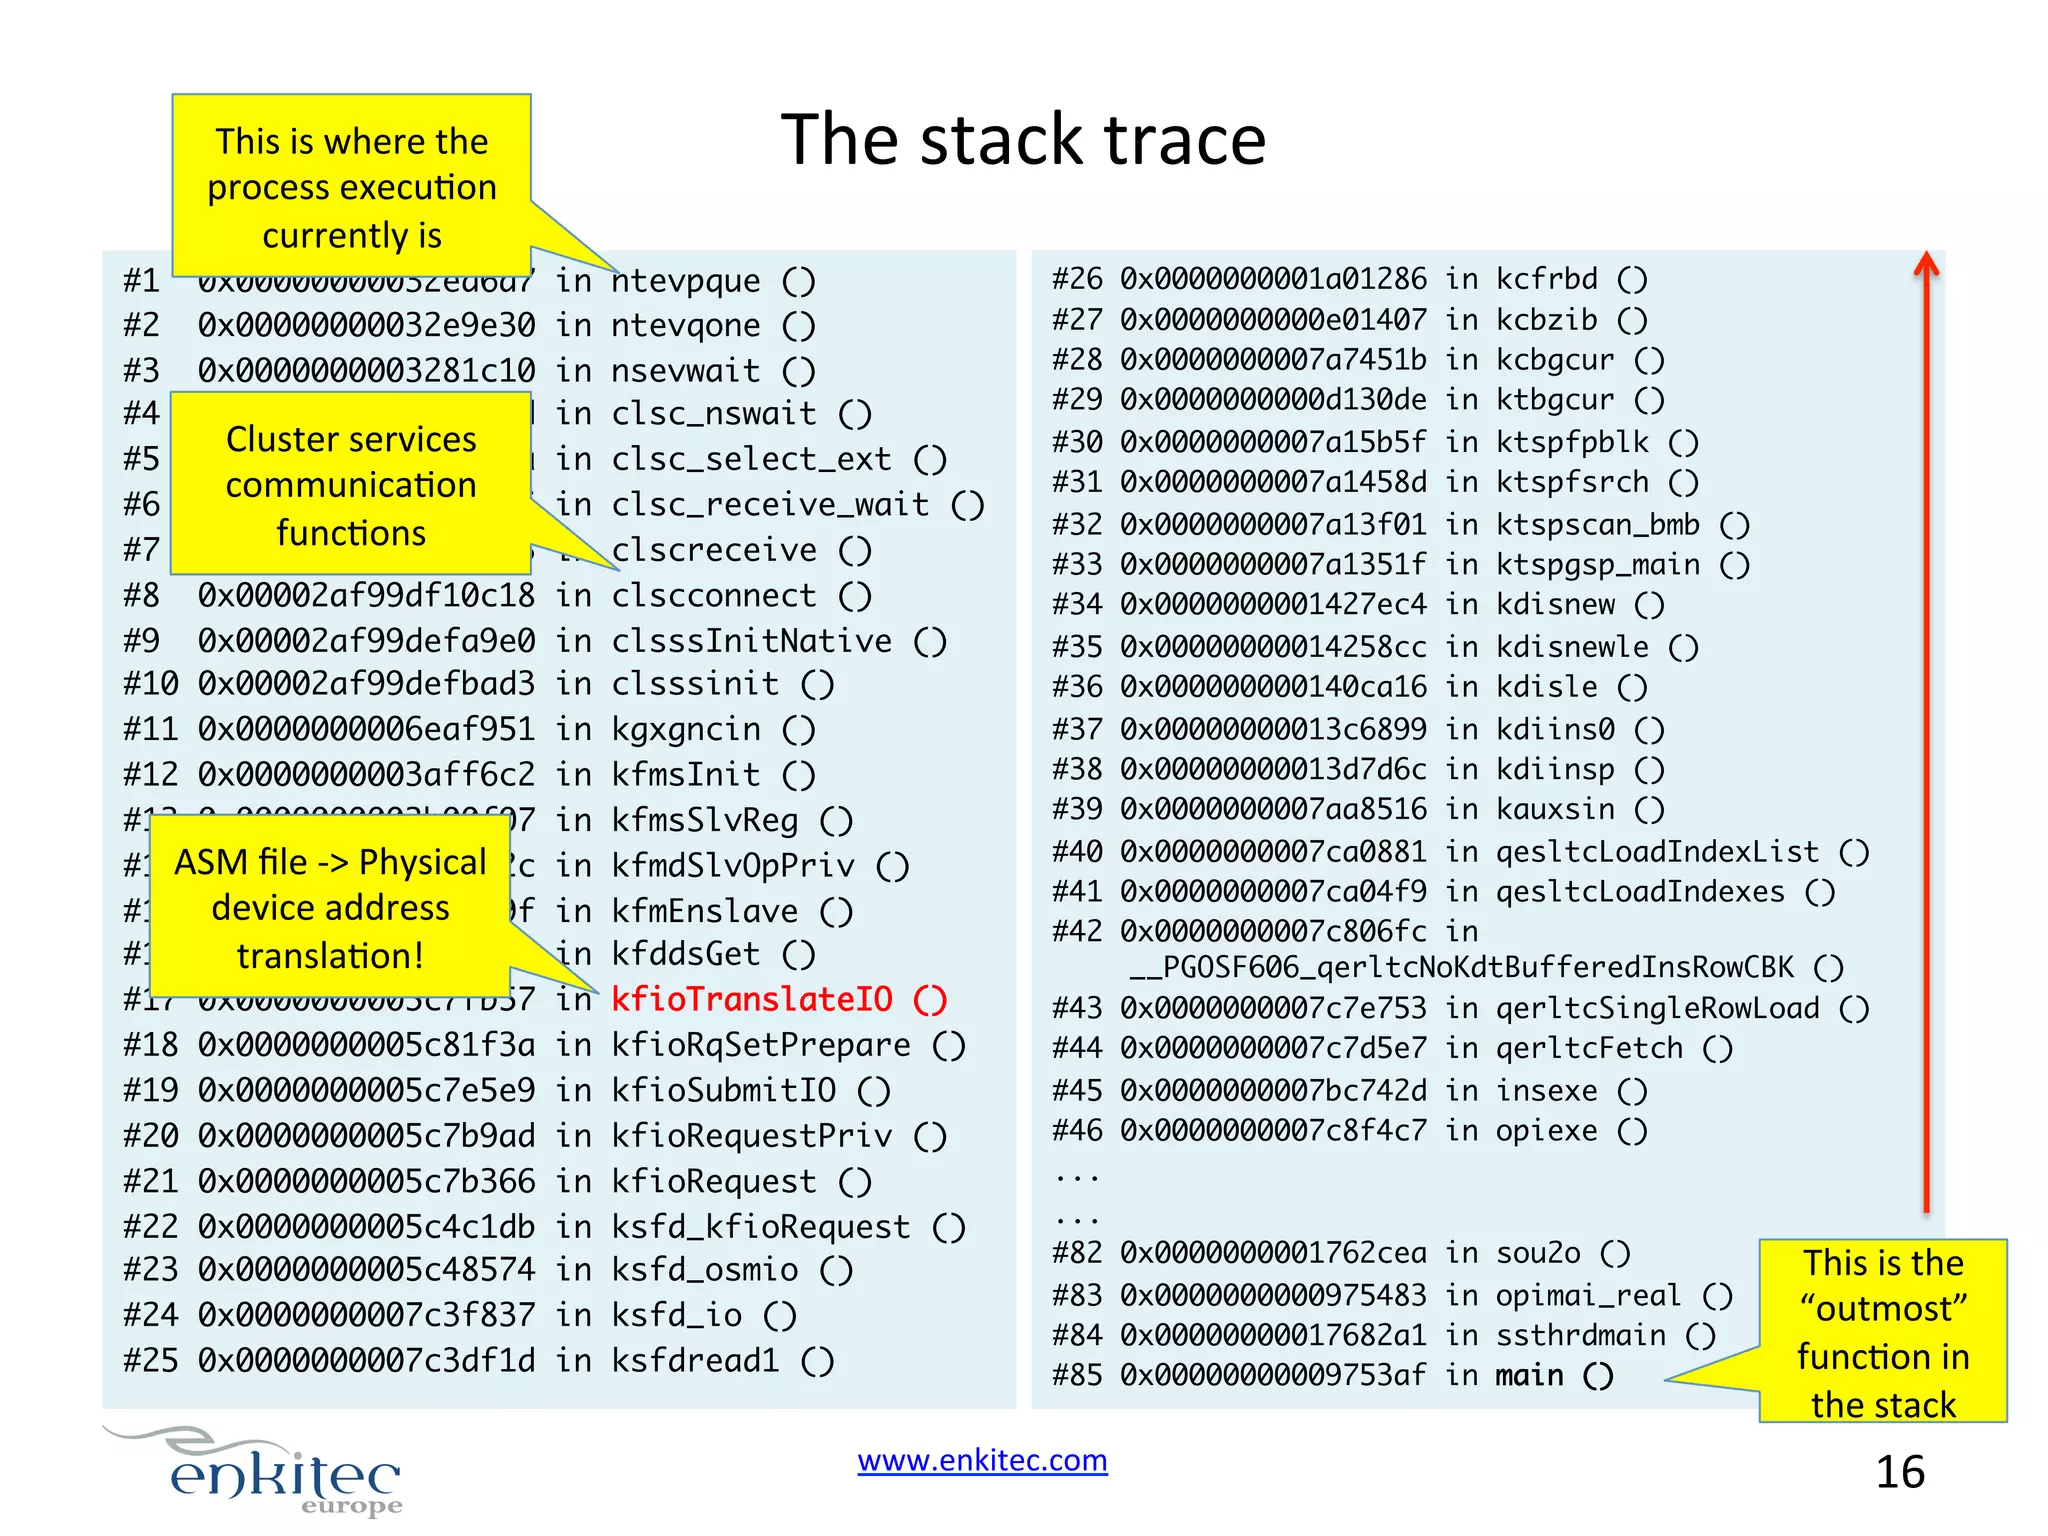
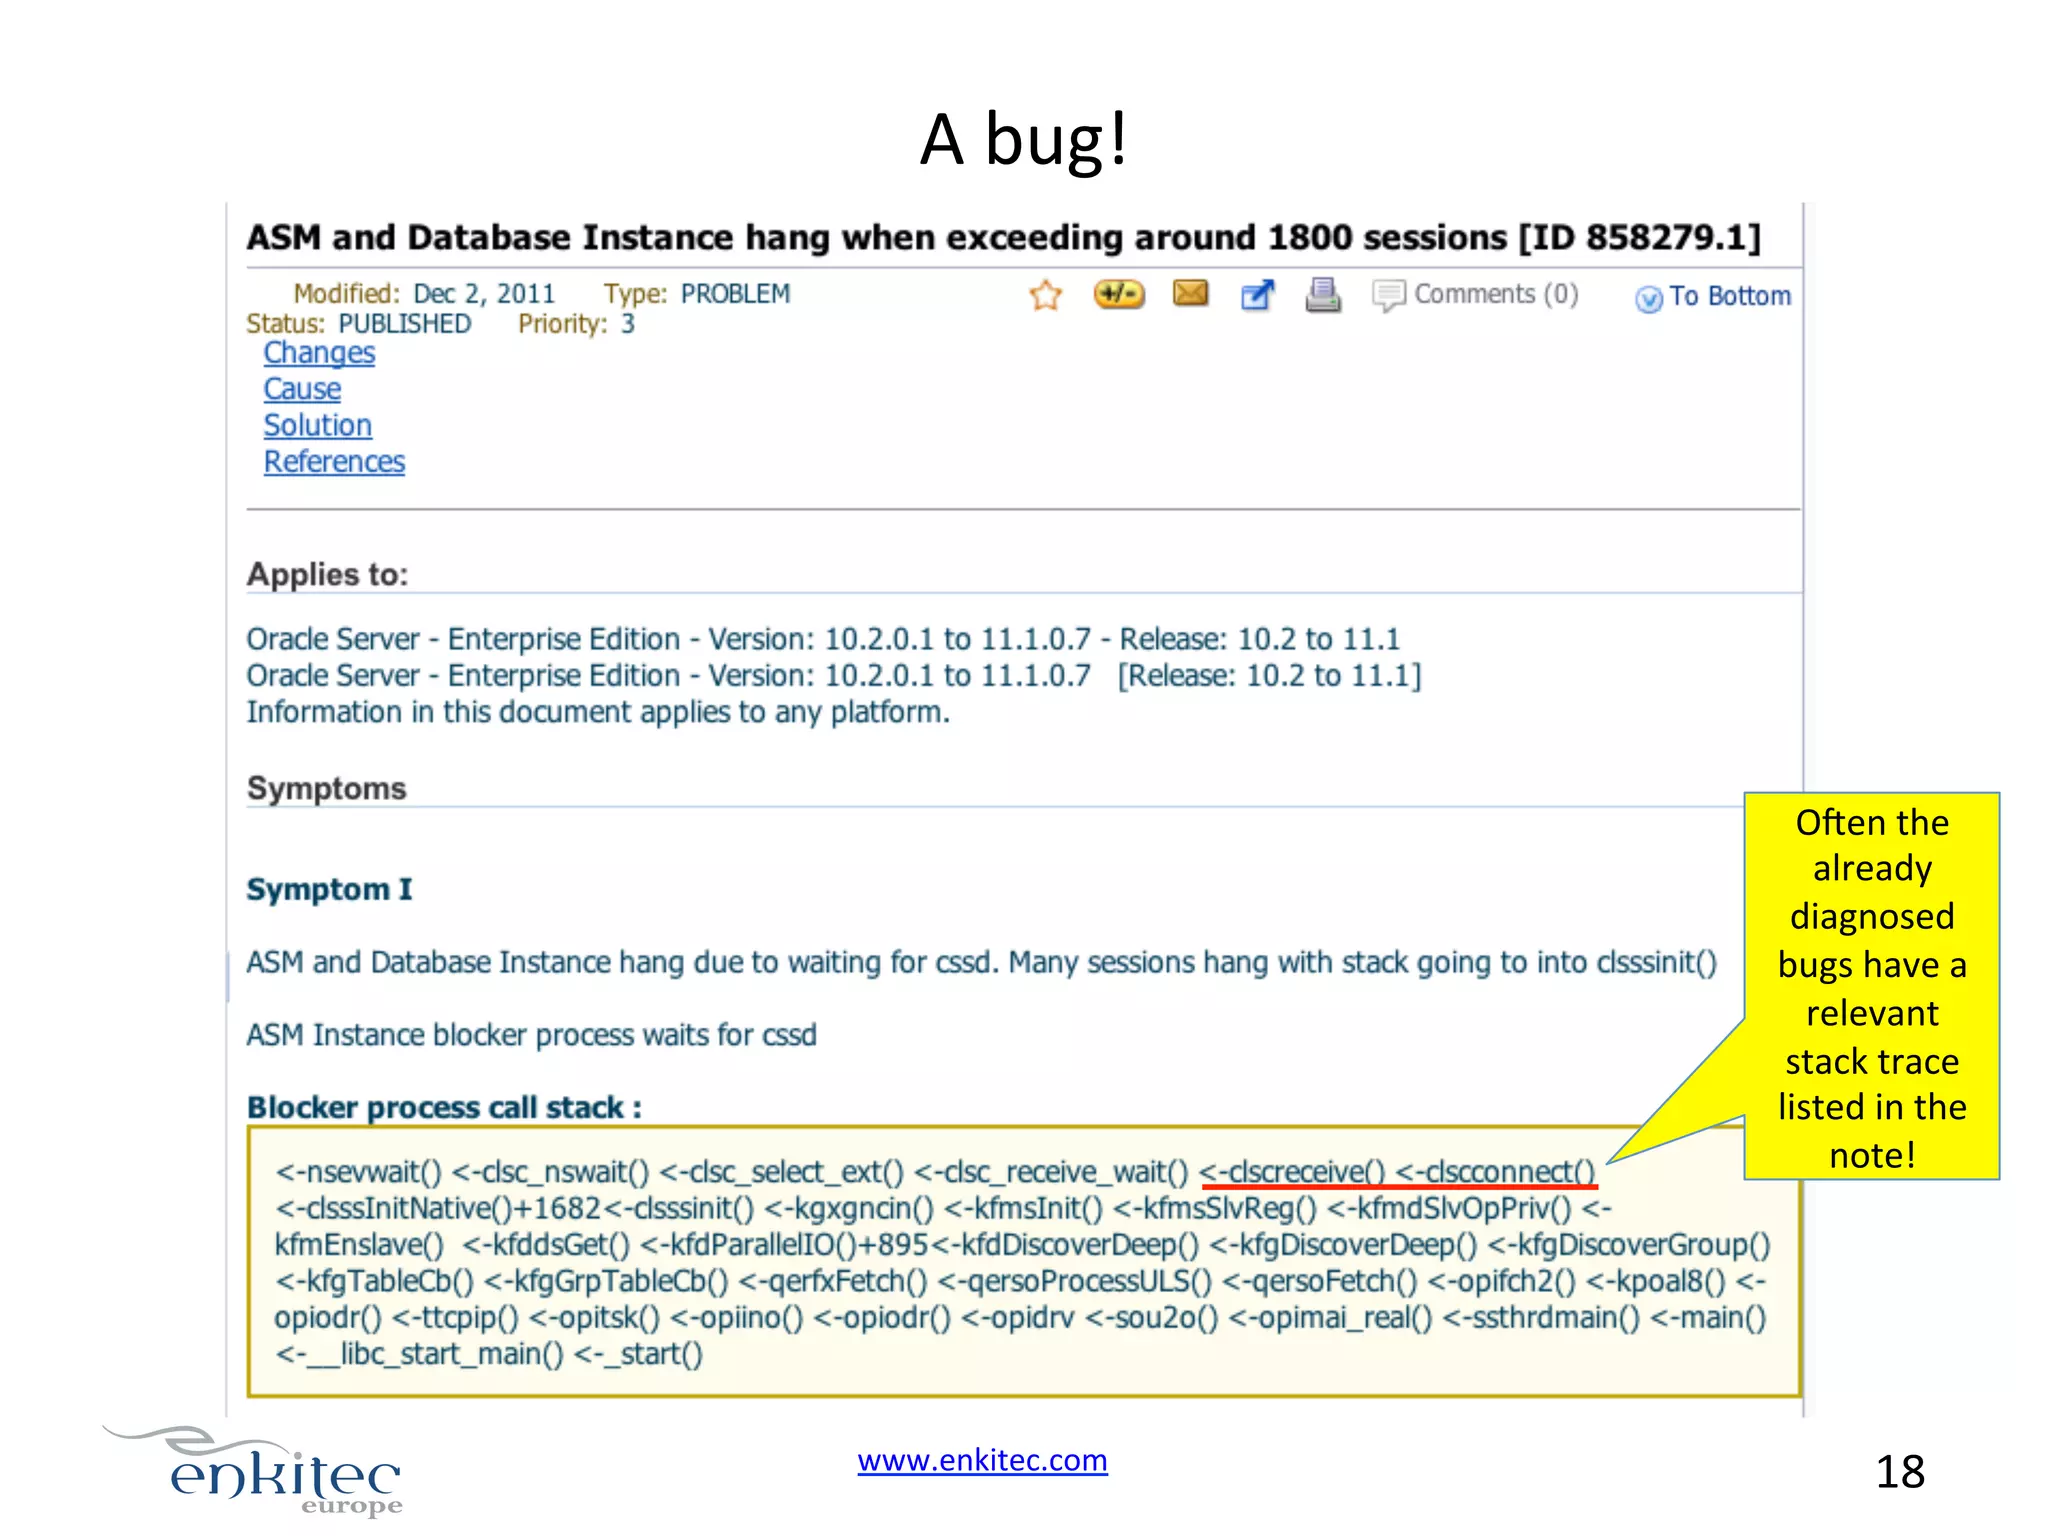
Implementing scripts for monitoring blocking sessions and analyzing stack traces to understand root causes of session hangs.
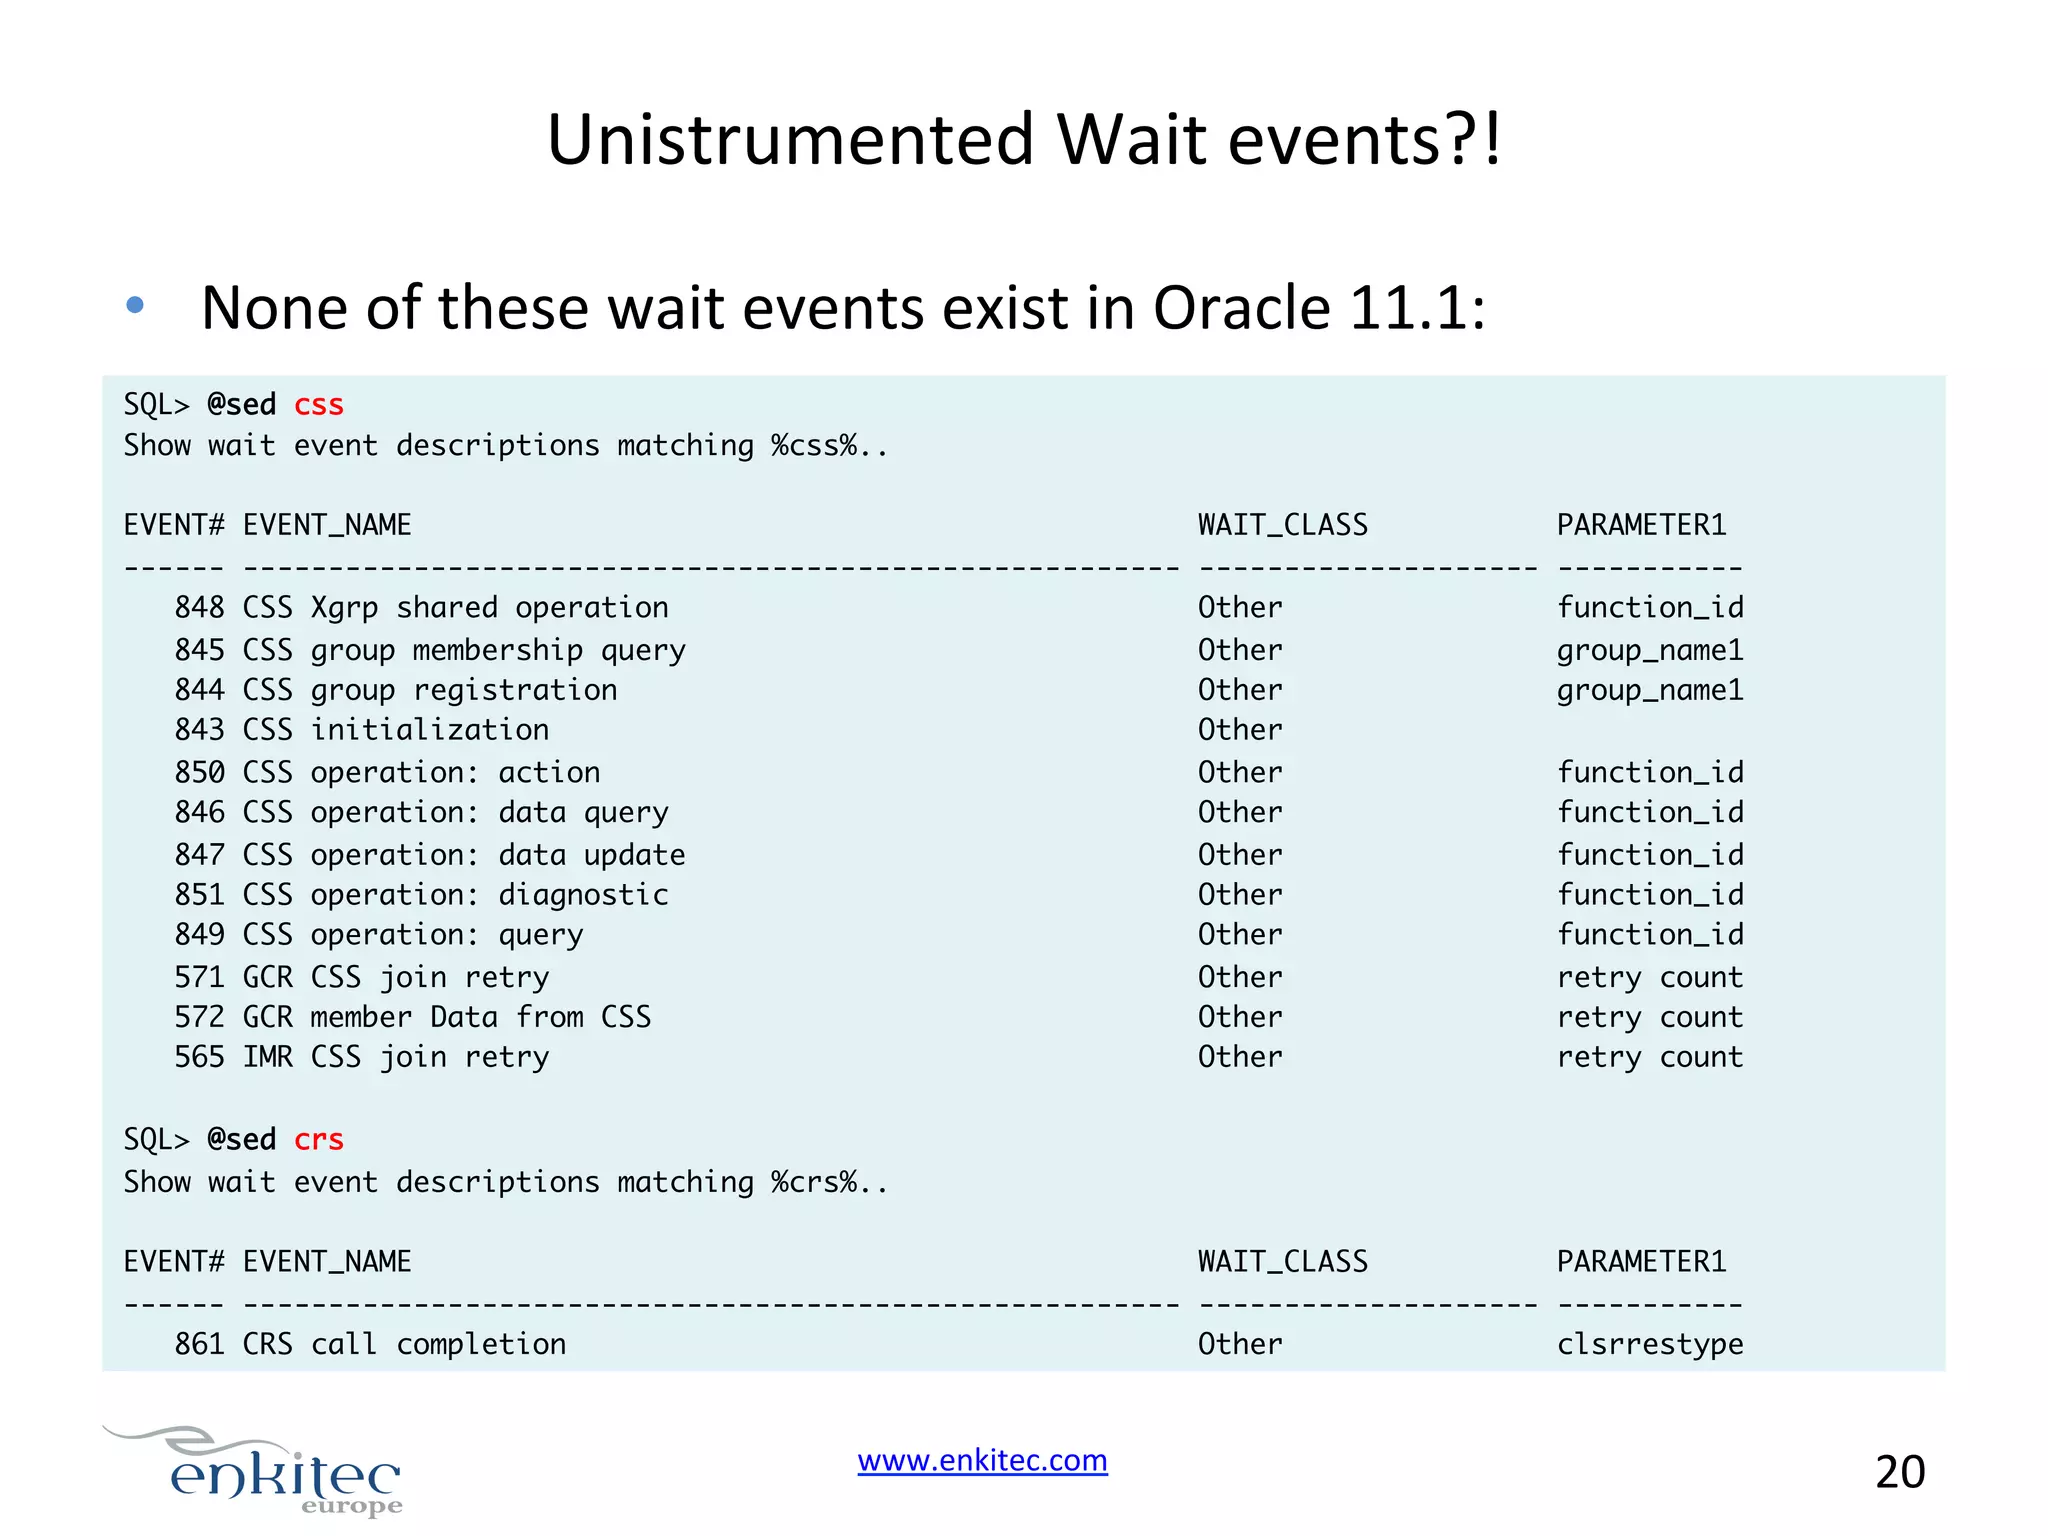
Highlighting specific Oracle bugs related to clusterware processes, sharing insights on uninstrumented wait events, and promoting upcoming seminars.
Tanel Poder - Troubleshooting Complex Oracle Performance Issues - Part 2
1.
More Complex Performance Issues I’ve seen (Part 2) Tanel Põder Enkitec h.p://www.enkitec.com h.p://blog.tanelpoder.com www.enkitec.com 1
2.
Intro: About me • Tanel Põder • Former Oracle Database Performance geek • Present Exadata Performance geek ;-‐) • My Exadata experience • … in the last couple of years… • … I have had the luck to work with all possible Exadata configuraNons out there • Exadata V1 … X2-‐8 • MulN-‐rack Exadatas … • Even a mixed rack Exadata (V2 <-‐> X2-‐2 :) Expert Oracle Exadata book (with Kerry Osborne and Randy Johnson) www.enkitec.com 2
3.
Random Session Hangs • Environment: • Oracle 11.1 Database on Linux • 4 CPUs • Running on ASM • Symptoms: • Sudden slowness of the database, lasNng for a few minutes • Some long TX, TM, CF enqueue waits • Some sessions completely stuck, some showing IO waits, some CPU • First hunch: • Seemed quite random and weird • Maybe slow/hung IO? www.enkitec.com 3
4.
AWR Report • ApplicaNon locking problem, right? • Very long IO waits… • The applicaNon locks may be held for so long because of some other task (while holding the lock) takes so long? www.enkitec.com 4
5.
Finding the blockers from ASH SELECT SESSION_STATE , EVENT , P1TEXT ||'='||P1 p1 , BLOCKING_SESSION_STATUS , BLOCKING_INST_ID , BLOCKING_SESSION , BLOCKING_SESSION_SERIAL# , COUNT(DISTINCT session_id) , COUNT(*) FROM dba_hist_active_sess_history w WHERE sample_time BETWEEN timestamp'2011-03-22 13:48:00' AND timestamp'2011-03-22 13:50:00' AND event LIKE 'enq%' GROUP BY SESSION_STATE , EVENT , P1TEXT ||'='||P1 , BLOCKING_SESSION_STATUS , BLOCKING_INST_ID , BLOCKING_SESSION , BLOCKING_SESSION_SERIAL# ORDER BY COUNT(*) DESC www.enkitec.com Finding the blocking session SID is just the first step, you really want to know what is that blocking session itself doing. In other words, where is it stuck so that it hasn’t released that lock yet. You can use one of the many lock tree scripts / tools for finding the ulNmate blocker. Note that Oracle 11.2 has a FINAL_BLOCKING_SESSION column in V $SESSION and ASH showing the ulNmate blocker. 5
6.
Blocking Tree Many of the blockers ulNmately wait for SQL*Net message to client wait event ?!!! www.enkitec.com Many blocked sessions are waiNng for read by other session IO wait. Such wait had lasted for minutes 6
SuspecNng an I/O issue? • As these I/O waits suggested… • The obvious next things to check: • How much I/O are you actually doing – from OS level metrics • The OS level metrics (iostat and sar) did not indicate an obvious IO problem! NB! This example is from my laptop as I don’t have the real output anymore. • The IO Nmes (in iostat) were OK: $ iostat –x 5 Device: sda sda1 sda2 dm-0 dm-1 rrqm/s 49.72 0.01 49.71 wrqm/s r/s w/s 43.03 55.69 22.40 0.03 0.00 0.00 42.99 55.69 22.40 rsec/s 3166.72 0.01 3166.70 wsec/s avgrq-sz avgqu-sz 553.49 47.64 0.24 0.07 60.26 0.00 553.43 47.64 0.24 0.00 0.00 0.00 30.91 10.46 0.00 74.49 55.81 2570.75 595.95 106.94 446.48 www.enkitec.com 64.71 8.00 0.07 0.62 await 3.11 2.18 3.11 svctm 0.23 0.66 0.23 %util 1.80 0.00 1.80 1.58 4.77 0.25 0.08 1.03 1.05 8
9.
OEM ASH AcNvity breakdown • We know that many of the sessions were hung waiNng for IO related wait events • …but some were ulNmately blocked by SQL*Net message to client • Let’s peek around further in the database: www.enkitec.com What, CPU load over 50 on a 4 CPU machine?! 9
10.
OEM Performance page • No CPU problem. User I/O, Commit and ApplicaNon waits This data comes from OS (v$osstat) so should be reliable www.enkitec.com But the Performance Page doesn’t show CPU load that we saw on the (ASH) AcNvity Detail? 10
11.
Go to the source (OS) • Sar & vmstat data: No CPU starvaNon! procs r b 5 0 0 0 0 0 -----------memory---------- ---swap-- -----io---- --system-swpd free buff cache si so bi bo in cs 143272 264980 261616 6970896 0 0 3164 319 3 1 143272 257376 261616 6970568 0 0 840 23 6351 8484 143272 261748 261616 6970952 0 0 0 3535 5303 7740 -----cpu------ us sy id wa st 14 3 77 6 0 11 8 73 8 0 7 1 89 2 0 • Whom to trust? • OS tools, V$OSSTAT and Load figures in EM Performance Page ask for the CPU usage figures from OS – so are ok • The ASH data (and EM AcNvity page) assume that any session not marked as “waiNng” in V$SESSION is on CPU! • h.p://blog.tanelpoder.com/2007/06/18/advanced-‐oracle-‐troubleshooNng-‐guide-‐ when-‐the-‐wait-‐interface-‐is-‐not-‐enough-‐part-‐1/ • h.p://oracledoug.com/serendipity/index.php?/archives/1432-‐Time-‐Ma.ers-‐DB-‐ CPU.html www.enkitec.com 11
12.
Checkpoint • Something weird is going on! • Oracle says many sessions are on on CPU, when they really aren’t • Oracle says sessions are waiNng for IO wait events a lot, while not much IO acNvity was going on • … and the OS level IO metrics didn’t show long IO compleNon Nmes either The IO hangs can be tricky to diagnose as the iostat figures are updated when the IO actually completes* • Many sessions reported doing IO by Oracle are blocked by a session waiNng for SQL*Net message to client www.enkitec.com 12
13.
Time to get systemaNc • … and see what these hung processes are really doing! • Did I hear someone saying process stack?! ;-‐) • Reminder: Oracle is just another program wri.en in C • The process stack will show in which of those C funcNons the problemaNc process execuNon (hang) currently is! • All major Unix plavorms have pstack (procstack on AIX) • Oradebug short_stack / dump errorstack would also do it * • However the hangs were sporadic… www.enkitec.com I prefer OS pstack as it’s cleaner 13
14.
@mon_stack.sql for waiNng for lisNng the blocker • When the Nme is right: -- STEP 1 DEFINE threshold=&1 -- First sleep and monitor V$SESSION to find long waits -- in the database -- STEP 2 SELECT 'ULTIMATE_BLOCKER_'||TRIM(s.type) ||'= '||TRIM(osid) blocking_spid , w.in_wait_secs -- This PL/SQL block will just keep running until a -- long enough wait is seen DECLARE l_threshold NUMBER := &threshold; l_max_wait NUMBER; BEGIN WHILE TRUE LOOP , w.pid , w.sid , w.in_wait , w.wait_event , w.p1 , w.p2 , w.p3 FROM SELECT MAX(seconds_in_wait) INTO l_max_wait FROM v$session WHERE state = 'WAITING' AND wait_class != 'Idle'; IF l_max_wait > l_threshold THEN EXIT; END IF; DBMS_LOCK.SLEEP(30); END LOOP; END; / v$wait_chains w , v$session s WHERE w.sid = s.sid AND w.sess_serial# = s.serial# AND w.blocker_sid IS NULL AND w.num_waiters > 0 / -- Exit script EXIT www.enkitec.com 14
15.
Wait unNl the hang happens mon_hang_stack.sh sqlplus -s $ORA_LOGON @mon_stack $THRESHOLD > $TMPFILE ULTIMATE_BLOCKERS=`grep ULTIMATE_BLOCKER_USER $TMPFILE | awk '{ print $2 }'` echo >> $LOGFILE cat $TMPFILE >> $LOGFILE echo >> $LOGFILE echo DATE=`date +"%Y-%d-%m %H:%M:%S"` ULTIMATE_BLOCKERS=$ULTIMATE_BLOCKERS >> $LOGFILE for i in $ULTIMATE_BLOCKERS ; do echo >> $LOGFILE echo DATE=`date +"%Y-%d-%m %H:%M:%S"` running pstack on PID=$i >> $LOGFILE echo >> $LOGFILE echo Stack trace 1 >> $LOGFILE echo >> $LOGFILE pstack $i >> $LOGFILE sleep 1 echo >> $LOGFILE echo Stack trace 2 >> $LOGFILE echo >> $LOGFILE Wait unNl the hang happens (the mon_stack script exits only when it detects a long enough wait and then proceed to pstack’ing the ulNmate blocker PIDs pstack $i >> $LOGFILE sleep 1 echo >> $LOGFILE echo Stack trace 3 >> $LOGFILE echo >> $LOGFILE pstack $i >> $LOGFILE done www.enkitec.com 15
16.
The stack trace This is where the process execuNon currently is #1 0x00000000032ed6d7 #2 0x00000000032e9e30 #3 0x0000000003281c10 #4 0x00002af99df1758d Cluster services #5 0x00002af99df13daa communicaNon #6 0x00002af99df124e6 funcNons #7 0x00002af99df120a3 #8 0x00002af99df10c18 #9 0x00002af99defa9e0 #10 0x00002af99defbad3 #11 0x0000000006eaf951 #12 0x0000000003aff6c2 #13 0x0000000003b00f07 #14ASM file -‐> Physical 0x0000000003ae342c device address #15 0x0000000003adcf9f #16 0x0000000003a0f19b translaNon! #17 0x0000000005c7fb57 #18 0x0000000005c81f3a #19 0x0000000005c7e5e9 #20 0x0000000005c7b9ad #21 0x0000000005c7b366 #22 0x0000000005c4c1db #23 0x0000000005c48574 #24 0x0000000007c3f837 #25 0x0000000007c3df1d in in in in in in in in in in in in in in in in in in in in in in in in in #26 0x0000000001a01286 in kcfrbd () ntevpque () #27 0x0000000000e01407 in kcbzib () ntevqone () #28 0x0000000007a7451b in kcbgcur () nsevwait () #29 0x0000000000d130de in ktbgcur () clsc_nswait () #30 0x0000000007a15b5f in ktspfpblk () clsc_select_ext () #31 0x0000000007a1458d in ktspfsrch () clsc_receive_wait () #32 0x0000000007a13f01 in ktspscan_bmb () clscreceive () #33 0x0000000007a1351f in ktspgsp_main () clscconnect () #34 0x0000000001427ec4 in kdisnew () clsssInitNative () #35 0x00000000014258cc in kdisnewle () clsssinit () #36 0x000000000140ca16 in kdisle () #37 0x00000000013c6899 in kdiins0 () kgxgncin () #38 0x00000000013d7d6c in kdiinsp () kfmsInit () #39 0x0000000007aa8516 in kauxsin () kfmsSlvReg () #40 0x0000000007ca0881 in qesltcLoadIndexList () kfmdSlvOpPriv () #41 0x0000000007ca04f9 in qesltcLoadIndexes () kfmEnslave () #42 0x0000000007c806fc in kfddsGet () __PGOSF606_qerltcNoKdtBufferedInsRowCBK () kfioTranslateIO () #43 0x0000000007c7e753 in qerltcSingleRowLoad () kfioRqSetPrepare () #44 0x0000000007c7d5e7 in qerltcFetch () #45 0x0000000007bc742d in insexe () kfioSubmitIO () #46 0x0000000007c8f4c7 in opiexe () kfioRequestPriv () ... kfioRequest () ... ksfd_kfioRequest () #82 0x0000000001762cea in sou2o () This is the ksfd_osmio () #83 0x0000000000975483 in opimai_real () “outmost” ksfd_io () #84 0x00000000017682a1 in ssthrdmain () funcNon in ksfdread1 () #85 0x00000000009753af in main () the stack www.enkitec.com 16
17.
Intermission: How ASM works 2. Check ASM extent pointer cache in the DB instance 1. “Read ASM datafile X block Y” DB Server Process DATABASE INSTANCE ASM Server Process ASM INSTANCE 4. Read the block from disk device DISK DEVICE /dev/rdsk/xyz 3. Fetch ASM -‐> Physical disk block mapping from ASM instance! (IPC call!) DISK DEVICE /dev/rdsk/xyz www.enkitec.com SQL> @sgastat asm POOL NAME BYTES ------------ -------------------------- ---------- shared pool ASM KFFD SO 2648 shared pool ASM extent pointer array 1784672 shared pool ASM generic network state 2584 shared pool ASM kfk state object 31544 shared pool ASM map operations 30368 large pool ASM map operations hashta 393216 shared pool ASM rollback operations 2648 shared pool ASM scan context 3544 17
18.
A bug! Oyen the already diagnosed bugs have a relevant stack trace listed in the note! www.enkitec.com 18
19.
A bug! • Bug 8429716 Clusteware process (ocssd/crsd/etc) may get too low file descriptor limit (hangs etc..) # ls –l /proc/`pgrep cssd.bin`/fd … lrwx------ 1 root root 64 Mar 29 04:11 lrwx------ 1 root root 64 Mar 29 04:11 lrwx------ 1 root root 64 Mar 29 04:11 lrwx------ 1 root root 64 Mar 29 04:11 … 96 97 98 99 -> -> -> -> socket:[55795] socket:[55802] socket:[55835] socket:[55842] Number of fds in use reached 1024! • 11gR2 Grid Infrastructure Does not Use ulimit Sezng Appropriately [ID 983715.1] Even though the file descriptor array and maximum limits for user processes had been configured correctly (/etc/sysctl.conf and /etc/security/limits.conf), thanks to the Oracle bug, the cssd daemon didn't pick up such a limit (as it's scheduled via rc startup scripts as root, not regular users logging on). Thus the fix would have to be applied into cssd startup script to bump up the file descriptor limit for itself. www.enkitec.com 19
20.
Unistrumented Wait events?! • None of these wait events exist in Oracle 11.1: SQL> @sed css Show wait event descriptions matching %css%.. EVENT# EVENT_NAME ------ ------------------------------------------------------848 CSS Xgrp shared operation 845 CSS group membership query 844 CSS group registration 843 CSS initialization 850 CSS operation: action 846 CSS operation: data query 847 CSS operation: data update 851 CSS operation: diagnostic 849 CSS operation: query 571 GCR CSS join retry 572 GCR member Data from CSS 565 IMR CSS join retry SQL> @sed crs Show wait event descriptions matching %crs%.. EVENT# EVENT_NAME WAIT_CLASS -------------------Other Other Other Other Other Other Other Other Other Other Other Other PARAMETER1 ----------- function_id group_name1 group_name1 WAIT_CLASS PARAMETER1 function_id function_id function_id function_id function_id retry count retry count retry count ------ ------------------------------------------------------- -------------------- ----------- 861 CRS call completion Other clsrrestype www.enkitec.com 20
21.
Thank you – and oh, wait! • New seminars in 2013 • Advanced Oracle TroubleshooNng v2.1 (Feb-‐March) • Advanced Oracle SQL Tuning v2.0 (March-‐April) • Advanced Exadata Performance: TroubleshooNng and OpNmizaNon • h.p://blog.tanelpoder.com/seminar/ • QuesNons: tanel@tanelpoder.com • Blog: h.p://blog.tanelpoder.com • ConsulNng: h.p://www.enkitec.com www.enkitec.com 21