Download as PDF, PPTX

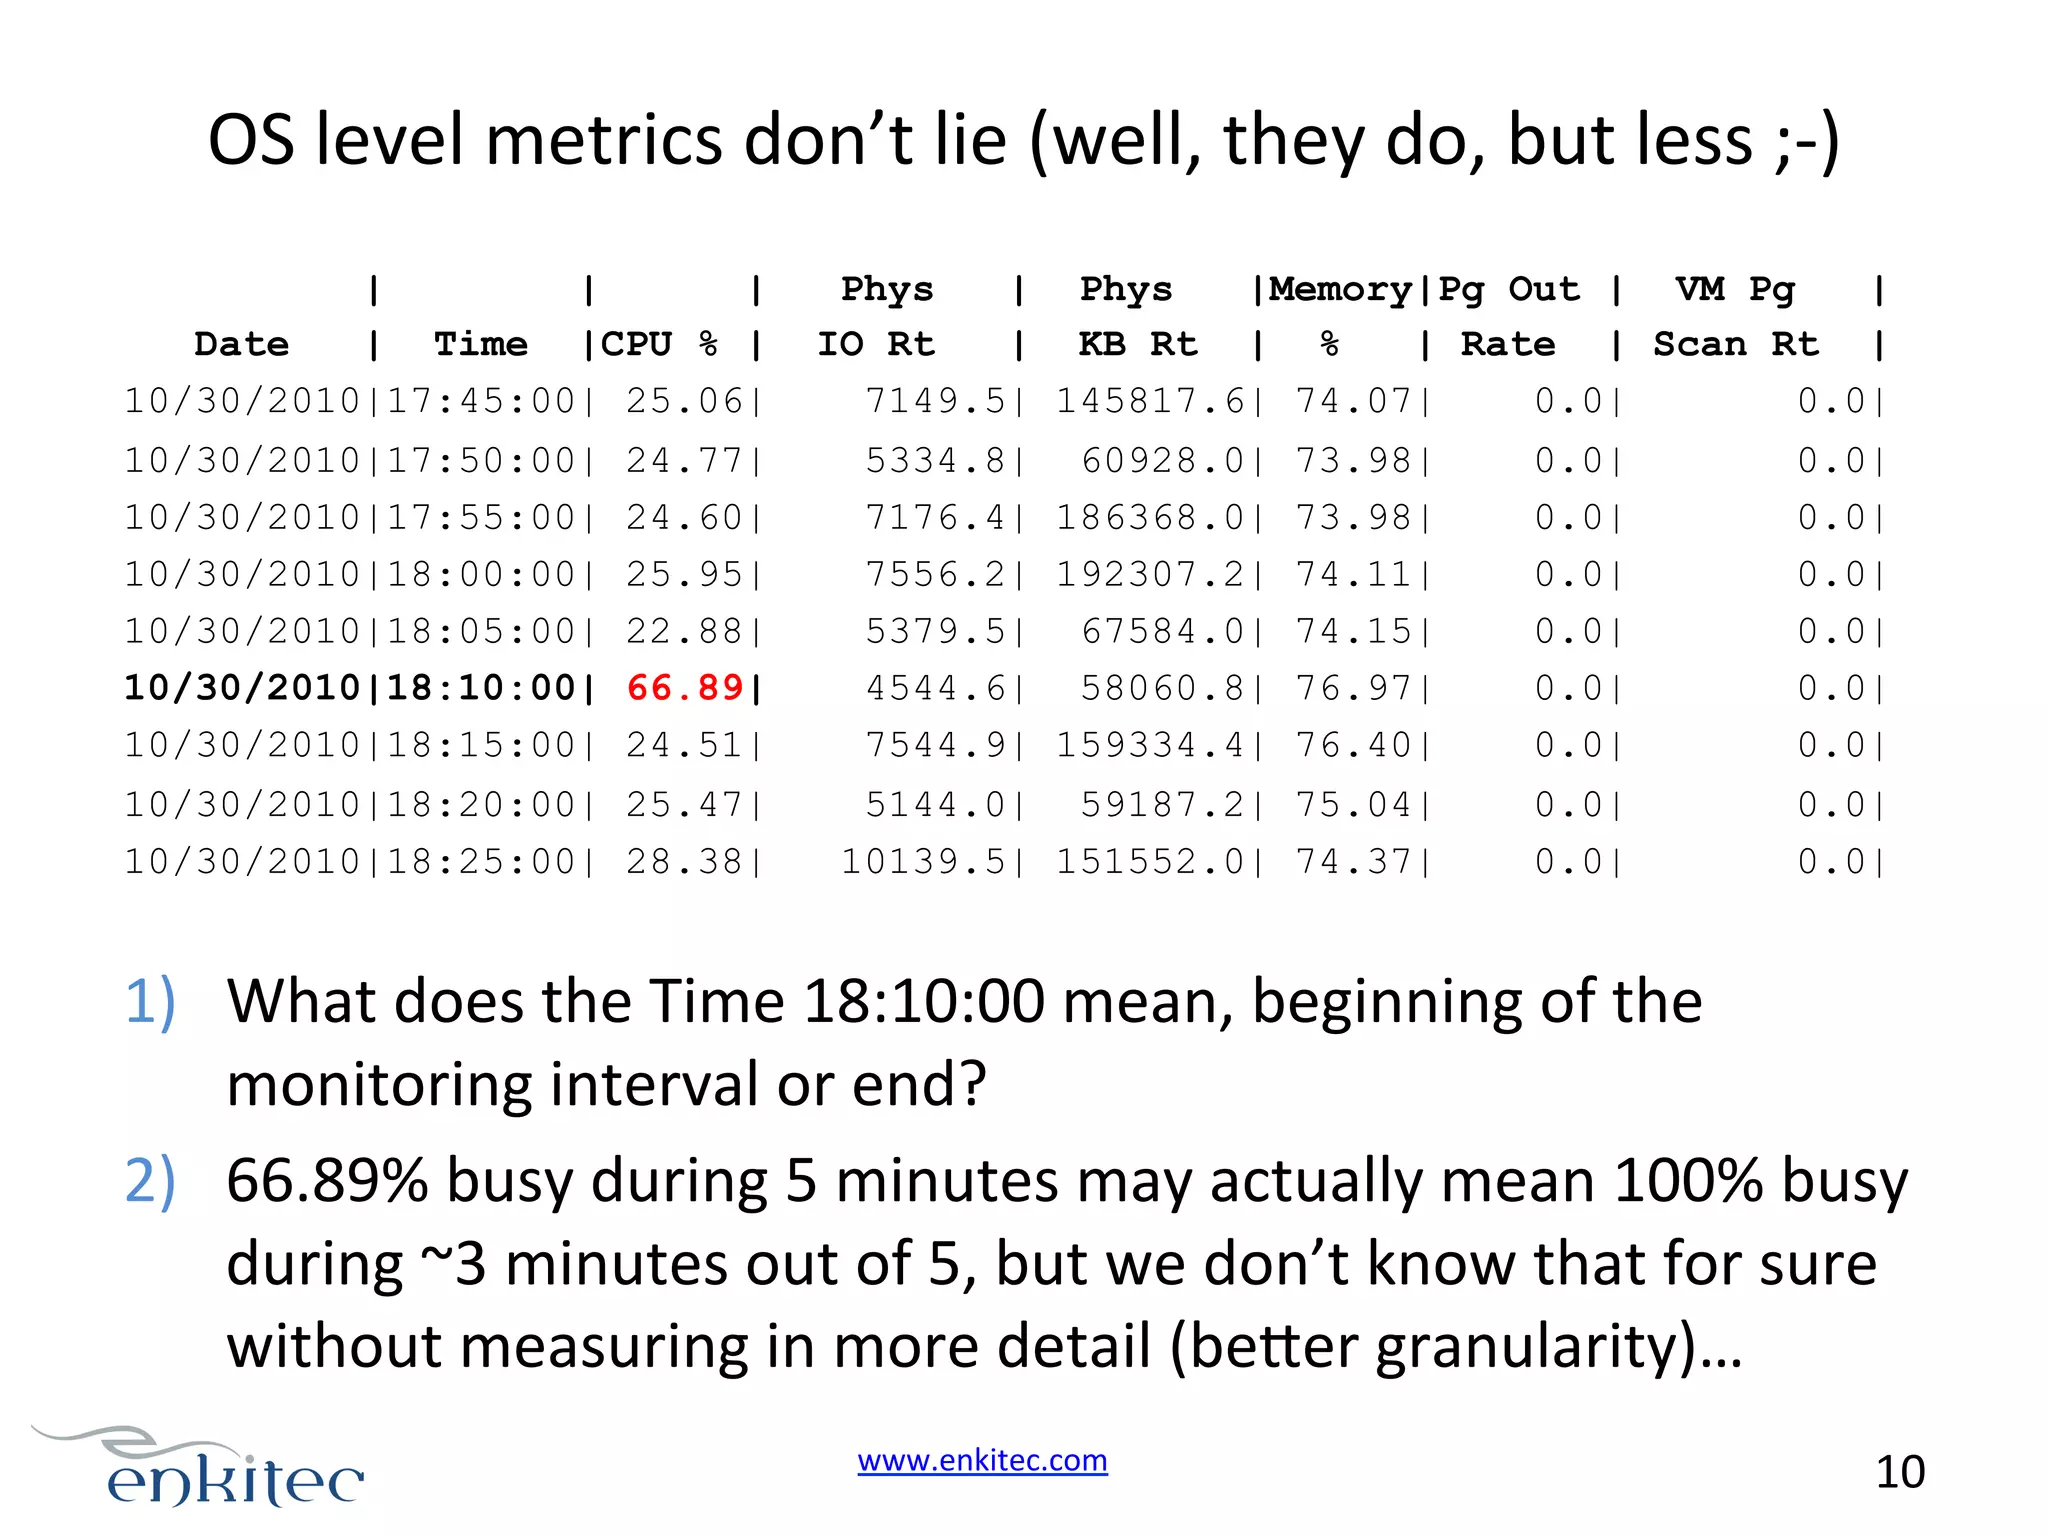
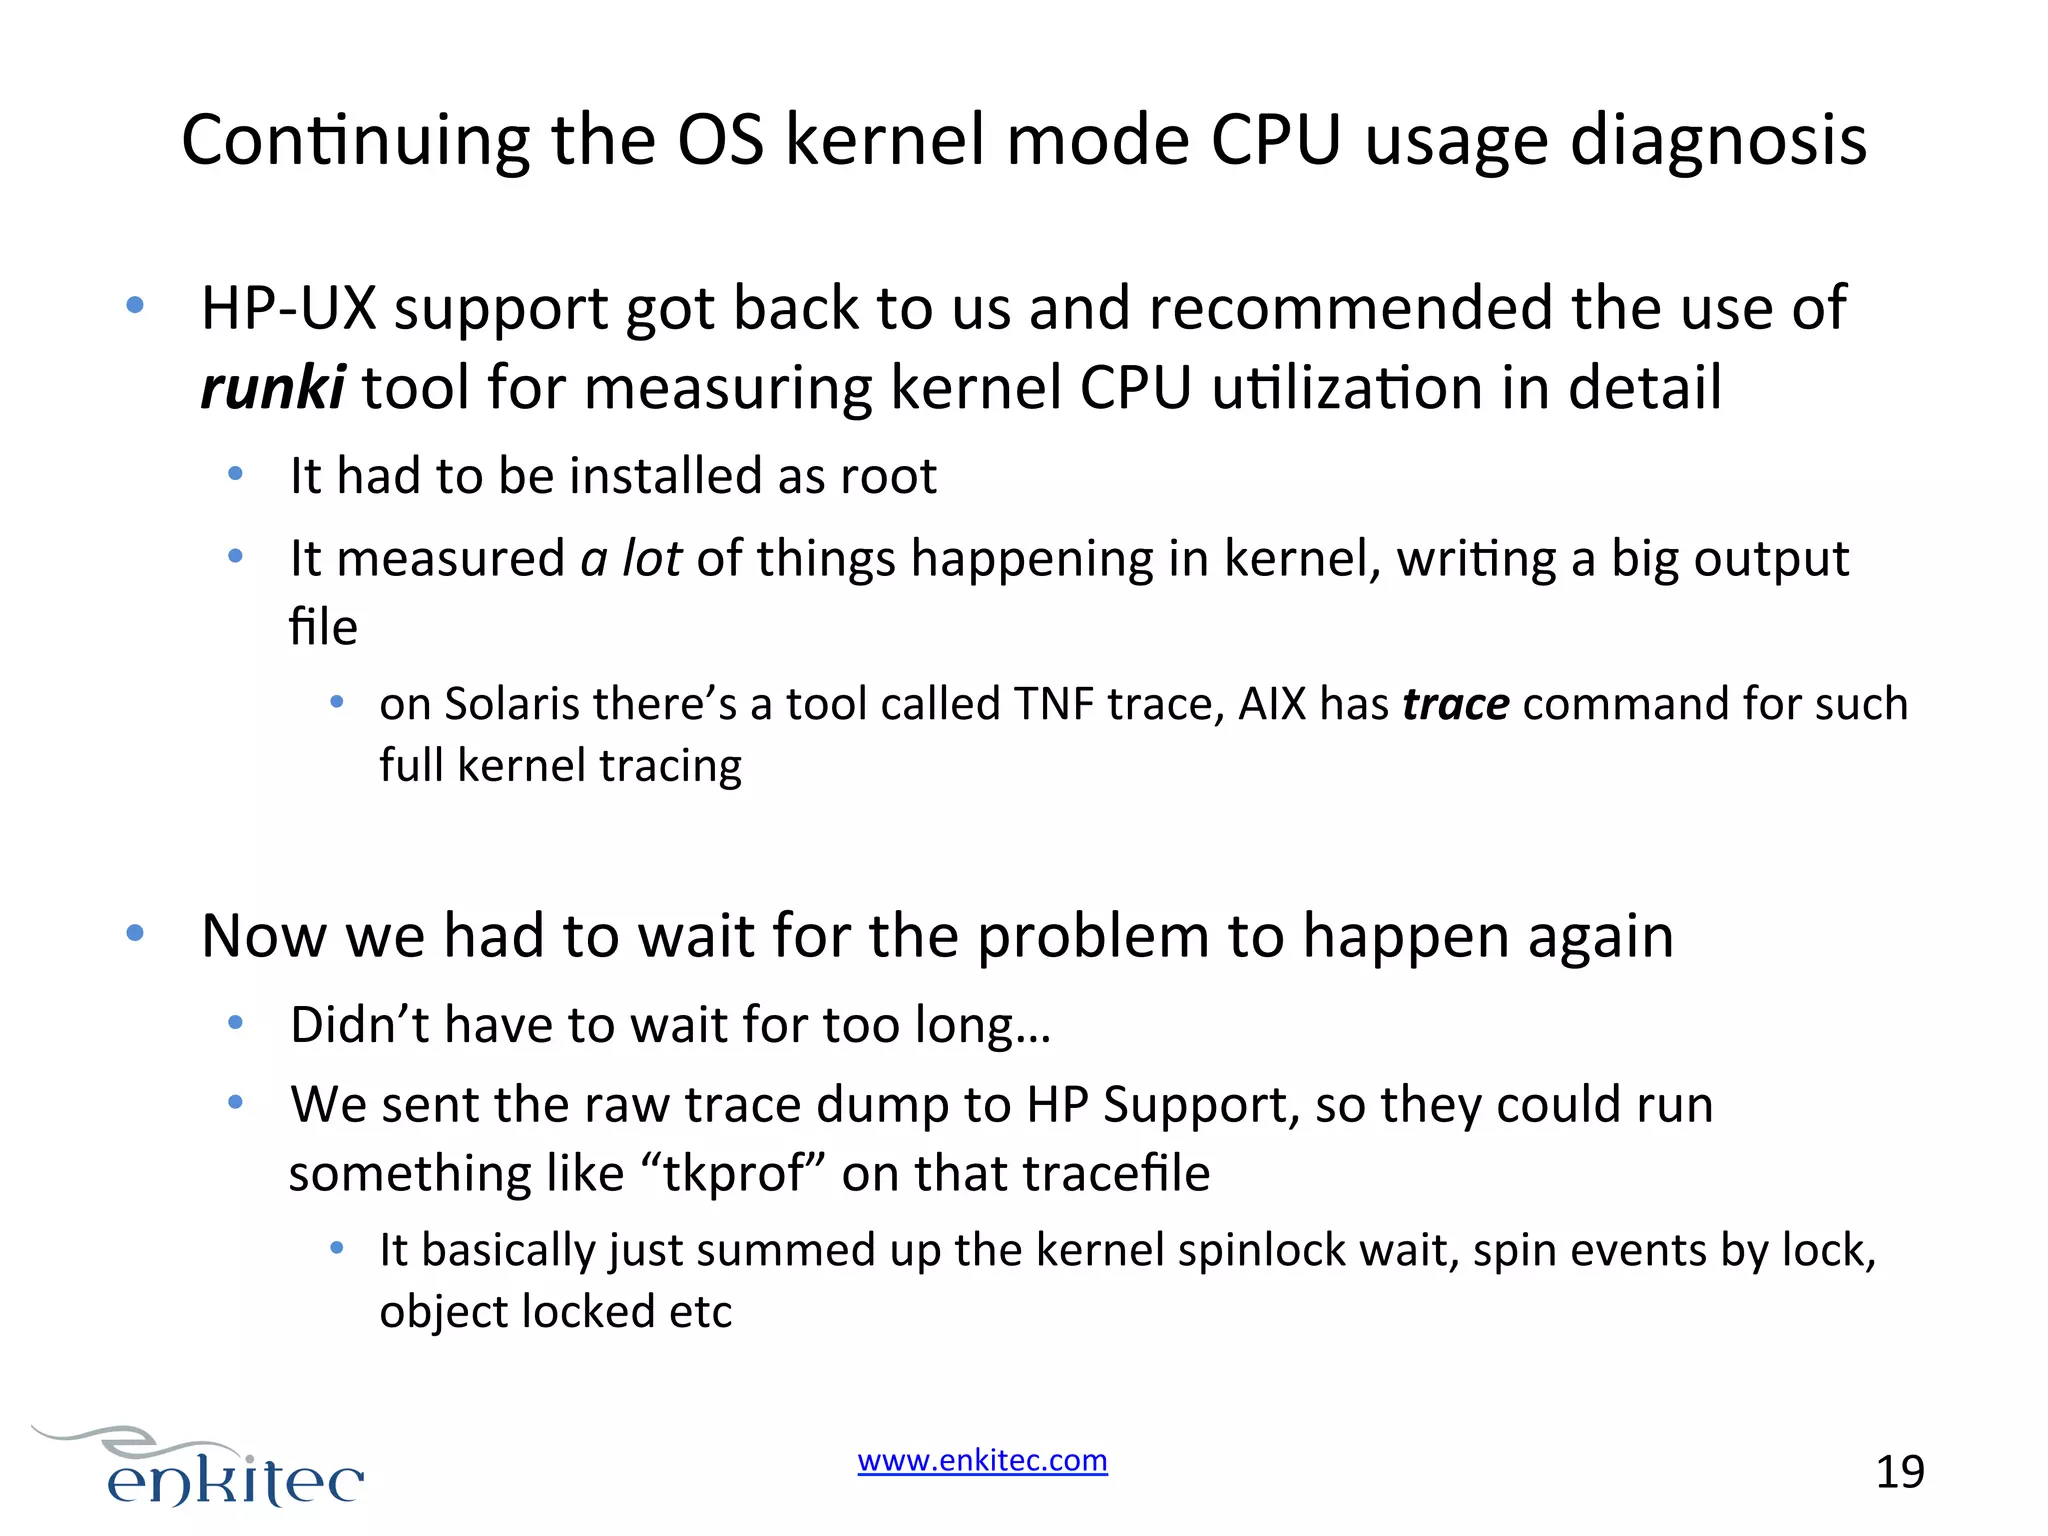
![Con4nuing the OS kernel mode CPU usage diagnosis Let’s trace system calls by one CPU heavy Oracle process # tusc -cp 8021 ( Attached to process 8021 ("oracleXYZ (LOCAL=NO)") [64-bit] ) ( Detaching from process 8021 ("oracleXYZ (LOCAL=NO)") ) Syscall open ----Total Interes4ngly 3 open() syscalls take over a second in total. Could this be caused by the general CPU starva4on in the server? Seconds 1.05 ----1.05 Calls 3 ----3 The next step should have been to check which file did we try to open (but the spike ended before we could do that) www.enkitec.com Errors 3 ----3 Seeing errors isn’t a problem itself, as this is how Oracle and libs some4mes check for existence of a file… 18](https://image.slidesharecdn.com/tanelpodertroubleshootingcomplexperf-140305183556-phpapp02/75/Tanel-Poder-Troubleshooting-Complex-Oracle-Performance-Issues-Part-1-18-2048.jpg)
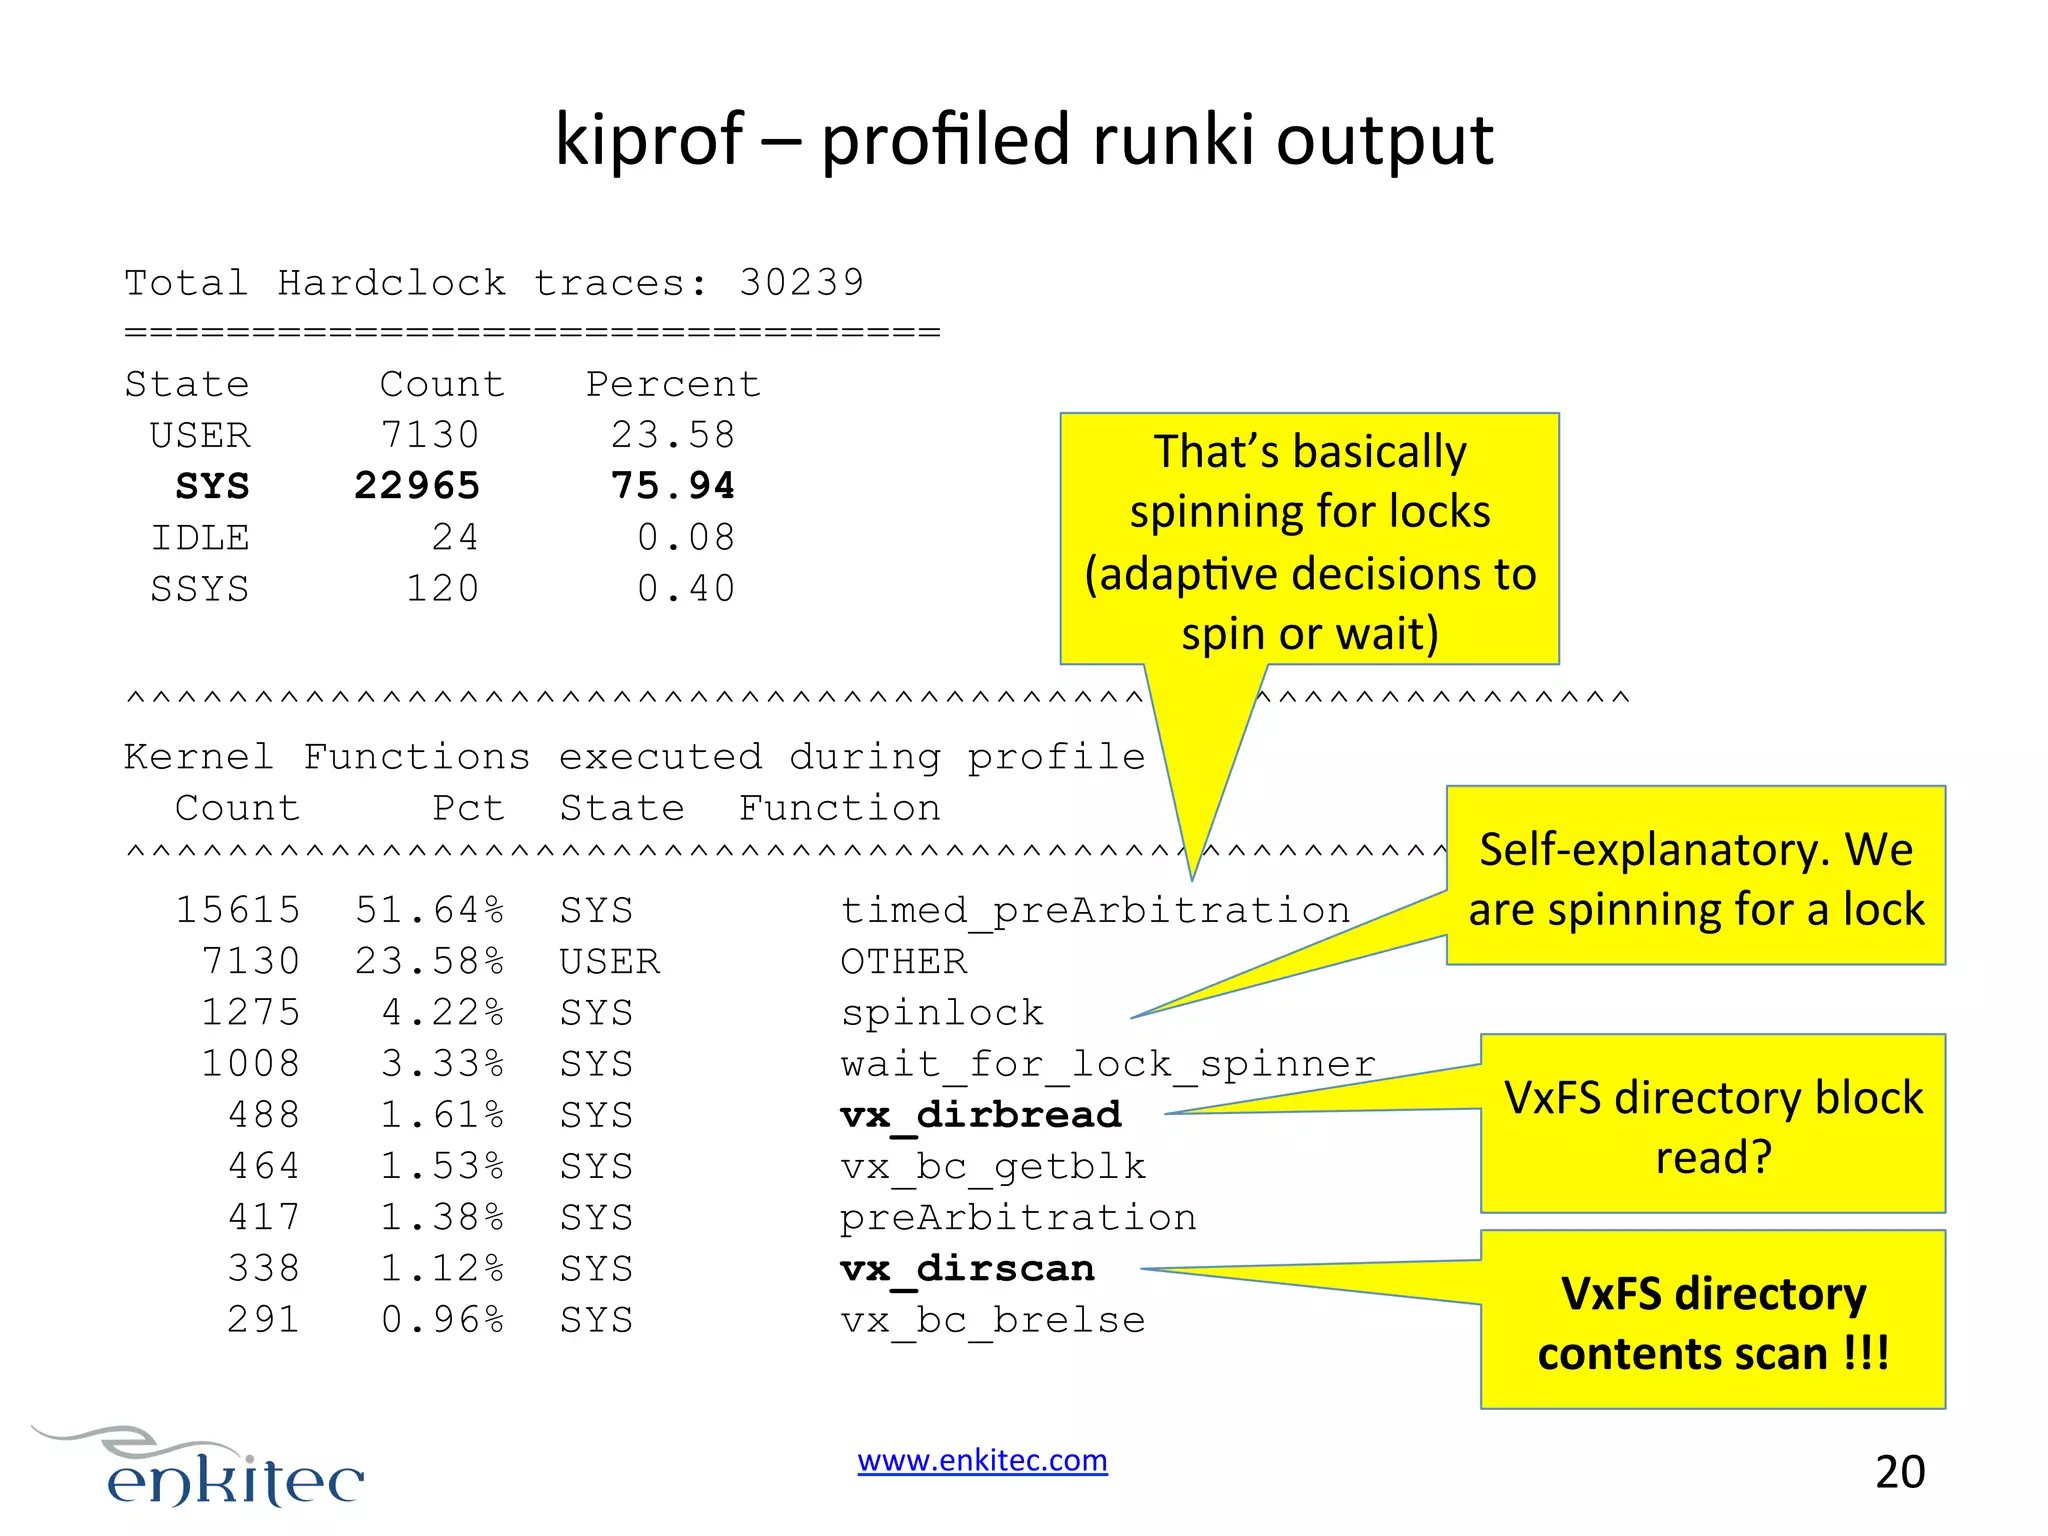
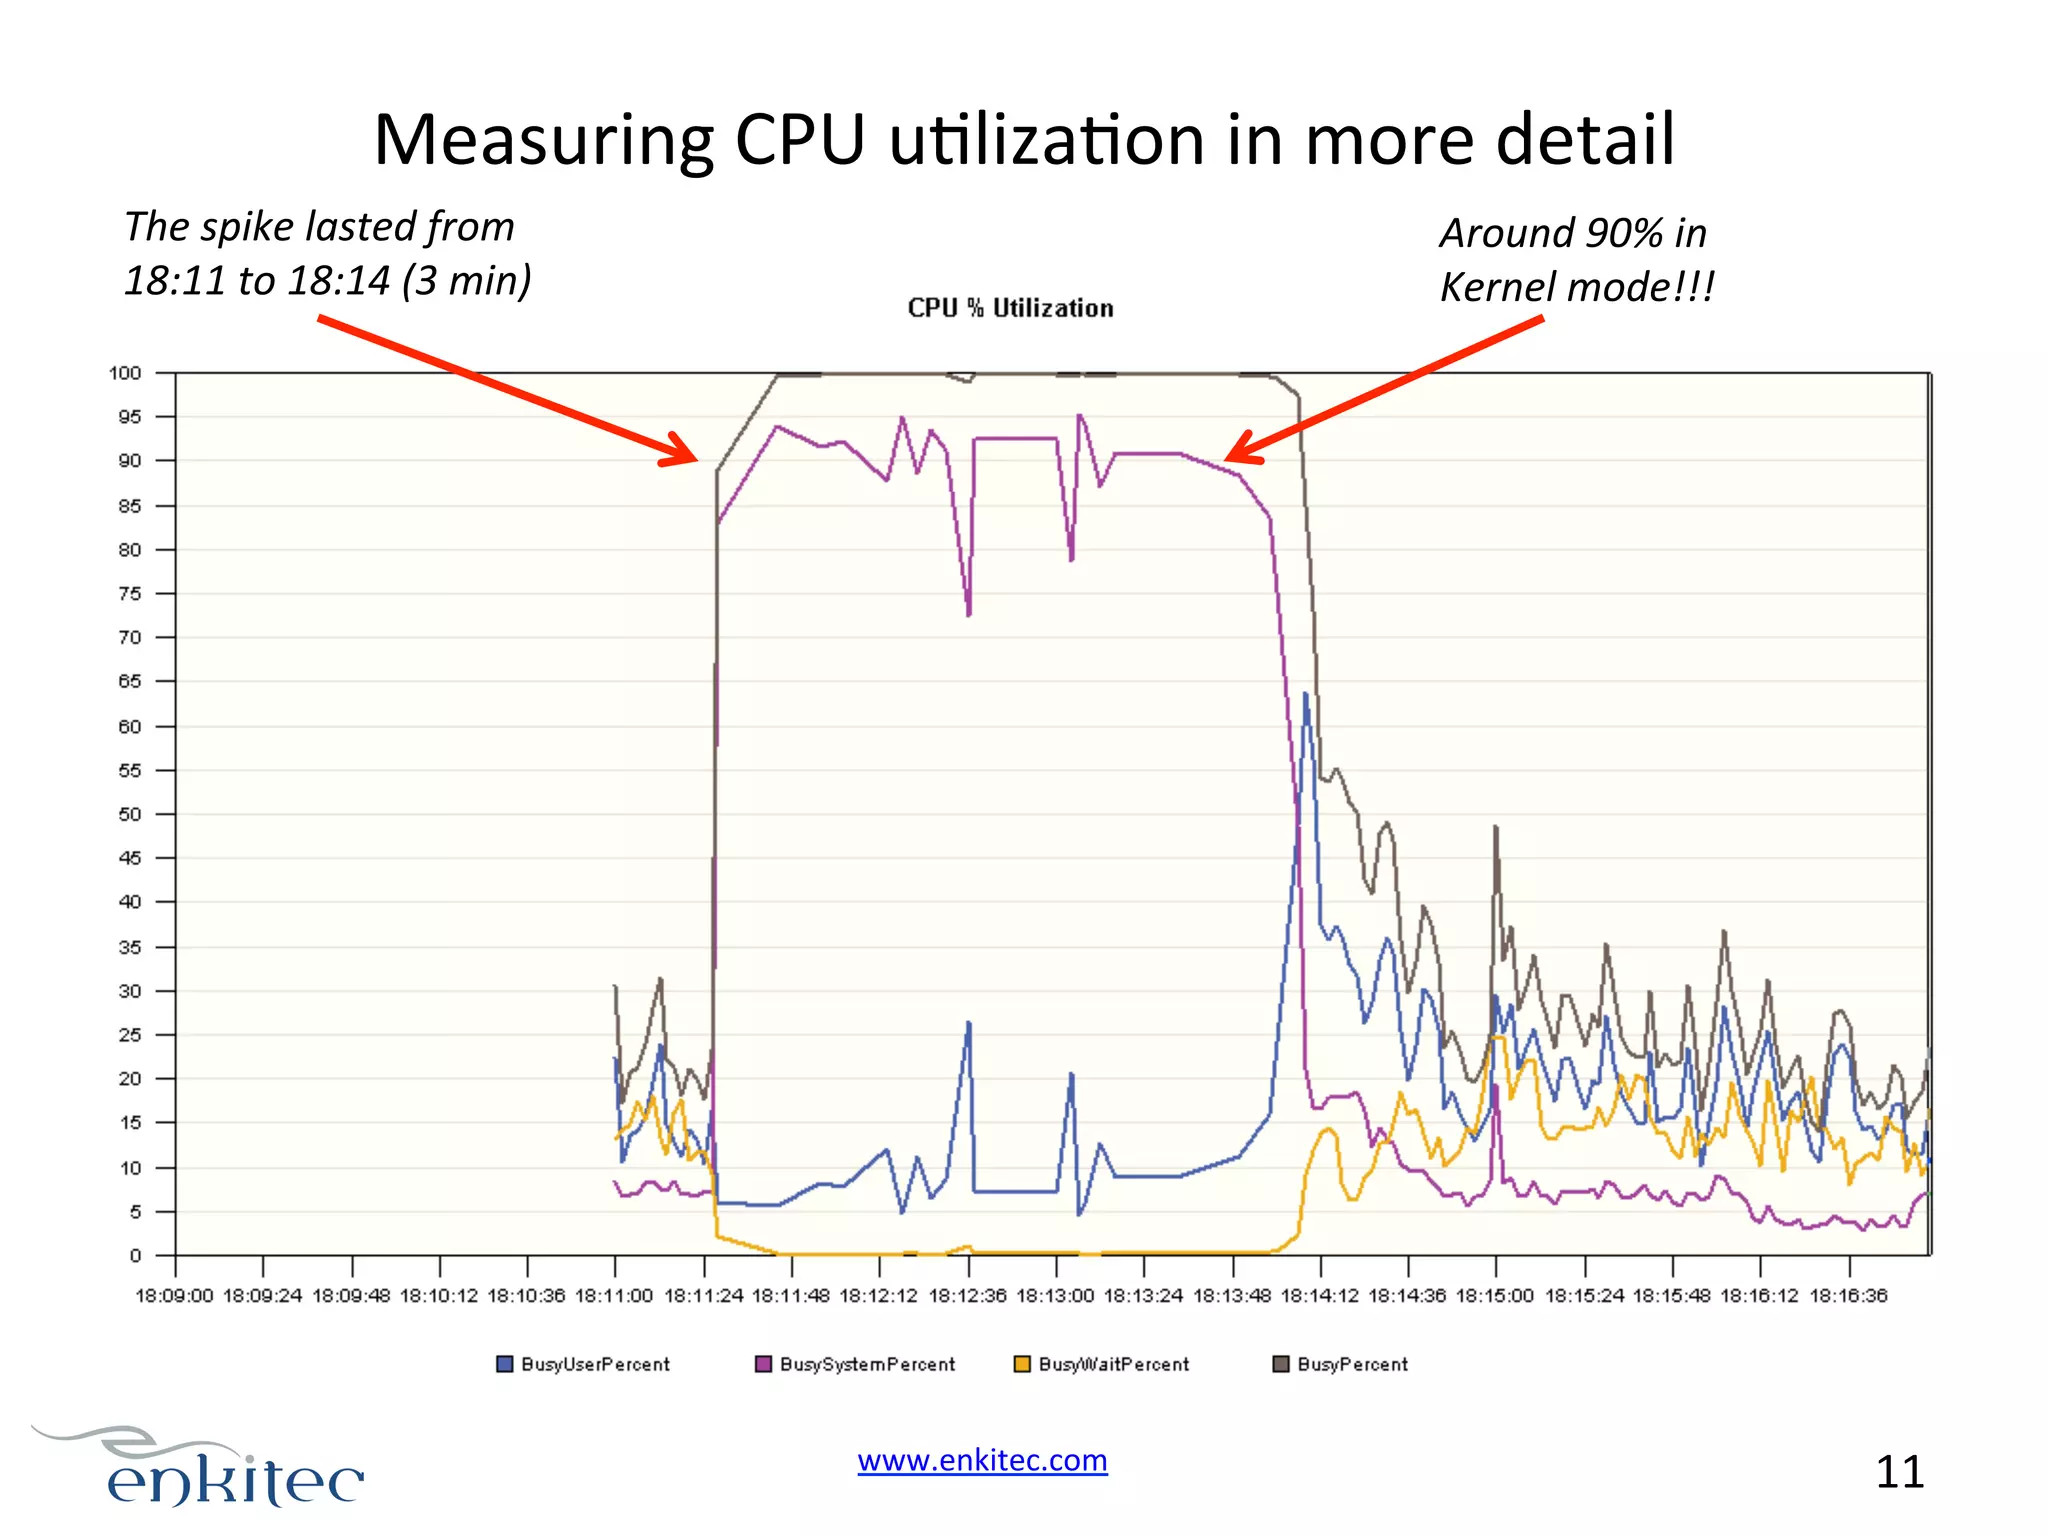
![Drilling down to kernel spinlock spinning The main spinlock experiencing spinning was related to VxFS: spn%kern 7.24 0.11 0.04 0.04 0.01 cumpct 7.24 7.36 7.40 7.44 7.45 seconds 71.96 1.14 0.44 0.42 0.12 spn%cpu lock name 3.77 FS:vxfs:bc_freelist_lock spin 0.06 FS:vxfs:inode spin for sleep lock 0.02 FS:vxfs:i_spinspin lock 0.02 Sleep Queue lock 0.01 v_count_lock Oracle processes were the main ones spinning: spn%spn 99.17 0.60 0.08 0.05 0.03 0.03 cumpct 99.17 99.77 99.85 99.91 99.93 99.96 spnsec 73.82 0.45 0.06 0.04 0.02 0.02 usrsec 880.32 0.00 1.42 0.00 0.00 0.00 kernsec spn%kern process name 543.70 13.58 oracle 7.37 6.11 vxfsd 11.52 0.52 tnslsnr 402.60 0.01 [IDLE] 0.50 4.00 xyz 0.43 4.65 sadc www.enkitec.com 21](https://image.slidesharecdn.com/tanelpodertroubleshootingcomplexperf-140305183556-phpapp02/75/Tanel-Poder-Troubleshooting-Complex-Oracle-Performance-Issues-Part-1-21-2048.jpg)
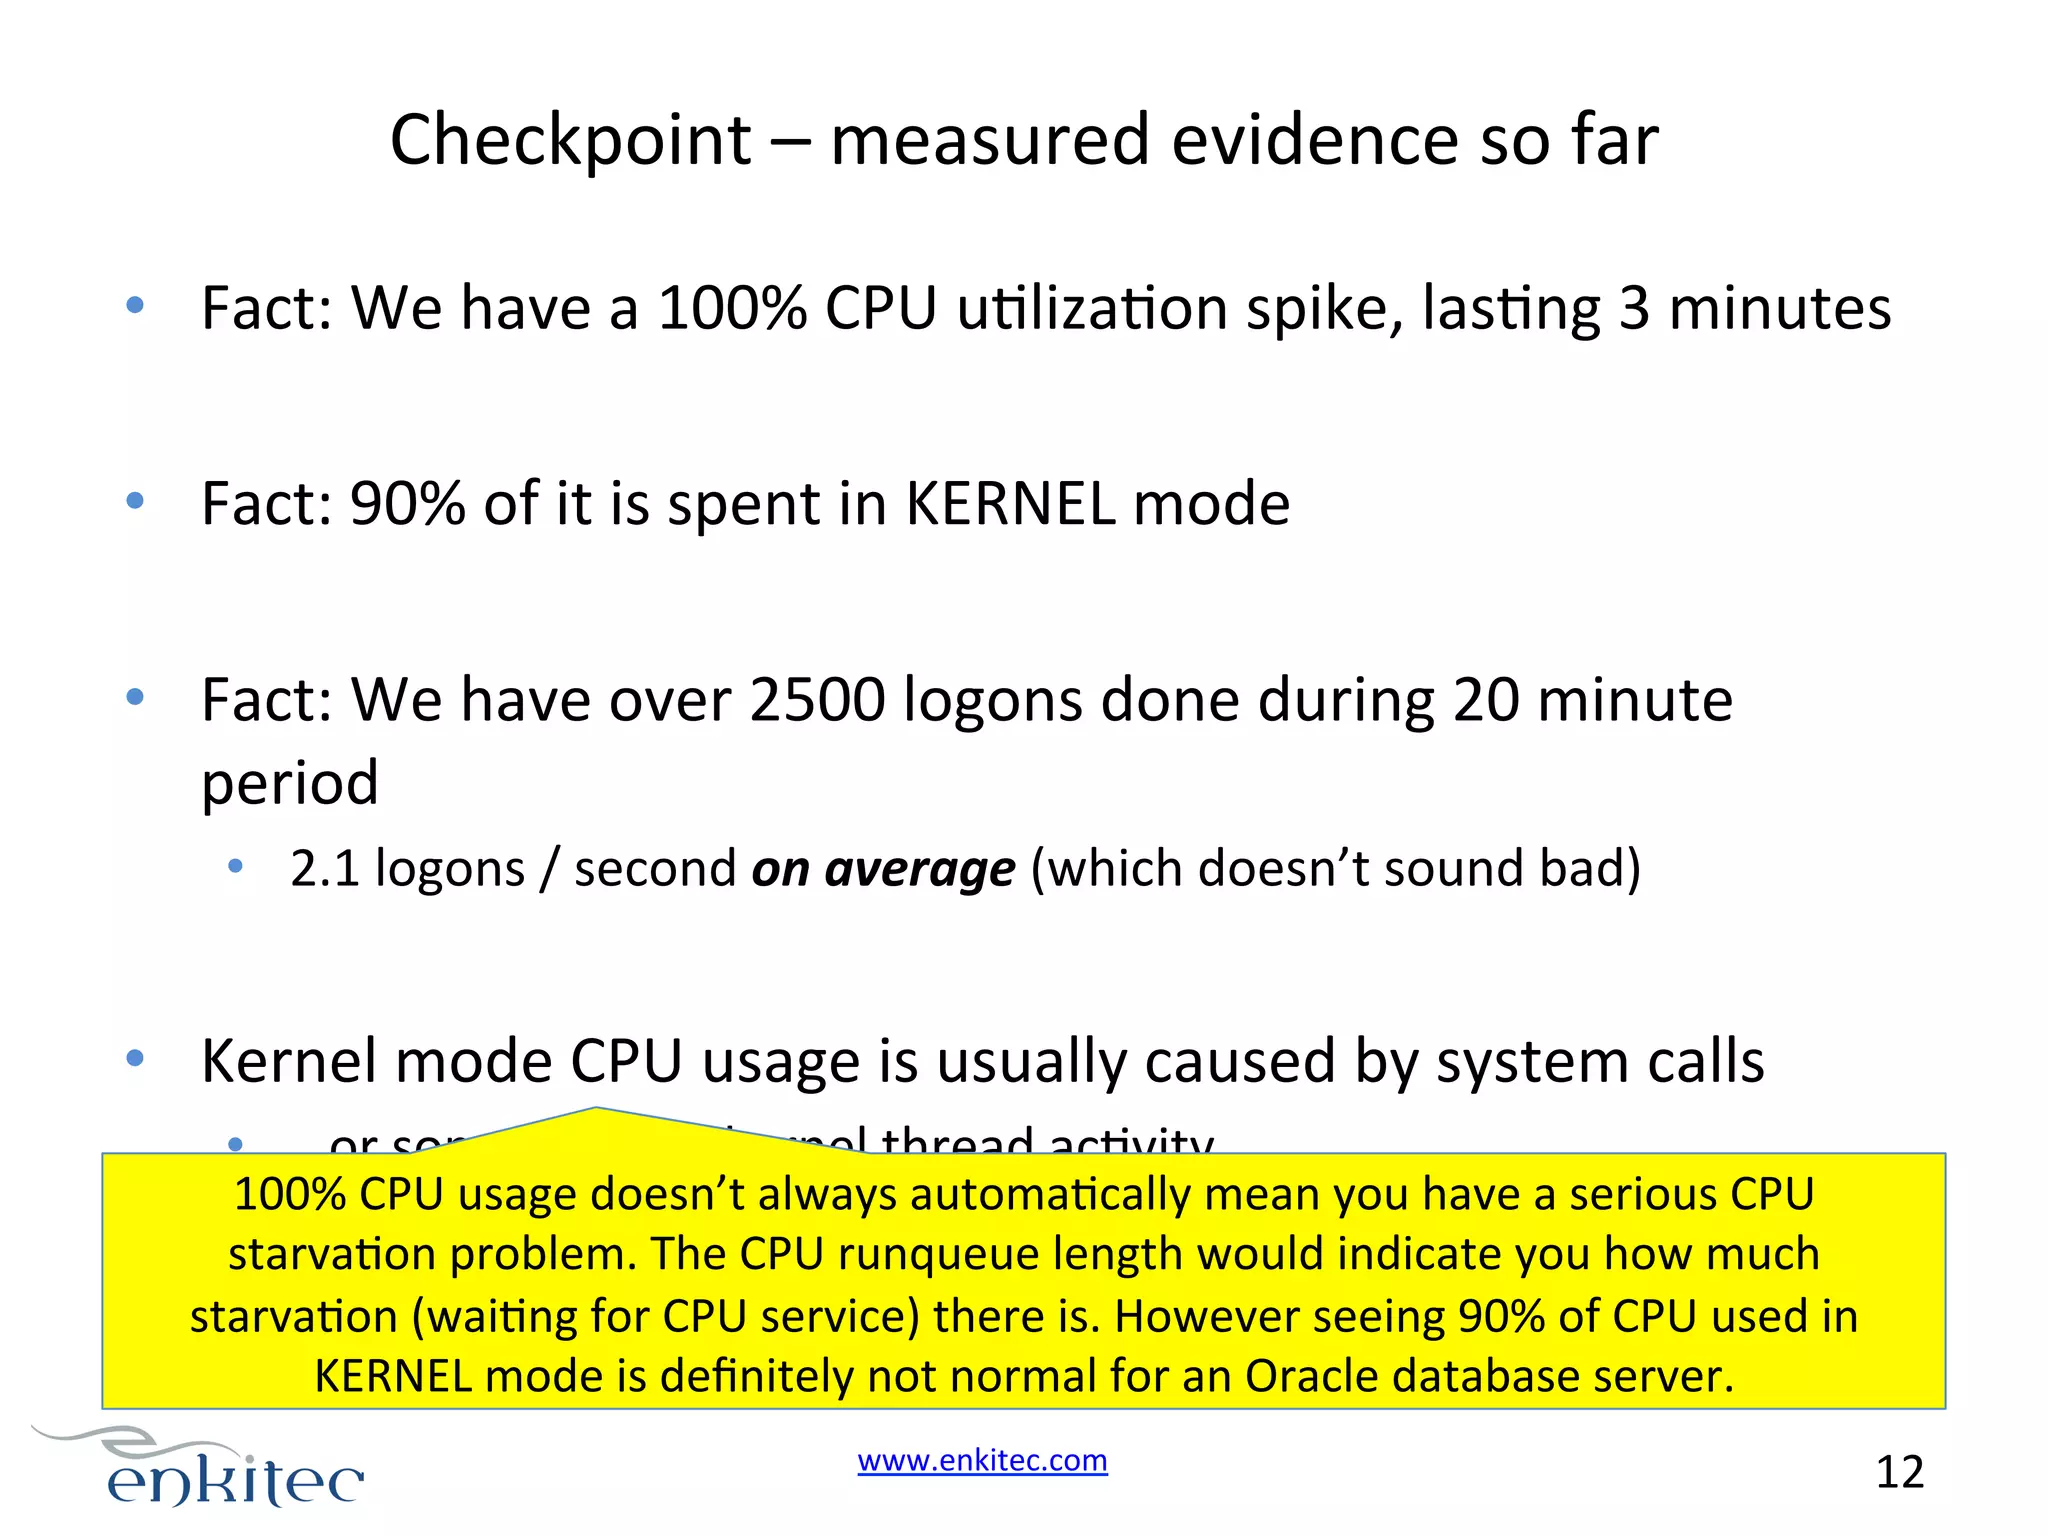
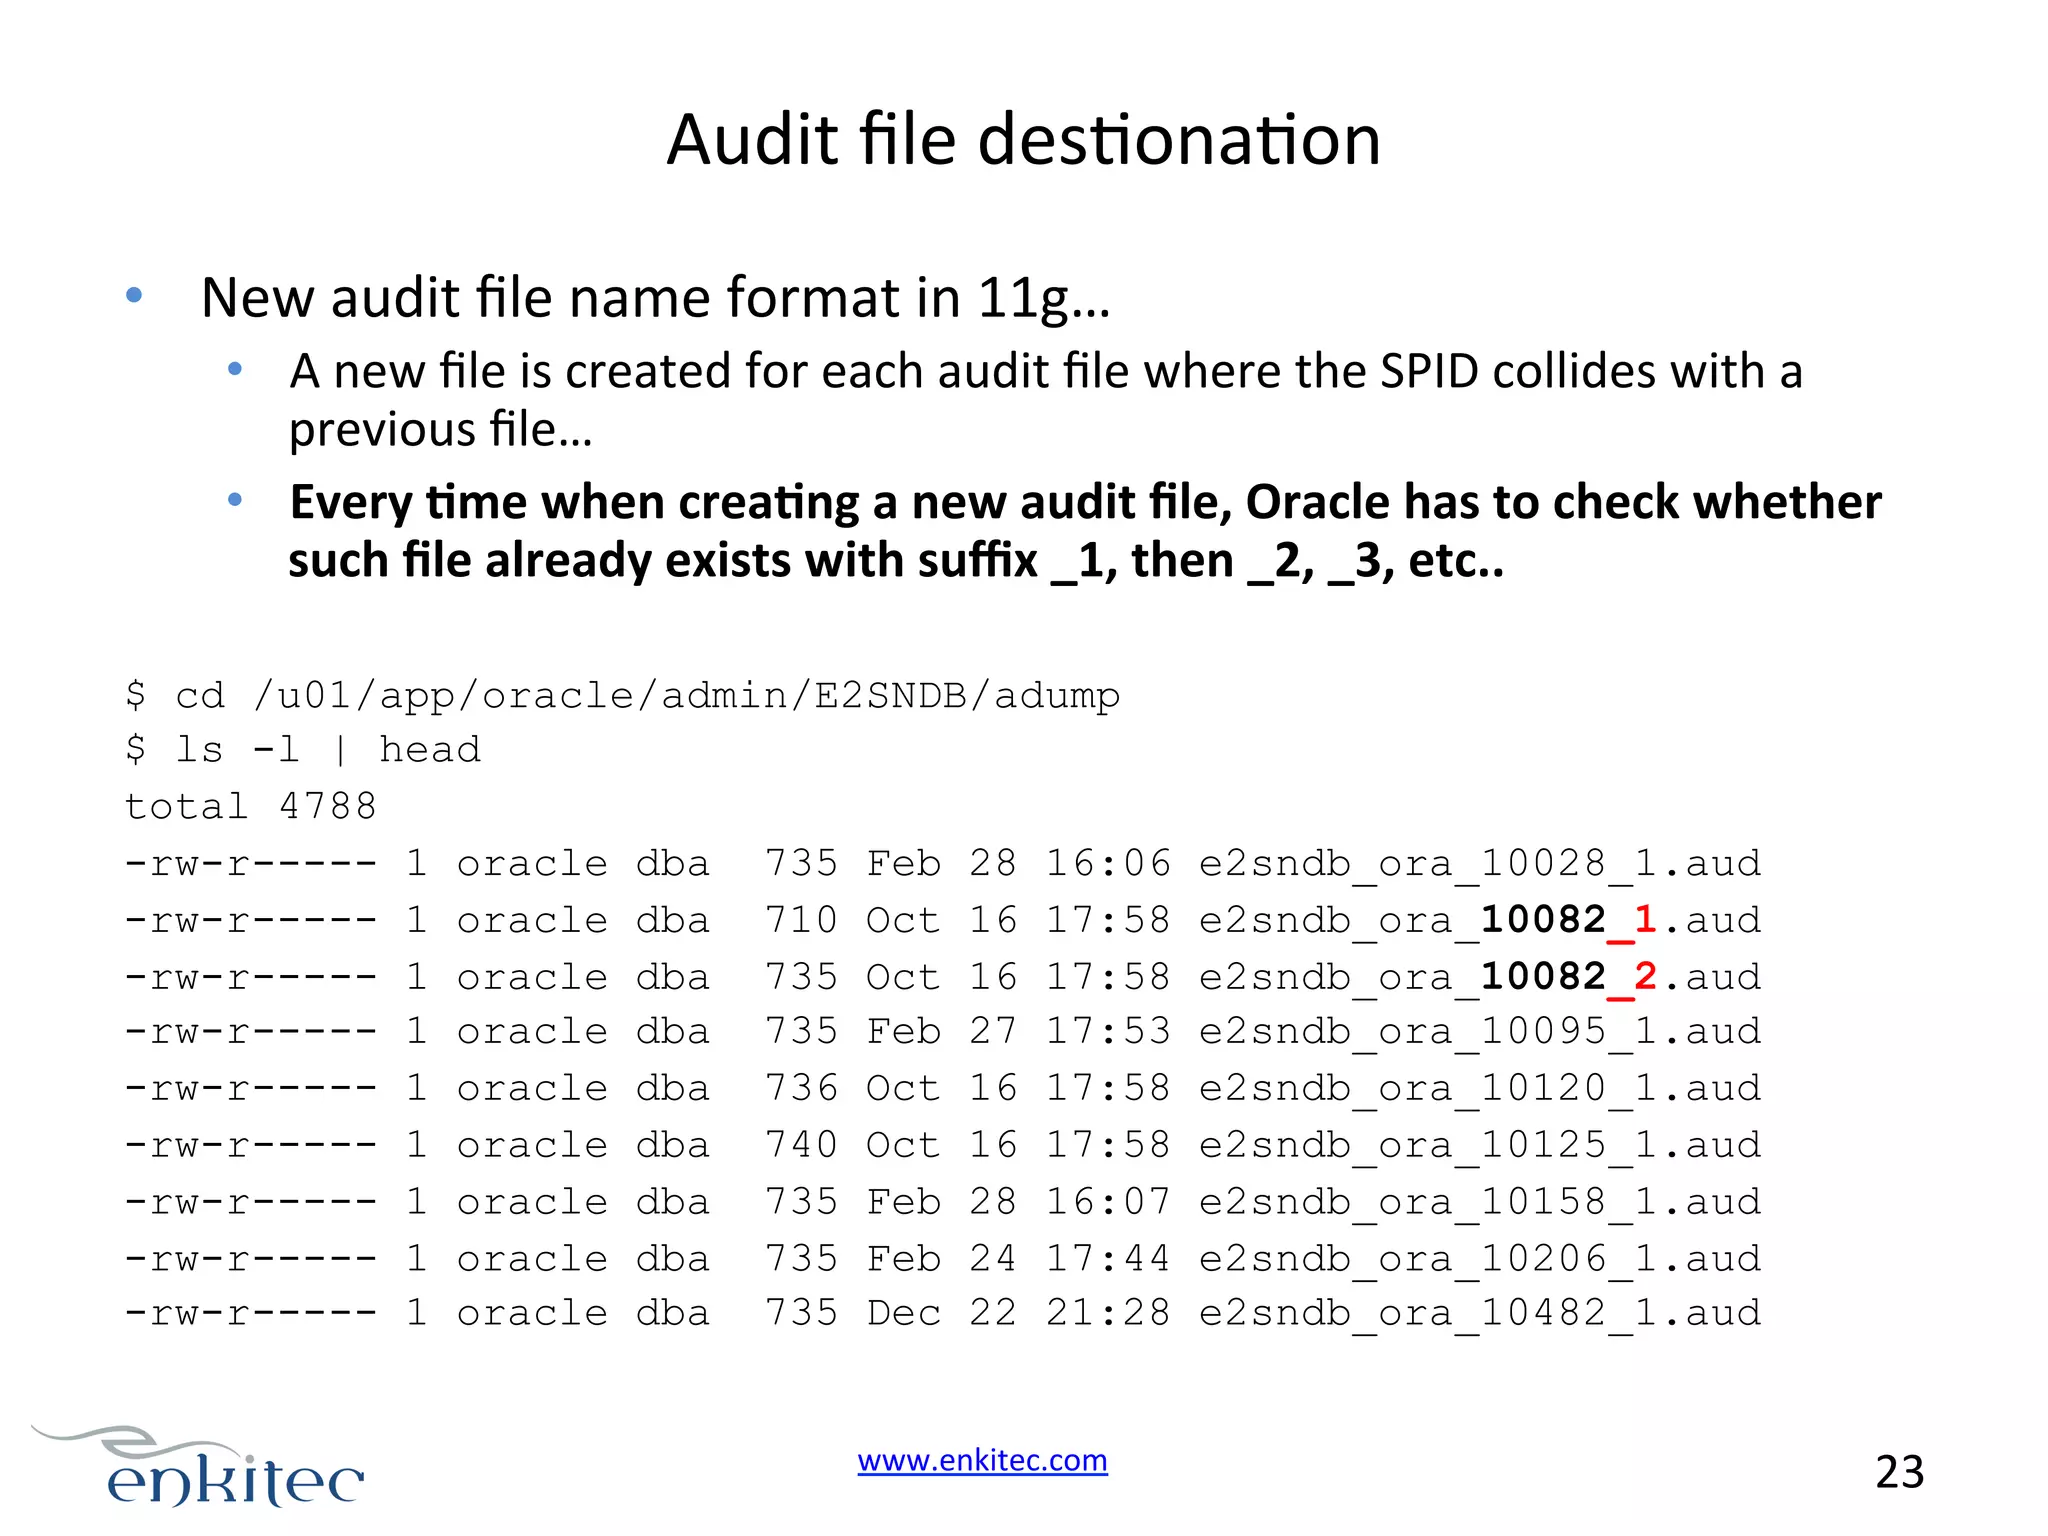
![Which system calls? $ /opt/ktools/bin/kiinfo -kitrace pid=28679,syscalls -ts 1103_1307 | grep open | sort -r -n -k 13,13 | more 2.550292 cpu=6 seqcnt=43808107 pid=28679 ktid=526366 utid=1 open [5] err=17 ret1=12 ret2=1 syscallbeg= 3.295138 ktcsys= 0.000000 A0=0x9fffffff A1= 0xffffceb0 A2=0 A3=0xd02 A4=0 A5=432 fname='/opt/apps/oracle/ admin/xyzdb/adump/xyzdb_ora_28679_21.aud' 8.789893 cpu=6 seqcnt=43825746 pid=28679 ktid=526366 utid=1 open [5] err=17 ret1=12 ret2=1 syscallbeg= 3.172851 ktcsys= 0.000000 A0=0x9fffffff A1= 0xffffceb0 A2=0 A3=0xd02 A4=0 A5=432 fname='/opt/apps/oracle/ admin/xyzdb/adump/xyzdb_ora_28679_23.aud' 5.617009 cpu=6 seqcnt=43816702 pid=28679 ktid=526366 utid=1 open [5] err=17 ret1=12 ret2=1 syscallbeg= 3.066686 ktcsys= 0.000000 A0=0x9fffffff A1= 0xffffceb0 A2=0 A3=0xd02 A4=0 A5=432 fname='/opt/apps/oracle/ admin/xyzdb/adump/xyzdb_ora_28679_22.aud' 18.143066 cpu=6 seqcnt=43848837 pid=28679 ktid=526366 utid=1 open [5] err=17 ret1=12 ret2=1 syscallbeg= 2.576237 ktcsys= 0.000000 A0=0x9fffffff A1= 0xffffceb0 A2=0 A3=0xd02 A4=0 A5=432 fname='/opt/apps/oracle/ admin/xyzdb/adump/xyzdb_ora_28679_26.aud' www.enkitec.com 22](https://image.slidesharecdn.com/tanelpodertroubleshootingcomplexperf-140305183556-phpapp02/75/Tanel-Poder-Troubleshooting-Complex-Oracle-Performance-Issues-Part-1-22-2048.jpg)
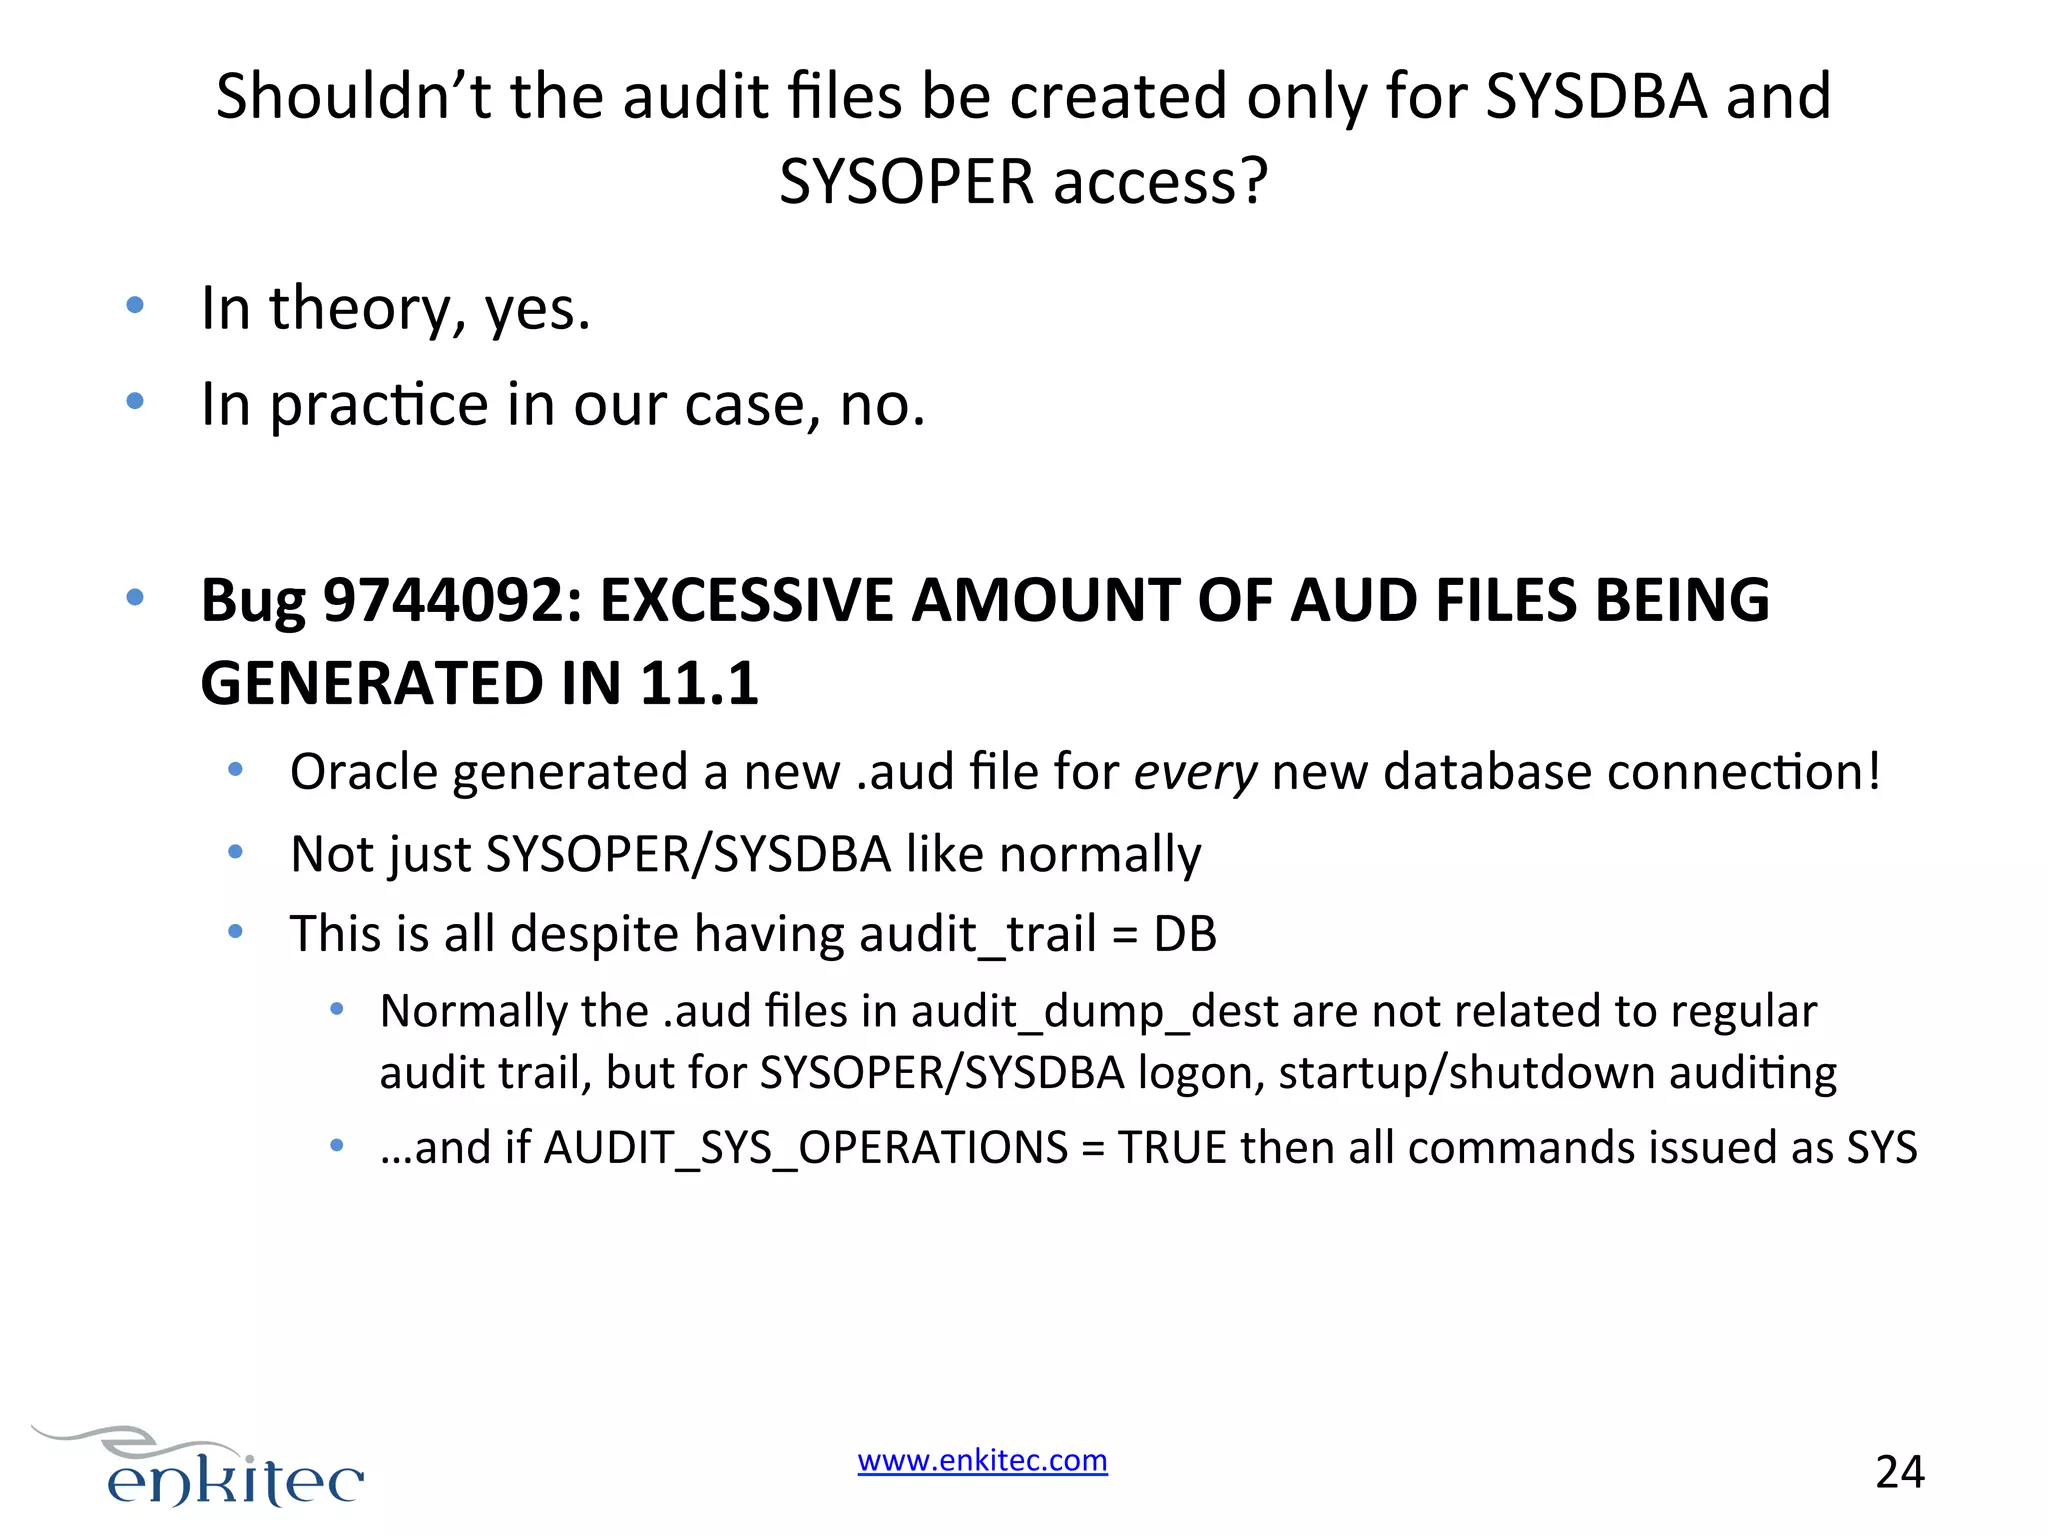
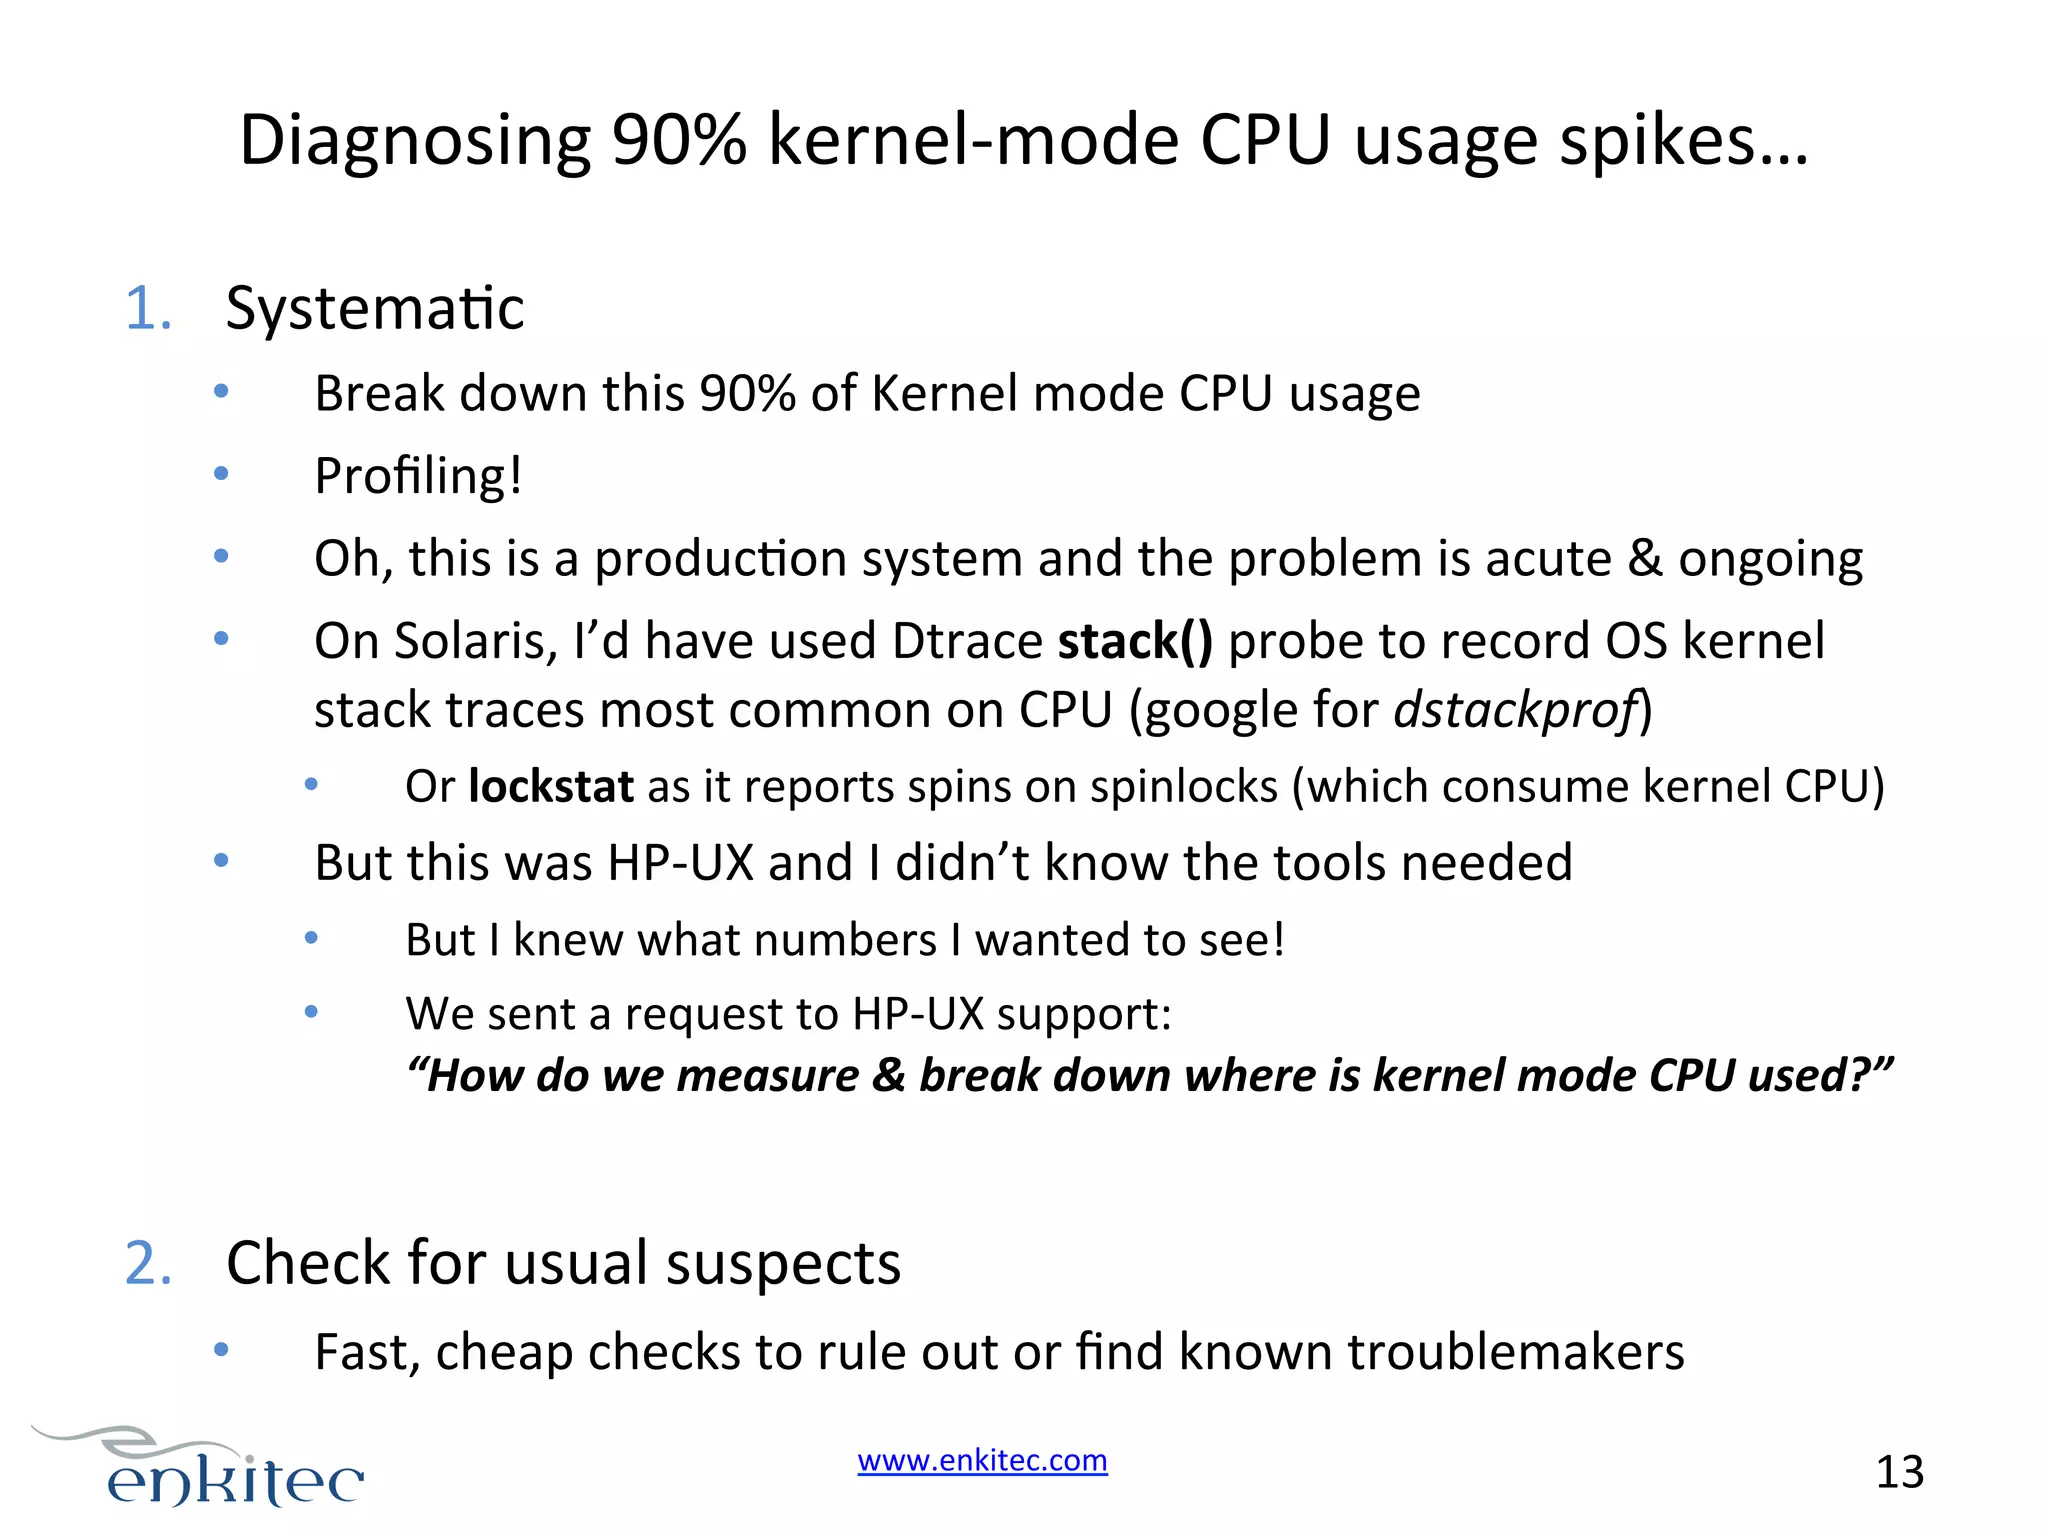
![Bug 9744092: EXCESSIVE AMOUNT OF AUD FILES BEING GENERATED IN 11.1 PROBLEM: -------After upgrade to 11.1 the system creates 10 - 16 *aud files per minute in audit_file_dest. Out of 9528 *.aud files that the customer uploaded, 9124 files recorded ACTION:[3] "102". DIAGNOSTIC ANALYSIS: -------------------The change of behavior (move audit action 102 from aud$ to audit_file_dest when audit_trail=DB.) is due to a fix for an unpublished bug 5476184 in 11.1. It is not an intended feature for 11G. WORKAROUND: ----------Manual delete of audit files www.enkitec.com 25](https://image.slidesharecdn.com/tanelpodertroubleshootingcomplexperf-140305183556-phpapp02/75/Tanel-Poder-Troubleshooting-Complex-Oracle-Performance-Issues-Part-1-25-2048.jpg)

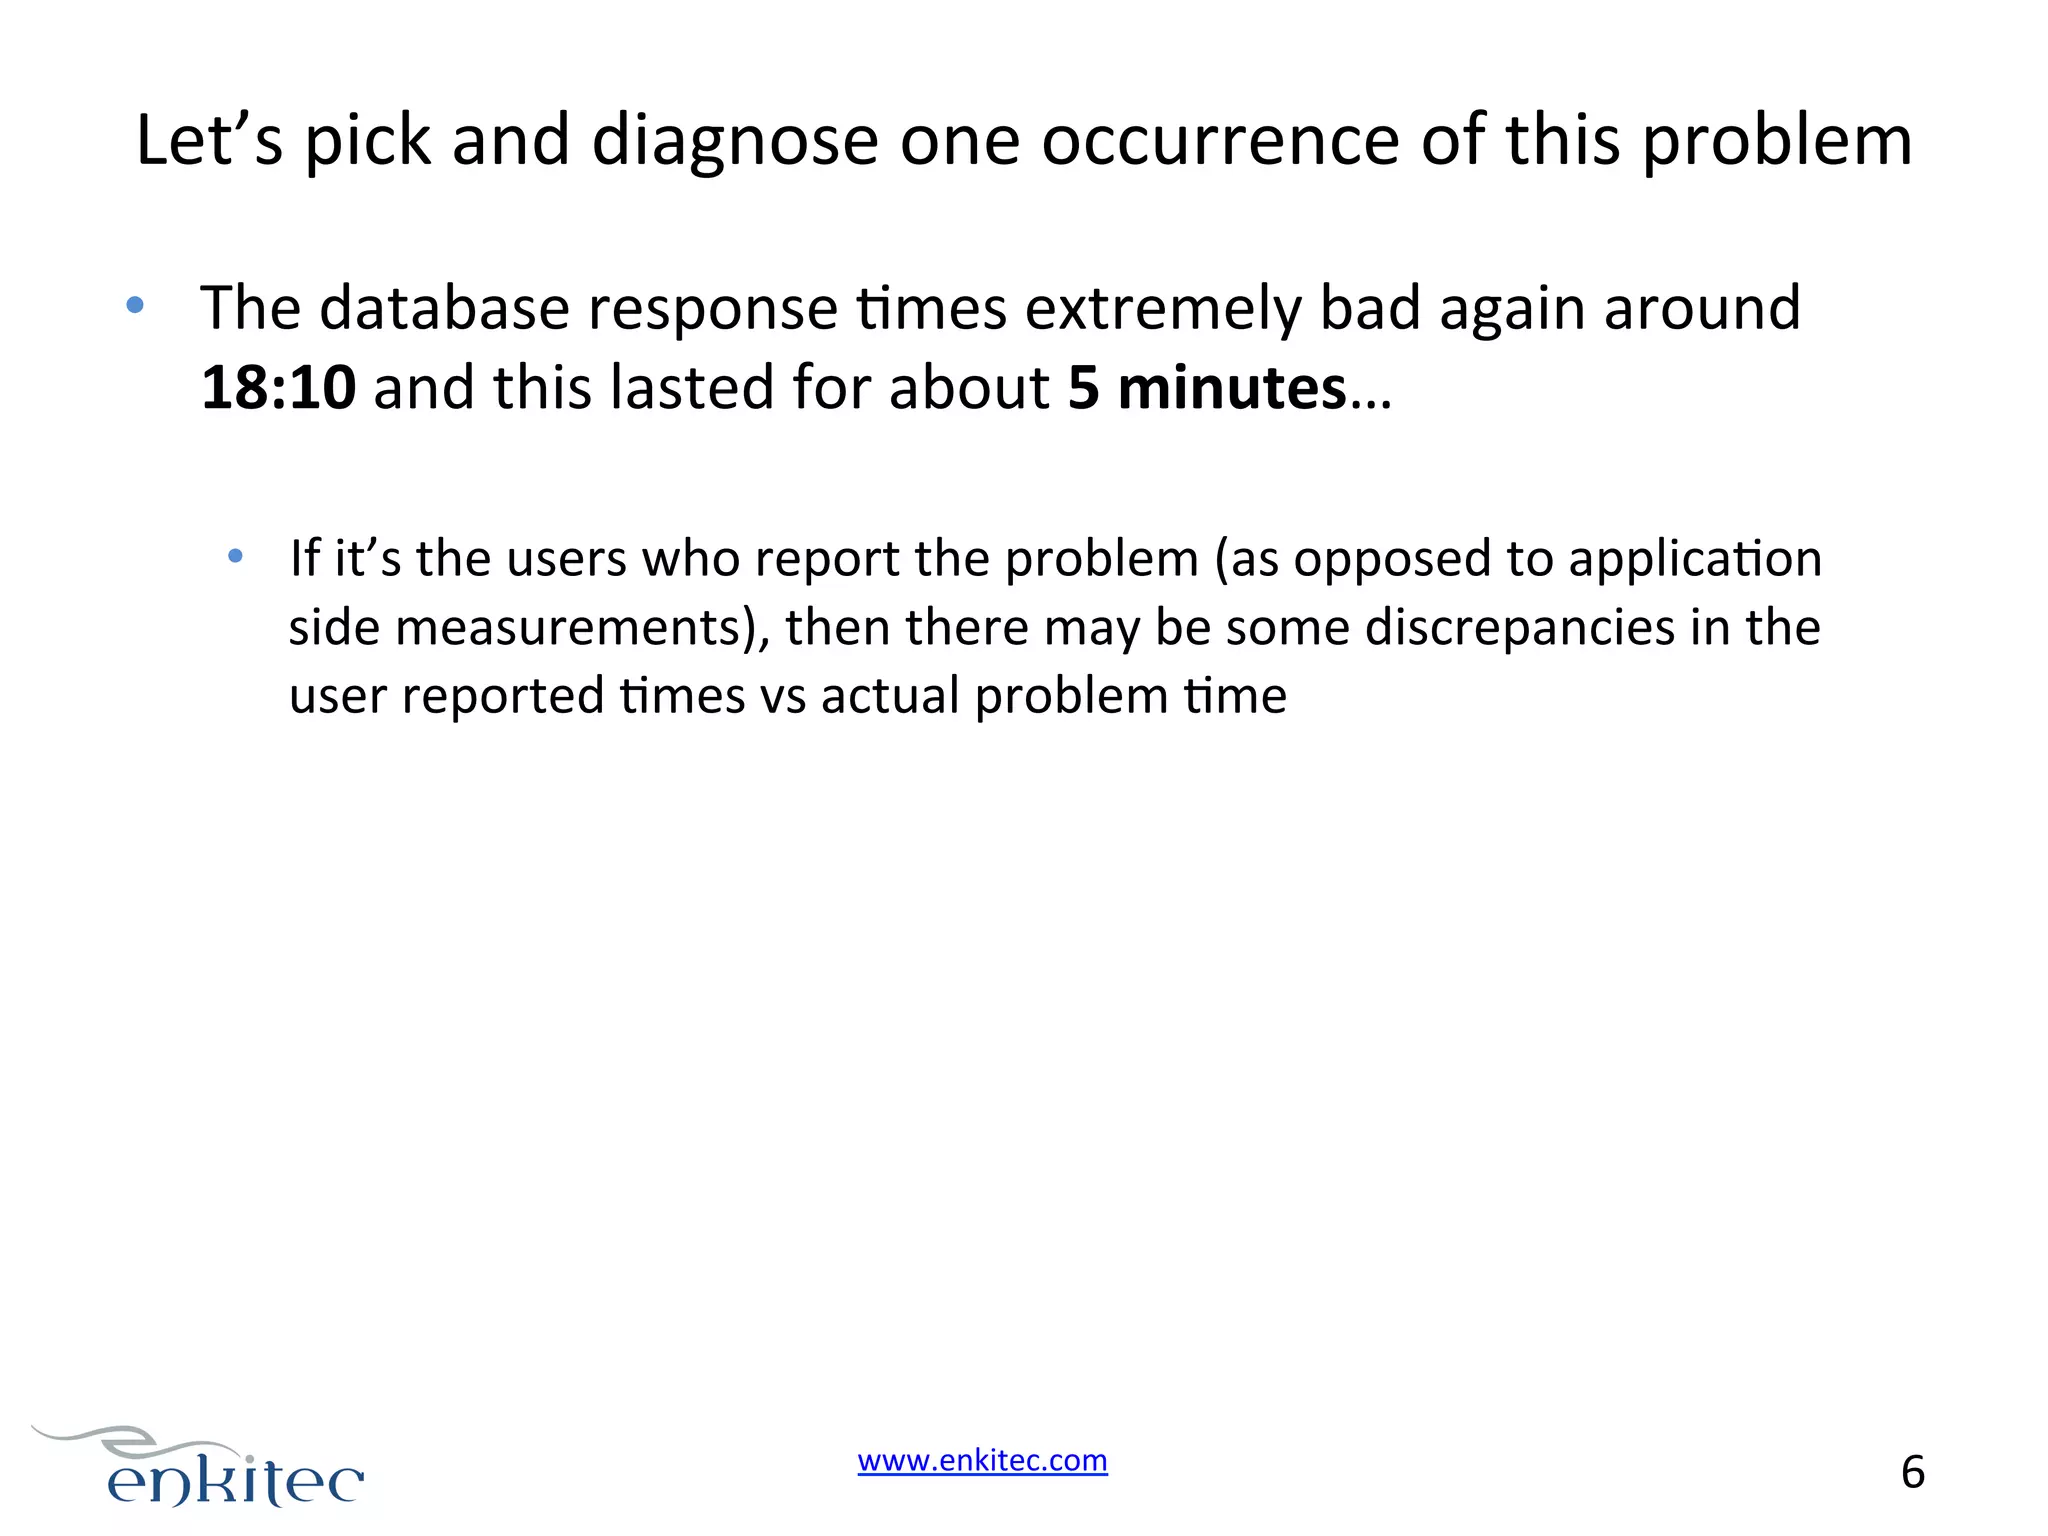
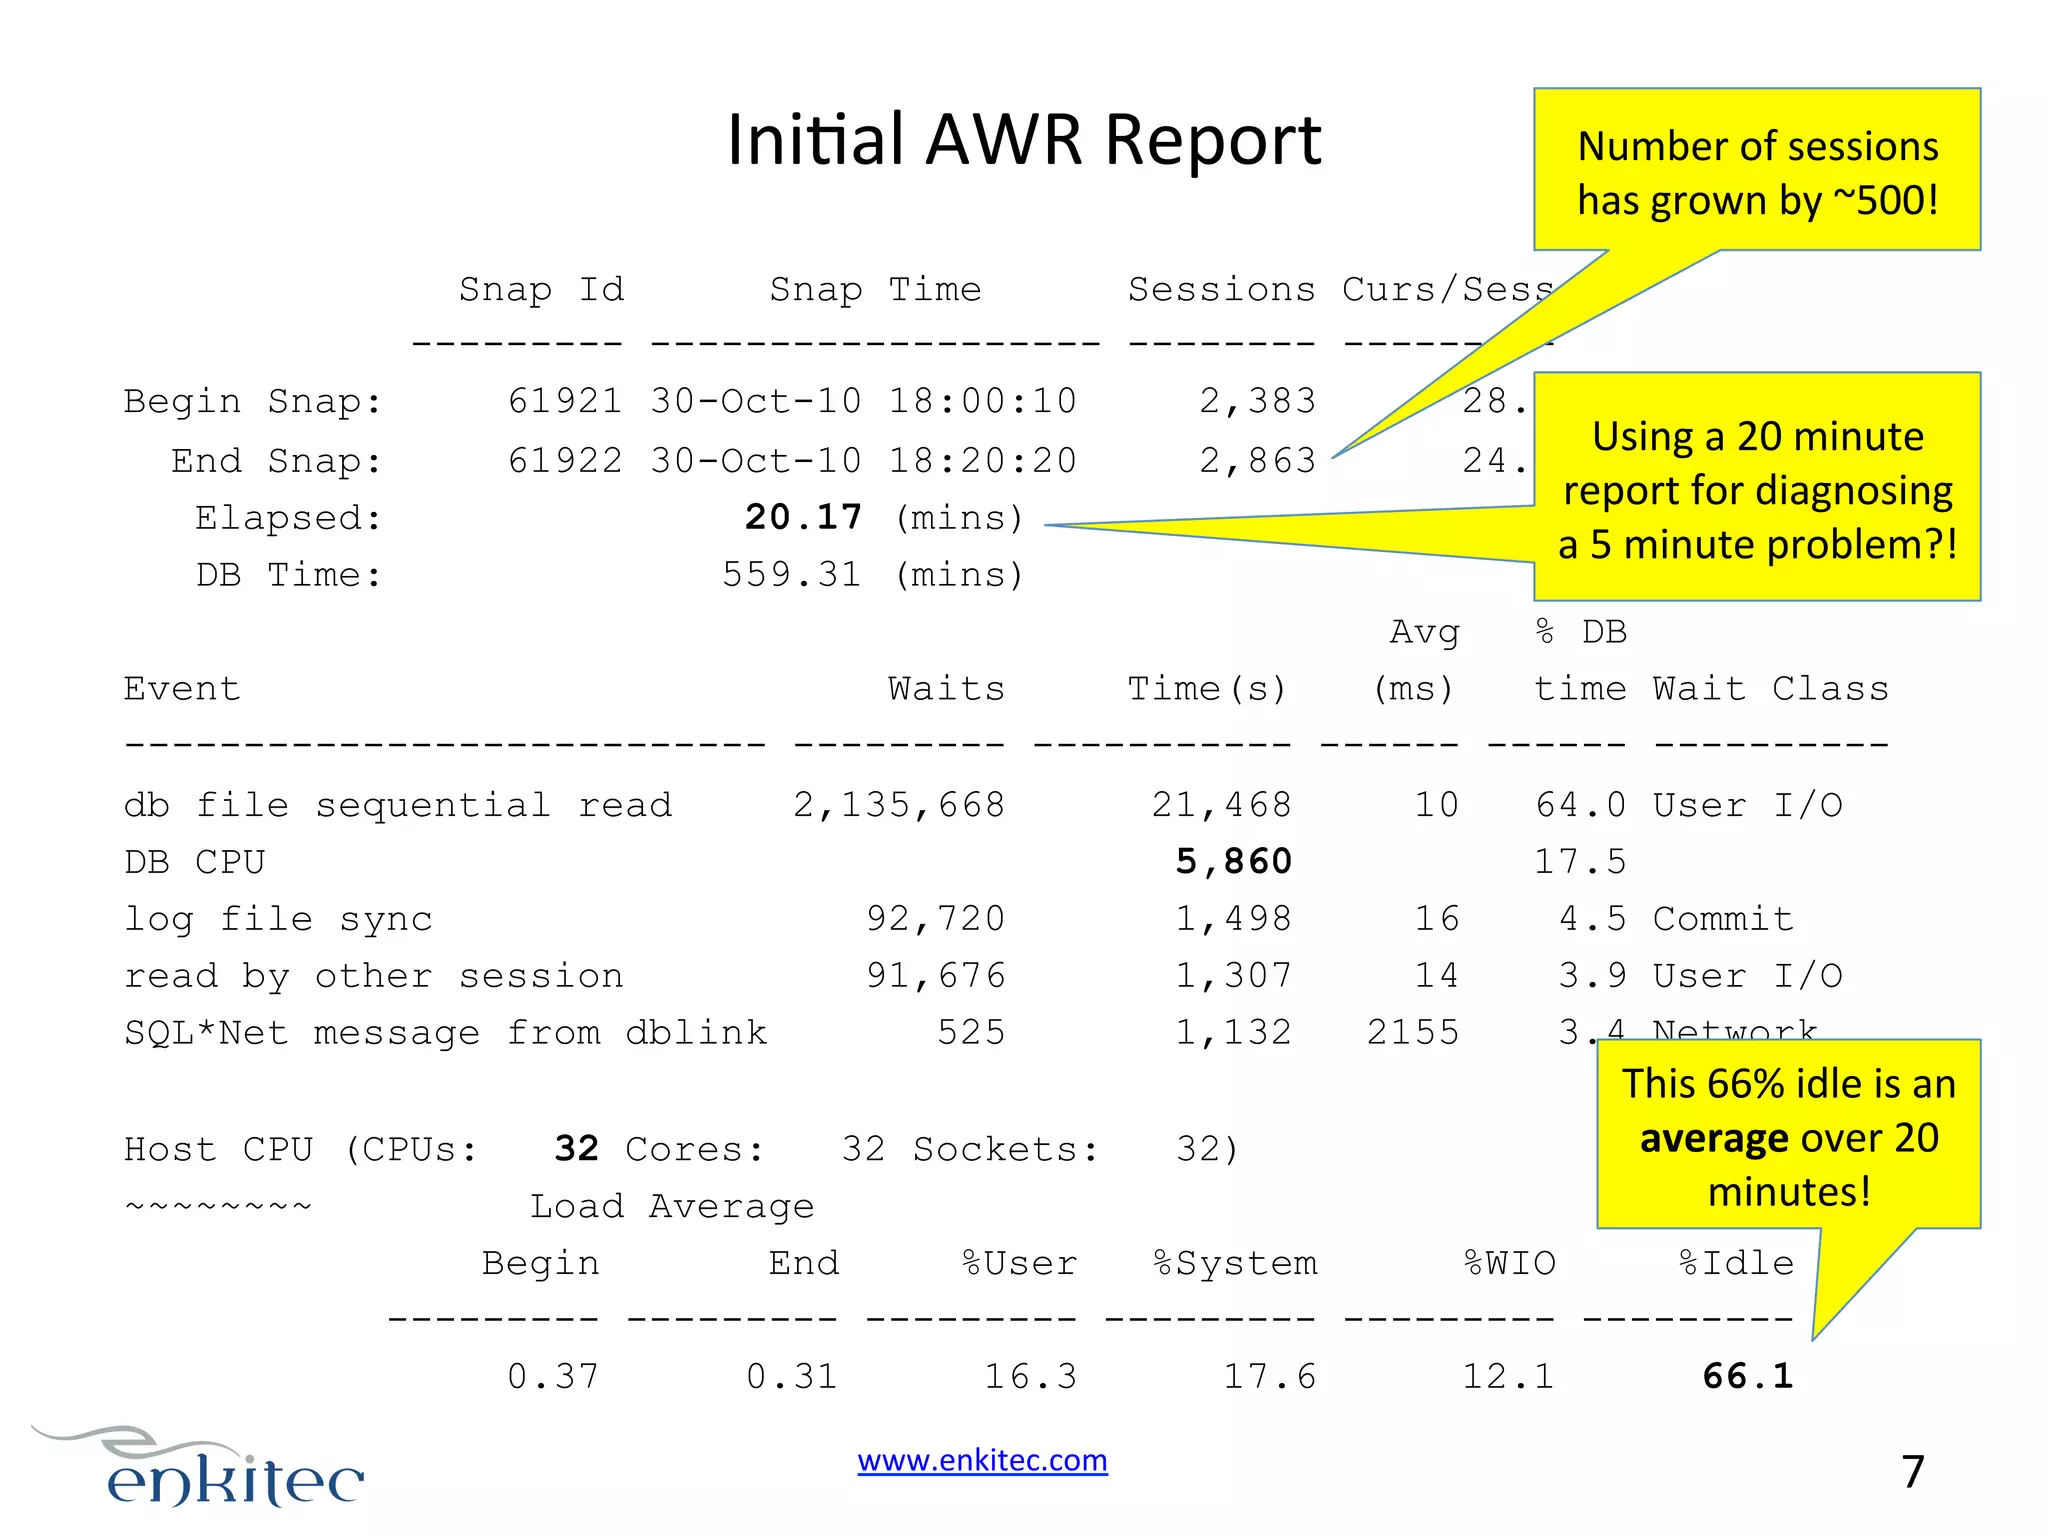
The document describes troubleshooting a complex performance issue in an Oracle database. Key details: - The problem was sporadic extreme slowness of the Oracle database and server lasting 1-20 minutes. - Initial AWR reports and OS metrics showed a spike at 18:10 with CPU usage at 66.89%, confirming a problem occurred then. - Further investigation using additional metrics was needed to fully understand the root cause, as initial diagnostics did not provide enough context about this brief problem period.
Presentation by Tanel Poder on complex performance issues; speaker's background in Oracle, Exadata, and Hadoop.
Two main issues highlighted: cursor pinning and sporadic CPU spikes; recent performance slowness affecting database responses.
Diagnostic focus on a database response time spike; initial AWR report indicates a significant increase in sessions during slowness.OS metrics show CPU usage spikes; diagnosing kernel mode CPU usage during database slowdowns.
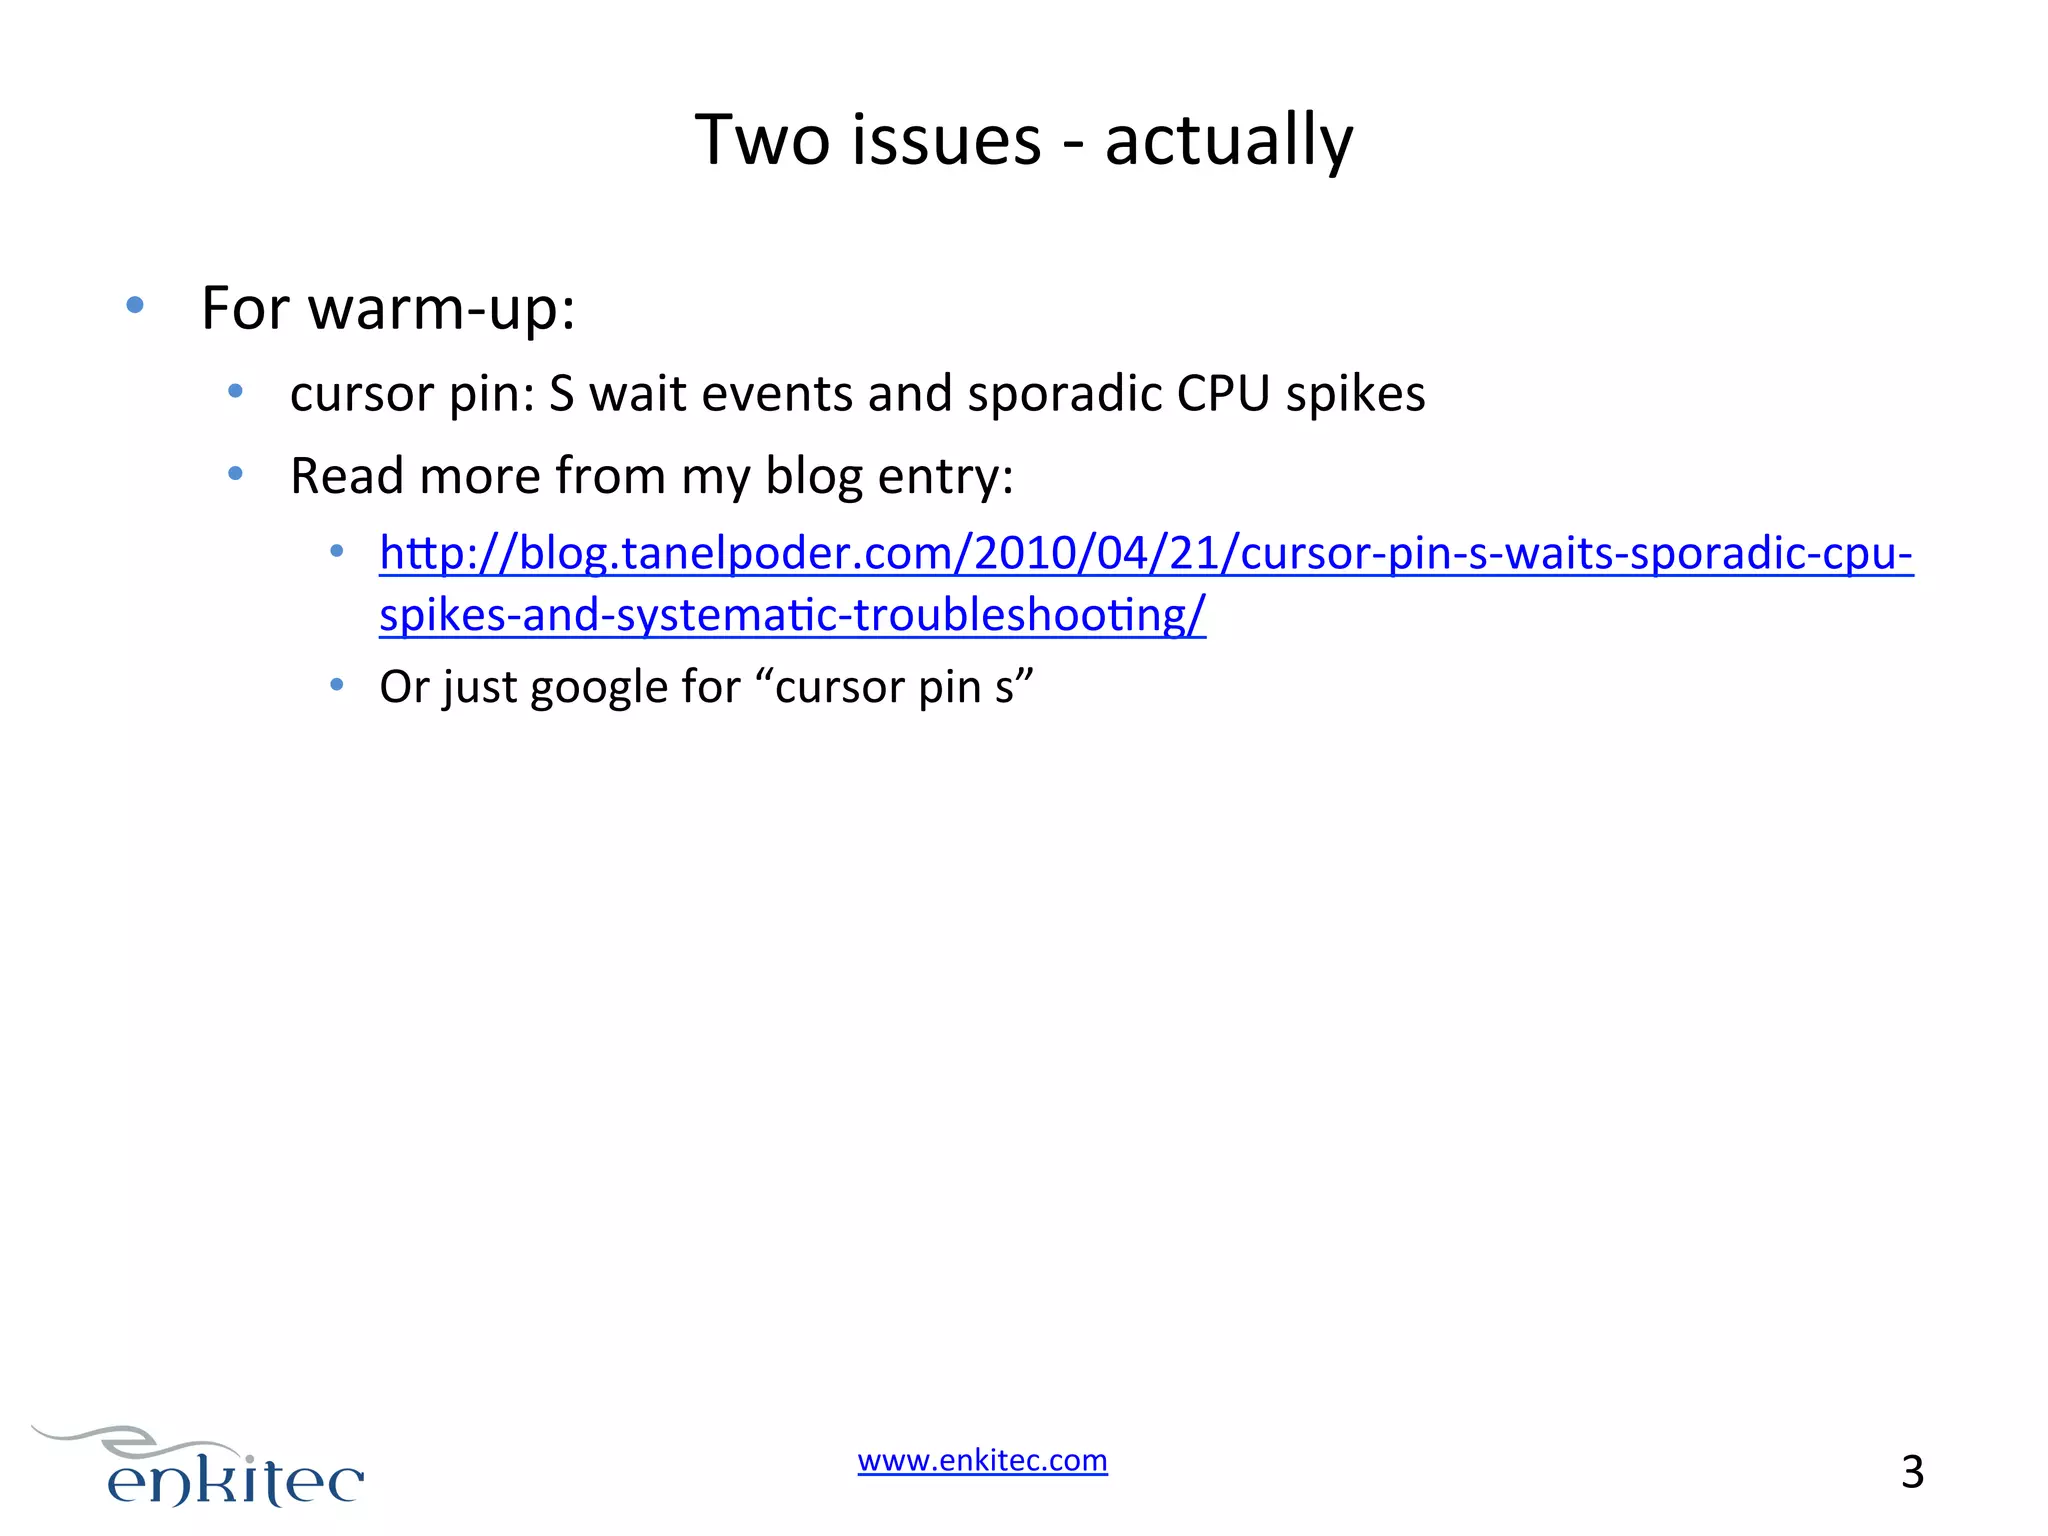
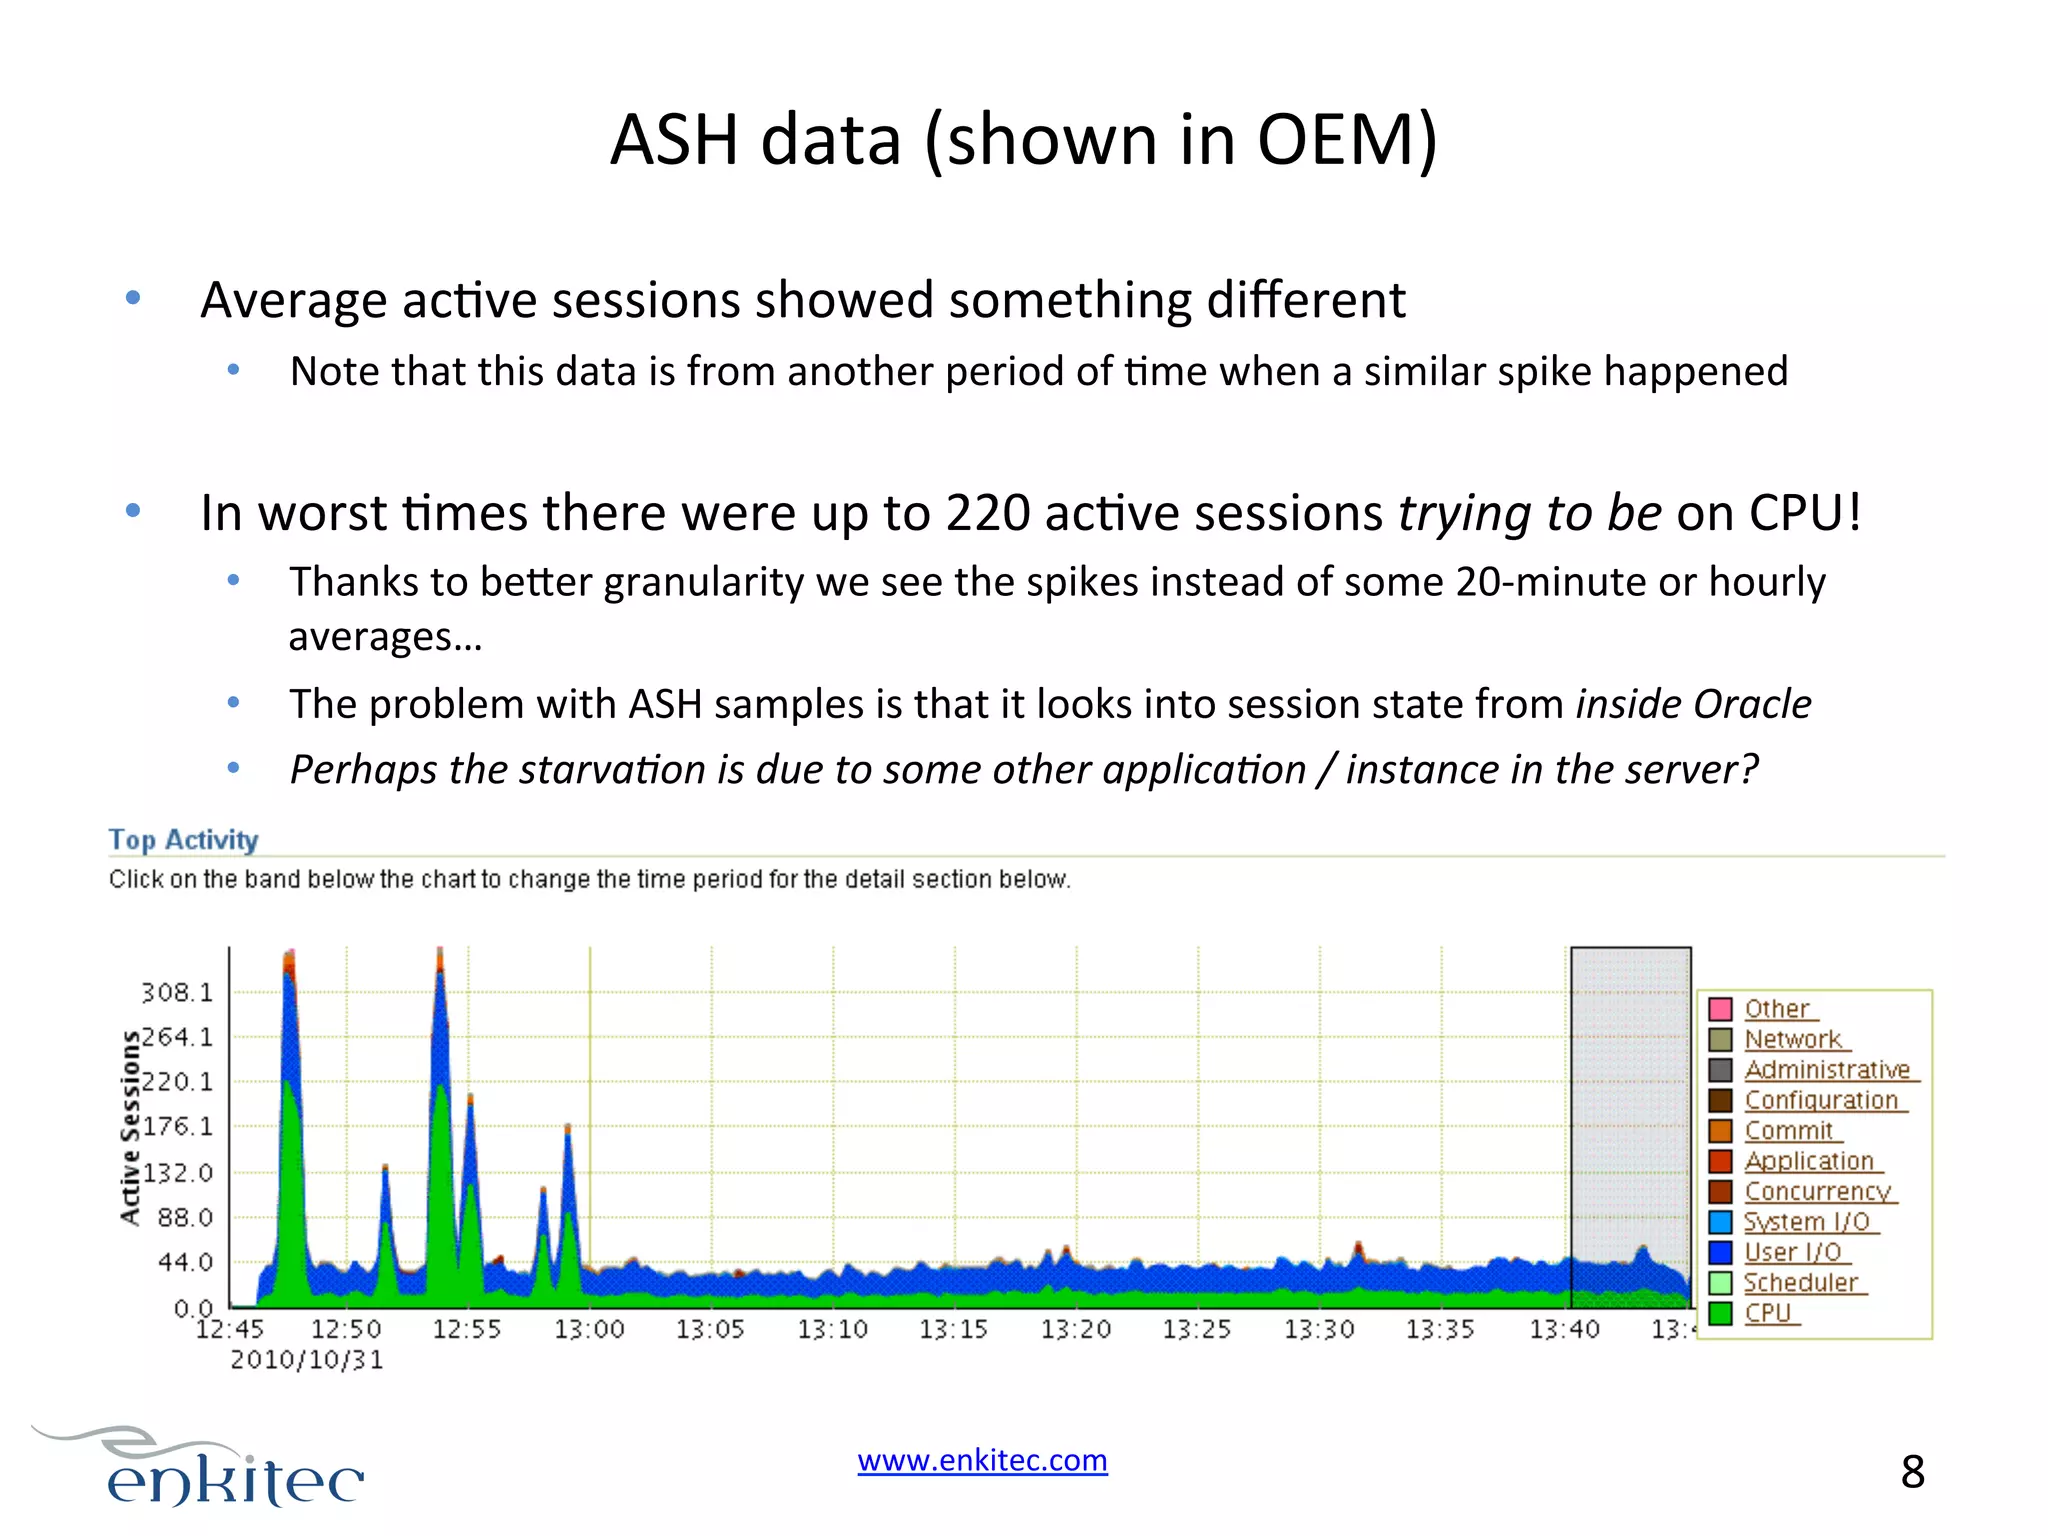
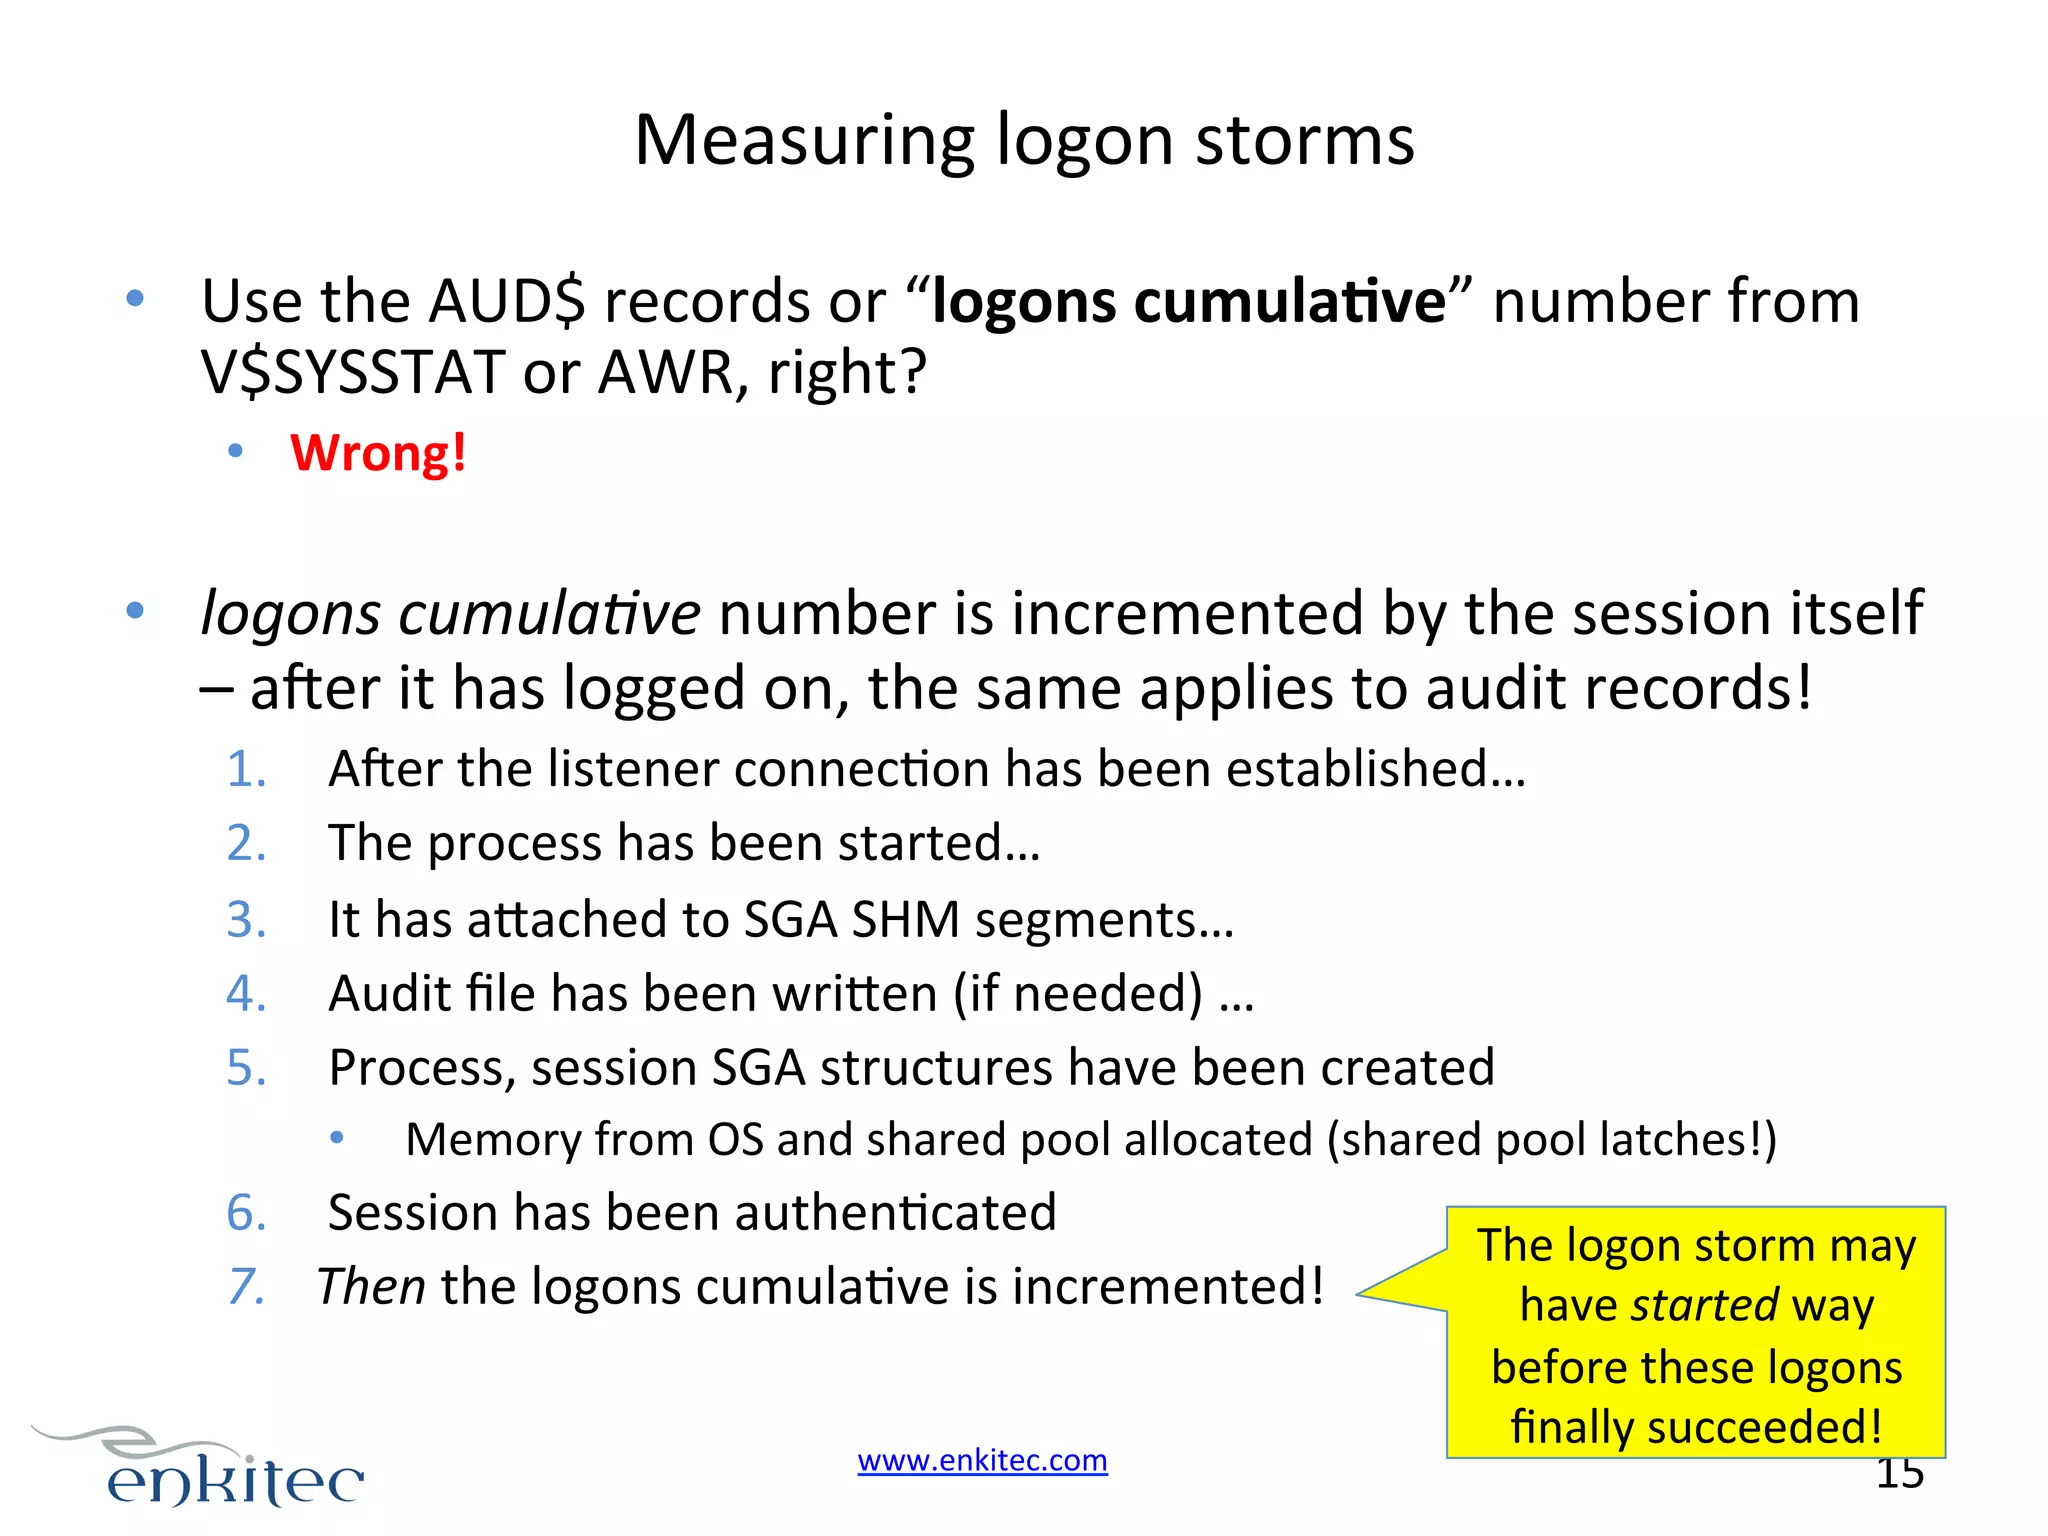
Diagnosing high kernel mode usage; usual suspects include logon storms, application loops, and OS spinlock contentions.
Challenges measuring logon storms; importance of listener logs and the impact on system performance.
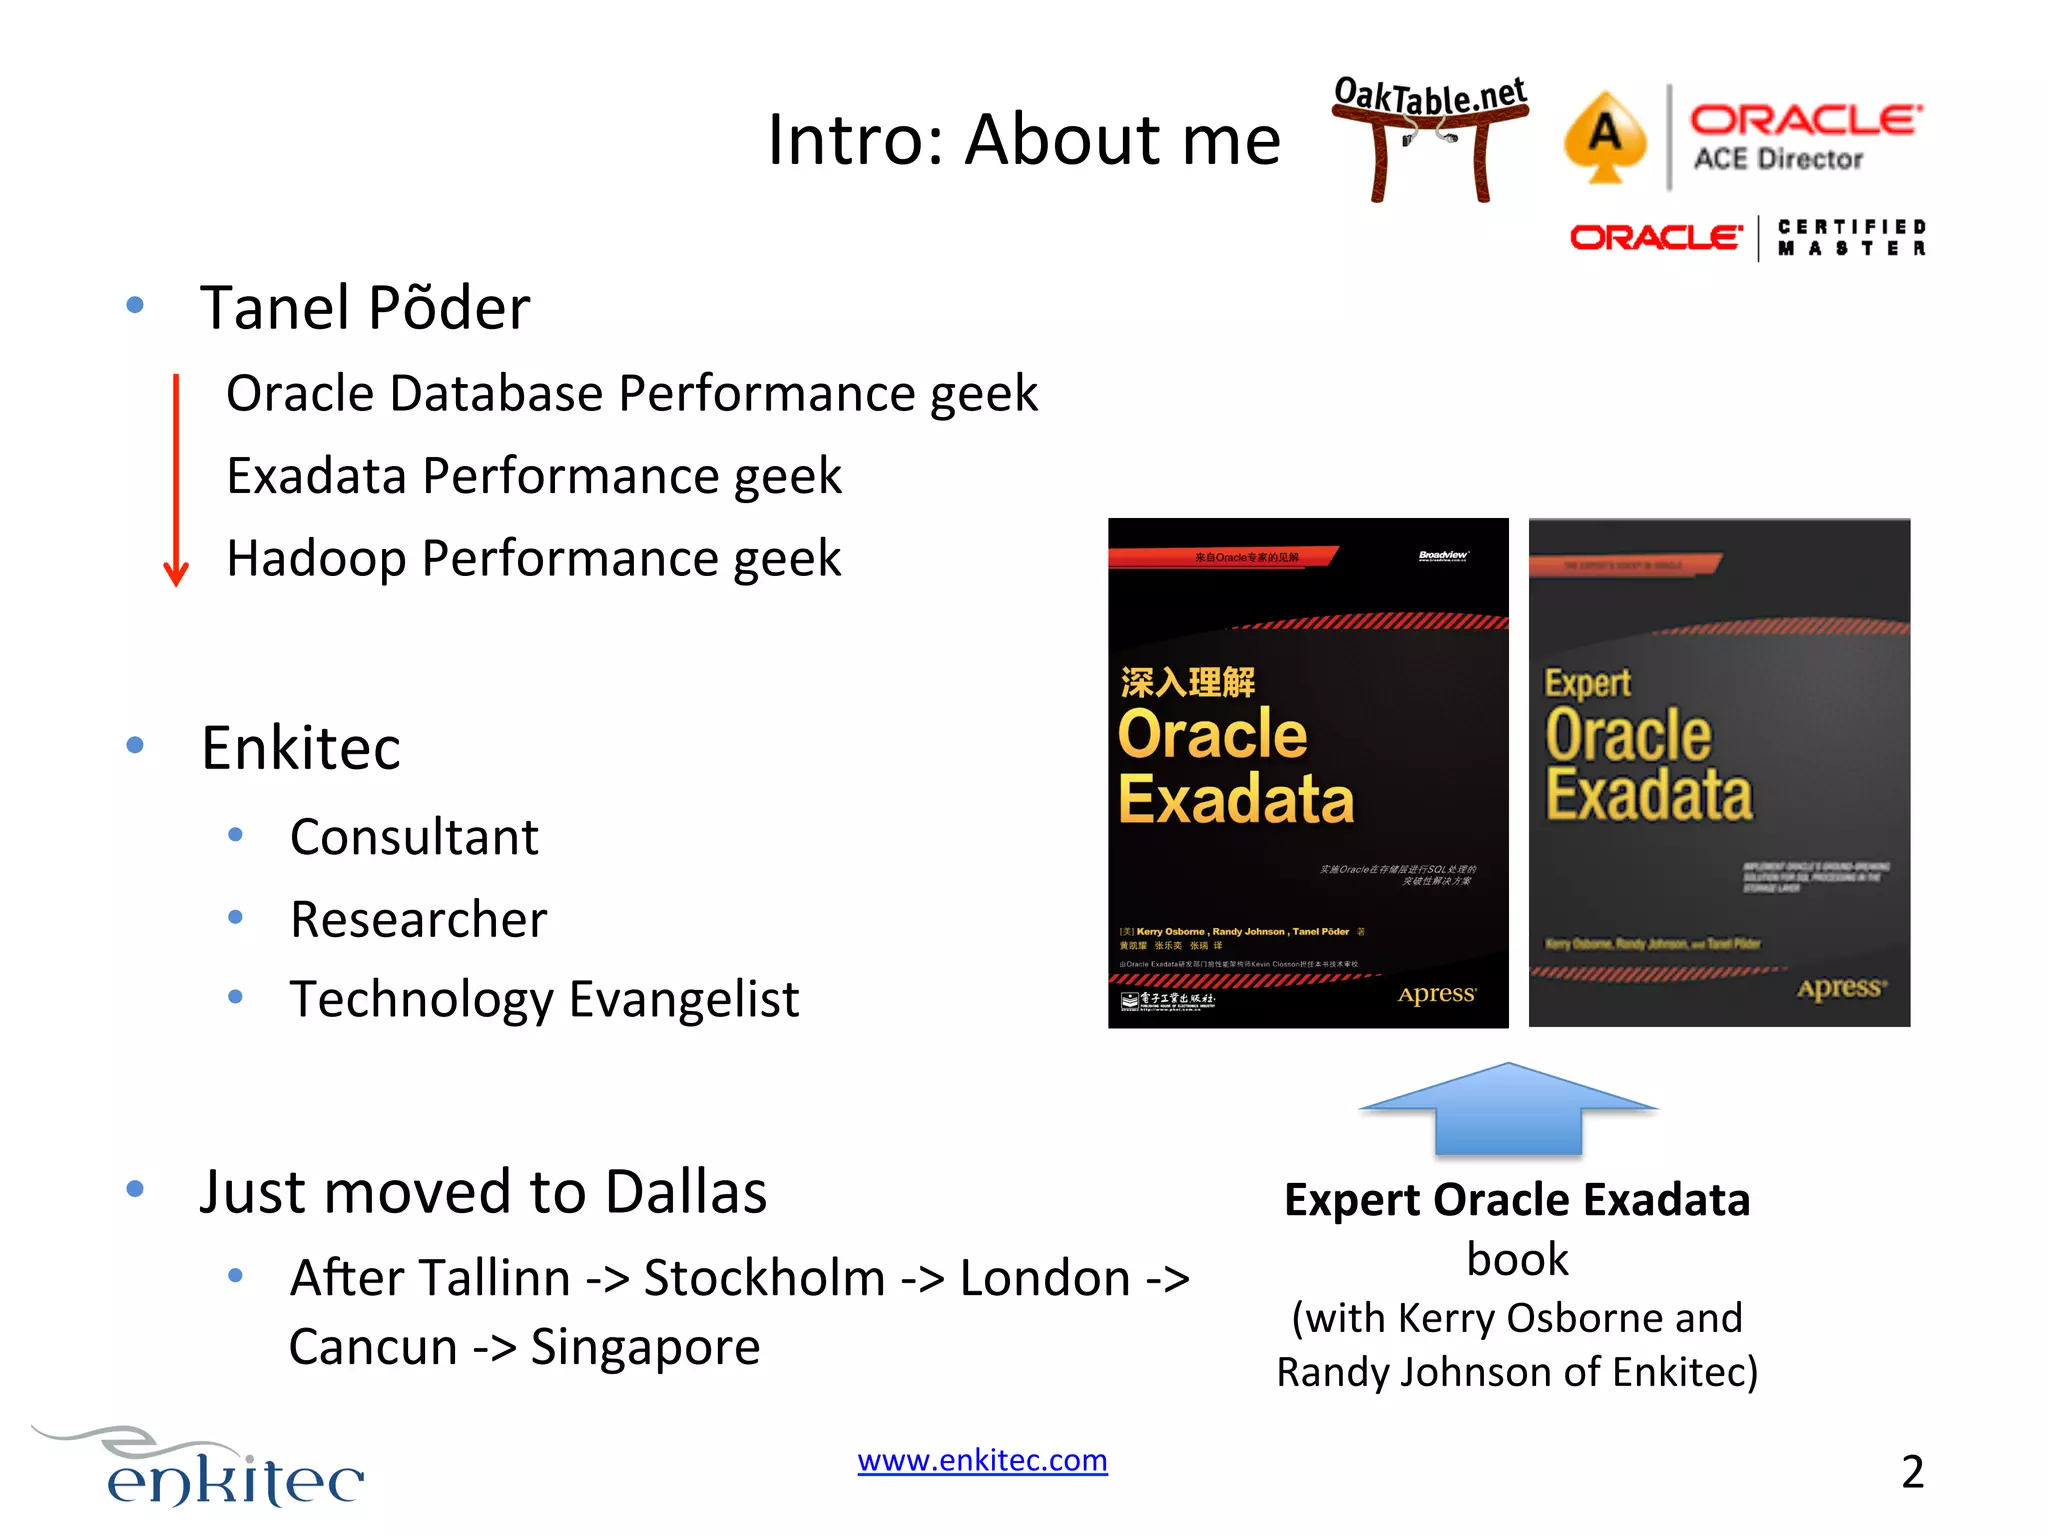
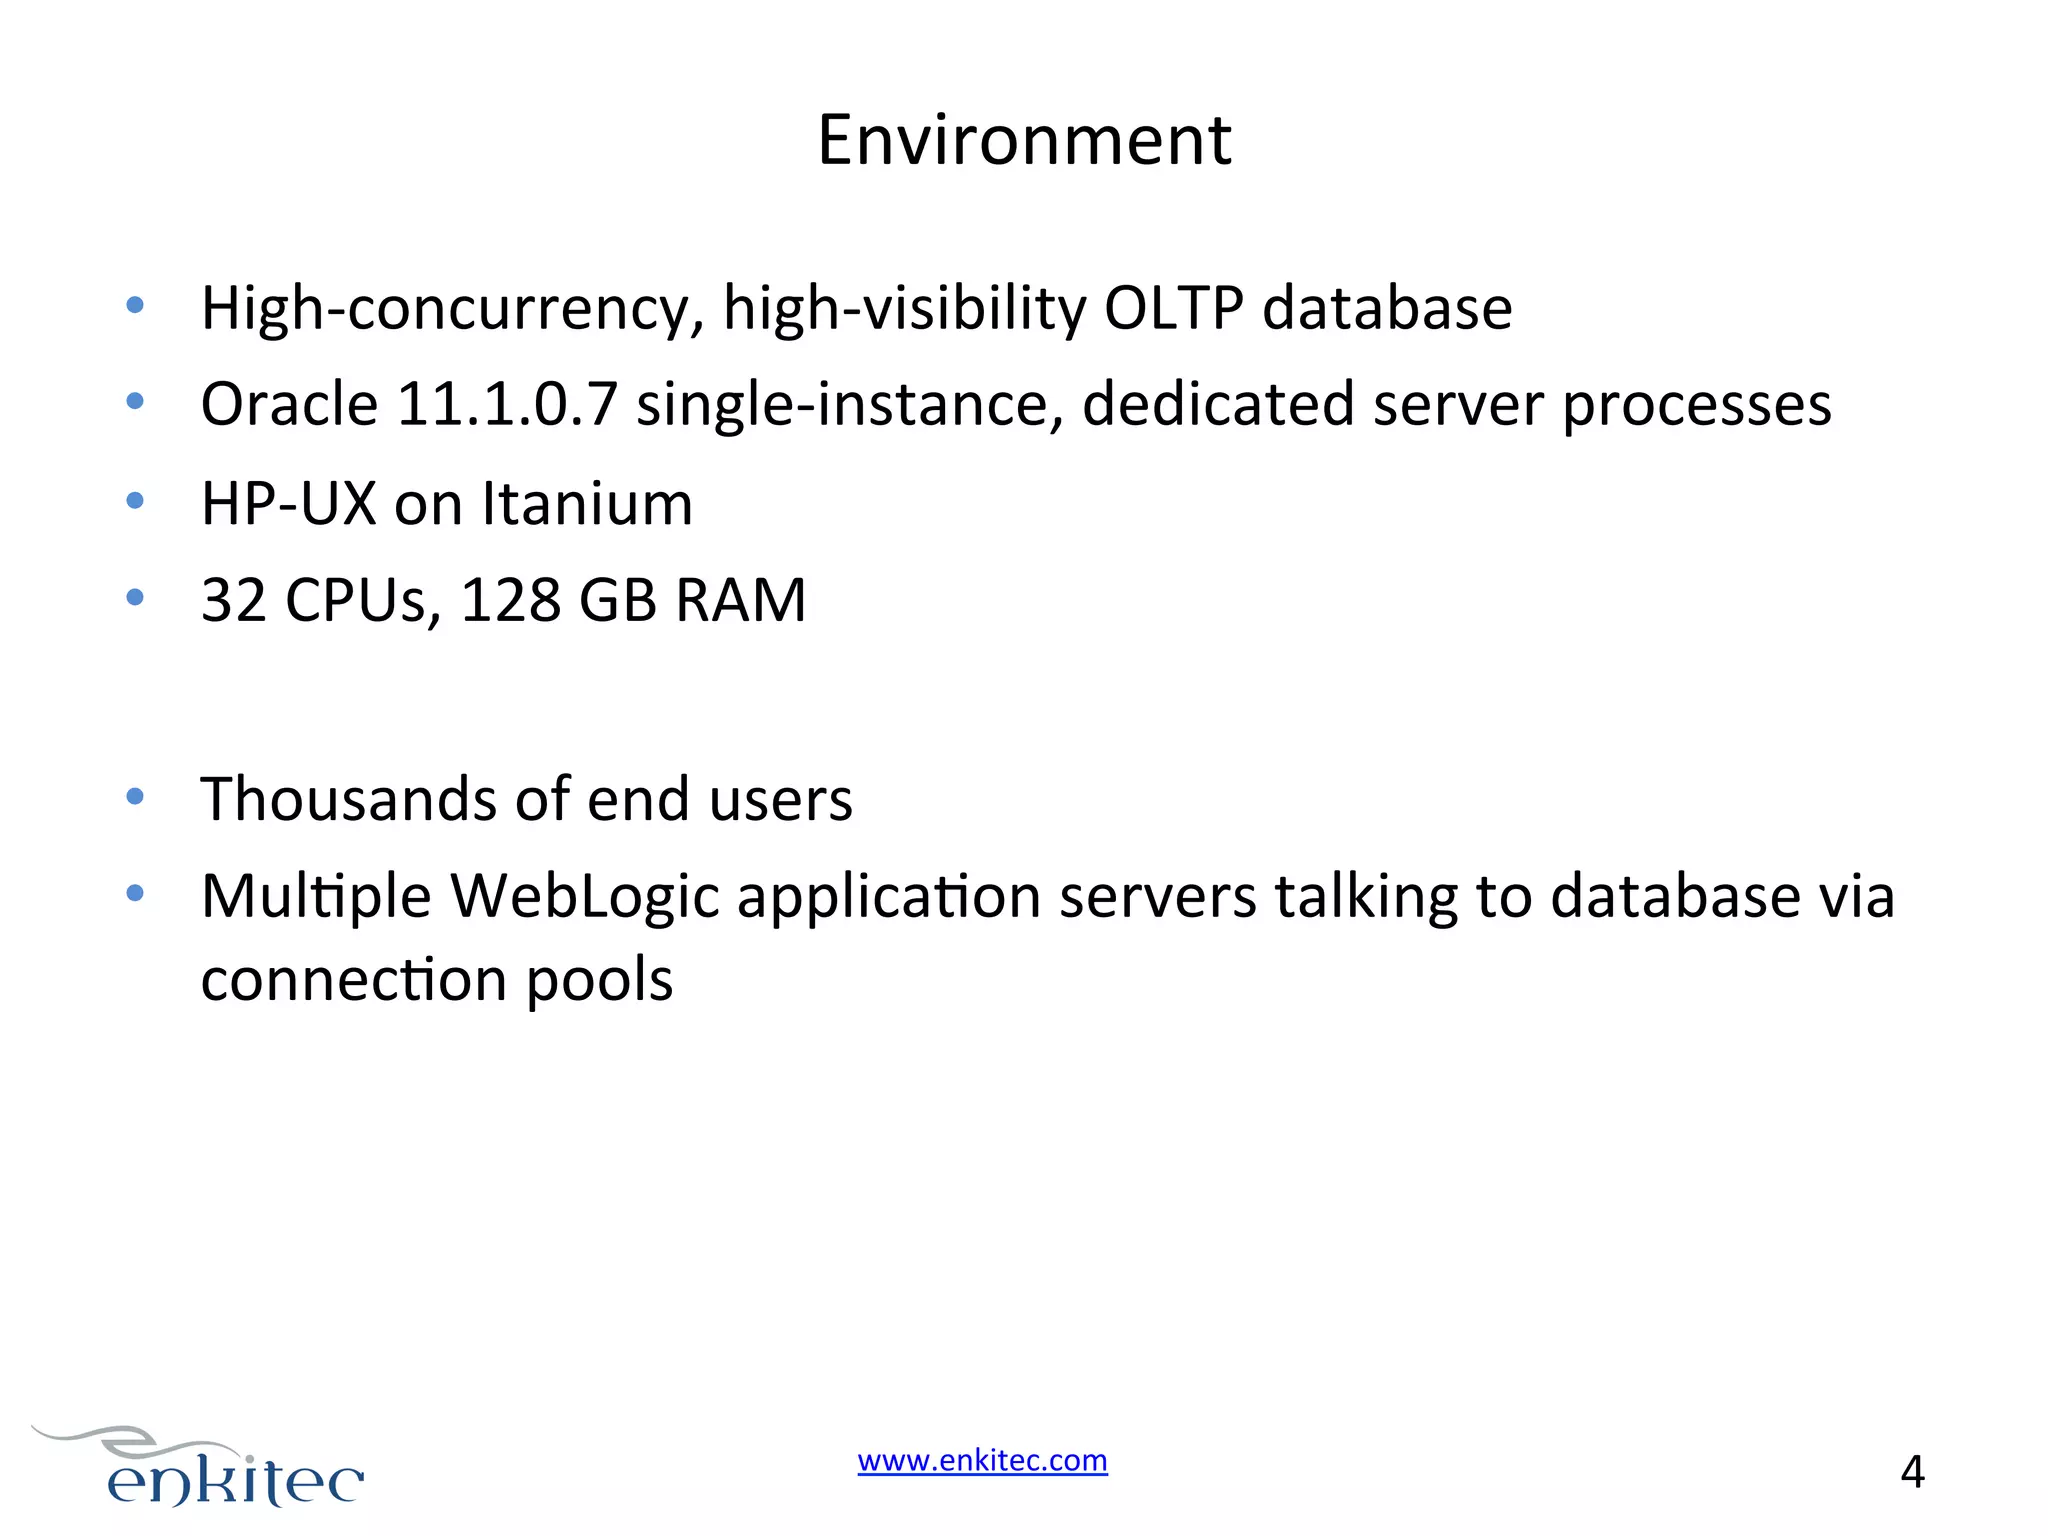
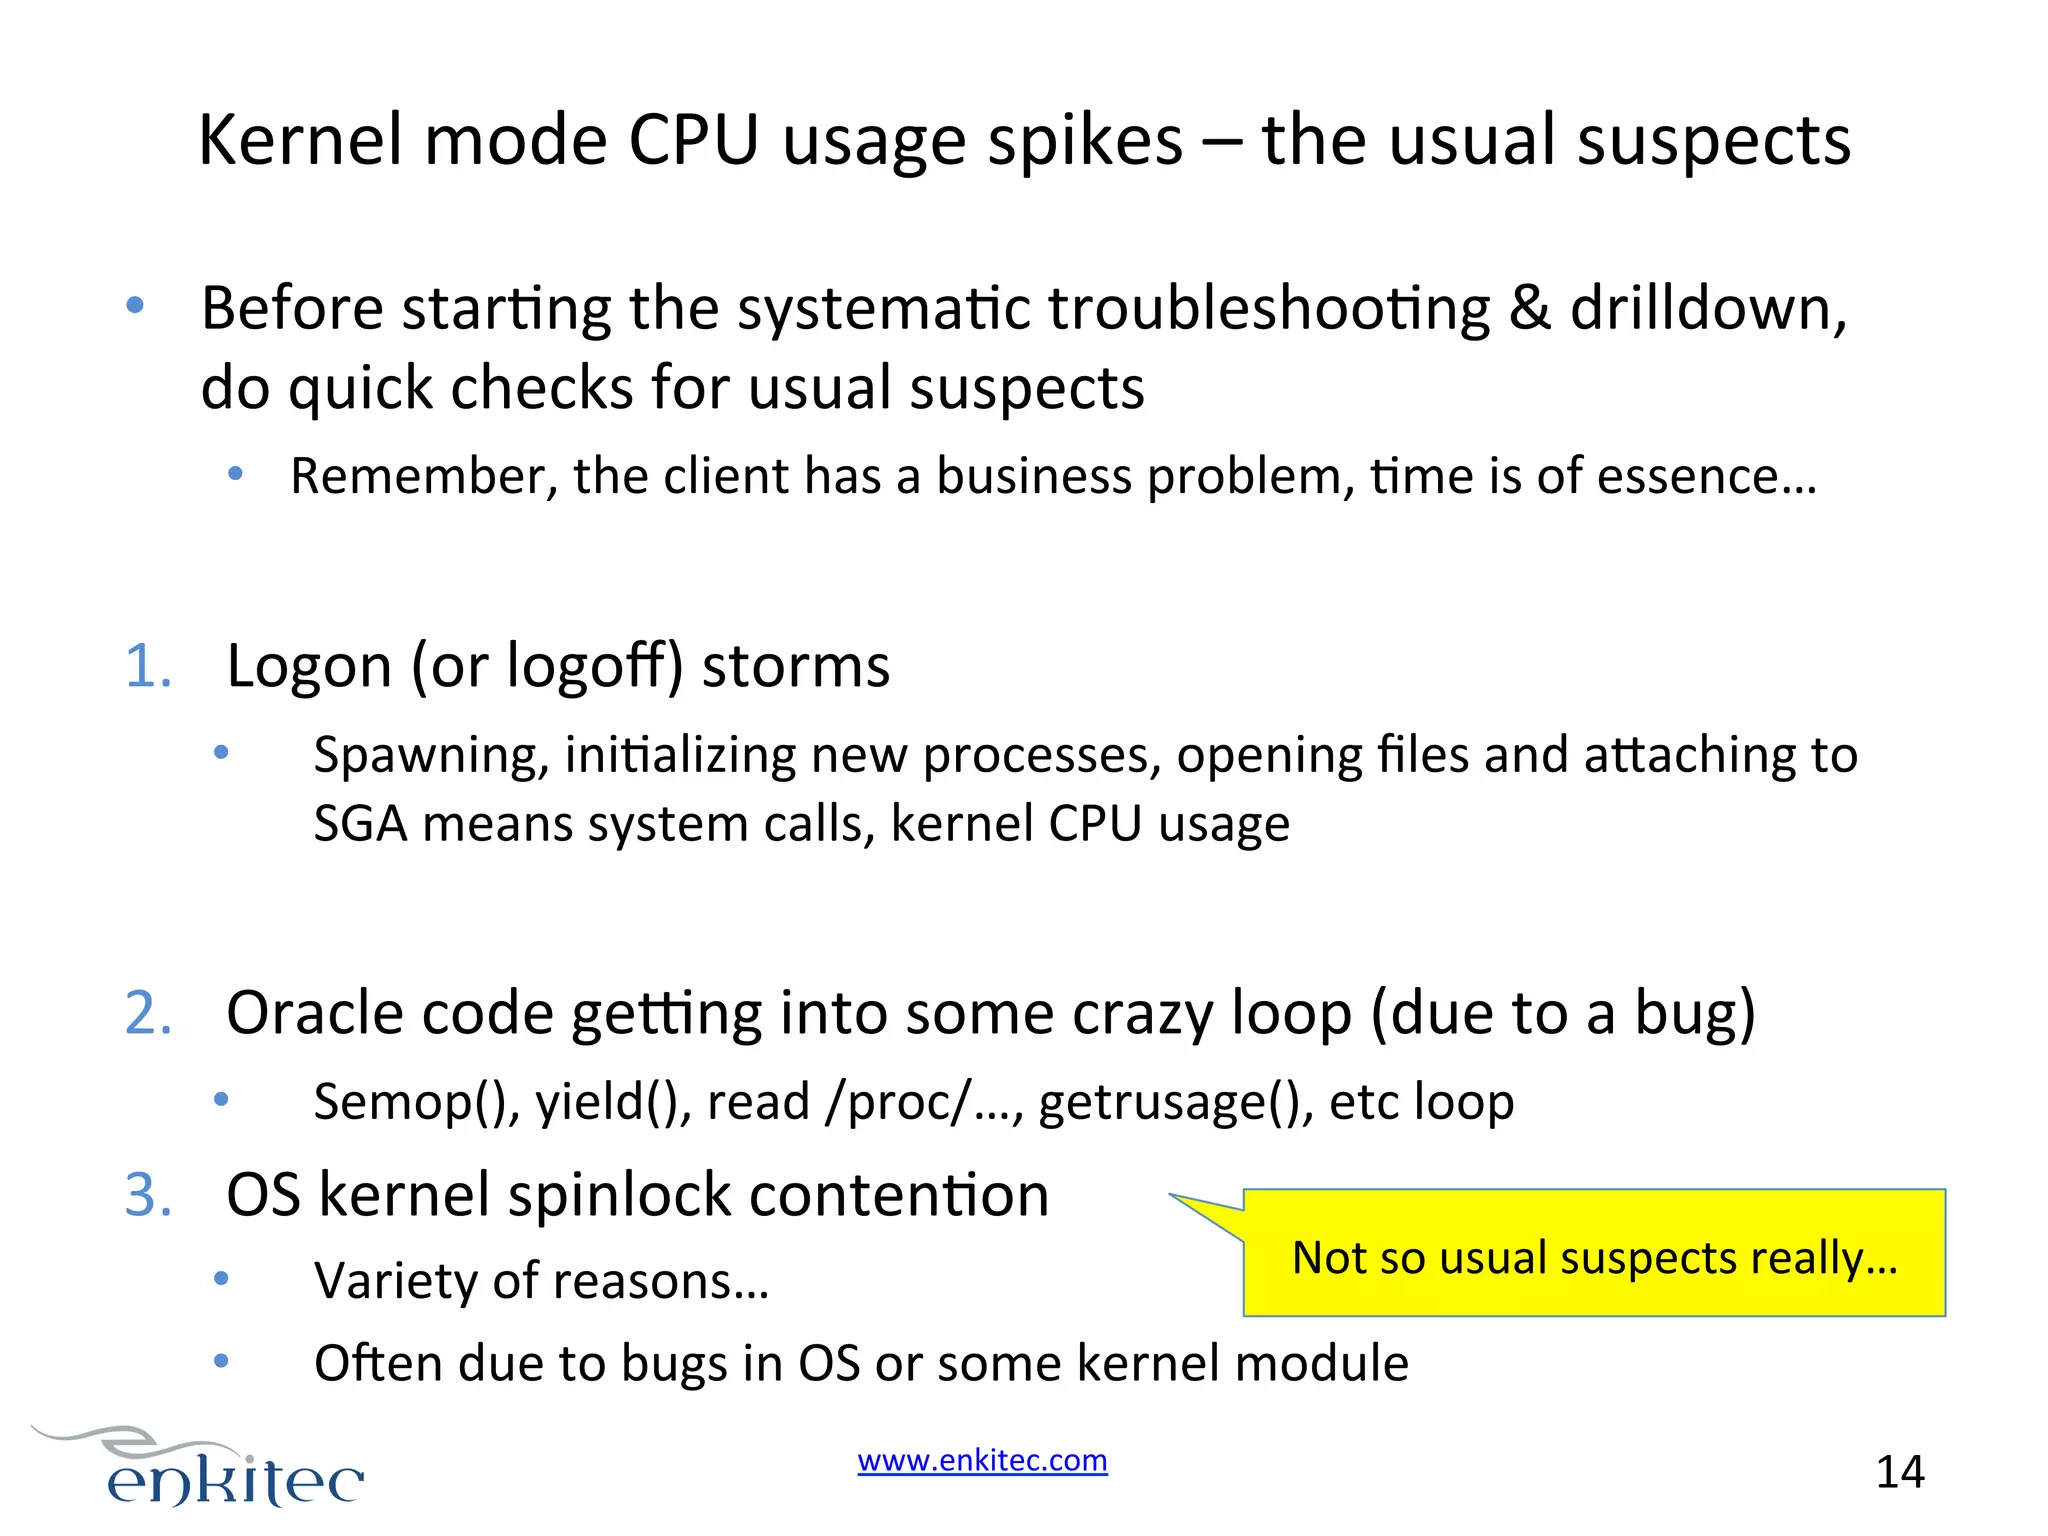
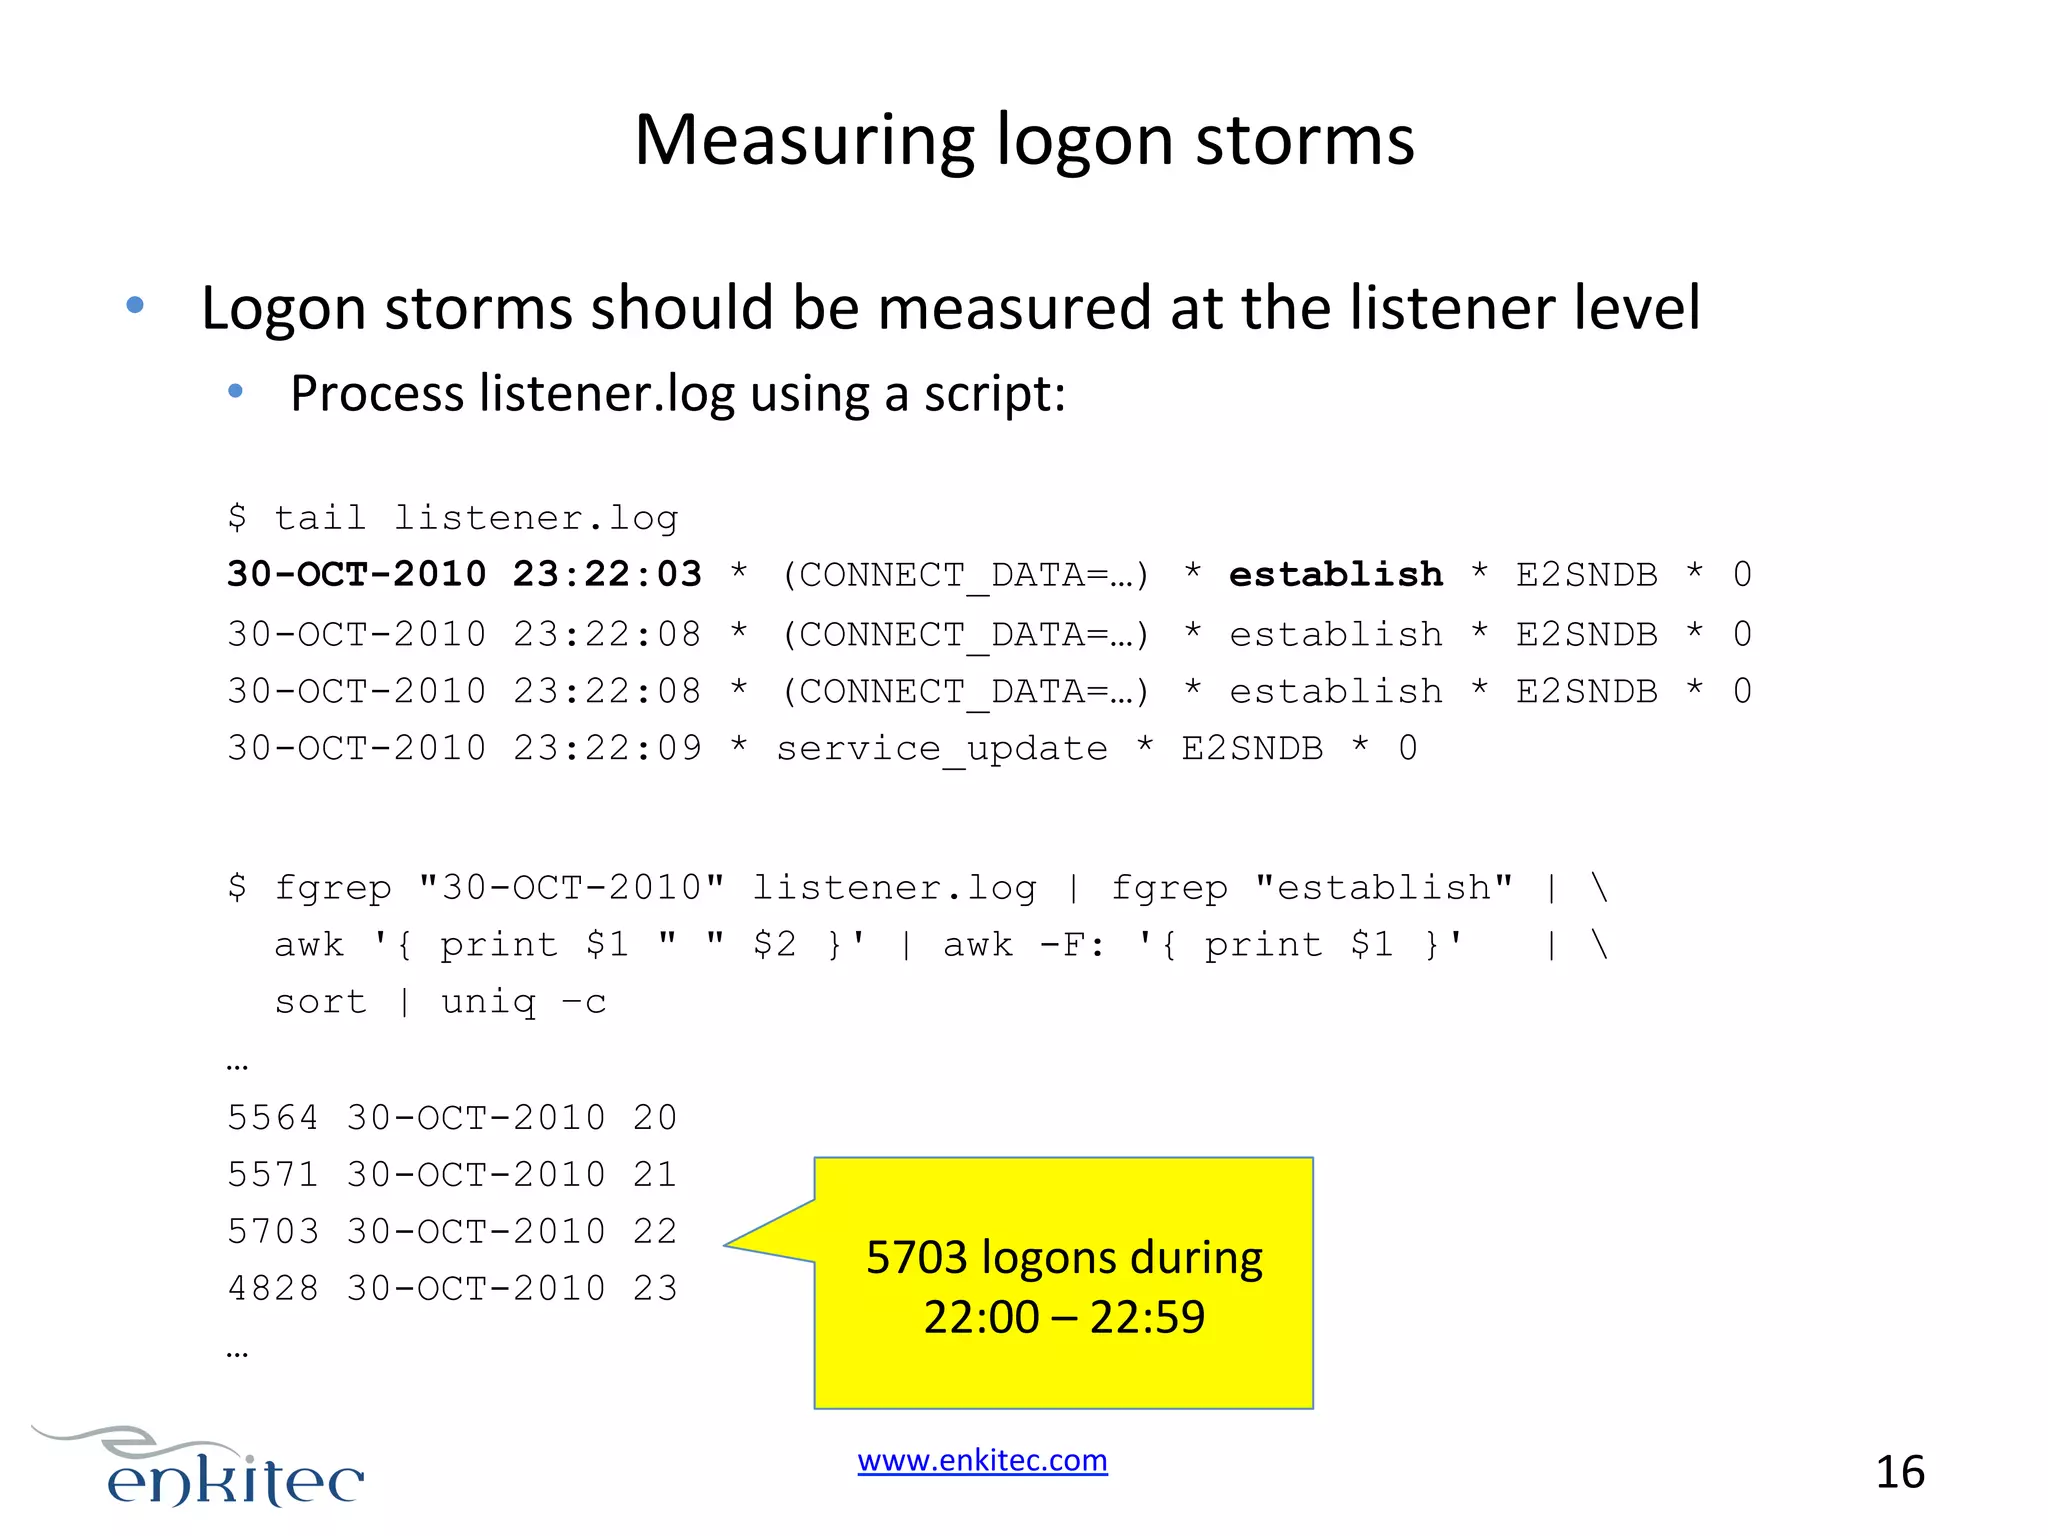
Detailed tracing of system calls revealing open syscall delays; suggestions to use HP-UX tools for better monitoring.
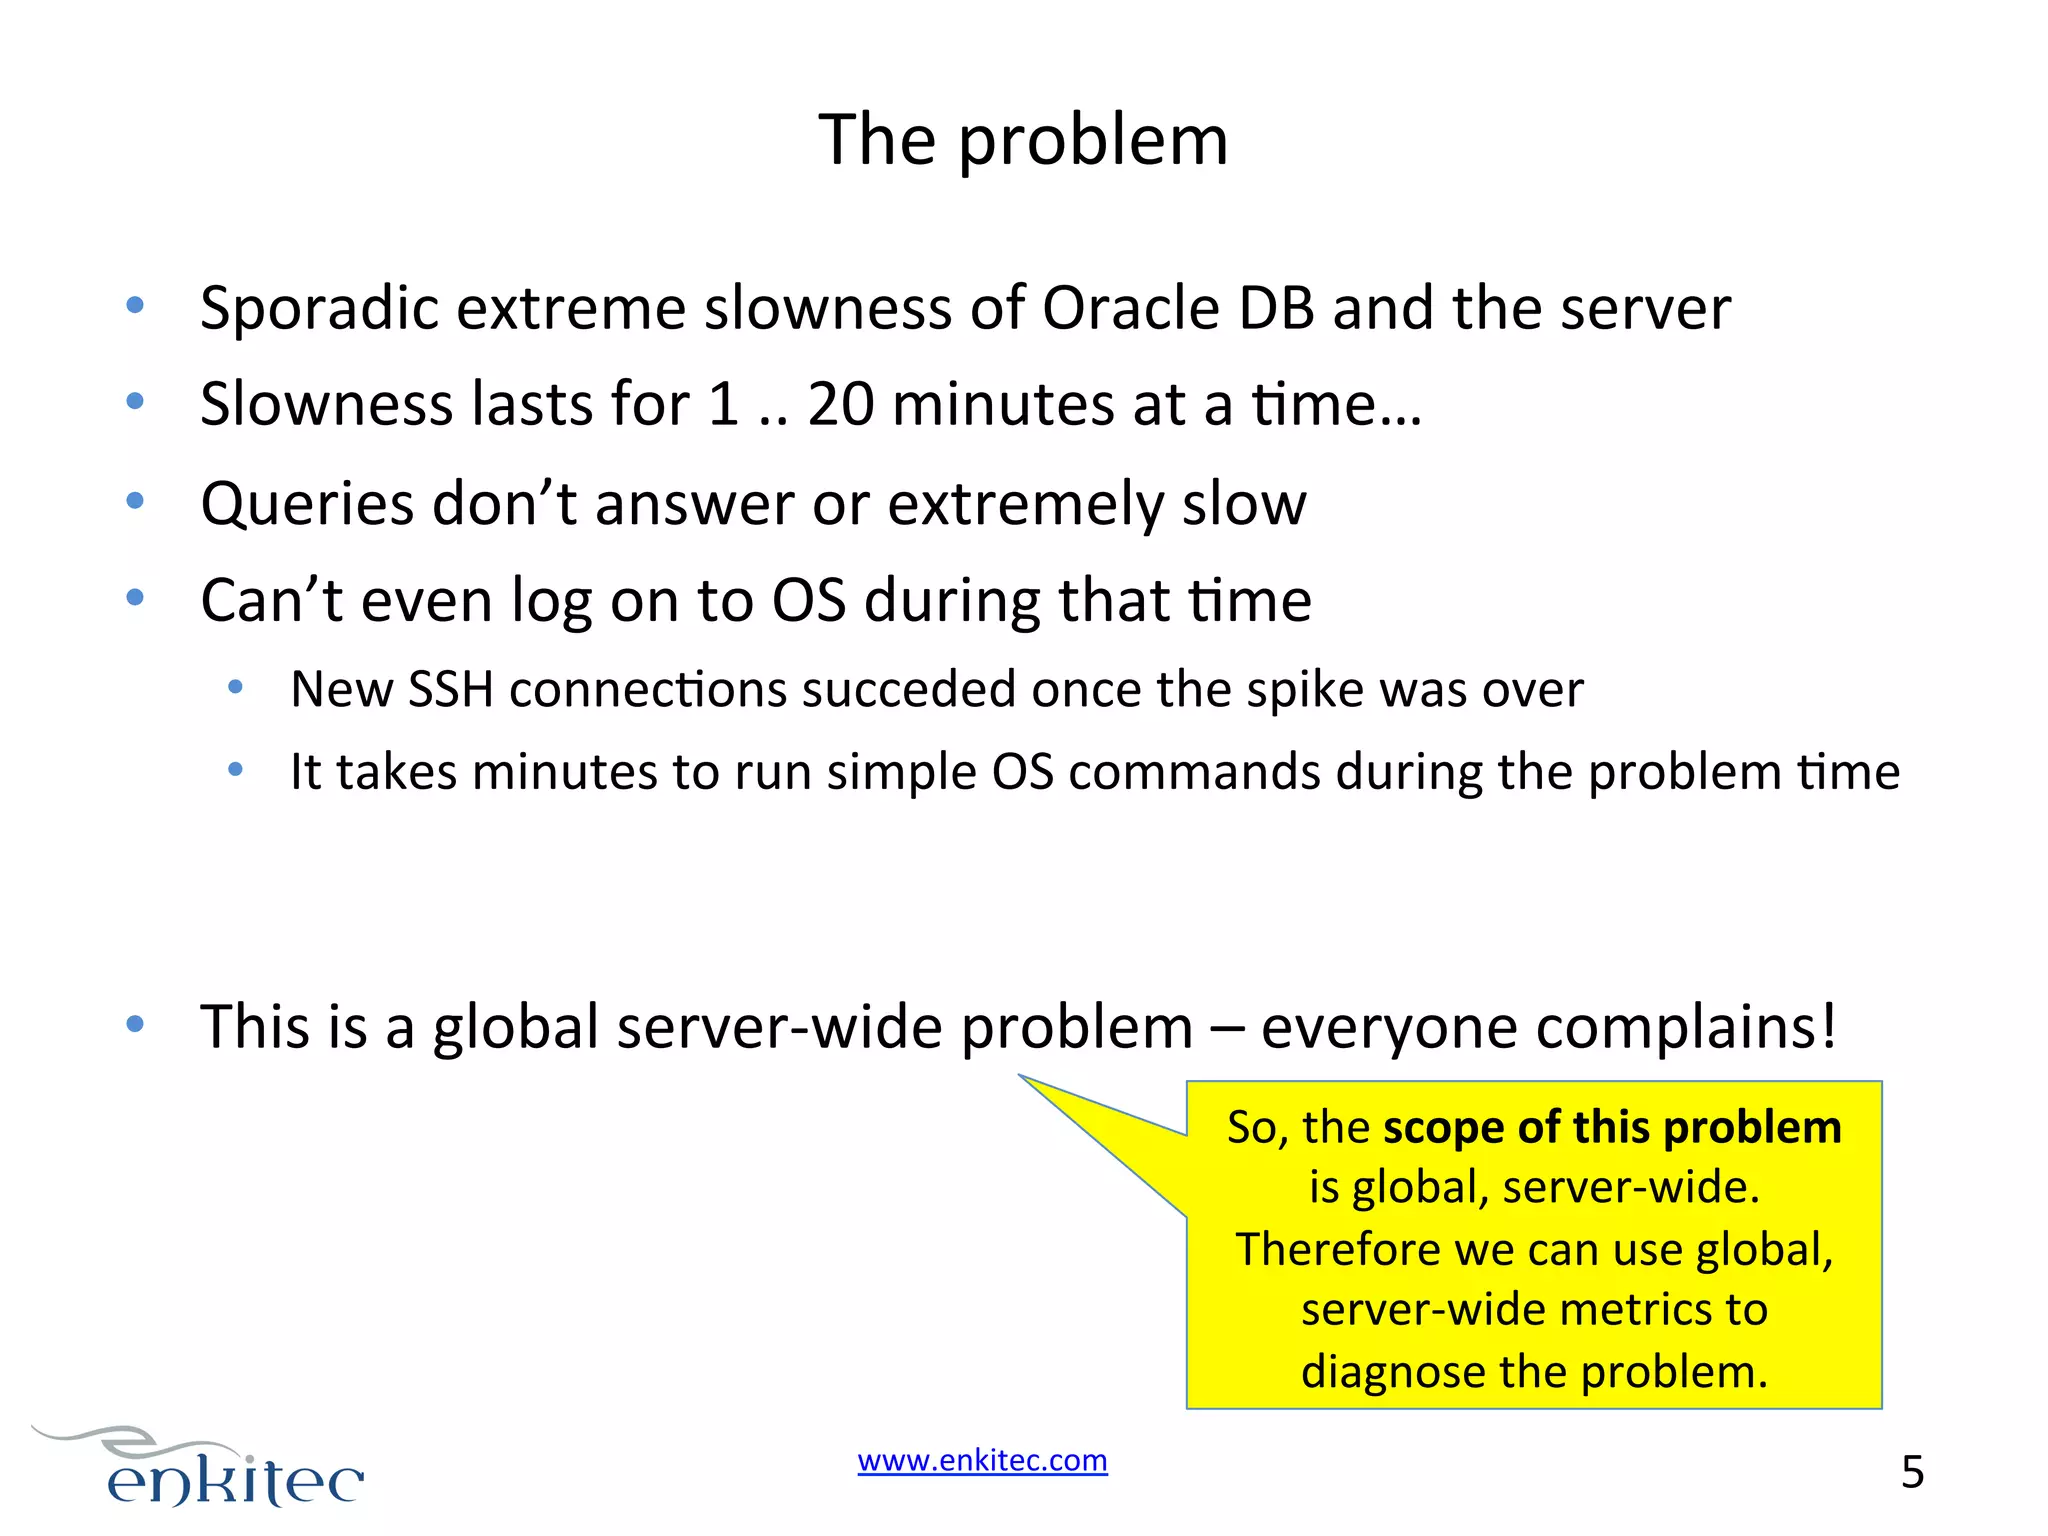
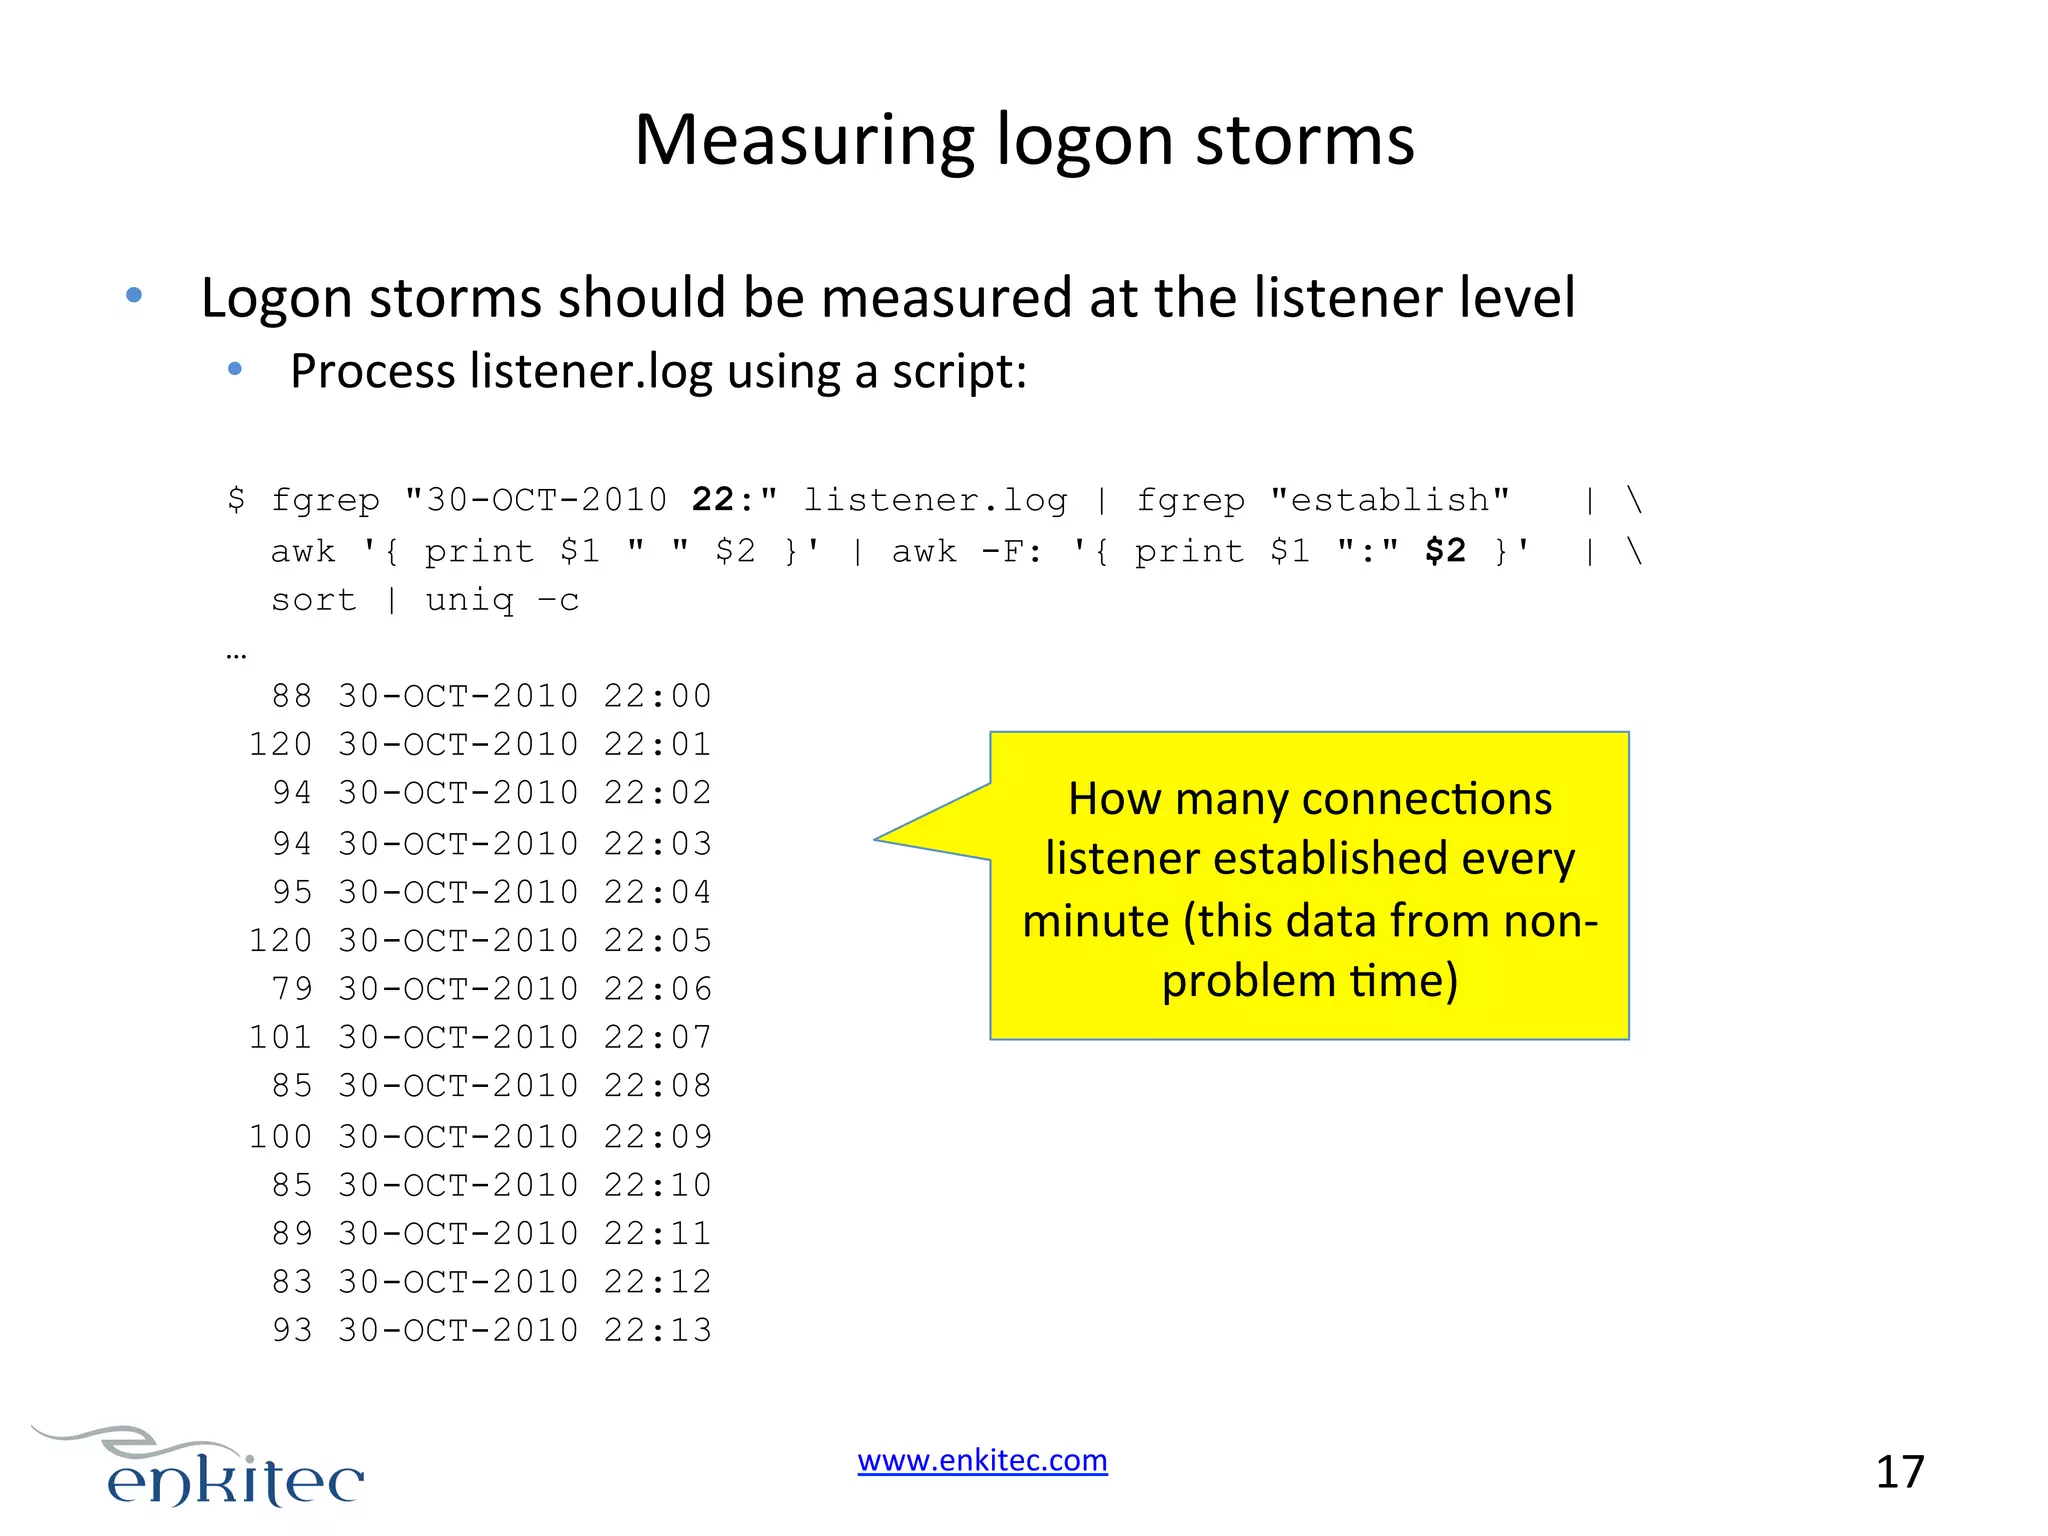
Issues with excessive audit file generation; Oracle's behavior change causes performance delays due to open syscalls.
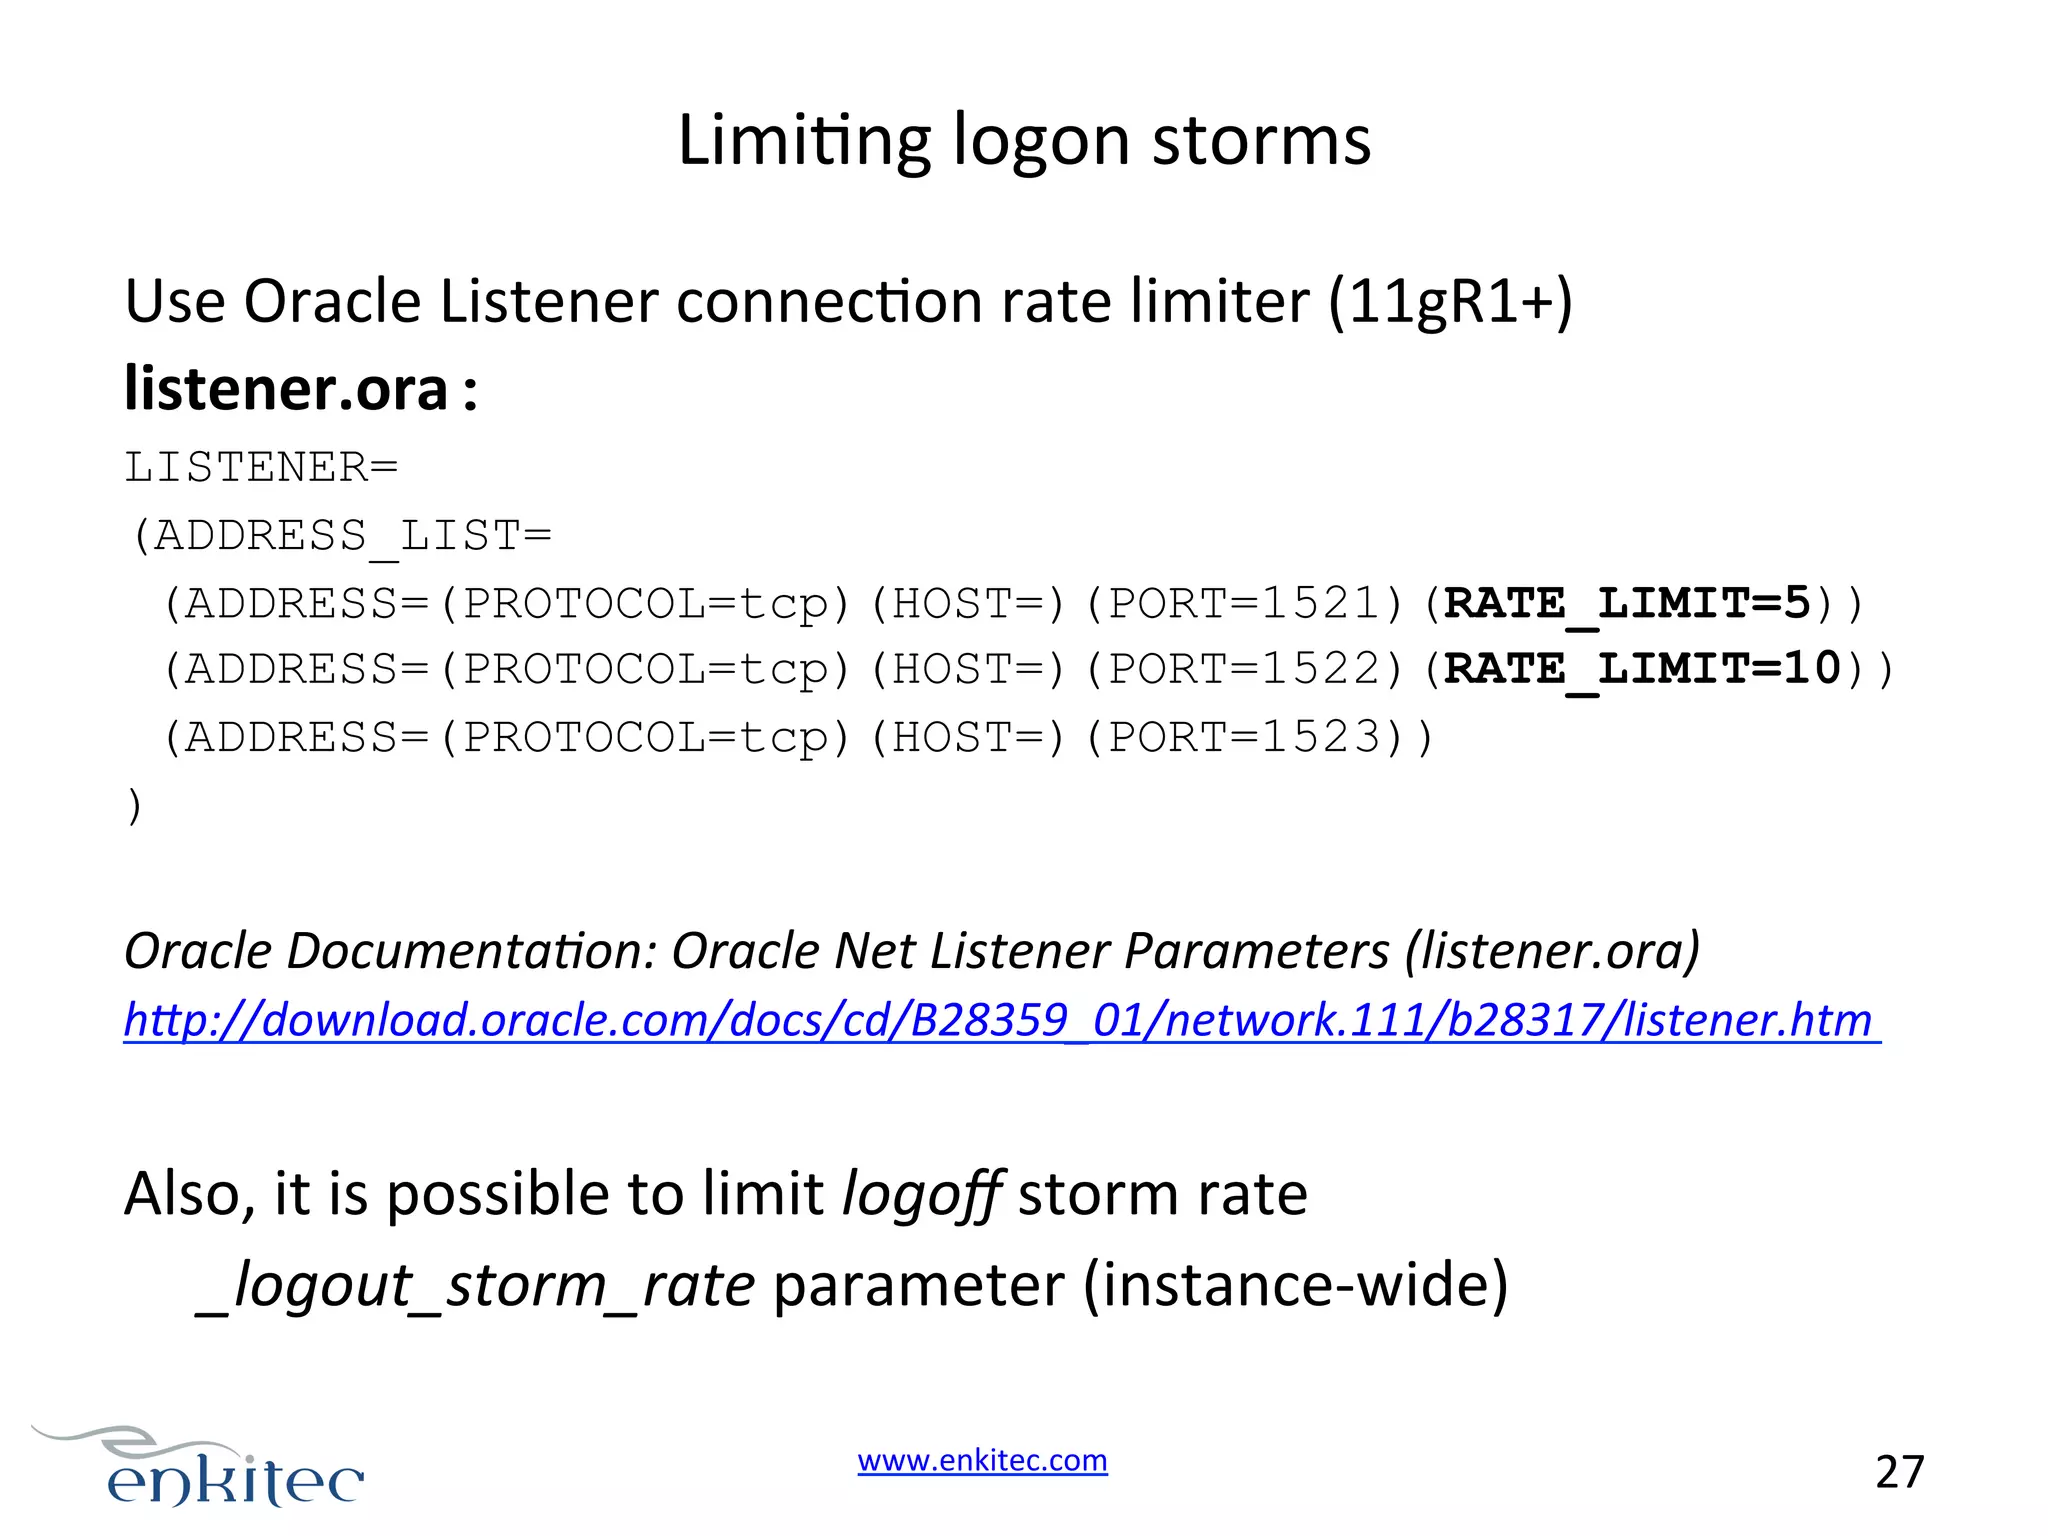
Limiting logon storms using listener rate limiter settings; conclusions and recommendations for efficient performance handling.