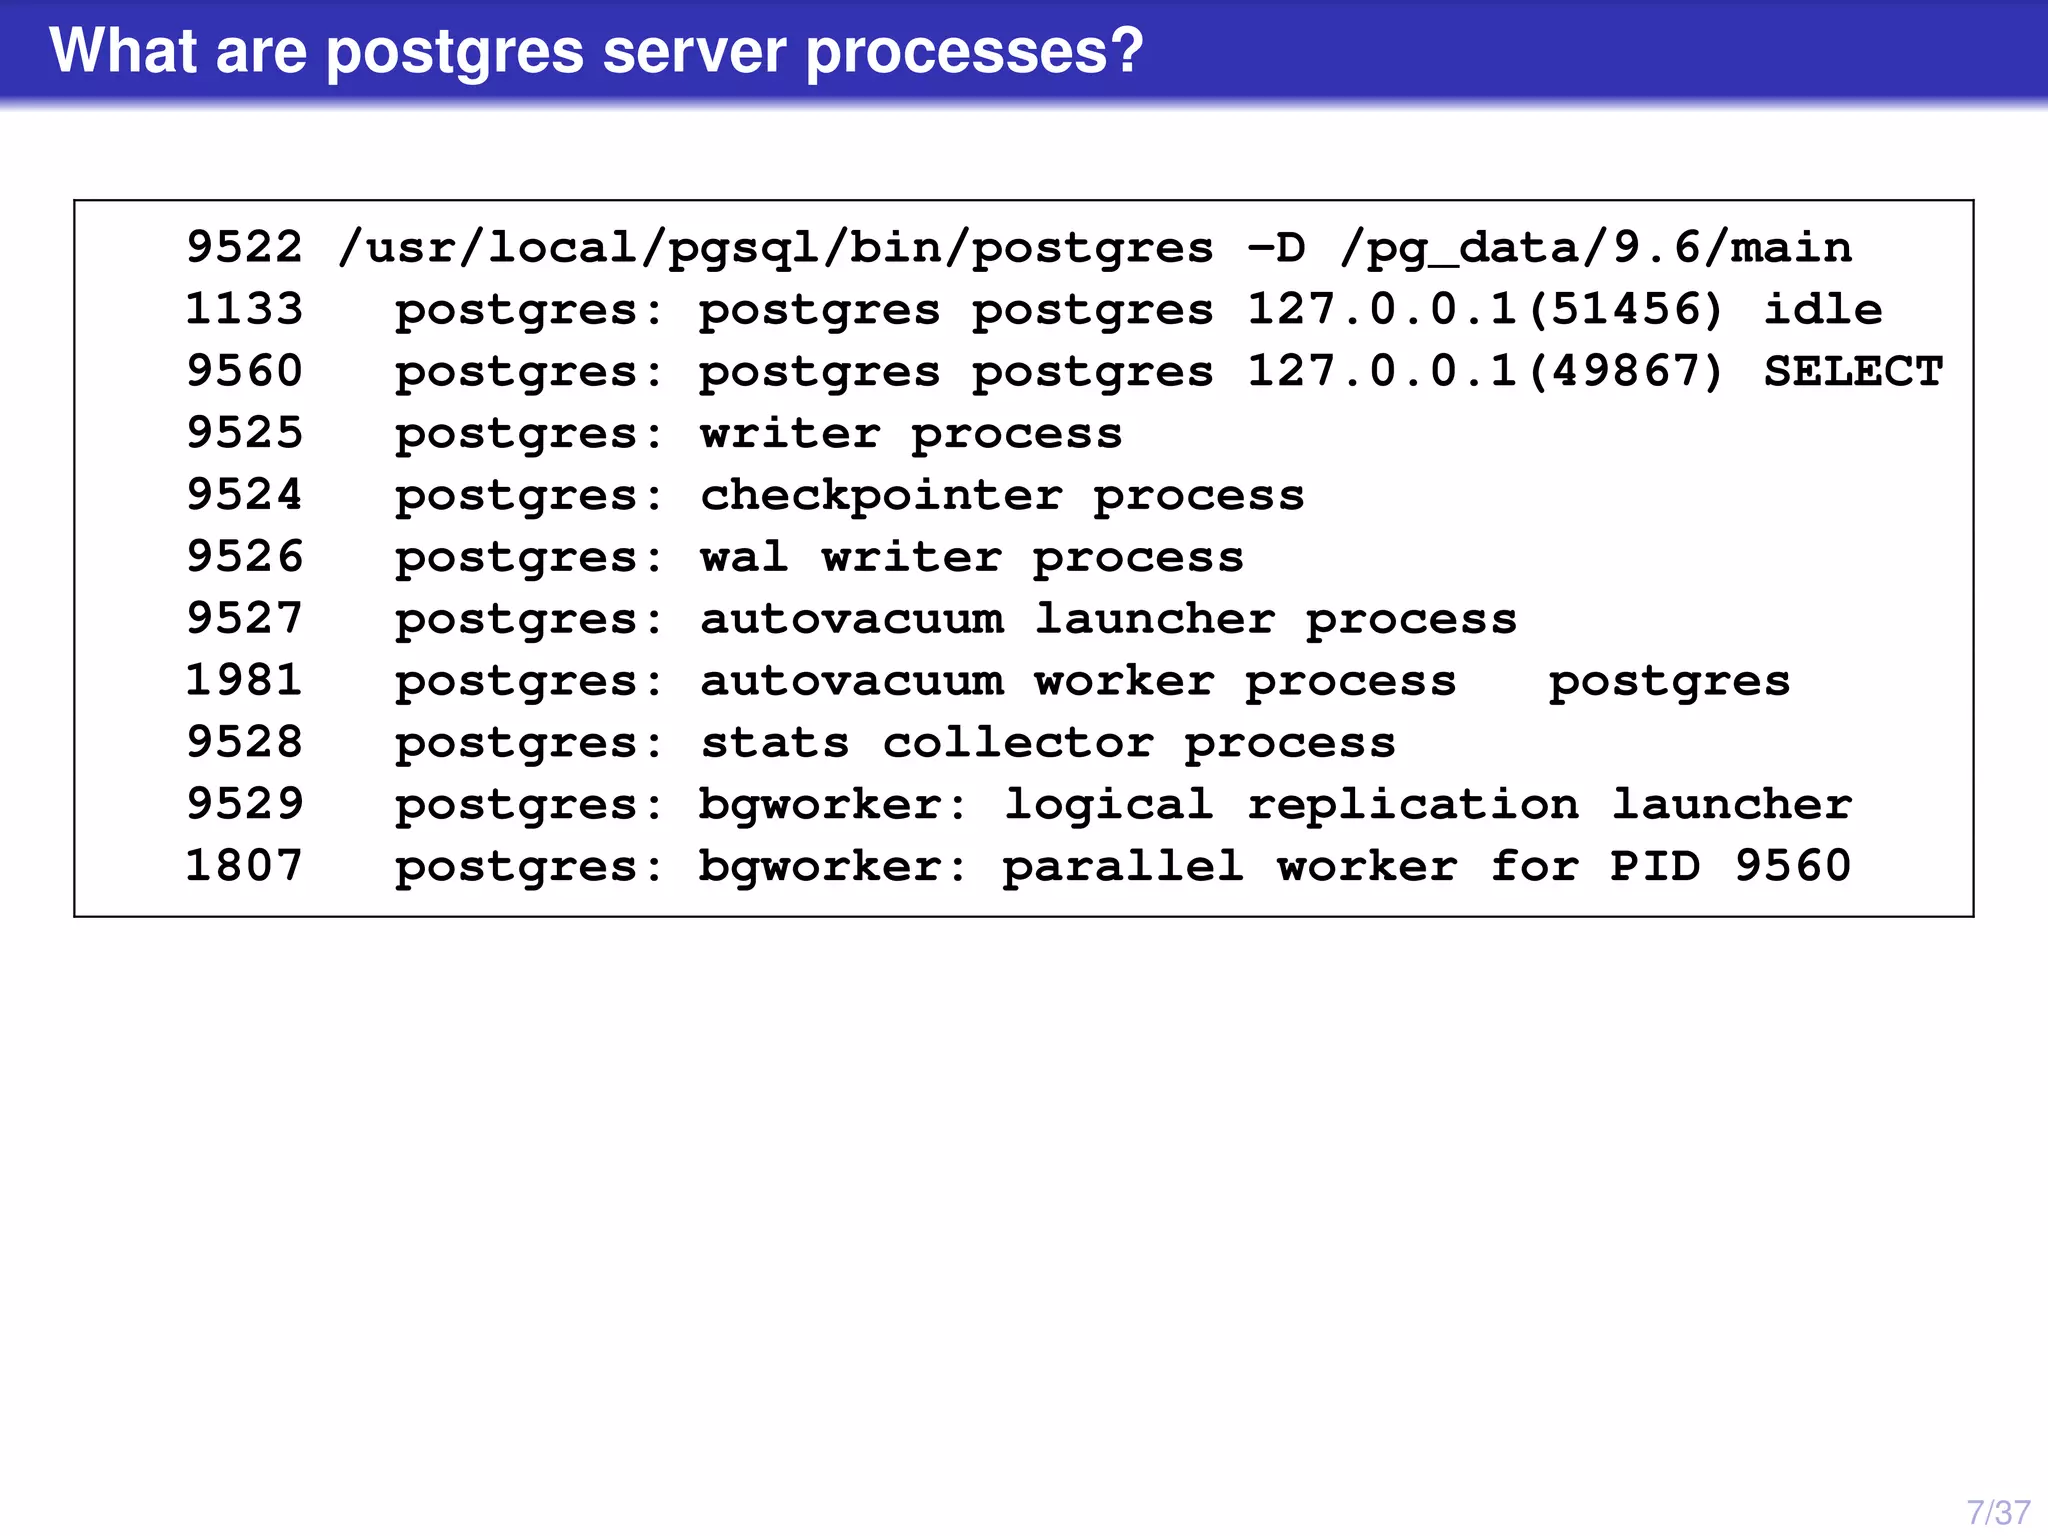
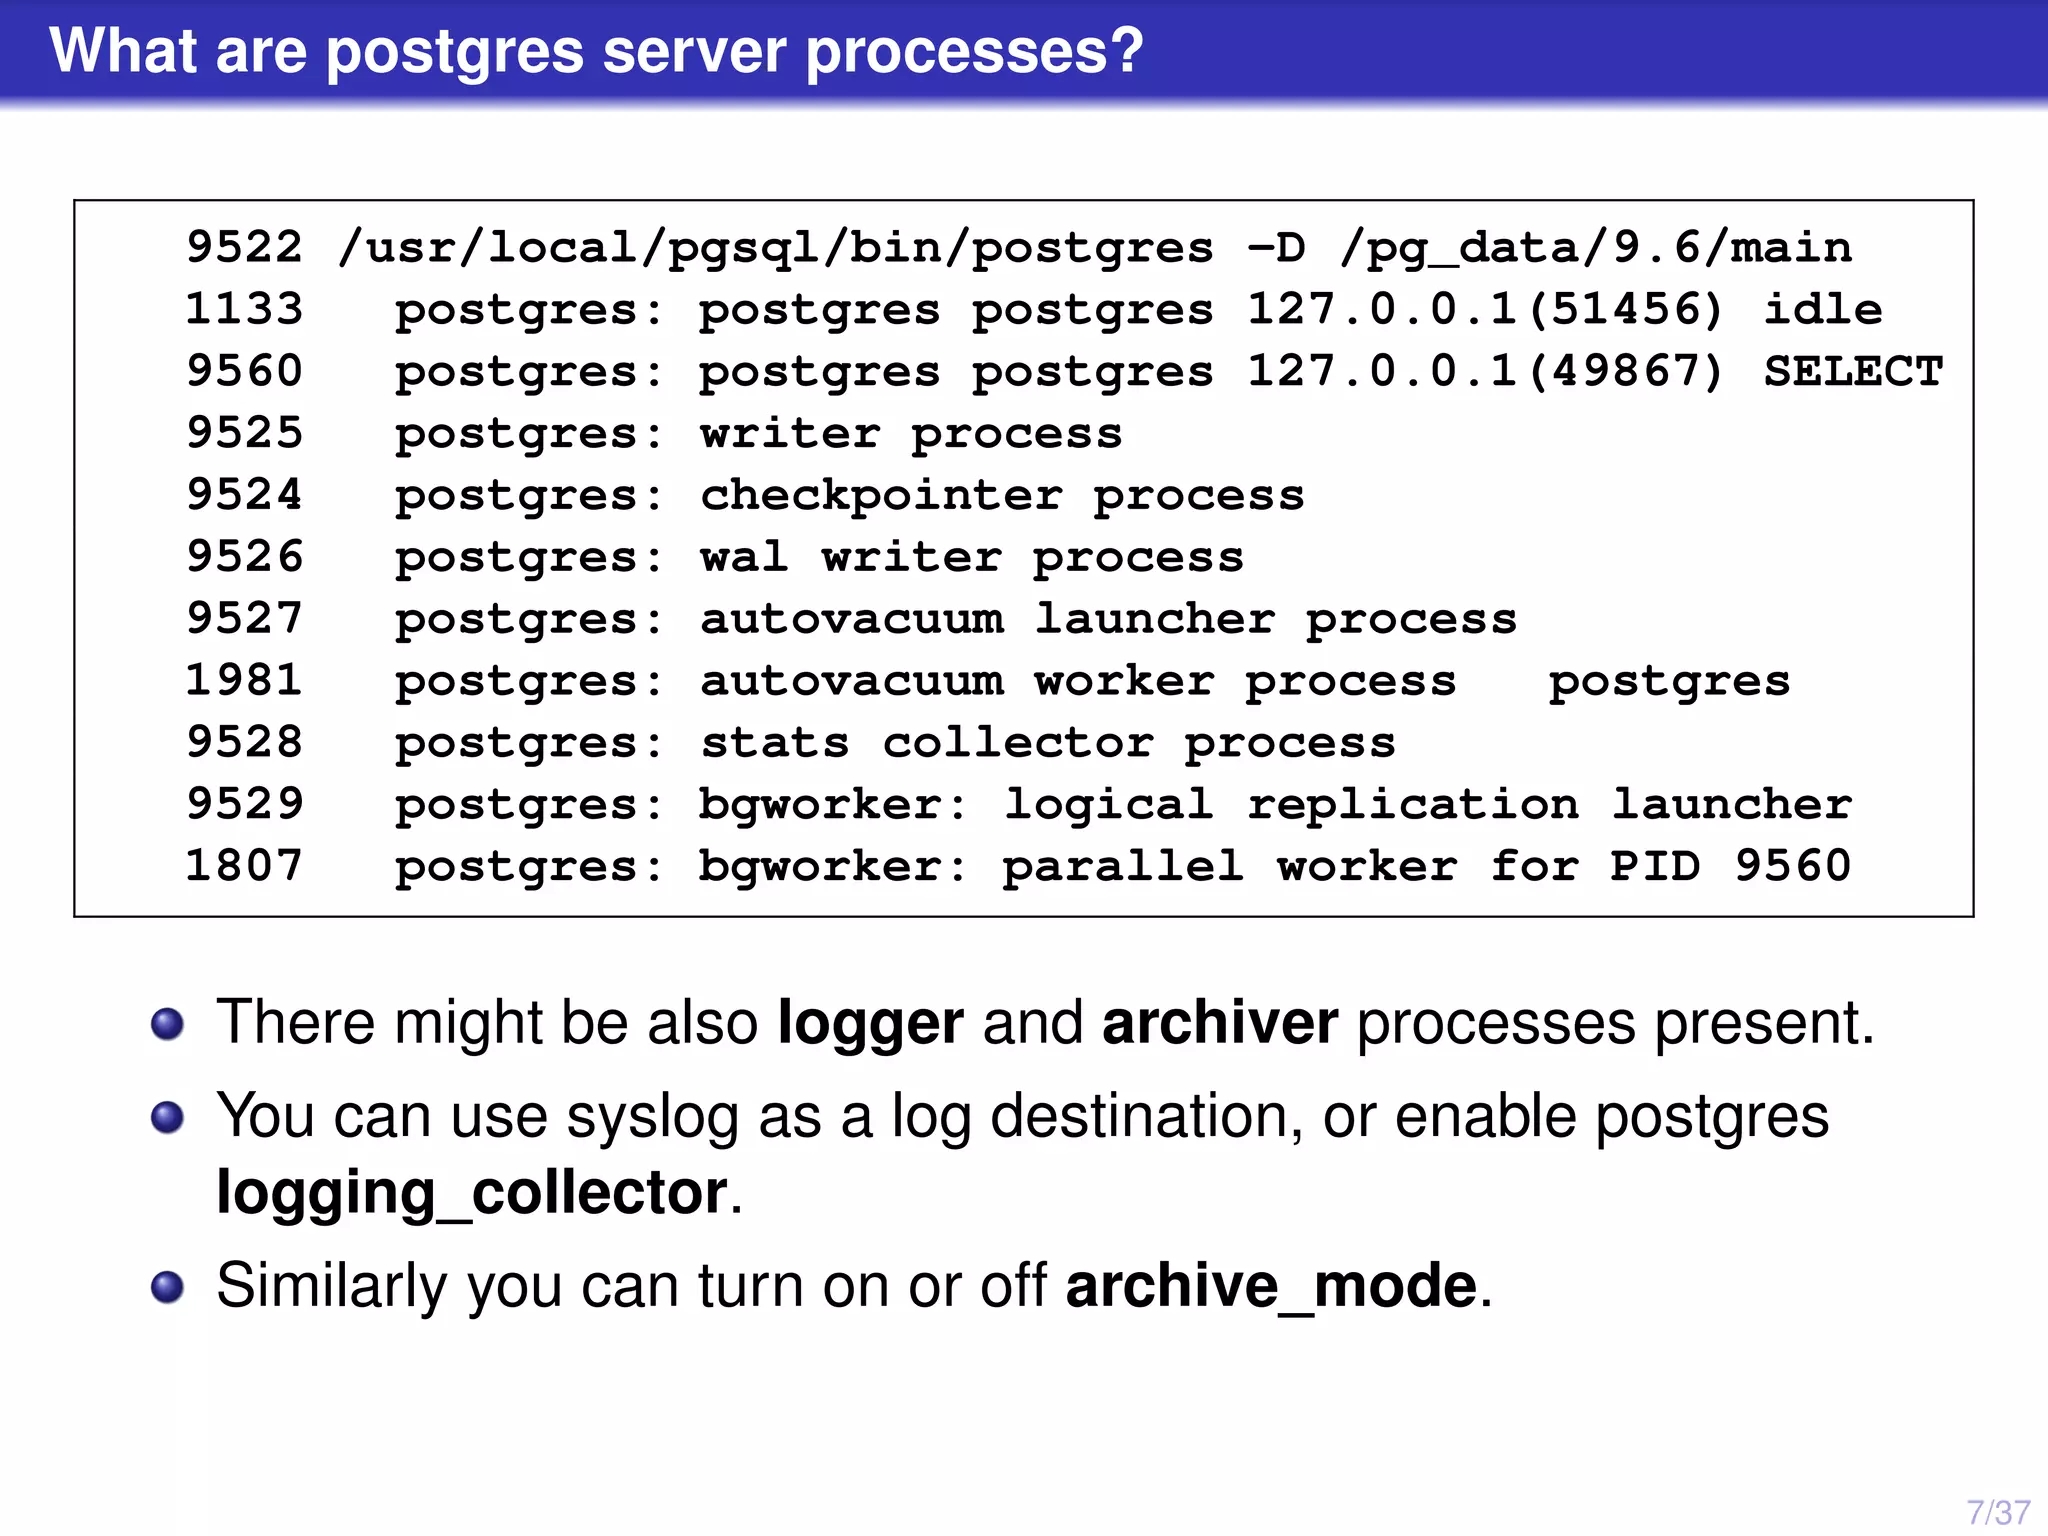
1/37 PostgreSQL and RAM usage Alexey Bashtanov, Brandwatch 27 Feb 2017 The Skiff, Brighton
2/37 One fine day early in the morning
2/37 One fine day early in the morning You are woken up by SMS Bz-z-z! Something is wrong with your live system.
2/37 One fine day early in the morning You are woken up by SMS Bz-z-z! Something is wrong with your live system. You have a look into the logs . . .
3/37 One fine day DB Log: LOG: server process (PID 18742) was terminated by signal 9: Killed DETAIL: Failed process was running: some query here LOG: terminating any other active server processes FATAL: the database system is in recovery mode ... LOG: database system is ready to accept connections
3/37 One fine day DB Log: LOG: server process (PID 18742) was terminated by signal 9: Killed DETAIL: Failed process was running: some query here LOG: terminating any other active server processes FATAL: the database system is in recovery mode ... LOG: database system is ready to accept connections Syslog: Out of memory: Kill process 18742 (postgres) score 669 or sacrifice child Killed process 18742 (postgres) total-vm:5670864kB, anon-rss:5401060kB, file-rss:1428kB
4/37 How to avoid such a scenario?
5/37 Outline 1 What are postgres server processes? 2 What processes use much RAM and why? 3 What queries require much RAM? 4 How to we measure the amount of RAM used? 5 How is allocated RAM reclaimed?
6/37 What are postgres server processes?
7/37 What are postgres server processes? 9522 /usr/local/pgsql/bin/postgres -D /pg_data/9.6/main 1133 postgres: postgres postgres 127.0.0.1(51456) idle 9560 postgres: postgres postgres 127.0.0.1(49867) SELECT 9525 postgres: writer process 9524 postgres: checkpointer process 9526 postgres: wal writer process 9527 postgres: autovacuum launcher process 1981 postgres: autovacuum worker process postgres 9528 postgres: stats collector process 9529 postgres: bgworker: logical replication launcher 1807 postgres: bgworker: parallel worker for PID 9560
7/37 What are postgres server processes? -> 9522 /usr/local/pgsql/bin/postgres -D /pg_data/9.6/main 1133 postgres: postgres postgres 127.0.0.1(51456) idle 9560 postgres: postgres postgres 127.0.0.1(49867) SELECT 9525 postgres: writer process 9524 postgres: checkpointer process 9526 postgres: wal writer process 9527 postgres: autovacuum launcher process 1981 postgres: autovacuum worker process postgres 9528 postgres: stats collector process 9529 postgres: bgworker: logical replication launcher 1807 postgres: bgworker: parallel worker for PID 9560 "The" postgres server process aka postmaster Performs bootstrap Allocates shared memory including shared buffers Listens to sockets Spawns backends and other server processes
7/37 What are postgres server processes? 9522 /usr/local/pgsql/bin/postgres -D /pg_data/9.6/main -> 1133 postgres: postgres postgres 127.0.0.1(51456) idle -> 9560 postgres: postgres postgres 127.0.0.1(49867) SELECT 9525 postgres: writer process 9524 postgres: checkpointer process 9526 postgres: wal writer process 9527 postgres: autovacuum launcher process 1981 postgres: autovacuum worker process postgres 9528 postgres: stats collector process 9529 postgres: bgworker: logical replication launcher 1807 postgres: bgworker: parallel worker for PID 9560 Backend processes: these are the ones that perform queries One process per client connection, so no more than max_connections of them it total A connection pooler can be used between clients and servers to limit the number of server backends Standalone ones are Pgpool-II, pgbouncer, crunchydb
7/37 What are postgres server processes? 9522 /usr/local/pgsql/bin/postgres -D /pg_data/9.6/main 1133 postgres: postgres postgres 127.0.0.1(51456) idle 9560 postgres: postgres postgres 127.0.0.1(49867) SELECT -> 9525 postgres: writer process 9524 postgres: checkpointer process 9526 postgres: wal writer process 9527 postgres: autovacuum launcher process 1981 postgres: autovacuum worker process postgres 9528 postgres: stats collector process 9529 postgres: bgworker: logical replication launcher 1807 postgres: bgworker: parallel worker for PID 9560 Writer process aka bgwriter (8.0+) Writes dirty buffer pages to disk using LRU algorithm Aims to free buffer pages before backends run out of them But under certain circumstances, backends still have to do it by their own
7/37 What are postgres server processes? 9522 /usr/local/pgsql/bin/postgres -D /pg_data/9.6/main 1133 postgres: postgres postgres 127.0.0.1(51456) idle 9560 postgres: postgres postgres 127.0.0.1(49867) SELECT 9525 postgres: writer process -> 9524 postgres: checkpointer process 9526 postgres: wal writer process 9527 postgres: autovacuum launcher process 1981 postgres: autovacuum worker process postgres 9528 postgres: stats collector process 9529 postgres: bgworker: logical replication launcher 1807 postgres: bgworker: parallel worker for PID 9560 Checkpointer process (9.2+) Checkpoints are forced dirty disk pages flushes. Checkpointer process issues them every so often to guarantee that changes committed before certain point in time have been persisted. In case of server crash the recovery process start from the last checkpoint completed.
7/37 What are postgres server processes? 9522 /usr/local/pgsql/bin/postgres -D /pg_data/9.6/main 1133 postgres: postgres postgres 127.0.0.1(51456) idle 9560 postgres: postgres postgres 127.0.0.1(49867) SELECT 9525 postgres: writer process 9524 postgres: checkpointer process -> 9526 postgres: wal writer process 9527 postgres: autovacuum launcher process 1981 postgres: autovacuum worker process postgres 9528 postgres: stats collector process 9529 postgres: bgworker: logical replication launcher 1807 postgres: bgworker: parallel worker for PID 9560 WAL Writer process (8.3+) Writes and fsyncs WAL segments Backends could have done it by their own when synchronous_commit=on (and actually did before 8.3) When synchronous_commit=off – acutal commits get delayed no more than wal_writer_delay and processed batchwise
7/37 What are postgres server processes? 9522 /usr/local/pgsql/bin/postgres -D /pg_data/9.6/main 1133 postgres: postgres postgres 127.0.0.1(51456) idle 9560 postgres: postgres postgres 127.0.0.1(49867) SELECT 9525 postgres: writer process 9524 postgres: checkpointer process 9526 postgres: wal writer process -> 9527 postgres: autovacuum launcher process -> 1981 postgres: autovacuum worker process postgres 9528 postgres: stats collector process 9529 postgres: bgworker: logical replication launcher 1807 postgres: bgworker: parallel worker for PID 9560 Autovacuum launcher process launches autovacuum workers: To VACUUM a table when it contains rows with very old transaction ids to prevent transaction IDs wraparound To VACUUM a table when certain number of table rows were updated/deleted To ANALYZE a table when certain number of rows were inserted
7/37 What are postgres server processes? 9522 /usr/local/pgsql/bin/postgres -D /pg_data/9.6/main 1133 postgres: postgres postgres 127.0.0.1(51456) idle 9560 postgres: postgres postgres 127.0.0.1(49867) SELECT 9525 postgres: writer process 9524 postgres: checkpointer process 9526 postgres: wal writer process 9527 postgres: autovacuum launcher process 1981 postgres: autovacuum worker process postgres -> 9528 postgres: stats collector process 9529 postgres: bgworker: logical replication launcher 1807 postgres: bgworker: parallel worker for PID 9560 Statistic collector handles requests from other postgres processes to write data into pg_stat_* system catalogs
7/37 What are postgres server processes? 9522 /usr/local/pgsql/bin/postgres -D /pg_data/9.6/main 1133 postgres: postgres postgres 127.0.0.1(51456) idle 9560 postgres: postgres postgres 127.0.0.1(49867) SELECT 9525 postgres: writer process 9524 postgres: checkpointer process 9526 postgres: wal writer process 9527 postgres: autovacuum launcher process 1981 postgres: autovacuum worker process postgres 9528 postgres: stats collector process -> 9529 postgres: bgworker: logical replication launcher -> 1807 postgres: bgworker: parallel worker for PID 9560 Background workers aka bgworkers are custom processes spawned and terminated by postgres. No more than max_worker_processes of them. Can be used for Parallel query execution: backends launch them on demand Logical replication Custom add-on background jobs, such as pg_squeeze
7/37 What are postgres server processes? 9522 /usr/local/pgsql/bin/postgres -D /pg_data/9.6/main 1133 postgres: postgres postgres 127.0.0.1(51456) idle 9560 postgres: postgres postgres 127.0.0.1(49867) SELECT 9525 postgres: writer process 9524 postgres: checkpointer process 9526 postgres: wal writer process 9527 postgres: autovacuum launcher process 1981 postgres: autovacuum worker process postgres 9528 postgres: stats collector process 9529 postgres: bgworker: logical replication launcher 1807 postgres: bgworker: parallel worker for PID 9560 There might be also logger and archiver processes present. You can use syslog as a log destination, or enable postgres logging_collector. Similarly you can turn on or off archive_mode.
8/37 What processes use much RAM and why?
9/37 Shared memory Shared memory is accessible by all postgres server processes.
9/37 Shared memory Shared memory is accessible by all postgres server processes. Normally the most part of it is shared_buffers. Postgres suggests to use 25% of your RAM, though often less values are used.
9/37 Shared memory Shared memory is accessible by all postgres server processes. Normally the most part of it is shared_buffers. Postgres suggests to use 25% of your RAM, though often less values are used. The wal_buffers are normally much smaller, 1/32 of shared_buffers is default. Anyway, you are allowed to set it to arbitrarily large value.
9/37 Shared memory Shared memory is accessible by all postgres server processes. Normally the most part of it is shared_buffers. Postgres suggests to use 25% of your RAM, though often less values are used. The wal_buffers are normally much smaller, 1/32 of shared_buffers is default. Anyway, you are allowed to set it to arbitrarily large value. The amount of memory used for table and advisory locks is about 270 × max_locks_per_transaction ×(max_connections+max_prepared_transactions) bytes You are probably safe, unless you are doing something tricky using lots advisory locks and increase max_locks_per_transaction to really large values.
9/37 Shared memory Shared memory is accessible by all postgres server processes. Normally the most part of it is shared_buffers. Postgres suggests to use 25% of your RAM, though often less values are used. The wal_buffers are normally much smaller, 1/32 of shared_buffers is default. Anyway, you are allowed to set it to arbitrarily large value. The amount of memory used for table and advisory locks is about 270 × max_locks_per_transaction ×(max_connections+max_prepared_transactions) bytes You are probably safe, unless you are doing something tricky using lots advisory locks and increase max_locks_per_transaction to really large values. Same for max_pred_locks_per_transaction — predicate locks are used only for non-default transaction isolation levels, make sure not to increase this setting too much.
10/37 Autovacuum workers No more than autovacuum_max_workers workers, each uses maintenance_work_mem or autovacuum_work_mem of RAM Ideally, your tables are not too large and your RAM is not too small, so you can afford setting autovacuum_work_mem to reflect your smallest table size Practically, you will autovacuum_work_mem to cover all the small tables in your DB, whatever that means
11/37 Backends and their bgworkers Backends and their bgworkers are the most important, as there might be quite a few of them, namely max_connections and max_workers
11/37 Backends and their bgworkers Backends and their bgworkers are the most important, as there might be quite a few of them, namely max_connections and max_workers The work_mem parameter limits the amount of RAM used per operation, i. e. per execution plan node, not per statement
11/37 Backends and their bgworkers Backends and their bgworkers are the most important, as there might be quite a few of them, namely max_connections and max_workers The work_mem parameter limits the amount of RAM used per operation, i. e. per execution plan node, not per statement It actually doesn’t work reliably . . .
12/37 What queries require much RAM?
13/37 What queries require much RAM? Each query has an execution plan postgres=# explain select atttypid::regclass, count(*) from pg_class join pg_attribute postgres-# on attrelid = pg_class.oid group by 1 order by 2 desc; QUERY PLAN ----------------------------------------------------------------------------------- Sort (cost=143.51..143.60 rows=39 width=12) Sort Key: (count(*)) DESC -> HashAggregate (cost=142.08..142.47 rows=39 width=12) Group Key: (pg_attribute.atttypid)::regclass -> Hash Join (cost=18.56..129.32 rows=2552 width=4) Hash Cond: (pg_attribute.attrelid = pg_class.oid) -> Seq Scan on pg_attribute (cost=0.00..75.36 rows=2636 width=8) -> Hash (cost=14.36..14.36 rows=336 width=4) -> Seq Scan on pg_class (cost=0.00..14.36 rows=336 width=4)
13/37 What queries require much RAM? Each query has an execution plan postgres=# explain select atttypid::regclass, count(*) from pg_class join pg_attribute postgres-# on attrelid = pg_class.oid group by 1 order by 2 desc; QUERY PLAN ----------------------------------------------------------------------------------- Sort (cost=143.51..143.60 rows=39 width=12) Sort Key: (count(*)) DESC -> HashAggregate (cost=142.08..142.47 rows=39 width=12) Group Key: (pg_attribute.atttypid)::regclass -> Hash Join (cost=18.56..129.32 rows=2552 width=4) Hash Cond: (pg_attribute.attrelid = pg_class.oid) -> Seq Scan on pg_attribute (cost=0.00..75.36 rows=2636 width=8) -> Hash (cost=14.36..14.36 rows=336 width=4) -> Seq Scan on pg_class (cost=0.00..14.36 rows=336 width=4) So, essentially the question is, what plan nodes can be memory-hungry? Right?
13/37 What queries require much RAM? Each query has an execution plan postgres=# explain select atttypid::regclass, count(*) from pg_class join pg_attribute postgres-# on attrelid = pg_class.oid group by 1 order by 2 desc; QUERY PLAN ----------------------------------------------------------------------------------- Sort (cost=143.51..143.60 rows=39 width=12) Sort Key: (count(*)) DESC -> HashAggregate (cost=142.08..142.47 rows=39 width=12) Group Key: (pg_attribute.atttypid)::regclass -> Hash Join (cost=18.56..129.32 rows=2552 width=4) Hash Cond: (pg_attribute.attrelid = pg_class.oid) -> Seq Scan on pg_attribute (cost=0.00..75.36 rows=2636 width=8) -> Hash (cost=14.36..14.36 rows=336 width=4) -> Seq Scan on pg_class (cost=0.00..14.36 rows=336 width=4) So, essentially the question is, what plan nodes can be memory-hungry? Right? Not exactly. Also we need to track the situations when there are too many nodes in a plan!
14/37 What execution plan nodes might require much RAM?
15/37 Nodes: stream-like Some nodes are more or less stream-like. They don’t accumulate data from underlying nodes and produce nodes one by one, so they have no chance to allocate too much memory. Examples of such nodes include Sequential scan, Index Scan Nested Loop and Merge Join Append and Merge Append Unique (of a sorted input) Sounds safe?
15/37 Nodes: stream-like Some nodes are more or less stream-like. They don’t accumulate data from underlying nodes and produce nodes one by one, so they have no chance to allocate too much memory. Examples of such nodes include Sequential scan, Index Scan Nested Loop and Merge Join Append and Merge Append Unique (of a sorted input) Sounds safe? Even a single row can be quite large. Maximal size for individual postgres value is around 1GB, so this query requires 5GB: WITH cte_1g as (select repeat('a', 1024*1024*1024 - 100) as a1g) SELECT * FROM cte_1g a, cte_1g b, cte_1g c, cte_1g d, cte_1g e;
16/37 Nodes: controlled Some of the other nodes actively use RAM but control the amount used. They have a fallback behaviour to switch to if they realise they cannot fit work_mem. Sort node switches from quicksort to sort-on-disk CTE and materialize nodes use temporary files if needed Group Aggregation with DISTINCT keyword can use temporary files Beware of out of disk space problems.
16/37 Nodes: controlled Some of the other nodes actively use RAM but control the amount used. They have a fallback behaviour to switch to if they realise they cannot fit work_mem. Sort node switches from quicksort to sort-on-disk CTE and materialize nodes use temporary files if needed Group Aggregation with DISTINCT keyword can use temporary files Beware of out of disk space problems. Also Exact Bitmap Scan falls back to Lossy Bitmap Scan Hash Join switches to batchwise processing if it encounters more data than expected
17/37 Nodes: unsafe They are Hash Agg, hashed SubPlan and (rarely) Hash Join can use unlimited amount of RAM. Optimizer normally avoids them when it estimates them to process huge sets, but it can easily be wrong. How to make the estimates wrong: CREATE TABLE t (a int, b int); INSERT INTO t SELECT 0, b from generate_series(1, (10^7)::int) b; ANALYZE t; INSERT INTO t SELECT 1, b from generate_series(1, (5*10^5)::int) b; After this, autovacuum won’t update stats, as it treats the second insert as small w r. t. the number of rows already present. postgres=# EXPLAIN (ANALYZE, TIMING OFF) SELECT * FROM t WHERE a = 1; QUERY PLAN ----------------------------------------------------------------------------------- Seq Scan on t (cost=0.00..177712.39 rows=1 width=8) (rows=500000 loops=1) Filter: (a = 1) Rows Removed by Filter: 10000000 Planning time: 0.059 ms Execution time: 769.508 ms
18/37 Unsafe nodes: hashed SubPlan Then we run the following query postgres=# EXPLAIN (ANALYZE, TIMING OFF) postgres-# SELECT * FROM t WHERE b NOT IN (SELECT b FROM t WHERE a = 1); QUERY PLAN --------------------------------------------------------------------------------------------- Seq Scan on t (cost=177712.39..355424.78 rows=5250056 width=8) (actual rows=9500000 loops=1) Filter: (NOT (hashed SubPlan 1)) Rows Removed by Filter: 1000000 SubPlan 1 -> Seq Scan on t t_1 (cost=0.00..177712.39 rows=1 width=4) (actual rows=500000 loops=1) Filter: (a = 1) Rows Removed by Filter: 10000000 Planning time: 0.126 ms Execution time: 3239.730 ms and get a half-million set hashed. The backend used 60MB of RAM while work_mem was only 4MB. Sounds not too bad, but . . .
19/37 Unsafe nodes: hashed SubPlan and partitioned table For a partitioned table it hashes the same condition separately for each partition! postgres=# EXPLAIN SELECT * FROM t WHERE b NOT IN (SELECT b FROM t1 WHERE a = 1); QUERY PLAN -------------------------------------------------------------------------- Append (cost=135449.03..1354758.02 rows=3567432 width=8) -> Seq Scan on t (cost=135449.03..135449.03 rows=1 width=8) Filter: (NOT (hashed SubPlan 1)) SubPlan 1 -> Seq Scan on t1 t1_1 (cost=0.00..135449.03 rows=1 width=4) Filter: (a = 1) -> Seq Scan on t2 (cost=135449.03..135487.28 rows=1130 width=8) Filter: (NOT (hashed SubPlan 1)) -> Seq Scan on t3 (cost=135449.03..135487.28 rows=1130 width=8) Filter: (NOT (hashed SubPlan 1)) -> Seq Scan on t4 (cost=135449.03..135487.28 rows=1130 width=8) Filter: (NOT (hashed SubPlan 1)) -> Seq Scan on t5 (cost=135449.03..135487.28 rows=1130 width=8) Filter: (NOT (hashed SubPlan 1)) -> Seq Scan on t6 (cost=135449.03..135487.28 rows=1130 width=8) Filter: (NOT (hashed SubPlan 1)) -> Seq Scan on t7 (cost=135449.03..135487.28 rows=1130 width=8) Filter: (NOT (hashed SubPlan 1)) -> Seq Scan on t8 (cost=135449.03..135487.28 rows=1130 width=8) Filter: (NOT (hashed SubPlan 1)) -> Seq Scan on t1 (cost=135449.03..270898.05 rows=3559521 width=8) Filter: (NOT (hashed SubPlan 1)) This is going to be fixed in PostgreSQL 10
20/37 Unsafe nodes: hashed SubPlan and partitioned table For now the workaround is to use dirty hacks: postgres=# explain postgres-# SELECT * FROM (TABLE t OFFSET 0) s WHERE b NOT IN (SELECT b FROM t1 WHERE a = 1); QUERY PLAN ------------------------------------------------------------------------- Subquery Scan on _ (cost=135449.03..342514.44 rows=3567432 width=8) Filter: (NOT (hashed SubPlan 1)) -> Append (cost=0.00..117879.62 rows=7134863 width=8) -> Seq Scan on t (cost=0.00..0.00 rows=1 width=8) -> Seq Scan on t2 (cost=0.00..32.60 rows=2260 width=8) -> Seq Scan on t3 (cost=0.00..32.60 rows=2260 width=8) -> Seq Scan on t4 (cost=0.00..32.60 rows=2260 width=8) -> Seq Scan on t5 (cost=0.00..32.60 rows=2260 width=8) -> Seq Scan on t6 (cost=0.00..32.60 rows=2260 width=8) -> Seq Scan on t7 (cost=0.00..32.60 rows=2260 width=8) -> Seq Scan on t8 (cost=0.00..32.60 rows=2260 width=8) -> Seq Scan on t1 (cost=0.00..117651.42 rows=7119042 width=8) SubPlan 1 -> Seq Scan on t1 t1_1 (cost=0.00..135449.03 rows=1 width=4) Filter: (a = 1) Memory usage was reduced 9 times, also it works much faster.
21/37 Unsafe nodes: Hash Aggregation Estimates for groupping are sometimes unreliable at all. Random numbers chosen by a fair dice roll: postgres=# explain (analyze, timing off) select b, count(*) postgres-# from (table t union all table t) u group by 1; QUERY PLAN ------------------------------------------------------------------- HashAggregate (... rows=200 ... ) (actual rows=10000000 ...) Group Key: t.b -> Append (... rows=19999954 ...) (actual rows=20000000 ...) -> Seq Scan on t (... rows=9999977 ... ) (actual ... ) -> Seq Scan on t t_1 (... rows=9999977 ... ) (actual ... ) Planning time: 0.141 ms Execution time: 14523.303 ms . . . and uses several gigs of RAM for the hash table!
22/37 Unsafe nodes: Hash Join Hash Joins can use more memory than expected if there are many collisions on the hashed side: postgres=# explain (analyze, costs off) postgres-# select * from t t1 join t t2 on t1.b = t2.b where t1.a = 1; QUERY PLAN -------------------------------------------------------------------------------------------- Hash Join (actual time=873.321..4223.080 rows=1000000 loops=1) Hash Cond: (t2.b = t1.b) -> Seq Scan on t t2 (actual time=0.048..755.195 rows=10500000 loops=1) -> Hash (actual time=873.163..873.163 rows=500000 loops=1) Buckets: 131072 (originally 1024) Batches: 8 (originally 1) Memory Usage: 3465kB -> Seq Scan on t t1 (actual time=748.700..803.665 rows=500000 loops=1) Filter: (a = 1) Rows Removed by Filter: 10000000 postgres=# explain (analyze, costs off) postgres-# select * from t t1 join t t2 on t1.b % 1 = t2.b where t1.a = 1; QUERY PLAN --------------------------------------------------------------------------------------------- Hash Join (actual time=3542.413..3542.413 rows=0 loops=1) Hash Cond: (t2.b = (t1.b % 1)) -> Seq Scan on t t2 (actual time=0.053..732.095 rows=10500000 loops=1) -> Hash (actual time=888.131..888.131 rows=500000 loops=1) Buckets: 131072 (originally 1024) Batches: 2 (originally 1) Memory Usage: 19532kB -> Seq Scan on t t1 (actual time=753.244..812.959 rows=500000 loops=1) Filter: (a = 1) Rows Removed by Filter: 10000000
23/37 Unsafe nodes: array_agg And just one more random fact. array_agg used at least 1Kb per array before a fix in Postgres 9.5 Funny, isn’t it: on small arrays array_agg_distinct from count_distinct extension is faster than built-in array_agg.
24/37 How to we measure the amount of RAM used?
25/37 How to we measure the amount of RAM used? top? ps?
25/37 How to we measure the amount of RAM used? top? ps? htop? atop?
25/37 How to we measure the amount of RAM used? top? ps? htop? atop? No. They show private and shared memory together.
25/37 How to we measure the amount of RAM used? top? ps? htop? atop? No. They show private and shared memory together. We have to look into /proc filesystem, namely /proc/pid/smaps
26/37 smaps /proc/7194/smaps comprises a few sections like this .... 0135f000-0a0bf000 rw-p 00000000 00:00 0 [heap] Size: 144768 kB Rss: 136180 kB Pss: 136180 kB Shared_Clean: 0 kB Shared_Dirty: 0 kB Private_Clean: 0 kB Private_Dirty: 136180 kB Referenced: 114936 kB Anonymous: 136180 kB AnonHugePages: 2048 kB Swap: 0 kB KernelPageSize: 4 kB MMUPageSize: 4 kB Locked: 0 kB VmFlags: rd wr mr mw me ac sd .... which is a private memory segment . . .
27/37 smaps . . . or this .... 7f8ce656a000-7f8cef300000 rw-s 00000000 00:04 7334558 /dev/zero (deleted) Size: 144984 kB Rss: 75068 kB Pss: 38025 kB Shared_Clean: 0 kB Shared_Dirty: 73632 kB Private_Clean: 0 kB Private_Dirty: 1436 kB Referenced: 75068 kB Anonymous: 0 kB AnonHugePages: 0 kB Swap: 0 kB KernelPageSize: 4 kB MMUPageSize: 4 kB Locked: 0 kB VmFlags: rd wr sh mr mw me ms sd .... which looks like part of shared buffers. BTW what is PSS?
28/37 smaps: PSS PSS stands for proportional set size For each private allocated memory chunk we count its size as is We divide the size of a shared memory chunk by the number of processes that use it
28/37 smaps: PSS PSS stands for proportional set size For each private allocated memory chunk we count its size as is We divide the size of a shared memory chunk by the number of processes that use it pid PSS(pid) = total memory used!
28/37 smaps: PSS PSS stands for proportional set size For each private allocated memory chunk we count its size as is We divide the size of a shared memory chunk by the number of processes that use it pid PSS(pid) = total memory used! PSS support was added to Linux kernel in 2007, but I’m not aware of a task manager able to display it or sort processes by it.
29/37 smaps: Private Anyway, we need to count only private memory used by a backend or a worker, as all the shared is allocated by postmaster on startup. We can get the size of private memory of a process this way: $ grep '^Private' /proc/7194/smaps|awk '{a+=$2}END{print a*1024}' 7852032
30/37 smaps: Private from psql You even can get amount of private memory used by a backend from itself using SQL: do $do$ declare l_command text := $p$ cat /proc/$p$ || pg_backend_pid() || $p$/smaps $p$ || $p$ | grep '^Private' $p$ || $p$ | awk '{a+=$2}END{print a * 1024}' $p$; begin create temp table if not exists z (a int); execute 'copy z from program ' || quote_literal(l_command); raise notice '%', (select pg_size_pretty(sum(a)) from z); truncate z; end; $do$; Unfortunately it requires superuser privileges. Workaround: rewrite as a PL/Python function and mark it SECURITY DEFINER.
31/37 How is allocated RAM reclaimed?
32/37 How is allocated RAM reclaimed? And sometimes this show-me-my-RAM-usage SQL returns much more than zero: postgres=# i ~/smaps.sql psql:/home/l/smaps.sql:13: NOTICE: 892 MB DO
32/37 How is allocated RAM reclaimed? And sometimes this show-me-my-RAM-usage SQL returns much more than zero: postgres=# i ~/smaps.sql psql:/home/l/smaps.sql:13: NOTICE: 892 MB DO But there is no heavy query running? Does Postgres LEAK?!
32/37 How is allocated RAM reclaimed? And sometimes this show-me-my-RAM-usage SQL returns much more than zero: postgres=# i ~/smaps.sql psql:/home/l/smaps.sql:13: NOTICE: 892 MB DO But there is no heavy query running? Does Postgres LEAK?! Well, yes and no.
33/37 How is allocated RAM reclaimed? Postgres operates so-called memory contexts — groups of memory allocations. They can be Per-row Per-aggregate Per-node Per-query Per-backend and some other ones I believe And they are designed to "free" the memory when the correspondent object is destroyed. And they do "free", I’ve checked it.
34/37 How is allocated RAM reclaimed? Why "free", not free? Because postgres uses so-called memory allocator that optimises malloc/free calls. Sometimes some memory is freed, and it does not free it for to use next time. But not 892MB. They free(3) it, I’ve checked it.
35/37 How is allocated RAM reclaimed? Why free(3), not free? Because linux implementation of free(3) uses either heap expansion by brk() or mmap() syscall, depending on the size requested. And memory got by brk() does not get reclaimed. The threshold for the decision what to use is not fixed as well. It is initially 128Kb but Linux increases it up to 32MB adaptively depending on the process previous allocations history. Those values can be changed, as well as adaptive behaviour could be turned off using mallopt(3) or even certain environment variables. And it turned out that Postgres stopped "leaking" after it.
36/37 Questions?
37/37 Relevant ads everywhere: Used 4GB+4GB laptop DDR2 for sale, £64.95 only. For your postgres never to run OOM!

PostgreSQL and RAM usage

  • 1.
    1/37 PostgreSQL and RAMusage Alexey Bashtanov, Brandwatch 27 Feb 2017 The Skiff, Brighton
  • 2.
    2/37 One fine dayearly in the morning
  • 3.
    2/37 One fine dayearly in the morning You are woken up by SMS Bz-z-z! Something is wrong with your live system.
  • 4.
    2/37 One fine dayearly in the morning You are woken up by SMS Bz-z-z! Something is wrong with your live system. You have a look into the logs . . .
  • 5.
    3/37 One fine day DBLog: LOG: server process (PID 18742) was terminated by signal 9: Killed DETAIL: Failed process was running: some query here LOG: terminating any other active server processes FATAL: the database system is in recovery mode ... LOG: database system is ready to accept connections
  • 6.
    3/37 One fine day DBLog: LOG: server process (PID 18742) was terminated by signal 9: Killed DETAIL: Failed process was running: some query here LOG: terminating any other active server processes FATAL: the database system is in recovery mode ... LOG: database system is ready to accept connections Syslog: Out of memory: Kill process 18742 (postgres) score 669 or sacrifice child Killed process 18742 (postgres) total-vm:5670864kB, anon-rss:5401060kB, file-rss:1428kB
  • 7.
    4/37 How to avoidsuch a scenario?
  • 8.
    5/37 Outline 1 What arepostgres server processes? 2 What processes use much RAM and why? 3 What queries require much RAM? 4 How to we measure the amount of RAM used? 5 How is allocated RAM reclaimed?
  • 9.
    6/37 What are postgresserver processes?
  • 10.
    7/37 What are postgresserver processes? 9522 /usr/local/pgsql/bin/postgres -D /pg_data/9.6/main 1133 postgres: postgres postgres 127.0.0.1(51456) idle 9560 postgres: postgres postgres 127.0.0.1(49867) SELECT 9525 postgres: writer process 9524 postgres: checkpointer process 9526 postgres: wal writer process 9527 postgres: autovacuum launcher process 1981 postgres: autovacuum worker process postgres 9528 postgres: stats collector process 9529 postgres: bgworker: logical replication launcher 1807 postgres: bgworker: parallel worker for PID 9560
  • 11.
    7/37 What are postgresserver processes? -> 9522 /usr/local/pgsql/bin/postgres -D /pg_data/9.6/main 1133 postgres: postgres postgres 127.0.0.1(51456) idle 9560 postgres: postgres postgres 127.0.0.1(49867) SELECT 9525 postgres: writer process 9524 postgres: checkpointer process 9526 postgres: wal writer process 9527 postgres: autovacuum launcher process 1981 postgres: autovacuum worker process postgres 9528 postgres: stats collector process 9529 postgres: bgworker: logical replication launcher 1807 postgres: bgworker: parallel worker for PID 9560 "The" postgres server process aka postmaster Performs bootstrap Allocates shared memory including shared buffers Listens to sockets Spawns backends and other server processes
  • 12.
    7/37 What are postgresserver processes? 9522 /usr/local/pgsql/bin/postgres -D /pg_data/9.6/main -> 1133 postgres: postgres postgres 127.0.0.1(51456) idle -> 9560 postgres: postgres postgres 127.0.0.1(49867) SELECT 9525 postgres: writer process 9524 postgres: checkpointer process 9526 postgres: wal writer process 9527 postgres: autovacuum launcher process 1981 postgres: autovacuum worker process postgres 9528 postgres: stats collector process 9529 postgres: bgworker: logical replication launcher 1807 postgres: bgworker: parallel worker for PID 9560 Backend processes: these are the ones that perform queries One process per client connection, so no more than max_connections of them it total A connection pooler can be used between clients and servers to limit the number of server backends Standalone ones are Pgpool-II, pgbouncer, crunchydb
  • 13.
    7/37 What are postgresserver processes? 9522 /usr/local/pgsql/bin/postgres -D /pg_data/9.6/main 1133 postgres: postgres postgres 127.0.0.1(51456) idle 9560 postgres: postgres postgres 127.0.0.1(49867) SELECT -> 9525 postgres: writer process 9524 postgres: checkpointer process 9526 postgres: wal writer process 9527 postgres: autovacuum launcher process 1981 postgres: autovacuum worker process postgres 9528 postgres: stats collector process 9529 postgres: bgworker: logical replication launcher 1807 postgres: bgworker: parallel worker for PID 9560 Writer process aka bgwriter (8.0+) Writes dirty buffer pages to disk using LRU algorithm Aims to free buffer pages before backends run out of them But under certain circumstances, backends still have to do it by their own
  • 14.
    7/37 What are postgresserver processes? 9522 /usr/local/pgsql/bin/postgres -D /pg_data/9.6/main 1133 postgres: postgres postgres 127.0.0.1(51456) idle 9560 postgres: postgres postgres 127.0.0.1(49867) SELECT 9525 postgres: writer process -> 9524 postgres: checkpointer process 9526 postgres: wal writer process 9527 postgres: autovacuum launcher process 1981 postgres: autovacuum worker process postgres 9528 postgres: stats collector process 9529 postgres: bgworker: logical replication launcher 1807 postgres: bgworker: parallel worker for PID 9560 Checkpointer process (9.2+) Checkpoints are forced dirty disk pages flushes. Checkpointer process issues them every so often to guarantee that changes committed before certain point in time have been persisted. In case of server crash the recovery process start from the last checkpoint completed.
  • 15.
    7/37 What are postgresserver processes? 9522 /usr/local/pgsql/bin/postgres -D /pg_data/9.6/main 1133 postgres: postgres postgres 127.0.0.1(51456) idle 9560 postgres: postgres postgres 127.0.0.1(49867) SELECT 9525 postgres: writer process 9524 postgres: checkpointer process -> 9526 postgres: wal writer process 9527 postgres: autovacuum launcher process 1981 postgres: autovacuum worker process postgres 9528 postgres: stats collector process 9529 postgres: bgworker: logical replication launcher 1807 postgres: bgworker: parallel worker for PID 9560 WAL Writer process (8.3+) Writes and fsyncs WAL segments Backends could have done it by their own when synchronous_commit=on (and actually did before 8.3) When synchronous_commit=off – acutal commits get delayed no more than wal_writer_delay and processed batchwise
  • 16.
    7/37 What are postgresserver processes? 9522 /usr/local/pgsql/bin/postgres -D /pg_data/9.6/main 1133 postgres: postgres postgres 127.0.0.1(51456) idle 9560 postgres: postgres postgres 127.0.0.1(49867) SELECT 9525 postgres: writer process 9524 postgres: checkpointer process 9526 postgres: wal writer process -> 9527 postgres: autovacuum launcher process -> 1981 postgres: autovacuum worker process postgres 9528 postgres: stats collector process 9529 postgres: bgworker: logical replication launcher 1807 postgres: bgworker: parallel worker for PID 9560 Autovacuum launcher process launches autovacuum workers: To VACUUM a table when it contains rows with very old transaction ids to prevent transaction IDs wraparound To VACUUM a table when certain number of table rows were updated/deleted To ANALYZE a table when certain number of rows were inserted
  • 17.
    7/37 What are postgresserver processes? 9522 /usr/local/pgsql/bin/postgres -D /pg_data/9.6/main 1133 postgres: postgres postgres 127.0.0.1(51456) idle 9560 postgres: postgres postgres 127.0.0.1(49867) SELECT 9525 postgres: writer process 9524 postgres: checkpointer process 9526 postgres: wal writer process 9527 postgres: autovacuum launcher process 1981 postgres: autovacuum worker process postgres -> 9528 postgres: stats collector process 9529 postgres: bgworker: logical replication launcher 1807 postgres: bgworker: parallel worker for PID 9560 Statistic collector handles requests from other postgres processes to write data into pg_stat_* system catalogs
  • 18.
    7/37 What are postgresserver processes? 9522 /usr/local/pgsql/bin/postgres -D /pg_data/9.6/main 1133 postgres: postgres postgres 127.0.0.1(51456) idle 9560 postgres: postgres postgres 127.0.0.1(49867) SELECT 9525 postgres: writer process 9524 postgres: checkpointer process 9526 postgres: wal writer process 9527 postgres: autovacuum launcher process 1981 postgres: autovacuum worker process postgres 9528 postgres: stats collector process -> 9529 postgres: bgworker: logical replication launcher -> 1807 postgres: bgworker: parallel worker for PID 9560 Background workers aka bgworkers are custom processes spawned and terminated by postgres. No more than max_worker_processes of them. Can be used for Parallel query execution: backends launch them on demand Logical replication Custom add-on background jobs, such as pg_squeeze
  • 19.
    7/37 What are postgresserver processes? 9522 /usr/local/pgsql/bin/postgres -D /pg_data/9.6/main 1133 postgres: postgres postgres 127.0.0.1(51456) idle 9560 postgres: postgres postgres 127.0.0.1(49867) SELECT 9525 postgres: writer process 9524 postgres: checkpointer process 9526 postgres: wal writer process 9527 postgres: autovacuum launcher process 1981 postgres: autovacuum worker process postgres 9528 postgres: stats collector process 9529 postgres: bgworker: logical replication launcher 1807 postgres: bgworker: parallel worker for PID 9560 There might be also logger and archiver processes present. You can use syslog as a log destination, or enable postgres logging_collector. Similarly you can turn on or off archive_mode.
  • 20.
    8/37 What processes usemuch RAM and why?
  • 21.
    9/37 Shared memory Shared memoryis accessible by all postgres server processes.
  • 22.
    9/37 Shared memory Shared memoryis accessible by all postgres server processes. Normally the most part of it is shared_buffers. Postgres suggests to use 25% of your RAM, though often less values are used.
  • 23.
    9/37 Shared memory Shared memoryis accessible by all postgres server processes. Normally the most part of it is shared_buffers. Postgres suggests to use 25% of your RAM, though often less values are used. The wal_buffers are normally much smaller, 1/32 of shared_buffers is default. Anyway, you are allowed to set it to arbitrarily large value.
  • 24.
    9/37 Shared memory Shared memoryis accessible by all postgres server processes. Normally the most part of it is shared_buffers. Postgres suggests to use 25% of your RAM, though often less values are used. The wal_buffers are normally much smaller, 1/32 of shared_buffers is default. Anyway, you are allowed to set it to arbitrarily large value. The amount of memory used for table and advisory locks is about 270 × max_locks_per_transaction ×(max_connections+max_prepared_transactions) bytes You are probably safe, unless you are doing something tricky using lots advisory locks and increase max_locks_per_transaction to really large values.
  • 25.
    9/37 Shared memory Shared memoryis accessible by all postgres server processes. Normally the most part of it is shared_buffers. Postgres suggests to use 25% of your RAM, though often less values are used. The wal_buffers are normally much smaller, 1/32 of shared_buffers is default. Anyway, you are allowed to set it to arbitrarily large value. The amount of memory used for table and advisory locks is about 270 × max_locks_per_transaction ×(max_connections+max_prepared_transactions) bytes You are probably safe, unless you are doing something tricky using lots advisory locks and increase max_locks_per_transaction to really large values. Same for max_pred_locks_per_transaction — predicate locks are used only for non-default transaction isolation levels, make sure not to increase this setting too much.
  • 26.
    10/37 Autovacuum workers No morethan autovacuum_max_workers workers, each uses maintenance_work_mem or autovacuum_work_mem of RAM Ideally, your tables are not too large and your RAM is not too small, so you can afford setting autovacuum_work_mem to reflect your smallest table size Practically, you will autovacuum_work_mem to cover all the small tables in your DB, whatever that means
  • 27.
    11/37 Backends and theirbgworkers Backends and their bgworkers are the most important, as there might be quite a few of them, namely max_connections and max_workers
  • 28.
    11/37 Backends and theirbgworkers Backends and their bgworkers are the most important, as there might be quite a few of them, namely max_connections and max_workers The work_mem parameter limits the amount of RAM used per operation, i. e. per execution plan node, not per statement
  • 29.
    11/37 Backends and theirbgworkers Backends and their bgworkers are the most important, as there might be quite a few of them, namely max_connections and max_workers The work_mem parameter limits the amount of RAM used per operation, i. e. per execution plan node, not per statement It actually doesn’t work reliably . . .
  • 30.
  • 31.
    13/37 What queries requiremuch RAM? Each query has an execution plan postgres=# explain select atttypid::regclass, count(*) from pg_class join pg_attribute postgres-# on attrelid = pg_class.oid group by 1 order by 2 desc; QUERY PLAN ----------------------------------------------------------------------------------- Sort (cost=143.51..143.60 rows=39 width=12) Sort Key: (count(*)) DESC -> HashAggregate (cost=142.08..142.47 rows=39 width=12) Group Key: (pg_attribute.atttypid)::regclass -> Hash Join (cost=18.56..129.32 rows=2552 width=4) Hash Cond: (pg_attribute.attrelid = pg_class.oid) -> Seq Scan on pg_attribute (cost=0.00..75.36 rows=2636 width=8) -> Hash (cost=14.36..14.36 rows=336 width=4) -> Seq Scan on pg_class (cost=0.00..14.36 rows=336 width=4)
  • 32.
    13/37 What queries requiremuch RAM? Each query has an execution plan postgres=# explain select atttypid::regclass, count(*) from pg_class join pg_attribute postgres-# on attrelid = pg_class.oid group by 1 order by 2 desc; QUERY PLAN ----------------------------------------------------------------------------------- Sort (cost=143.51..143.60 rows=39 width=12) Sort Key: (count(*)) DESC -> HashAggregate (cost=142.08..142.47 rows=39 width=12) Group Key: (pg_attribute.atttypid)::regclass -> Hash Join (cost=18.56..129.32 rows=2552 width=4) Hash Cond: (pg_attribute.attrelid = pg_class.oid) -> Seq Scan on pg_attribute (cost=0.00..75.36 rows=2636 width=8) -> Hash (cost=14.36..14.36 rows=336 width=4) -> Seq Scan on pg_class (cost=0.00..14.36 rows=336 width=4) So, essentially the question is, what plan nodes can be memory-hungry? Right?
  • 33.
    13/37 What queries requiremuch RAM? Each query has an execution plan postgres=# explain select atttypid::regclass, count(*) from pg_class join pg_attribute postgres-# on attrelid = pg_class.oid group by 1 order by 2 desc; QUERY PLAN ----------------------------------------------------------------------------------- Sort (cost=143.51..143.60 rows=39 width=12) Sort Key: (count(*)) DESC -> HashAggregate (cost=142.08..142.47 rows=39 width=12) Group Key: (pg_attribute.atttypid)::regclass -> Hash Join (cost=18.56..129.32 rows=2552 width=4) Hash Cond: (pg_attribute.attrelid = pg_class.oid) -> Seq Scan on pg_attribute (cost=0.00..75.36 rows=2636 width=8) -> Hash (cost=14.36..14.36 rows=336 width=4) -> Seq Scan on pg_class (cost=0.00..14.36 rows=336 width=4) So, essentially the question is, what plan nodes can be memory-hungry? Right? Not exactly. Also we need to track the situations when there are too many nodes in a plan!
  • 34.
    14/37 What execution plannodes might require much RAM?
  • 35.
    15/37 Nodes: stream-like Some nodesare more or less stream-like. They don’t accumulate data from underlying nodes and produce nodes one by one, so they have no chance to allocate too much memory. Examples of such nodes include Sequential scan, Index Scan Nested Loop and Merge Join Append and Merge Append Unique (of a sorted input) Sounds safe?
  • 36.
    15/37 Nodes: stream-like Some nodesare more or less stream-like. They don’t accumulate data from underlying nodes and produce nodes one by one, so they have no chance to allocate too much memory. Examples of such nodes include Sequential scan, Index Scan Nested Loop and Merge Join Append and Merge Append Unique (of a sorted input) Sounds safe? Even a single row can be quite large. Maximal size for individual postgres value is around 1GB, so this query requires 5GB: WITH cte_1g as (select repeat('a', 1024*1024*1024 - 100) as a1g) SELECT * FROM cte_1g a, cte_1g b, cte_1g c, cte_1g d, cte_1g e;
  • 37.
    16/37 Nodes: controlled Some ofthe other nodes actively use RAM but control the amount used. They have a fallback behaviour to switch to if they realise they cannot fit work_mem. Sort node switches from quicksort to sort-on-disk CTE and materialize nodes use temporary files if needed Group Aggregation with DISTINCT keyword can use temporary files Beware of out of disk space problems.
  • 38.
    16/37 Nodes: controlled Some ofthe other nodes actively use RAM but control the amount used. They have a fallback behaviour to switch to if they realise they cannot fit work_mem. Sort node switches from quicksort to sort-on-disk CTE and materialize nodes use temporary files if needed Group Aggregation with DISTINCT keyword can use temporary files Beware of out of disk space problems. Also Exact Bitmap Scan falls back to Lossy Bitmap Scan Hash Join switches to batchwise processing if it encounters more data than expected
  • 39.
    17/37 Nodes: unsafe They areHash Agg, hashed SubPlan and (rarely) Hash Join can use unlimited amount of RAM. Optimizer normally avoids them when it estimates them to process huge sets, but it can easily be wrong. How to make the estimates wrong: CREATE TABLE t (a int, b int); INSERT INTO t SELECT 0, b from generate_series(1, (10^7)::int) b; ANALYZE t; INSERT INTO t SELECT 1, b from generate_series(1, (5*10^5)::int) b; After this, autovacuum won’t update stats, as it treats the second insert as small w r. t. the number of rows already present. postgres=# EXPLAIN (ANALYZE, TIMING OFF) SELECT * FROM t WHERE a = 1; QUERY PLAN ----------------------------------------------------------------------------------- Seq Scan on t (cost=0.00..177712.39 rows=1 width=8) (rows=500000 loops=1) Filter: (a = 1) Rows Removed by Filter: 10000000 Planning time: 0.059 ms Execution time: 769.508 ms
  • 40.
    18/37 Unsafe nodes: hashedSubPlan Then we run the following query postgres=# EXPLAIN (ANALYZE, TIMING OFF) postgres-# SELECT * FROM t WHERE b NOT IN (SELECT b FROM t WHERE a = 1); QUERY PLAN --------------------------------------------------------------------------------------------- Seq Scan on t (cost=177712.39..355424.78 rows=5250056 width=8) (actual rows=9500000 loops=1) Filter: (NOT (hashed SubPlan 1)) Rows Removed by Filter: 1000000 SubPlan 1 -> Seq Scan on t t_1 (cost=0.00..177712.39 rows=1 width=4) (actual rows=500000 loops=1) Filter: (a = 1) Rows Removed by Filter: 10000000 Planning time: 0.126 ms Execution time: 3239.730 ms and get a half-million set hashed. The backend used 60MB of RAM while work_mem was only 4MB. Sounds not too bad, but . . .
  • 41.
    19/37 Unsafe nodes: hashedSubPlan and partitioned table For a partitioned table it hashes the same condition separately for each partition! postgres=# EXPLAIN SELECT * FROM t WHERE b NOT IN (SELECT b FROM t1 WHERE a = 1); QUERY PLAN -------------------------------------------------------------------------- Append (cost=135449.03..1354758.02 rows=3567432 width=8) -> Seq Scan on t (cost=135449.03..135449.03 rows=1 width=8) Filter: (NOT (hashed SubPlan 1)) SubPlan 1 -> Seq Scan on t1 t1_1 (cost=0.00..135449.03 rows=1 width=4) Filter: (a = 1) -> Seq Scan on t2 (cost=135449.03..135487.28 rows=1130 width=8) Filter: (NOT (hashed SubPlan 1)) -> Seq Scan on t3 (cost=135449.03..135487.28 rows=1130 width=8) Filter: (NOT (hashed SubPlan 1)) -> Seq Scan on t4 (cost=135449.03..135487.28 rows=1130 width=8) Filter: (NOT (hashed SubPlan 1)) -> Seq Scan on t5 (cost=135449.03..135487.28 rows=1130 width=8) Filter: (NOT (hashed SubPlan 1)) -> Seq Scan on t6 (cost=135449.03..135487.28 rows=1130 width=8) Filter: (NOT (hashed SubPlan 1)) -> Seq Scan on t7 (cost=135449.03..135487.28 rows=1130 width=8) Filter: (NOT (hashed SubPlan 1)) -> Seq Scan on t8 (cost=135449.03..135487.28 rows=1130 width=8) Filter: (NOT (hashed SubPlan 1)) -> Seq Scan on t1 (cost=135449.03..270898.05 rows=3559521 width=8) Filter: (NOT (hashed SubPlan 1)) This is going to be fixed in PostgreSQL 10
  • 42.
    20/37 Unsafe nodes: hashedSubPlan and partitioned table For now the workaround is to use dirty hacks: postgres=# explain postgres-# SELECT * FROM (TABLE t OFFSET 0) s WHERE b NOT IN (SELECT b FROM t1 WHERE a = 1); QUERY PLAN ------------------------------------------------------------------------- Subquery Scan on _ (cost=135449.03..342514.44 rows=3567432 width=8) Filter: (NOT (hashed SubPlan 1)) -> Append (cost=0.00..117879.62 rows=7134863 width=8) -> Seq Scan on t (cost=0.00..0.00 rows=1 width=8) -> Seq Scan on t2 (cost=0.00..32.60 rows=2260 width=8) -> Seq Scan on t3 (cost=0.00..32.60 rows=2260 width=8) -> Seq Scan on t4 (cost=0.00..32.60 rows=2260 width=8) -> Seq Scan on t5 (cost=0.00..32.60 rows=2260 width=8) -> Seq Scan on t6 (cost=0.00..32.60 rows=2260 width=8) -> Seq Scan on t7 (cost=0.00..32.60 rows=2260 width=8) -> Seq Scan on t8 (cost=0.00..32.60 rows=2260 width=8) -> Seq Scan on t1 (cost=0.00..117651.42 rows=7119042 width=8) SubPlan 1 -> Seq Scan on t1 t1_1 (cost=0.00..135449.03 rows=1 width=4) Filter: (a = 1) Memory usage was reduced 9 times, also it works much faster.
  • 43.
    21/37 Unsafe nodes: HashAggregation Estimates for groupping are sometimes unreliable at all. Random numbers chosen by a fair dice roll: postgres=# explain (analyze, timing off) select b, count(*) postgres-# from (table t union all table t) u group by 1; QUERY PLAN ------------------------------------------------------------------- HashAggregate (... rows=200 ... ) (actual rows=10000000 ...) Group Key: t.b -> Append (... rows=19999954 ...) (actual rows=20000000 ...) -> Seq Scan on t (... rows=9999977 ... ) (actual ... ) -> Seq Scan on t t_1 (... rows=9999977 ... ) (actual ... ) Planning time: 0.141 ms Execution time: 14523.303 ms . . . and uses several gigs of RAM for the hash table!
  • 44.
    22/37 Unsafe nodes: HashJoin Hash Joins can use more memory than expected if there are many collisions on the hashed side: postgres=# explain (analyze, costs off) postgres-# select * from t t1 join t t2 on t1.b = t2.b where t1.a = 1; QUERY PLAN -------------------------------------------------------------------------------------------- Hash Join (actual time=873.321..4223.080 rows=1000000 loops=1) Hash Cond: (t2.b = t1.b) -> Seq Scan on t t2 (actual time=0.048..755.195 rows=10500000 loops=1) -> Hash (actual time=873.163..873.163 rows=500000 loops=1) Buckets: 131072 (originally 1024) Batches: 8 (originally 1) Memory Usage: 3465kB -> Seq Scan on t t1 (actual time=748.700..803.665 rows=500000 loops=1) Filter: (a = 1) Rows Removed by Filter: 10000000 postgres=# explain (analyze, costs off) postgres-# select * from t t1 join t t2 on t1.b % 1 = t2.b where t1.a = 1; QUERY PLAN --------------------------------------------------------------------------------------------- Hash Join (actual time=3542.413..3542.413 rows=0 loops=1) Hash Cond: (t2.b = (t1.b % 1)) -> Seq Scan on t t2 (actual time=0.053..732.095 rows=10500000 loops=1) -> Hash (actual time=888.131..888.131 rows=500000 loops=1) Buckets: 131072 (originally 1024) Batches: 2 (originally 1) Memory Usage: 19532kB -> Seq Scan on t t1 (actual time=753.244..812.959 rows=500000 loops=1) Filter: (a = 1) Rows Removed by Filter: 10000000
  • 45.
    23/37 Unsafe nodes: array_agg Andjust one more random fact. array_agg used at least 1Kb per array before a fix in Postgres 9.5 Funny, isn’t it: on small arrays array_agg_distinct from count_distinct extension is faster than built-in array_agg.
  • 46.
    24/37 How to wemeasure the amount of RAM used?
  • 47.
    25/37 How to wemeasure the amount of RAM used? top? ps?
  • 48.
    25/37 How to wemeasure the amount of RAM used? top? ps? htop? atop?
  • 49.
    25/37 How to wemeasure the amount of RAM used? top? ps? htop? atop? No. They show private and shared memory together.
  • 50.
    25/37 How to wemeasure the amount of RAM used? top? ps? htop? atop? No. They show private and shared memory together. We have to look into /proc filesystem, namely /proc/pid/smaps
  • 51.
    26/37 smaps /proc/7194/smaps comprises afew sections like this .... 0135f000-0a0bf000 rw-p 00000000 00:00 0 [heap] Size: 144768 kB Rss: 136180 kB Pss: 136180 kB Shared_Clean: 0 kB Shared_Dirty: 0 kB Private_Clean: 0 kB Private_Dirty: 136180 kB Referenced: 114936 kB Anonymous: 136180 kB AnonHugePages: 2048 kB Swap: 0 kB KernelPageSize: 4 kB MMUPageSize: 4 kB Locked: 0 kB VmFlags: rd wr mr mw me ac sd .... which is a private memory segment . . .
  • 52.
    27/37 smaps . . .or this .... 7f8ce656a000-7f8cef300000 rw-s 00000000 00:04 7334558 /dev/zero (deleted) Size: 144984 kB Rss: 75068 kB Pss: 38025 kB Shared_Clean: 0 kB Shared_Dirty: 73632 kB Private_Clean: 0 kB Private_Dirty: 1436 kB Referenced: 75068 kB Anonymous: 0 kB AnonHugePages: 0 kB Swap: 0 kB KernelPageSize: 4 kB MMUPageSize: 4 kB Locked: 0 kB VmFlags: rd wr sh mr mw me ms sd .... which looks like part of shared buffers. BTW what is PSS?
  • 53.
    28/37 smaps: PSS PSS standsfor proportional set size For each private allocated memory chunk we count its size as is We divide the size of a shared memory chunk by the number of processes that use it
  • 54.
    28/37 smaps: PSS PSS standsfor proportional set size For each private allocated memory chunk we count its size as is We divide the size of a shared memory chunk by the number of processes that use it pid PSS(pid) = total memory used!
  • 55.
    28/37 smaps: PSS PSS standsfor proportional set size For each private allocated memory chunk we count its size as is We divide the size of a shared memory chunk by the number of processes that use it pid PSS(pid) = total memory used! PSS support was added to Linux kernel in 2007, but I’m not aware of a task manager able to display it or sort processes by it.
  • 56.
    29/37 smaps: Private Anyway, weneed to count only private memory used by a backend or a worker, as all the shared is allocated by postmaster on startup. We can get the size of private memory of a process this way: $ grep '^Private' /proc/7194/smaps|awk '{a+=$2}END{print a*1024}' 7852032
  • 57.
    30/37 smaps: Private frompsql You even can get amount of private memory used by a backend from itself using SQL: do $do$ declare l_command text := $p$ cat /proc/$p$ || pg_backend_pid() || $p$/smaps $p$ || $p$ | grep '^Private' $p$ || $p$ | awk '{a+=$2}END{print a * 1024}' $p$; begin create temp table if not exists z (a int); execute 'copy z from program ' || quote_literal(l_command); raise notice '%', (select pg_size_pretty(sum(a)) from z); truncate z; end; $do$; Unfortunately it requires superuser privileges. Workaround: rewrite as a PL/Python function and mark it SECURITY DEFINER.
  • 58.
    31/37 How is allocatedRAM reclaimed?
  • 59.
    32/37 How is allocatedRAM reclaimed? And sometimes this show-me-my-RAM-usage SQL returns much more than zero: postgres=# i ~/smaps.sql psql:/home/l/smaps.sql:13: NOTICE: 892 MB DO
  • 60.
    32/37 How is allocatedRAM reclaimed? And sometimes this show-me-my-RAM-usage SQL returns much more than zero: postgres=# i ~/smaps.sql psql:/home/l/smaps.sql:13: NOTICE: 892 MB DO But there is no heavy query running? Does Postgres LEAK?!
  • 61.
    32/37 How is allocatedRAM reclaimed? And sometimes this show-me-my-RAM-usage SQL returns much more than zero: postgres=# i ~/smaps.sql psql:/home/l/smaps.sql:13: NOTICE: 892 MB DO But there is no heavy query running? Does Postgres LEAK?! Well, yes and no.
  • 62.
    33/37 How is allocatedRAM reclaimed? Postgres operates so-called memory contexts — groups of memory allocations. They can be Per-row Per-aggregate Per-node Per-query Per-backend and some other ones I believe And they are designed to "free" the memory when the correspondent object is destroyed. And they do "free", I’ve checked it.
  • 63.
    34/37 How is allocatedRAM reclaimed? Why "free", not free? Because postgres uses so-called memory allocator that optimises malloc/free calls. Sometimes some memory is freed, and it does not free it for to use next time. But not 892MB. They free(3) it, I’ve checked it.
  • 64.
    35/37 How is allocatedRAM reclaimed? Why free(3), not free? Because linux implementation of free(3) uses either heap expansion by brk() or mmap() syscall, depending on the size requested. And memory got by brk() does not get reclaimed. The threshold for the decision what to use is not fixed as well. It is initially 128Kb but Linux increases it up to 32MB adaptively depending on the process previous allocations history. Those values can be changed, as well as adaptive behaviour could be turned off using mallopt(3) or even certain environment variables. And it turned out that Postgres stopped "leaking" after it.
  • 65.
  • 66.
    37/37 Relevant ads everywhere: Used4GB+4GB laptop DDR2 for sale, £64.95 only. For your postgres never to run OOM!