Data Acquisition : Dataacquisition refers to the process of collecting and measuring data from various sources for further processing, analysis, and storage. Sources of data: 1)Sensors, IoT devices 2) Databases 3)APIs 4)Web scraping 5) Surveys, logs, social media Steps in Data Acquisition: 1. Identify data sources (internal or external). 2. Collect data (manual entry, automated tools, IoT, APIs). 3. Digitize data (if raw/physical). 4. Pre-process data (cleaning, filtering, noise removal). 5. Store data in structured (databases) or unstructured (data lakes) formats.
3.
• Tools/Technologies: • IoTData Acquisition systems • Apache Kafka, Flume (streaming data collection) • ETL (Extract, Transform, Load) tools like Talend, Informatica Data Integration : Data integration means combining data from multiple heterogeneous sources into a single unified view for analysis and decision-making. Challenges in Integration: • Different formats (CSV, JSON, XML, DB tables) • Different structures (structured vs unstructured) • Data redundancy, inconsistency, duplication Steps in Data Integration: 1. Extract – Pull data from different sources. 2. Transform – Clean, normalize, and format data. 3. Load – Store into a centralized repository (Data warehouse, Data lake).
4.
• Types ofIntegration: . ETL (Extract, Transform, Load): Batch processing. • ELT (Extract, Load, Transform): Used in modern big data. • Data Virtualization: Access data without moving it. • API-based Integration: Real-time integration. .Tools/Technologies: • Informatica, Talend, Apache Nifi • Microsoft SSIS (SQL Server Integration Services) • Pentaho, Airbyte • Cloud: AWS Glue, Google Dataflow, Azure Data Factory . Importance • Helps in building data warehouses and data lakes. • Enables business intelligence (BI) and analytics. • Ensures data consistency and quality. • Supports decision-making and predictive modeling.
5.
Data Acquisition =Collecting data from different sources. Data Integration = Combining collected data into one consistent, usable form.
6.
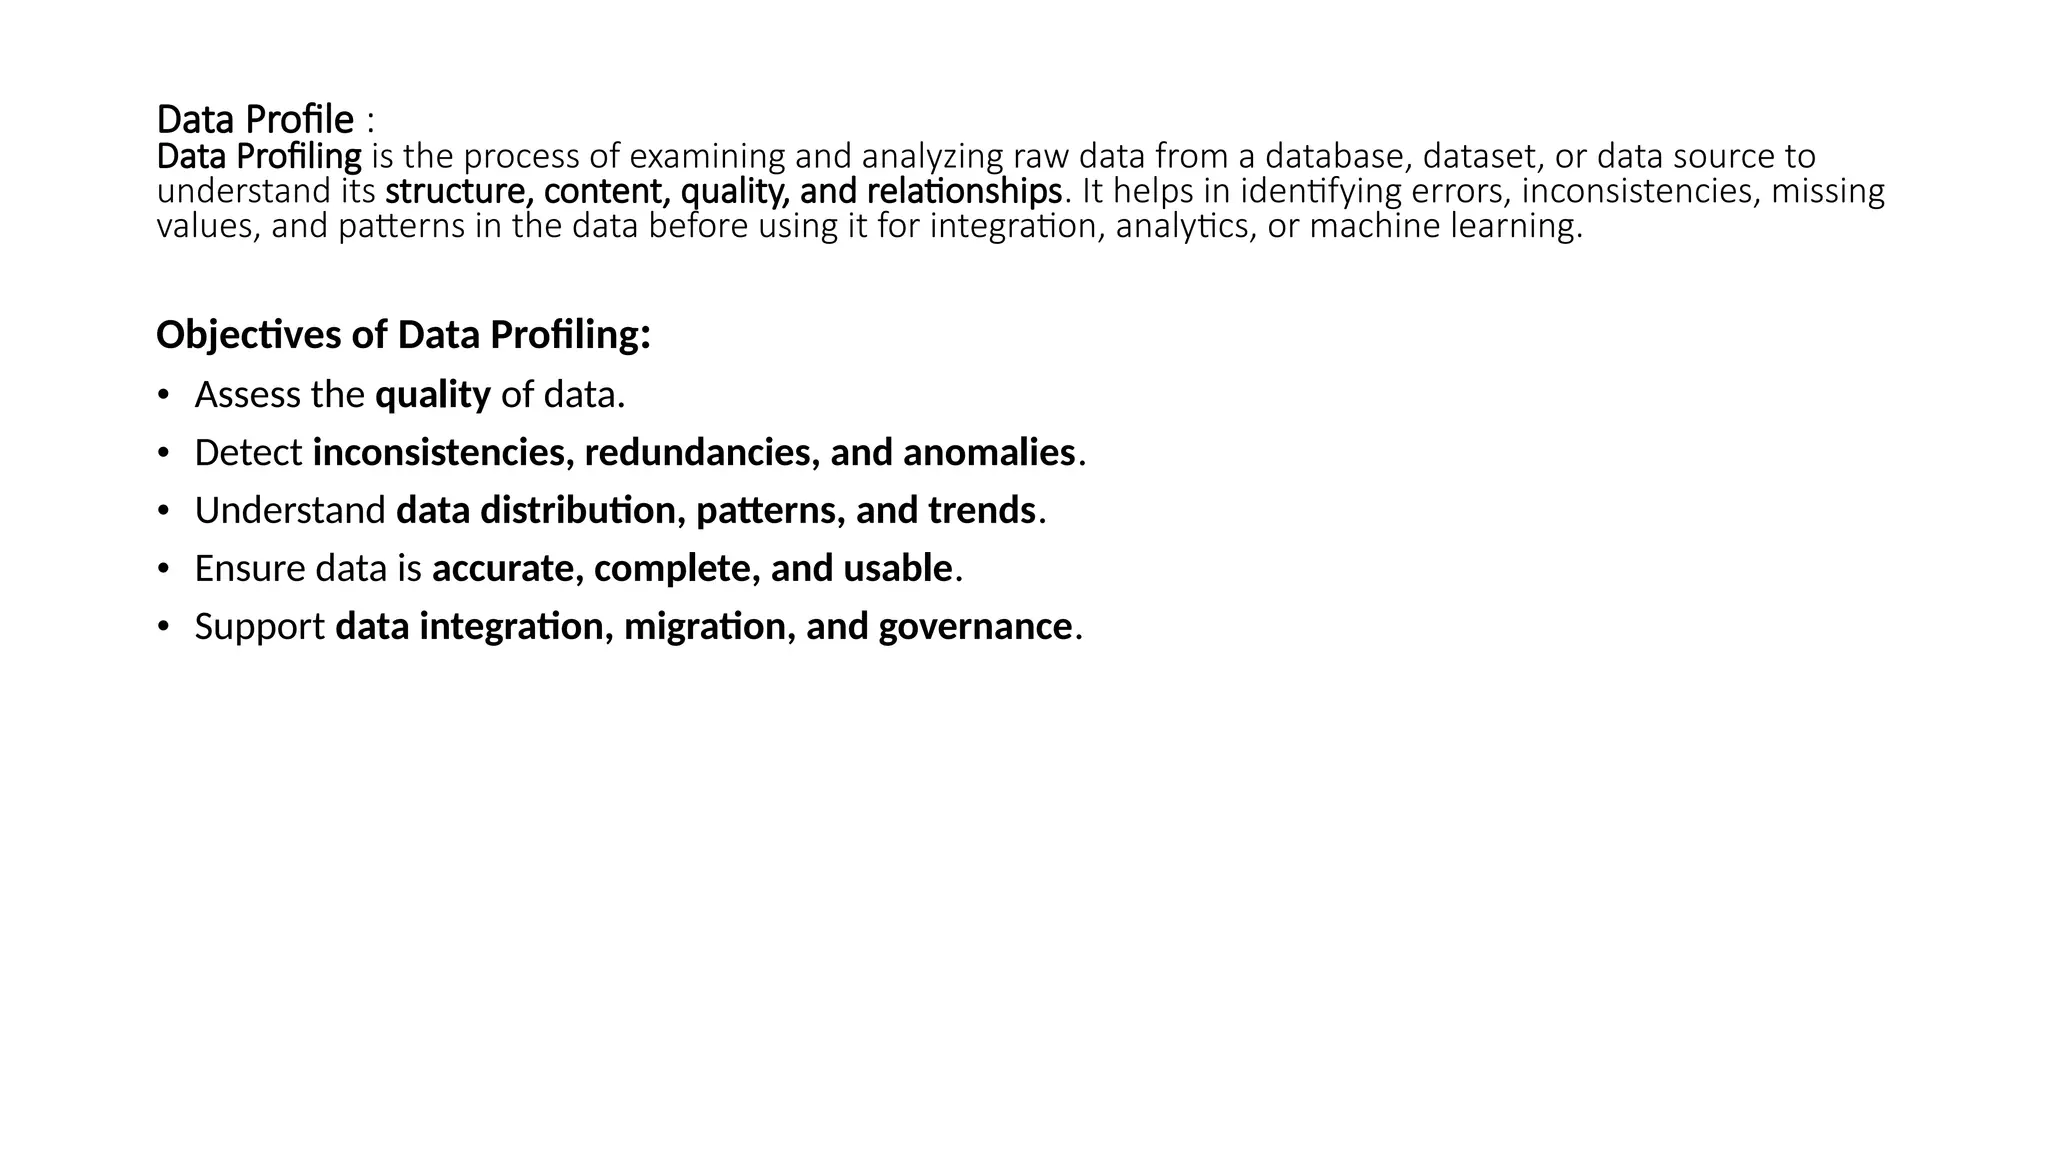
Data Profile : DataProfiling is the process of examining and analyzing raw data from a database, dataset, or data source to understand its structure, content, quality, and relationships. It helps in identifying errors, inconsistencies, missing values, and patterns in the data before using it for integration, analytics, or machine learning. Objectives of Data Profiling: • Assess the quality of data. • Detect inconsistencies, redundancies, and anomalies. • Understand data distribution, patterns, and trends. • Ensure data is accurate, complete, and usable. • Support data integration, migration, and governance.
7.
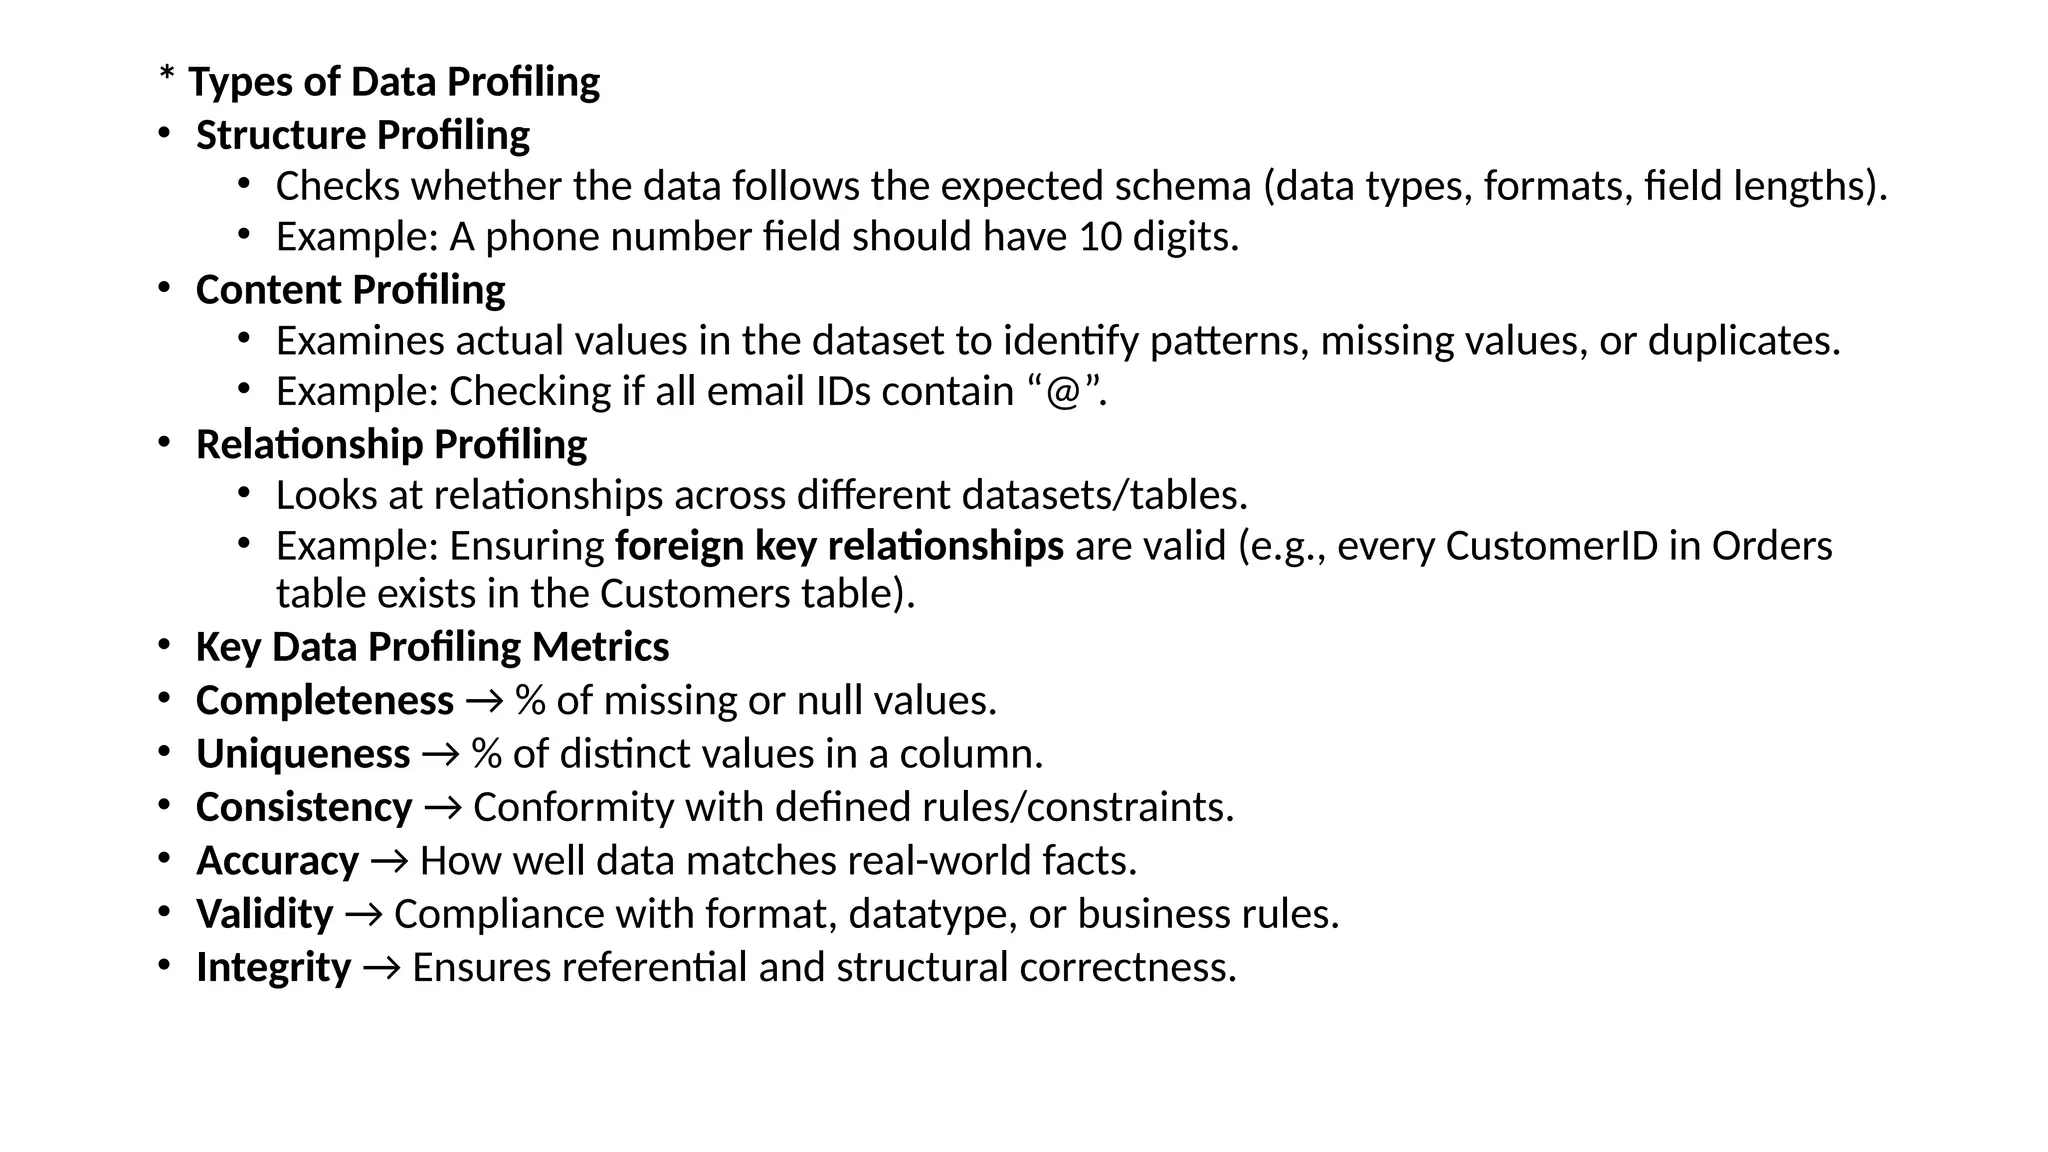
* Types ofData Profiling • Structure Profiling • Checks whether the data follows the expected schema (data types, formats, field lengths). • Example: A phone number field should have 10 digits. • Content Profiling • Examines actual values in the dataset to identify patterns, missing values, or duplicates. • Example: Checking if all email IDs contain “@”. • Relationship Profiling • Looks at relationships across different datasets/tables. • Example: Ensuring foreign key relationships are valid (e.g., every CustomerID in Orders table exists in the Customers table). • Key Data Profiling Metrics • Completeness → % of missing or null values. • Uniqueness → % of distinct values in a column. • Consistency → Conformity with defined rules/constraints. • Accuracy → How well data matches real-world facts. • Validity → Compliance with format, datatype, or business rules. • Integrity → Ensures referential and structural correctness.
8.
• Example: • Afitness tracker acquires data from body sensors (heart rate, steps, calories burned), transfers it to a mobile app, and stores it in a cloud database for further analysis.
9.
• Validation inData Acquisition & Integration • Validation means checking the correctness, accuracy, consistency, and quality of data before using it for analysis, storage, or model training. It ensures that the collected data is reliable and useful. • 🔑 Types of Validation • Format Validation • Checks whether data is in the required format. • Example: Email → abc@example.com, Date → DD/MM/YYYY. • Range Validation • Ensures data falls within an acceptable range. • Example: Age must be between 0–120. • Consistency Validation • Compares data across sources or within datasets. • Example: Start date should not be later than end date. • Uniqueness Validation • Prevents duplicate records. • Example: Employee ID or Aadhaar number should be unique. • Completeness Validation • Ensures no important fields are missing. • Example: Customer record must have Name, Email, and Phone. • Business Rule Validation • Checks rules defined by the organization. • Example: A loan application requires income ≥ minimum threshold.
10.
. Validation inPractice • During data entry → Real-time checks (forms, APIs). • During ETL (Extract-Transform-Load) → Validation before loading into database. • During machine learning preprocessing → Check missing values, outliers, wrong types.
11.
• Techniques Used •Frequency distribution analysis. • Pattern and regex matching. • Outlier detection. • Statistical summaries (mean, median, mode, standard deviation). • Referential integrity checks. • Applications of Data Profiling • ETL (Extract, Transform, Load) process → to clean before integration. • Data migration projects → ensure old data fits new system rules. • Data quality management → improve trust in data. • Business Intelligence & Analytics → accurate decision-making. • Machine Learning → better feature engineering.
12.
Data Quality Mettrics: •Data Quality Metrics are measurements used to assess the quality of data in a database, dataset, or system. These metrics help organizations ensure that data is accurate, complete, consistent, and reliable for analytics, reporting, or decision-making. • Key Data Quality Metrics • Completeness • Measures whether all required data is present. • Formula: • Example: If 95 out of 100 customer email fields are filled → 95% completeness. • Accuracy • Measures how well data represents real-world facts. • Example: A customer’s phone number or address should match reality. • Usually validated against trusted sources or reference datasets.
13.
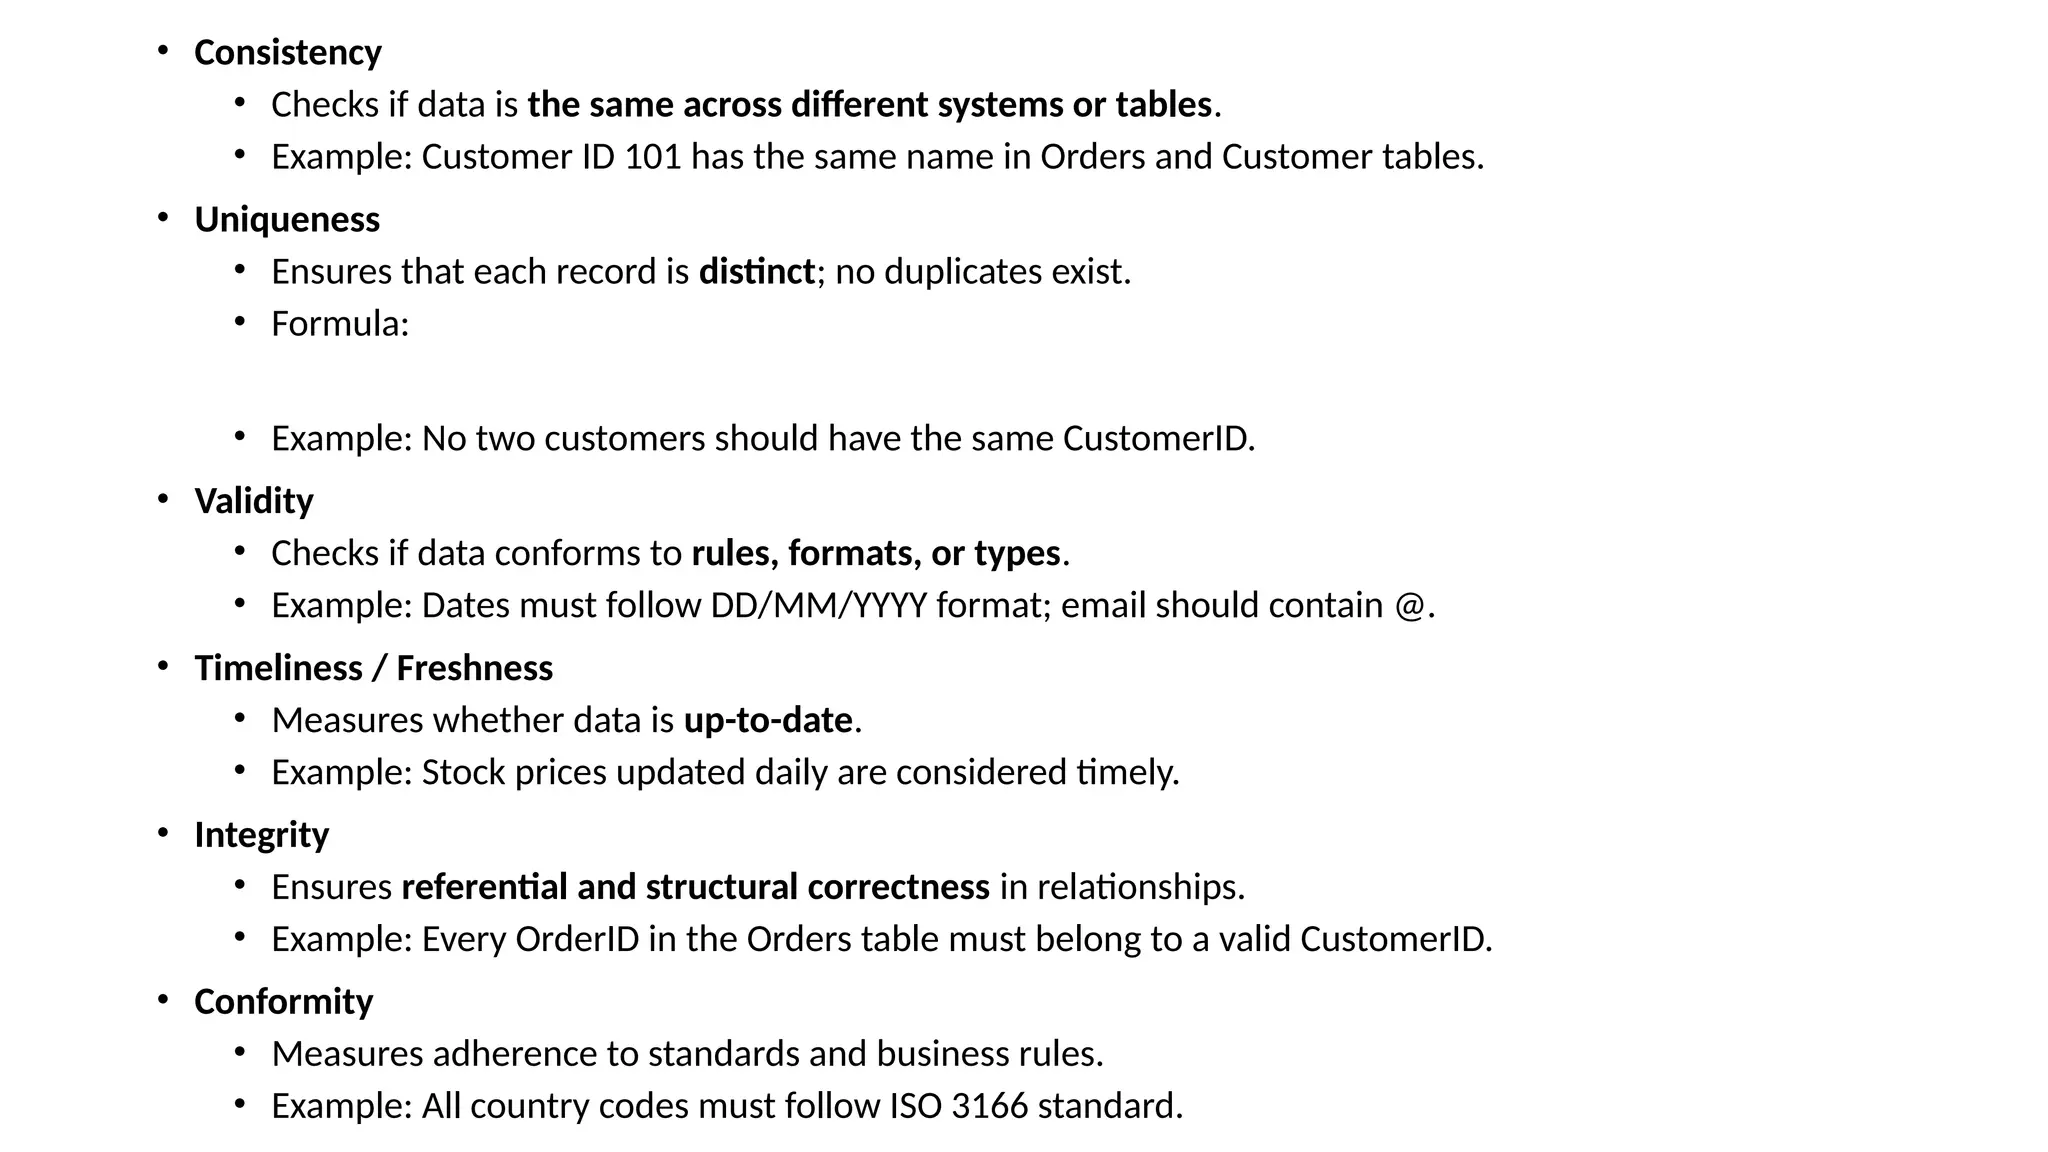
• Consistency • Checksif data is the same across different systems or tables. • Example: Customer ID 101 has the same name in Orders and Customer tables. • Uniqueness • Ensures that each record is distinct; no duplicates exist. • Formula: • Example: No two customers should have the same CustomerID. • Validity • Checks if data conforms to rules, formats, or types. • Example: Dates must follow DD/MM/YYYY format; email should contain @. • Timeliness / Freshness • Measures whether data is up-to-date. • Example: Stock prices updated daily are considered timely. • Integrity • Ensures referential and structural correctness in relationships. • Example: Every OrderID in the Orders table must belong to a valid CustomerID. • Conformity • Measures adherence to standards and business rules. • Example: All country codes must follow ISO 3166 standard.
14.
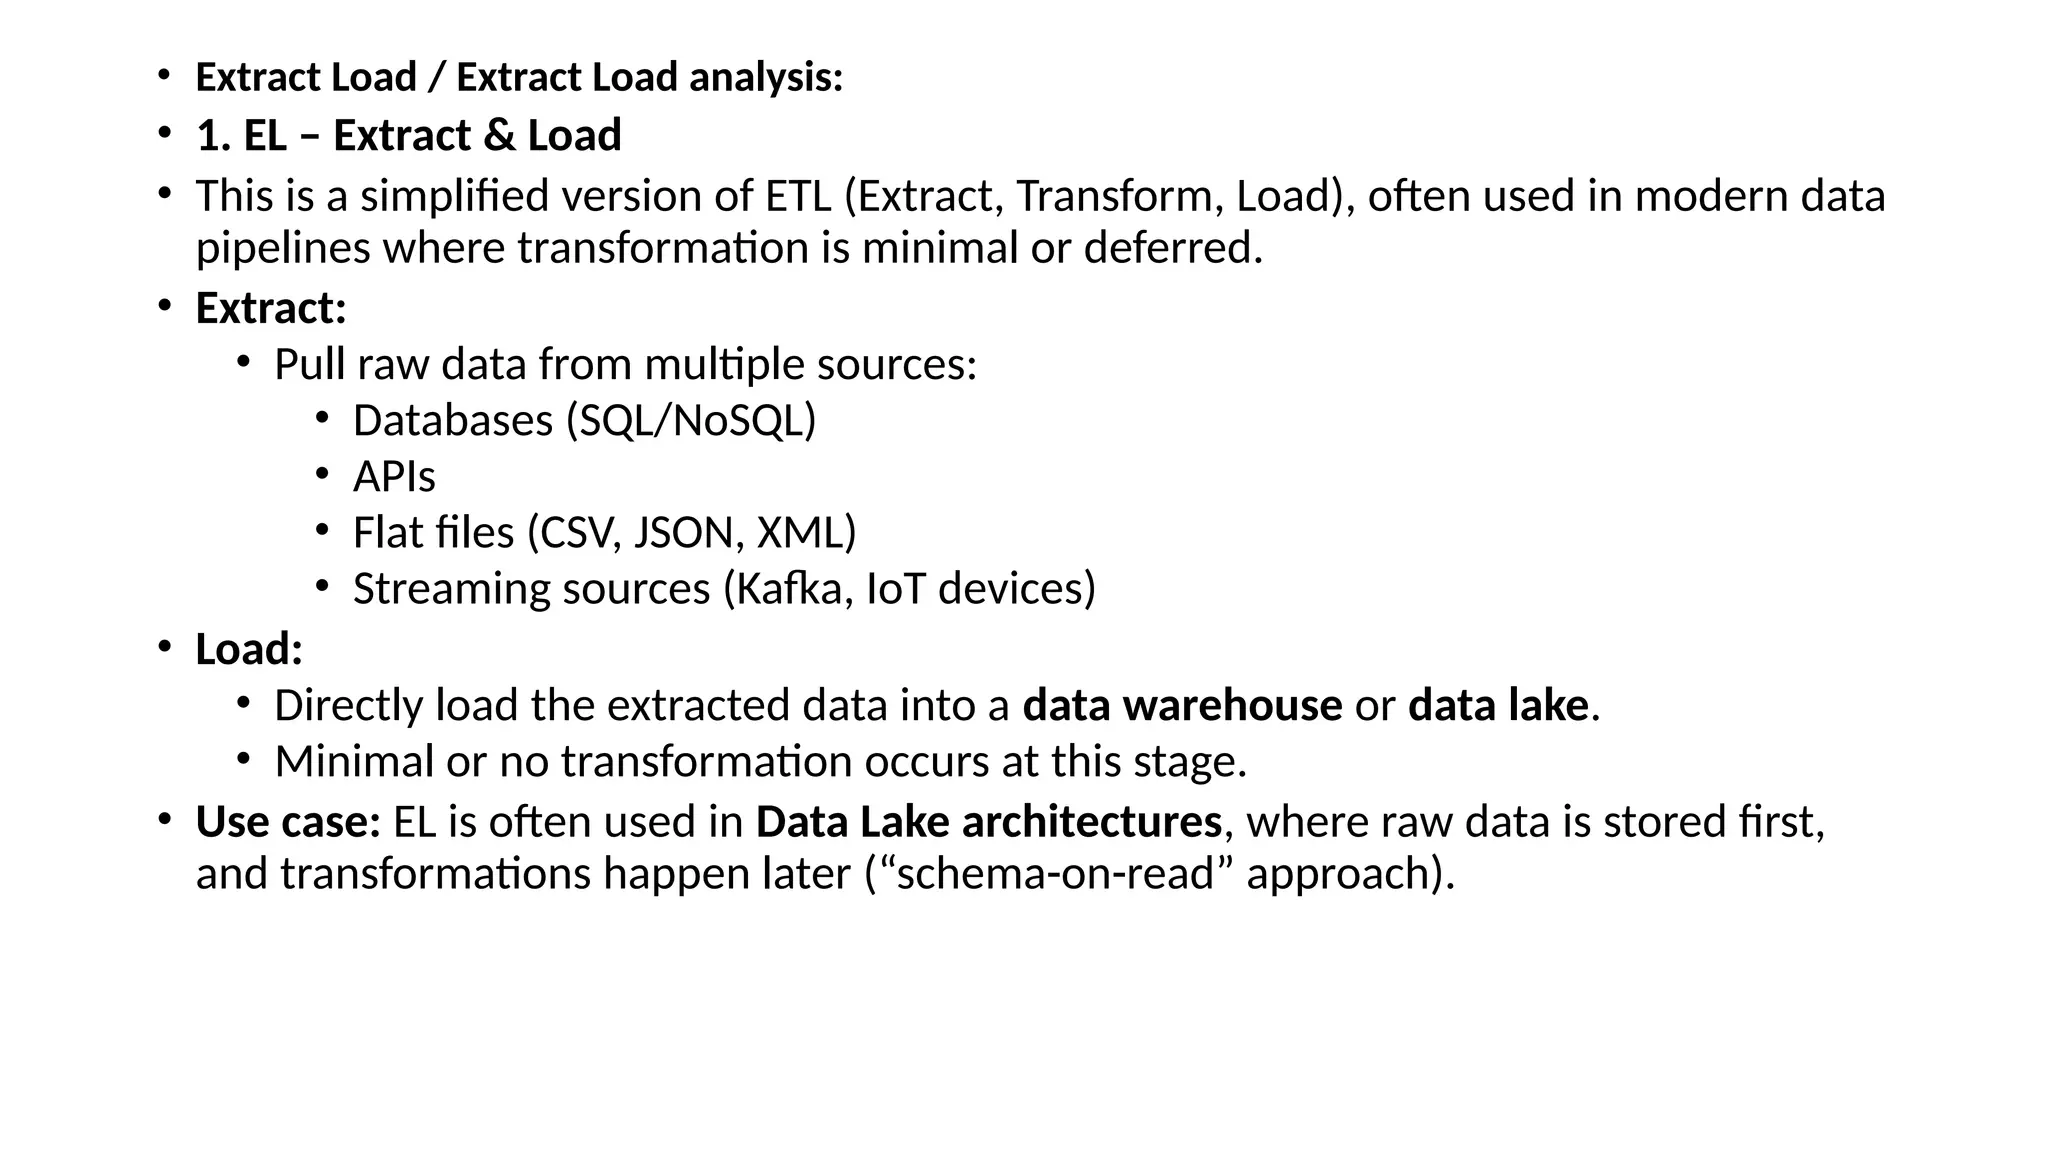
• Extract Load/ Extract Load analysis: • 1. EL – Extract & Load • This is a simplified version of ETL (Extract, Transform, Load), often used in modern data pipelines where transformation is minimal or deferred. • Extract: • Pull raw data from multiple sources: • Databases (SQL/NoSQL) • APIs • Flat files (CSV, JSON, XML) • Streaming sources (Kafka, IoT devices) • Load: • Directly load the extracted data into a data warehouse or data lake. • Minimal or no transformation occurs at this stage. • Use case: EL is often used in Data Lake architectures, where raw data is stored first, and transformations happen later (“schema-on-read” approach).
15.
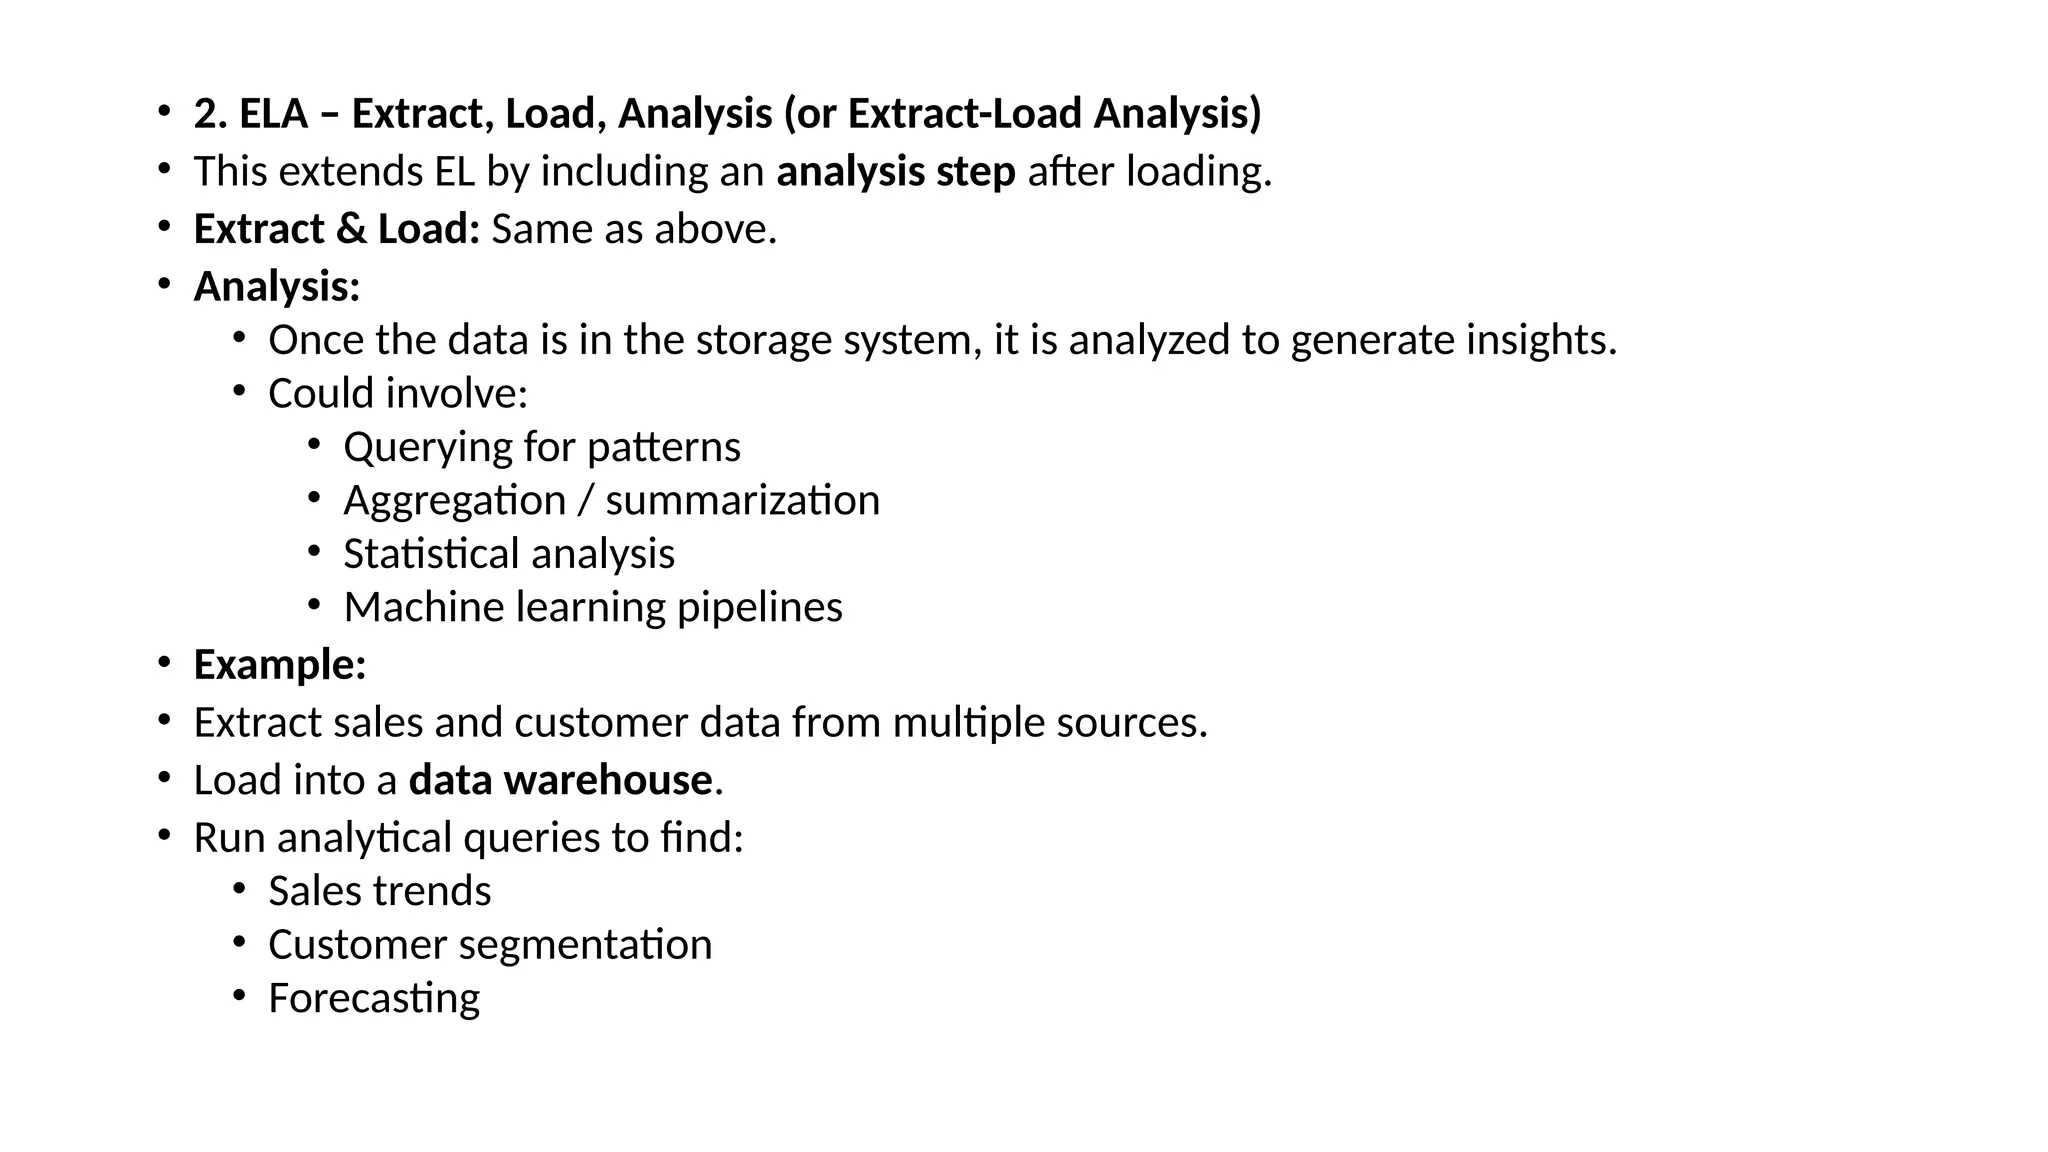
• 2. ELA– Extract, Load, Analysis (or Extract-Load Analysis) • This extends EL by including an analysis step after loading. • Extract & Load: Same as above. • Analysis: • Once the data is in the storage system, it is analyzed to generate insights. • Could involve: • Querying for patterns • Aggregation / summarization • Statistical analysis • Machine learning pipelines • Example: • Extract sales and customer data from multiple sources. • Load into a data warehouse. • Run analytical queries to find: • Sales trends • Customer segmentation • Forecasting
16.
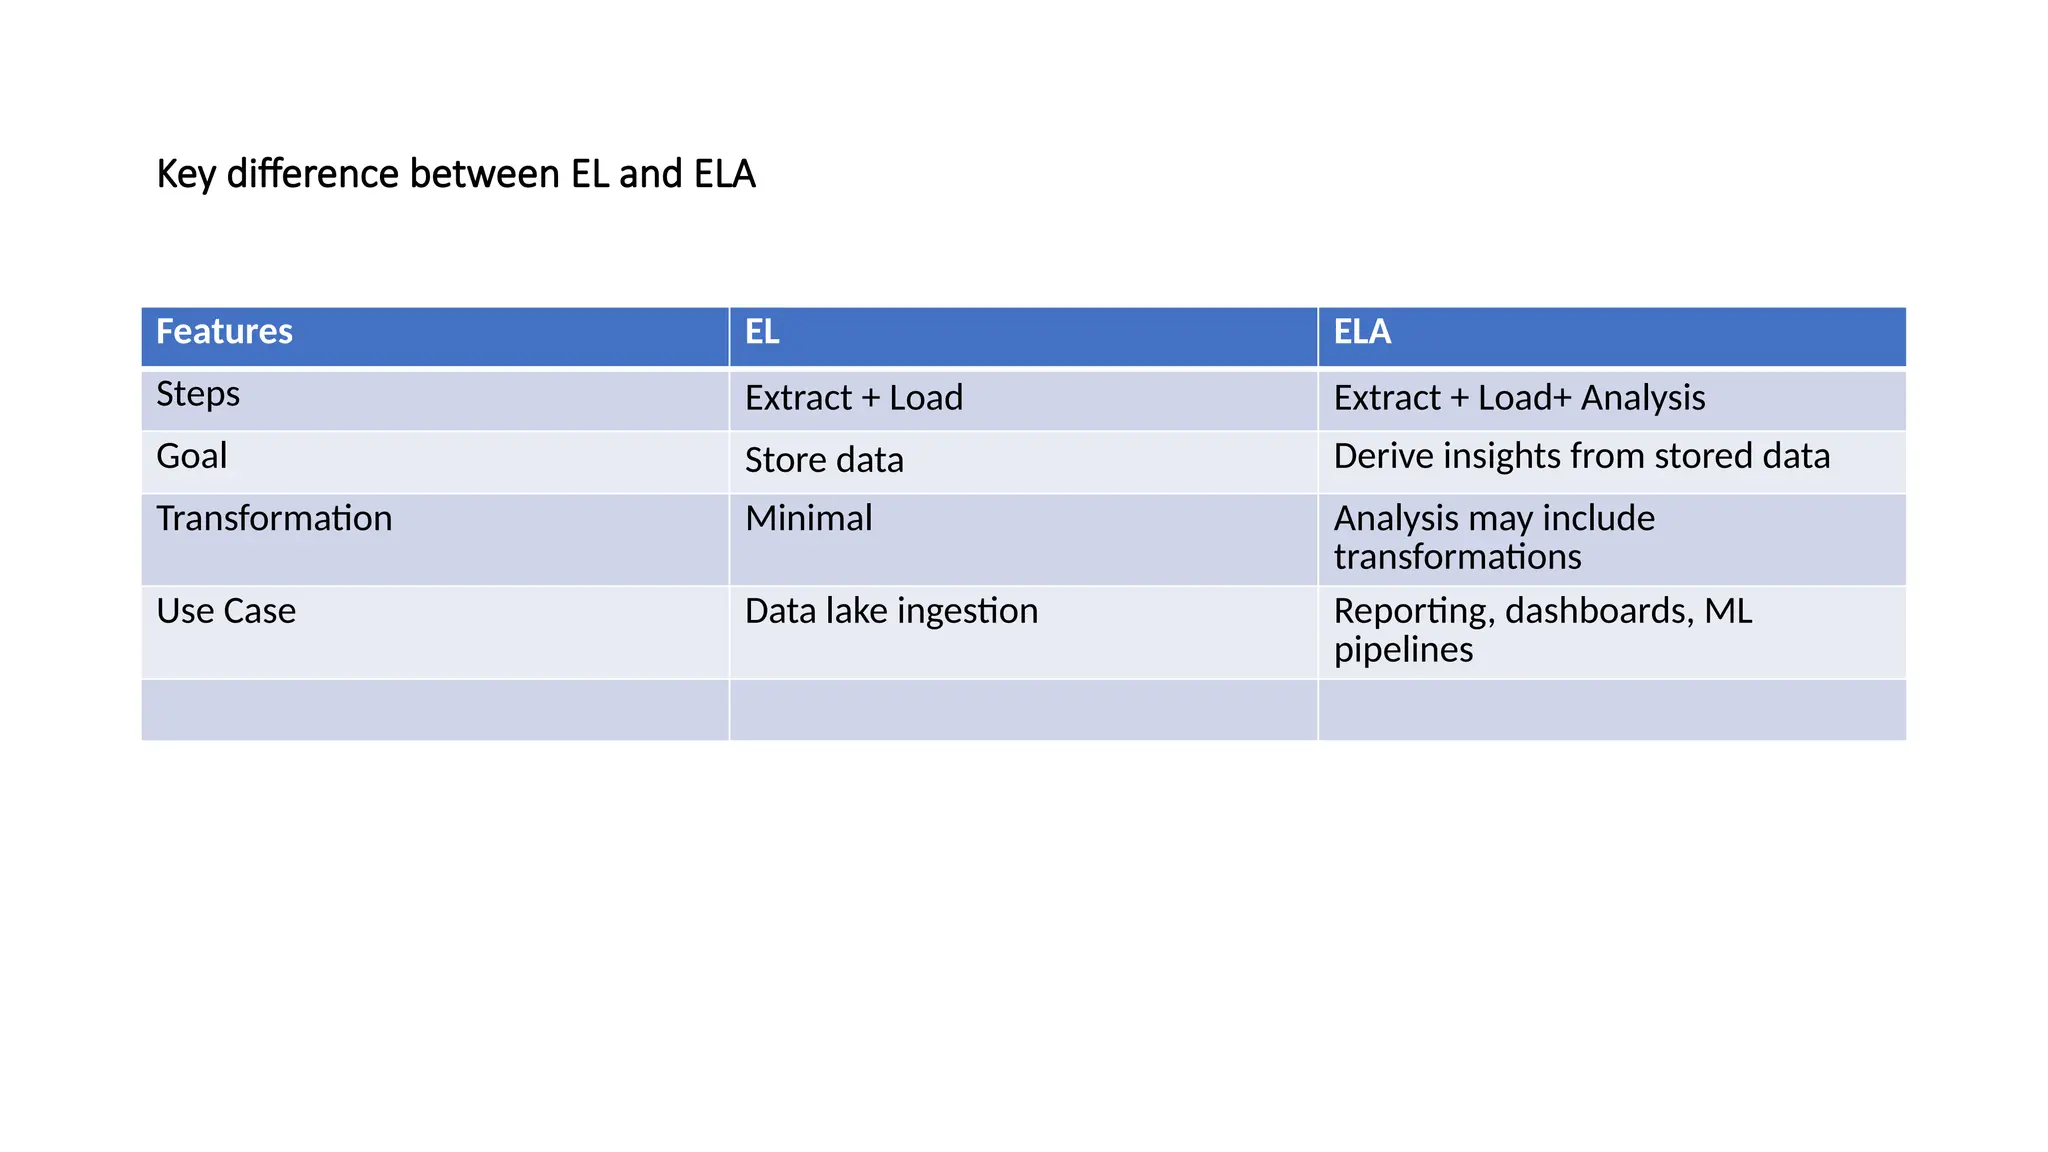
Key difference betweenEL and ELA Features EL ELA Steps Extract + Load Extract + Load+ Analysis Goal Store data Derive insights from stored data Transformation Minimal Analysis may include transformations Use Case Data lake ingestion Reporting, dashboards, ML pipelines
17.
Feature Engineering –Feature Selection: Feature selection is the process of selecting the most relevant features (variables) from your dataset to use in your machine learning model. Goal: Reduce dimensionality, remove irrelevant/noisy data, improve model performance, and reduce overfitting. Why Feature Selection is Important: • Improves model accuracy by removing irrelevant features. • Reduces computational cost (less data to process). • Makes models easier to interpret. • Prevents overfitting (too many features can cause the model to memorize noise). Types of Feature Selection Methods • A. Filter Methods • Features are selected based on statistical measures between features and target variable. • Independent of any machine learning model. • Common techniques: • Correlation coefficient: Remove features highly correlated with others. • Chi-square test: For categorical features. • Mutual Information: Measures dependency between feature and target.
18.
• B. WrapperMethods • Use machine learning models to evaluate the combination of features. • Search for the best subset of features. • Techniques: • Forward Selection: Start with no features → add features one by one → keep the ones improving performance. • Backward Elimination: Start with all features → remove features that hurt performance. • Recursive Feature Elimination (RFE): Iteratively remove least important features based on model weights. • Embedded Methods • Feature selection happens during model training. • Examples: • Lasso Regression (L1 Regularization): Shrinks coefficients of irrelevant features to zero. • Decision Trees / Random Forests: Features with higher importance scores are selected automatically.
19.
3. Steps inFeature Selection • Understand your data: types, distributions, missing values. • Remove irrelevant or redundant features. • Choose selection method (filter, wrapper, embedded). • Evaluate the model performance with selected features. • Iterate if necessary. • Key Tips • Always consider domain knowledge: sometimes statistics don’t capture important features. • Avoid removing correlated features blindly; sometimes correlation is meaningful. • Feature scaling/encoding may be required before selection, depending on the method.
20.
• Feature Transformation •Feature transformation is the process of converting raw features into a format that better fits machine learning models. It often improves accuracy, reduces noise, and helps algorithms understand the data. 1. Why Transformation is Needed • Many ML algorithms assume data follows certain distributions (e.g., normal). • Features may have different scales, skewness, or categorical types. • Transformation makes data more comparable, stable, and informative. • 2. Types of Feature Transformation • A. Scaling & Normalization • Ensures all features have similar scales. • Methods: • Min-Max Scaling: Maps values to range [0,1]. • Standardization (Z-score): Converts to mean = 0, std = 1. • Robust Scaling: Uses median and IQR, good for outliers.
21.
B. Encoding . Convertcategorical data into numerical form. • Methods: • One-Hot Encoding (for nominal categories). • Label Encoding (for ordinal categories). • Target / Mean Encoding (replaces category with average target value) C. Logarithmic & Power Transformations . Handle skewed distributions and stabilize variance. Examples: • Log(x+1) for right-skewed data. • Square root or Box-Cox transformations. • D. Polynomial & Interaction Features • Create new features by combining existing ones. • Example: Add feature or .
22.
• E. DimensionalityReduction • Reduce the number of features while preserving information. • Methods: • PCA (Principal Component Analysis). • t-SNE / UMAP for visualization. • F. Discretization / Binning • Convert continuous values into intervals. • Example: Age → [0–18], [19–35], [36–60], [60+]. • 3. Example • Suppose we have a dataset of house prices with features: • SquareFootage (skewed distribution) • Location (categorical) • Price (target) • Transformations: • Apply log transformation on SquareFootage to reduce skewness. • Apply one-hot encoding on Location. • Apply scaling so all features are comparable.
![• Feature Transformation • Feature transformation is the process of converting raw features into a format that better fits machine learning models. It often improves accuracy, reduces noise, and helps algorithms understand the data. 1. Why Transformation is Needed • Many ML algorithms assume data follows certain distributions (e.g., normal). • Features may have different scales, skewness, or categorical types. • Transformation makes data more comparable, stable, and informative. • 2. Types of Feature Transformation • A. Scaling & Normalization • Ensures all features have similar scales. • Methods: • Min-Max Scaling: Maps values to range [0,1]. • Standardization (Z-score): Converts to mean = 0, std = 1. • Robust Scaling: Uses median and IQR, good for outliers.](https://image.slidesharecdn.com/moduleii-250921232025-139196f7/75/Module-II-pptx-it-is-data-science-first-unit-20-2048.jpg)
![• E. Dimensionality Reduction • Reduce the number of features while preserving information. • Methods: • PCA (Principal Component Analysis). • t-SNE / UMAP for visualization. • F. Discretization / Binning • Convert continuous values into intervals. • Example: Age → [0–18], [19–35], [36–60], [60+]. • 3. Example • Suppose we have a dataset of house prices with features: • SquareFootage (skewed distribution) • Location (categorical) • Price (target) • Transformations: • Apply log transformation on SquareFootage to reduce skewness. • Apply one-hot encoding on Location. • Apply scaling so all features are comparable.](https://image.slidesharecdn.com/moduleii-250921232025-139196f7/75/Module-II-pptx-it-is-data-science-first-unit-22-2048.jpg)