Data Science Overview •An interconnected field that involves the use of statistical and computational methods • To extract insightful information and knowledge from data. • A multidisciplinary field that uses tools and techniques to manipulate the data • User can find something new and meaningful. • Deep study of the massive amount of data • Involves extracting meaningful insights from raw, structured, and unstructured data • Processed using the scientific method, different technologies, and algorithms.
The study ofcollecting and analyzing a huge volume of data sets to find a hidden pattern that helps in stronger decision-making. Bigdata Described in terms of volume, velocity, and variety Volume Enormous amount of data How much data is there? Velocity The speed at which data is generated At what speed is new data generated? Variety Data is heterogeneous How diverse are different types of data? Come from many different sources and can be structured, unstructured, or semi- structured To storing, managing, and processing large volumes of data, while data science focuses on analyzing and interpreting data to gain insights and make informed decisions.
6.
Image recognitionand speech recognition Gaming world - Gaming Reinforcement - to the player’s progress and become more challenging over time Internet search Transport & Delivery logistics - Route Optimisation, Space Optimisation - best way to store and package things in buildings, trucks, containers, etc., Dynamic Pricing - Uber, Ola Safety - Data science also examines how people drive, how much gas they use, and other factors to make driving safer. Product and website recommendation systems Healthcare Fraud & Risk detection Banking and finance Targeted advertising Virtual assistants Education Manufacturing - Inventory control and demand forecasting E-Commerce - Consumer Segmentation, Demand and Capacity Forecasting, Pricing Optimisation, Product Recommendation, Sentiment Analysis and Fraud Detection
7.
Capture Data Acquisition, DataEntry, Signal Reception, Data Extraction Maintain Data Warehousing, Data Cleansing, Data Staging (intermediate storage area), Data Processing, Data Architecture Process Data Mining, Clustering/Classification, Data Modeling, Data Summarization. Data scientists take the prepared data and examine its patterns, ranges, and biases to determine how useful it will be in predictive analysis Analyze Exploratory/Confirmatory, Predictive Analysis, Regression, Text Mining, Qualitative Analysis. Communicate Data Reporting, Data Visualization, Business Intelligence, Decision Making.
8.
Detect patterns inseemingly unstructured or unconnected data, allowing conclusions and predictions to be made. Acquire user data can utilise strategies to transform that data into valuable or profitable information - Tech businesses Discover unknown transformative patterns Real-time optimization Descriptive analysis What? Diagnostic analysis Why ? Predictive analysis Future outcome Prescriptive analysis Future outcome & Solutions
9.
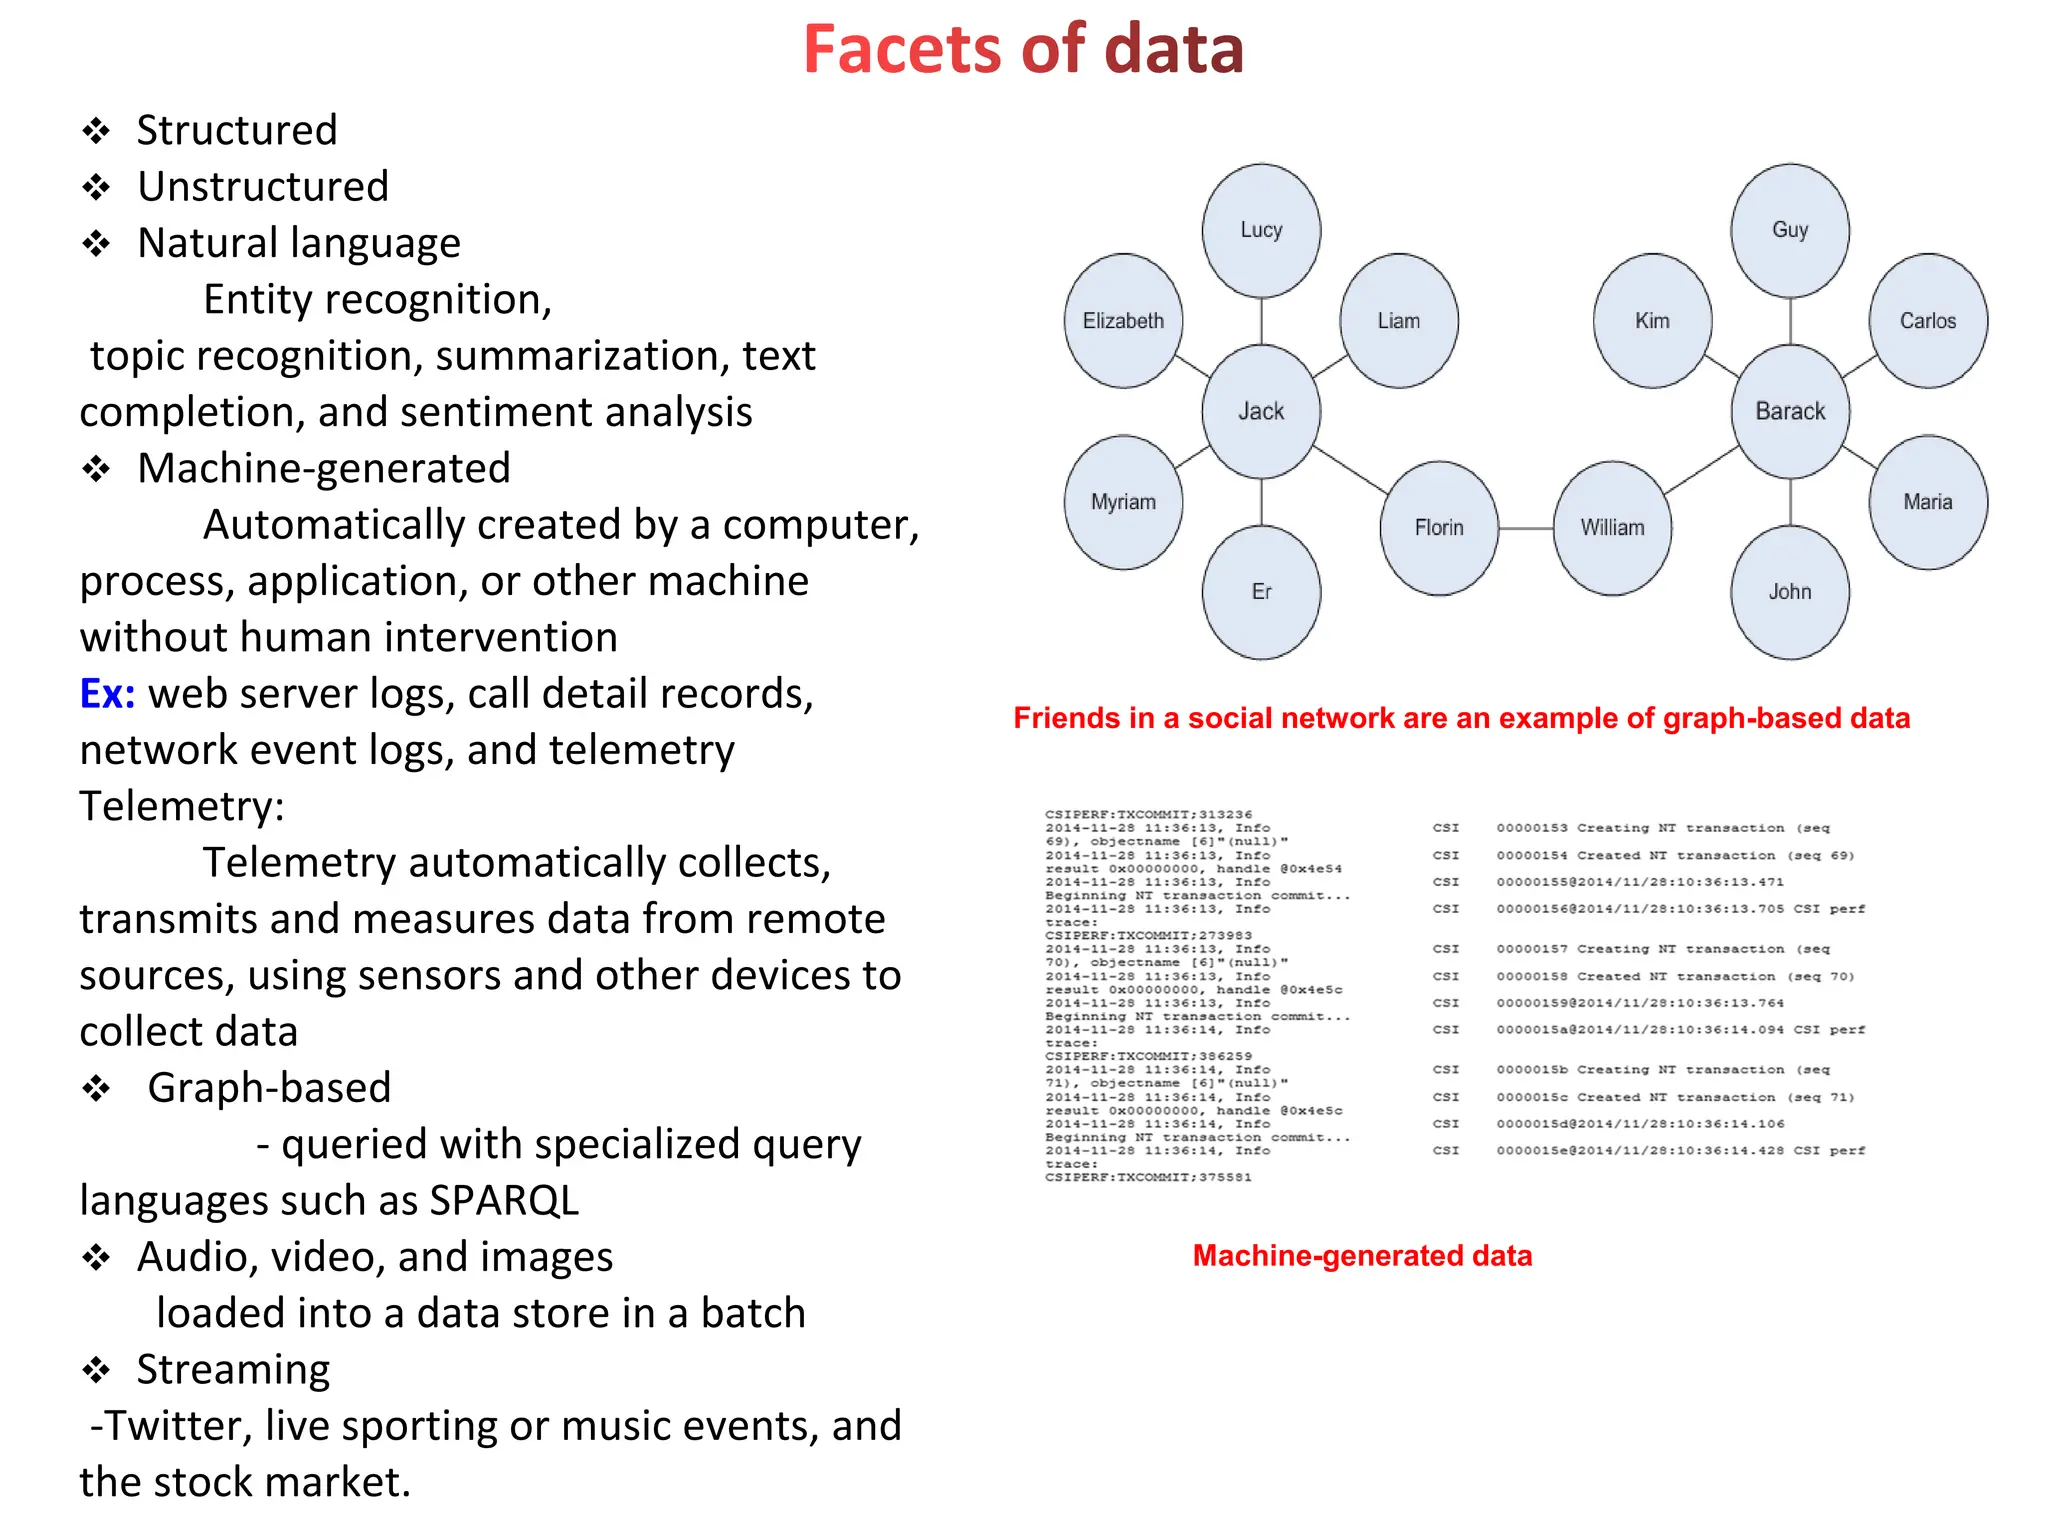
Structured Unstructured Natural language Entity recognition, topic recognition, summarization, text completion, and sentiment analysis Machine-generated Automatically created by a computer, process, application, or other machine without human intervention Ex: web server logs, call detail records, network event logs, and telemetry Telemetry: Telemetry automatically collects, transmits and measures data from remote sources, using sensors and other devices to collect data Graph-based - queried with specialized query languages such as SPARQL Audio, video, and images loaded into a data store in a batch Streaming -Twitter, live sporting or music events, and the stock market. Friends in a social network are an example of graph-based data Machine-generated data
10.
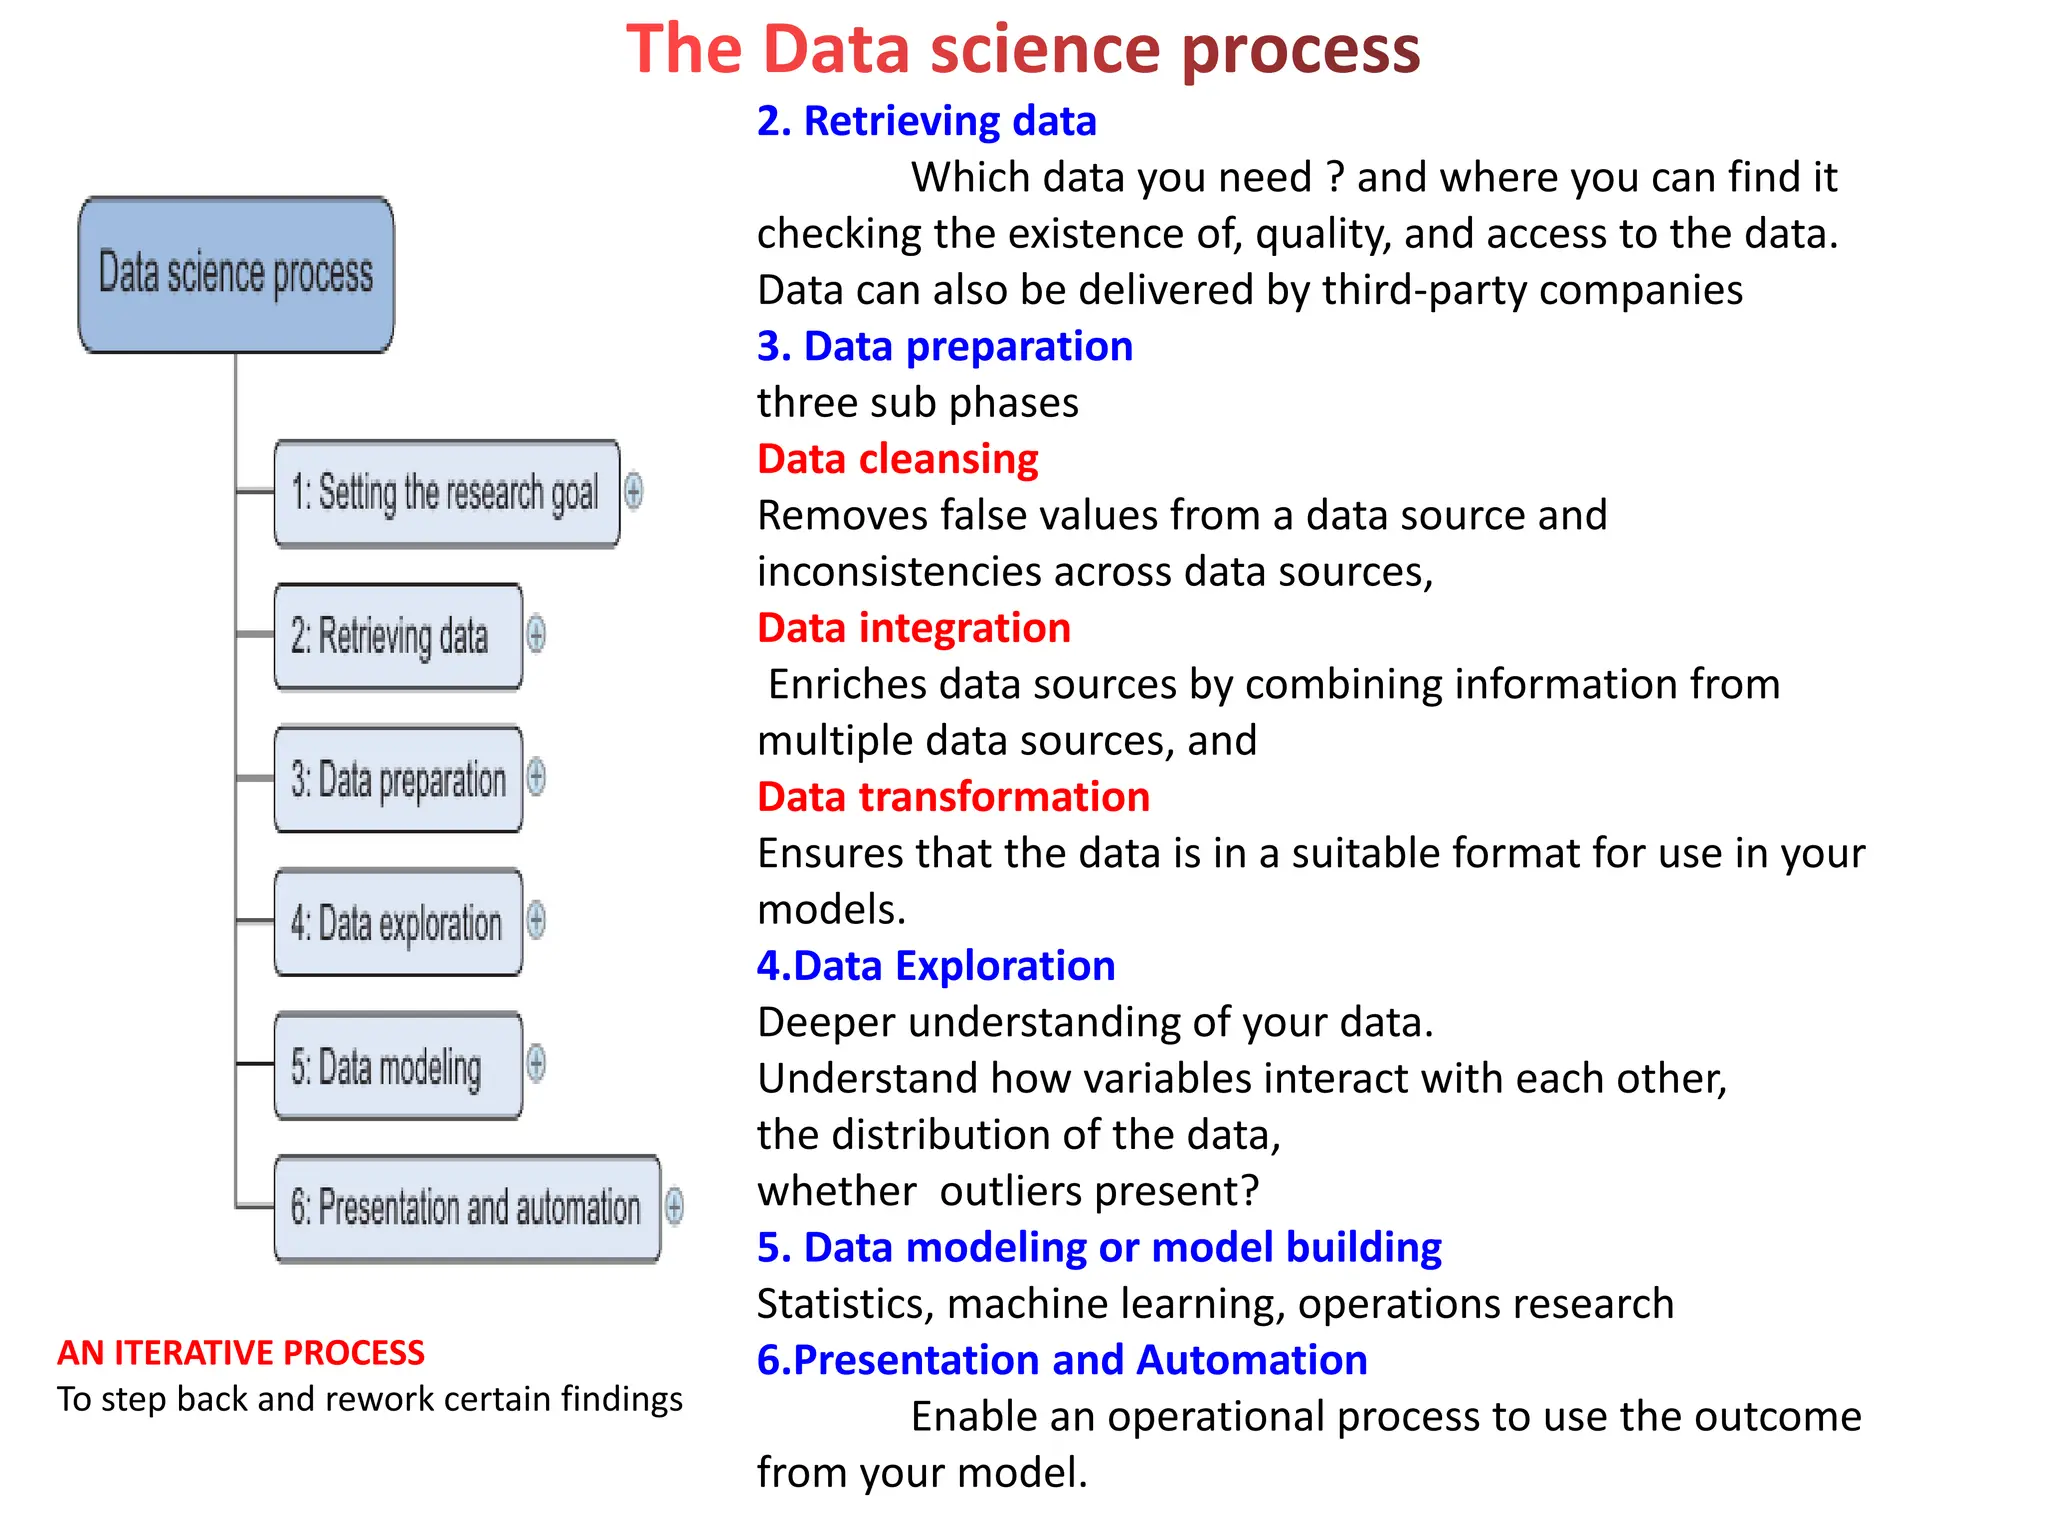
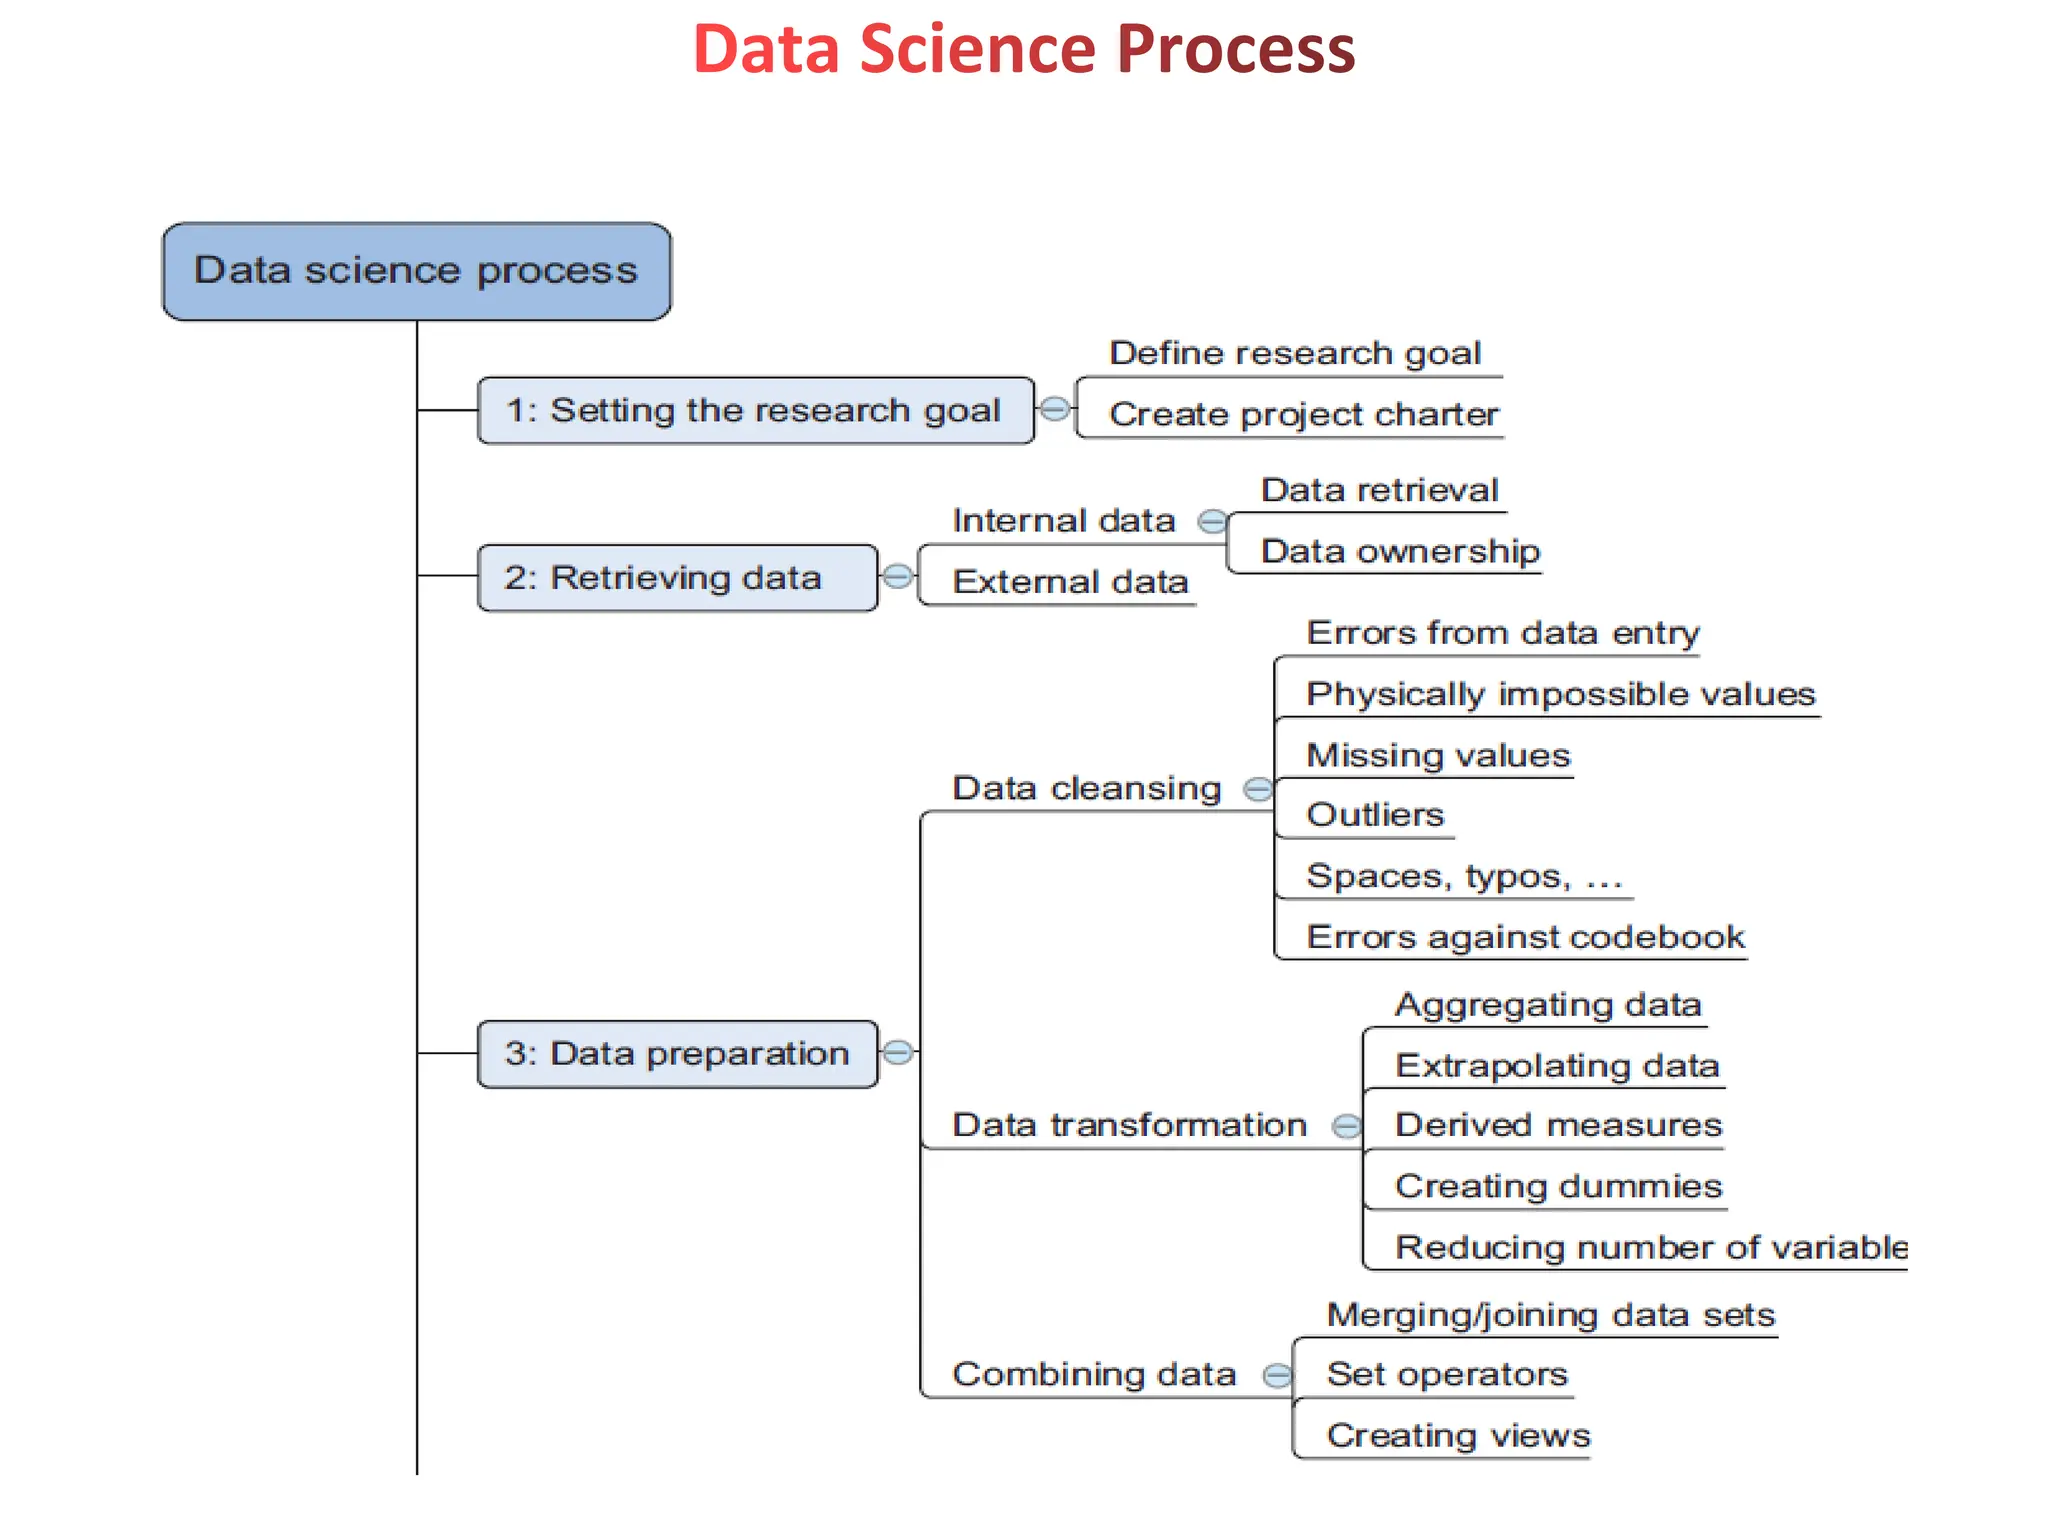
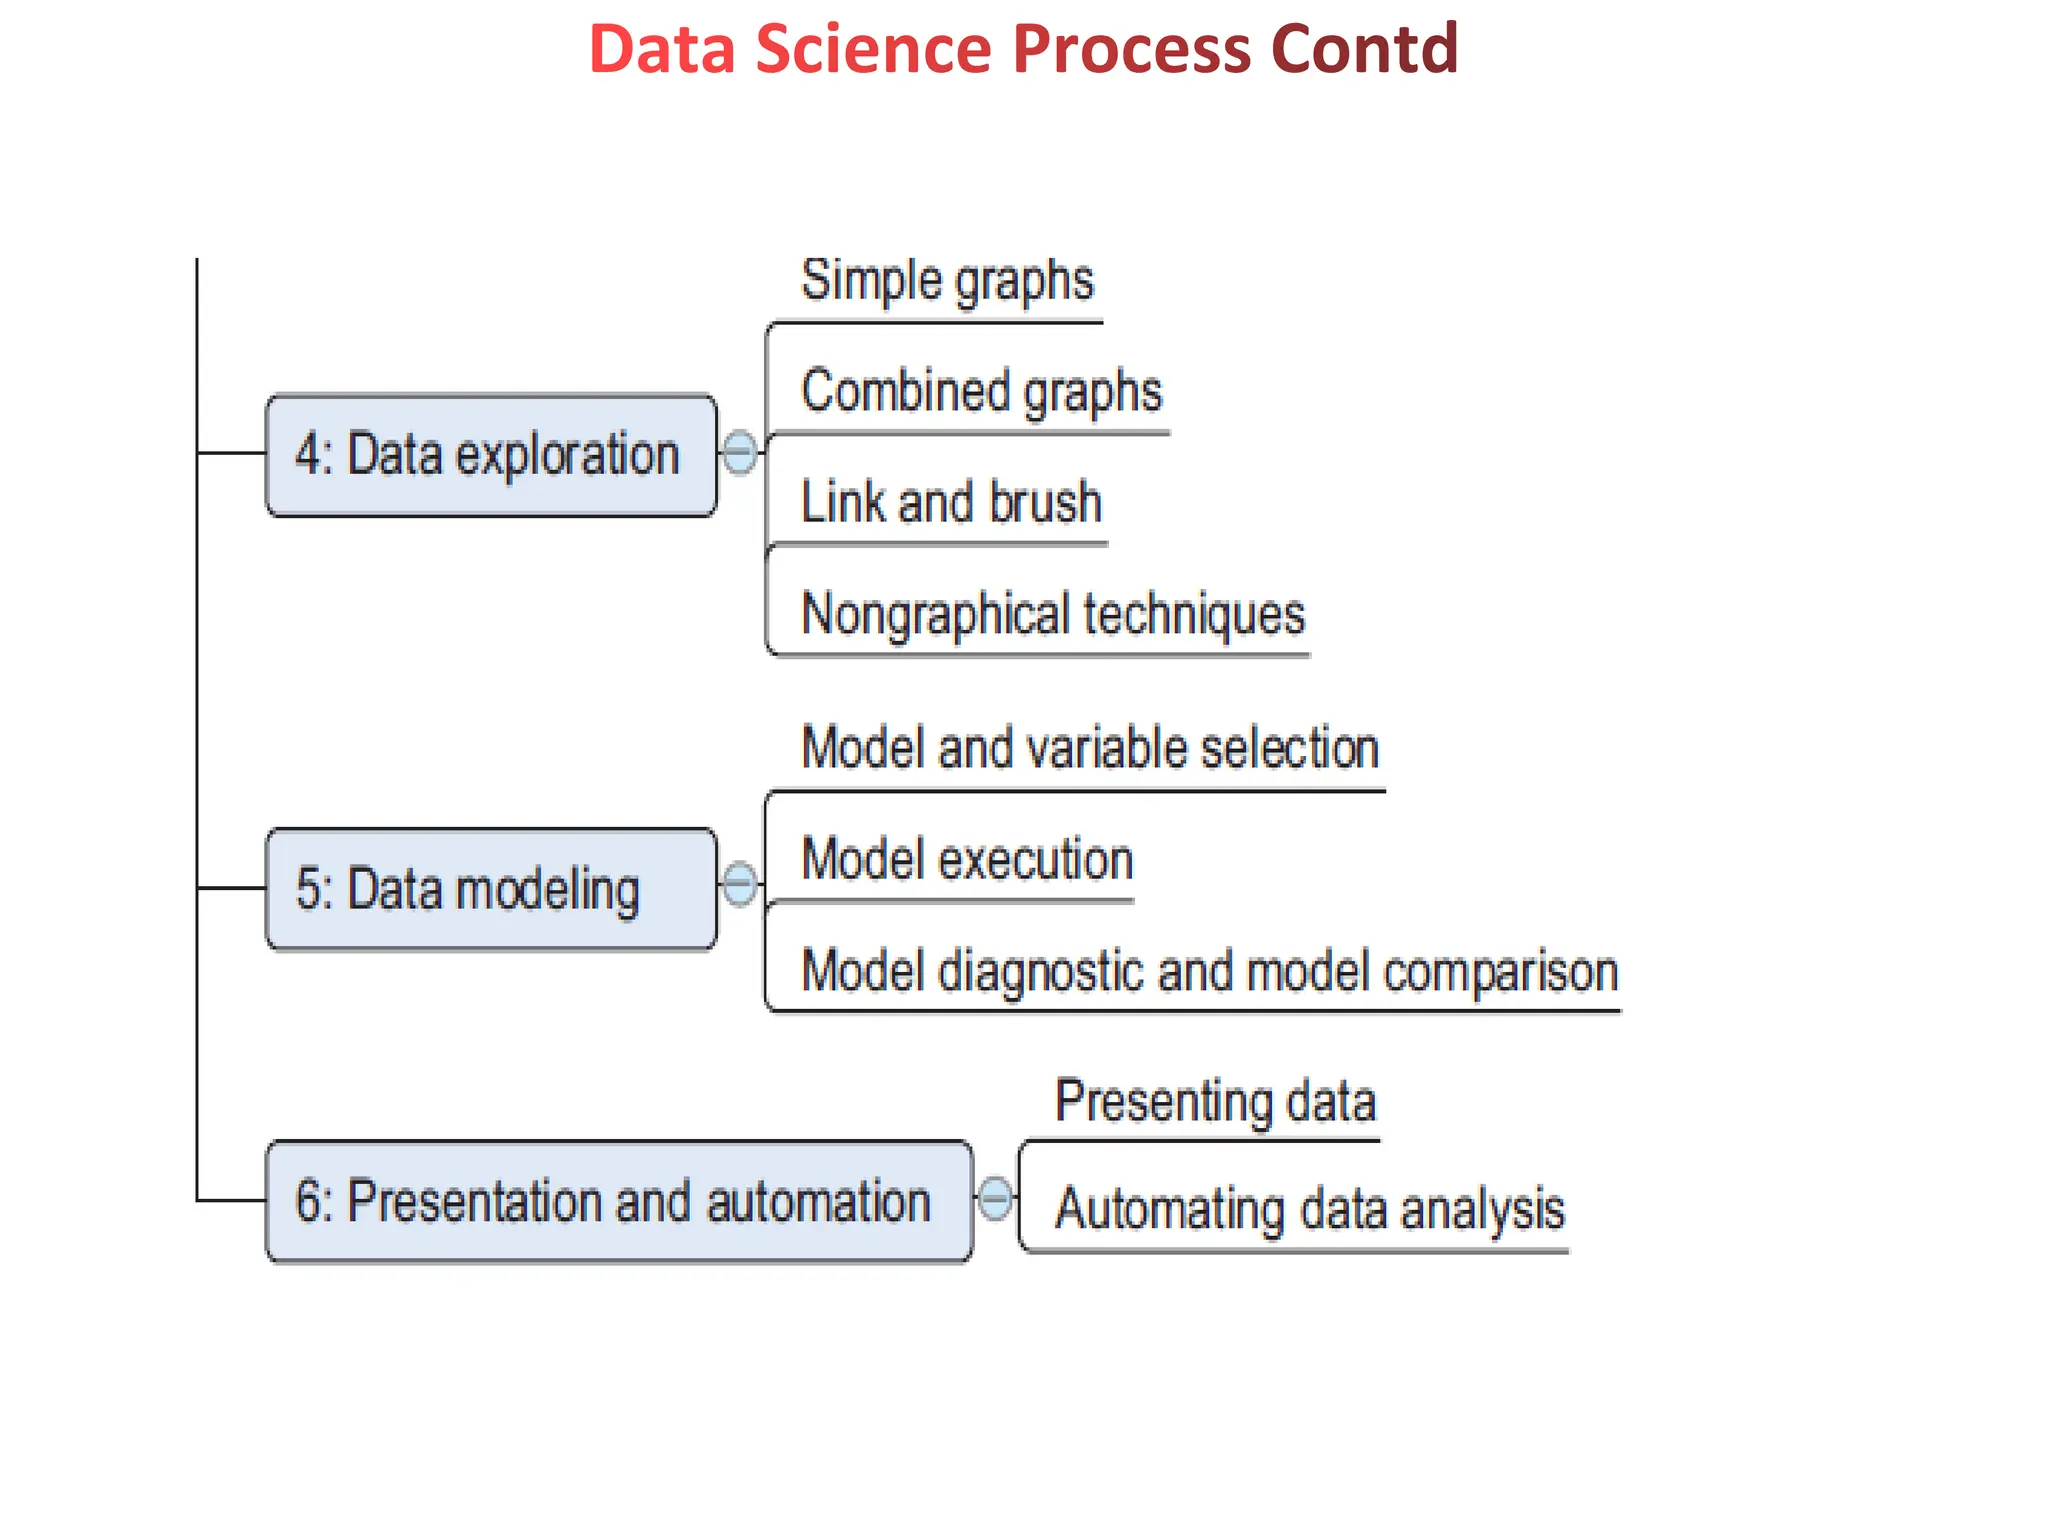
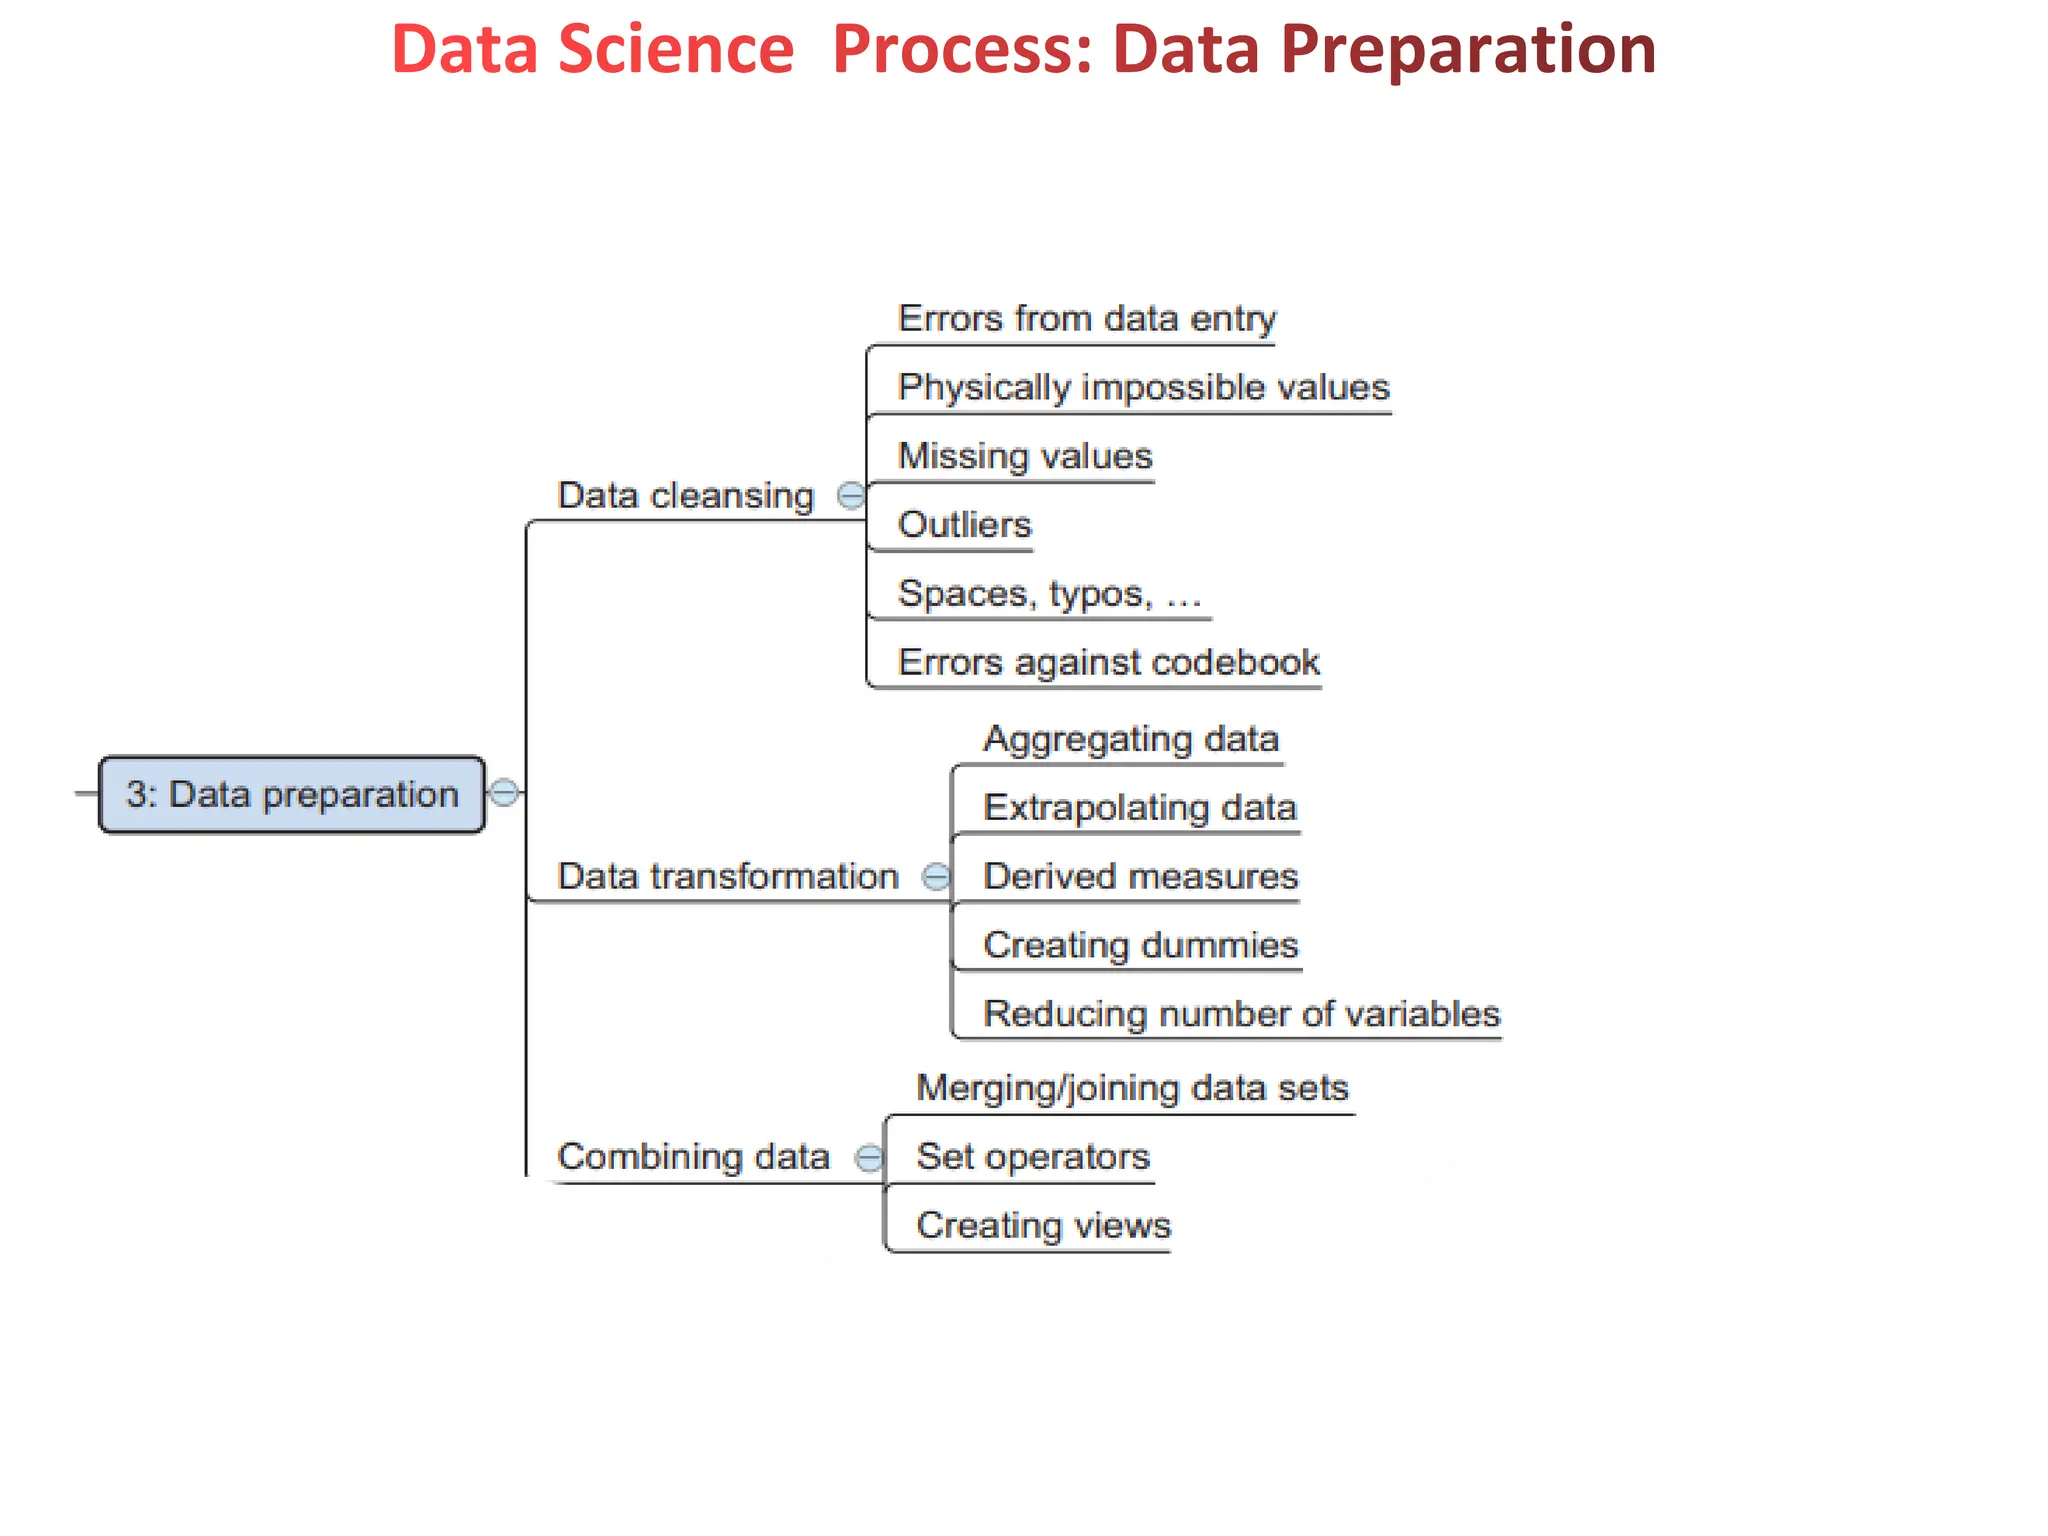
2. Retrieving data Whichdata you need ? and where you can find it checking the existence of, quality, and access to the data. Data can also be delivered by third-party companies 3. Data preparation three sub phases Data cleansing Removes false values from a data source and inconsistencies across data sources, Data integration Enriches data sources by combining information from multiple data sources, and Data transformation Ensures that the data is in a suitable format for use in your models. 4.Data Exploration Deeper understanding of your data. Understand how variables interact with each other, the distribution of the data, whether outliers present? 5. Data modeling or model building Statistics, machine learning, operations research 6.Presentation and Automation Enable an operational process to use the outcome from your model. AN ITERATIVE PROCESS To step back and rework certain findings
11.
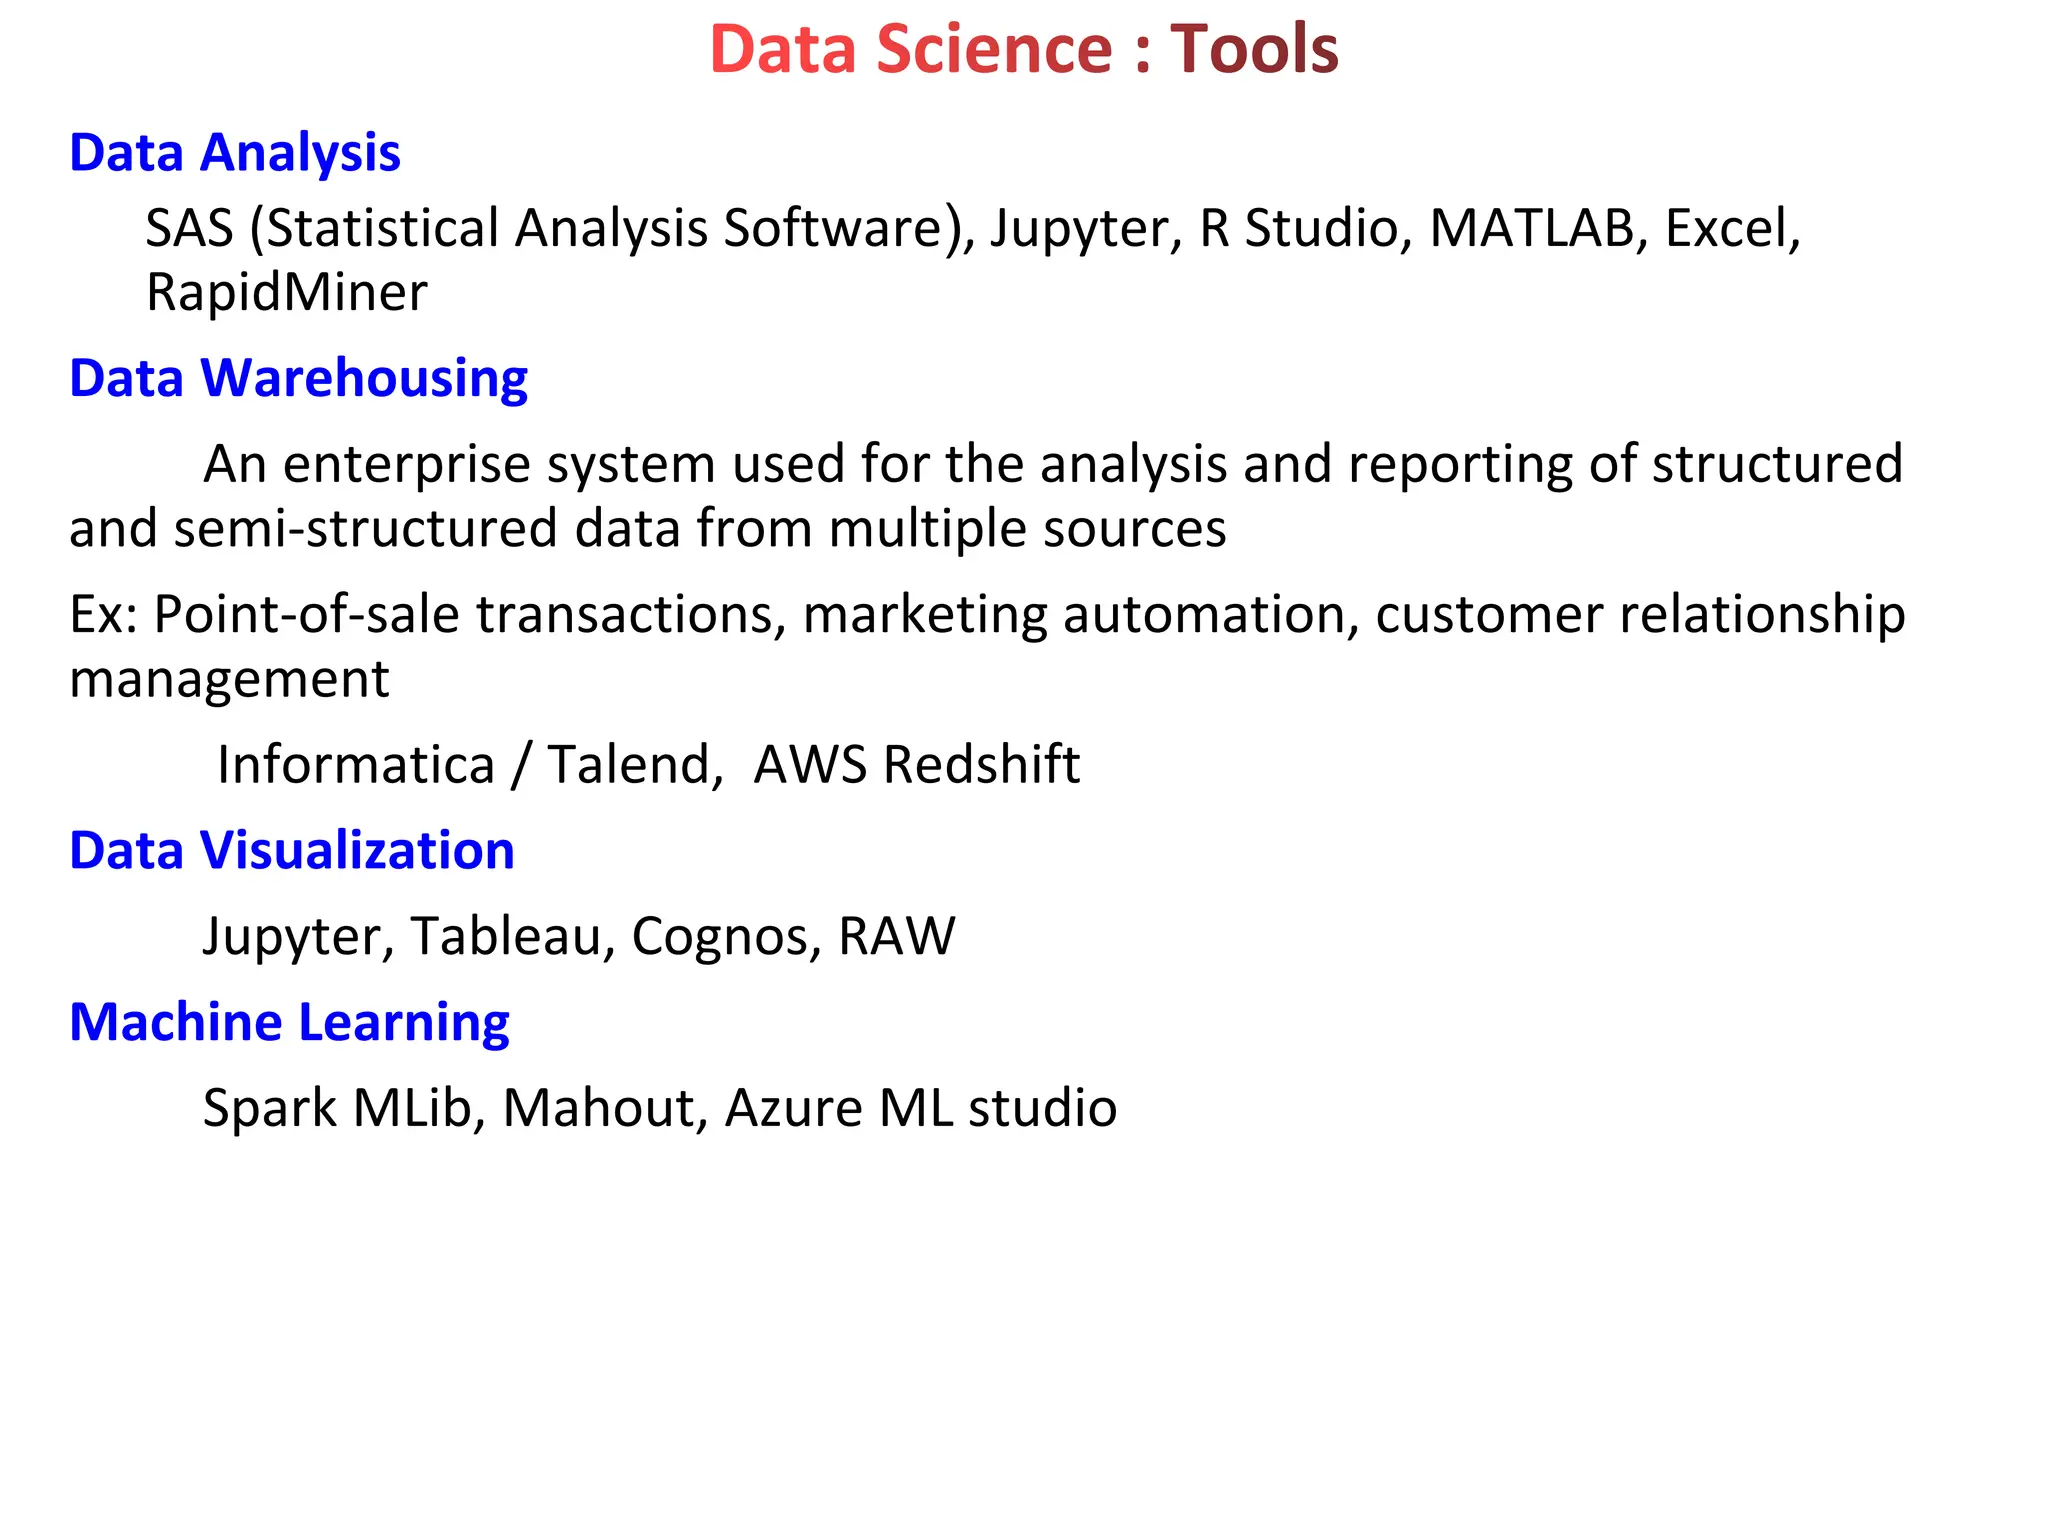
Data Analysis SAS (StatisticalAnalysis Software), Jupyter, R Studio, MATLAB, Excel, RapidMiner Data Warehousing An enterprise system used for the analysis and reporting of structured and semi-structured data from multiple sources Ex: Point-of-sale transactions, marketing automation, customer relationship management Informatica / Talend, AWS Redshift Data Visualization Jupyter, Tableau, Cognos, RAW Machine Learning Spark MLib, Mahout, Azure ML studio
12.
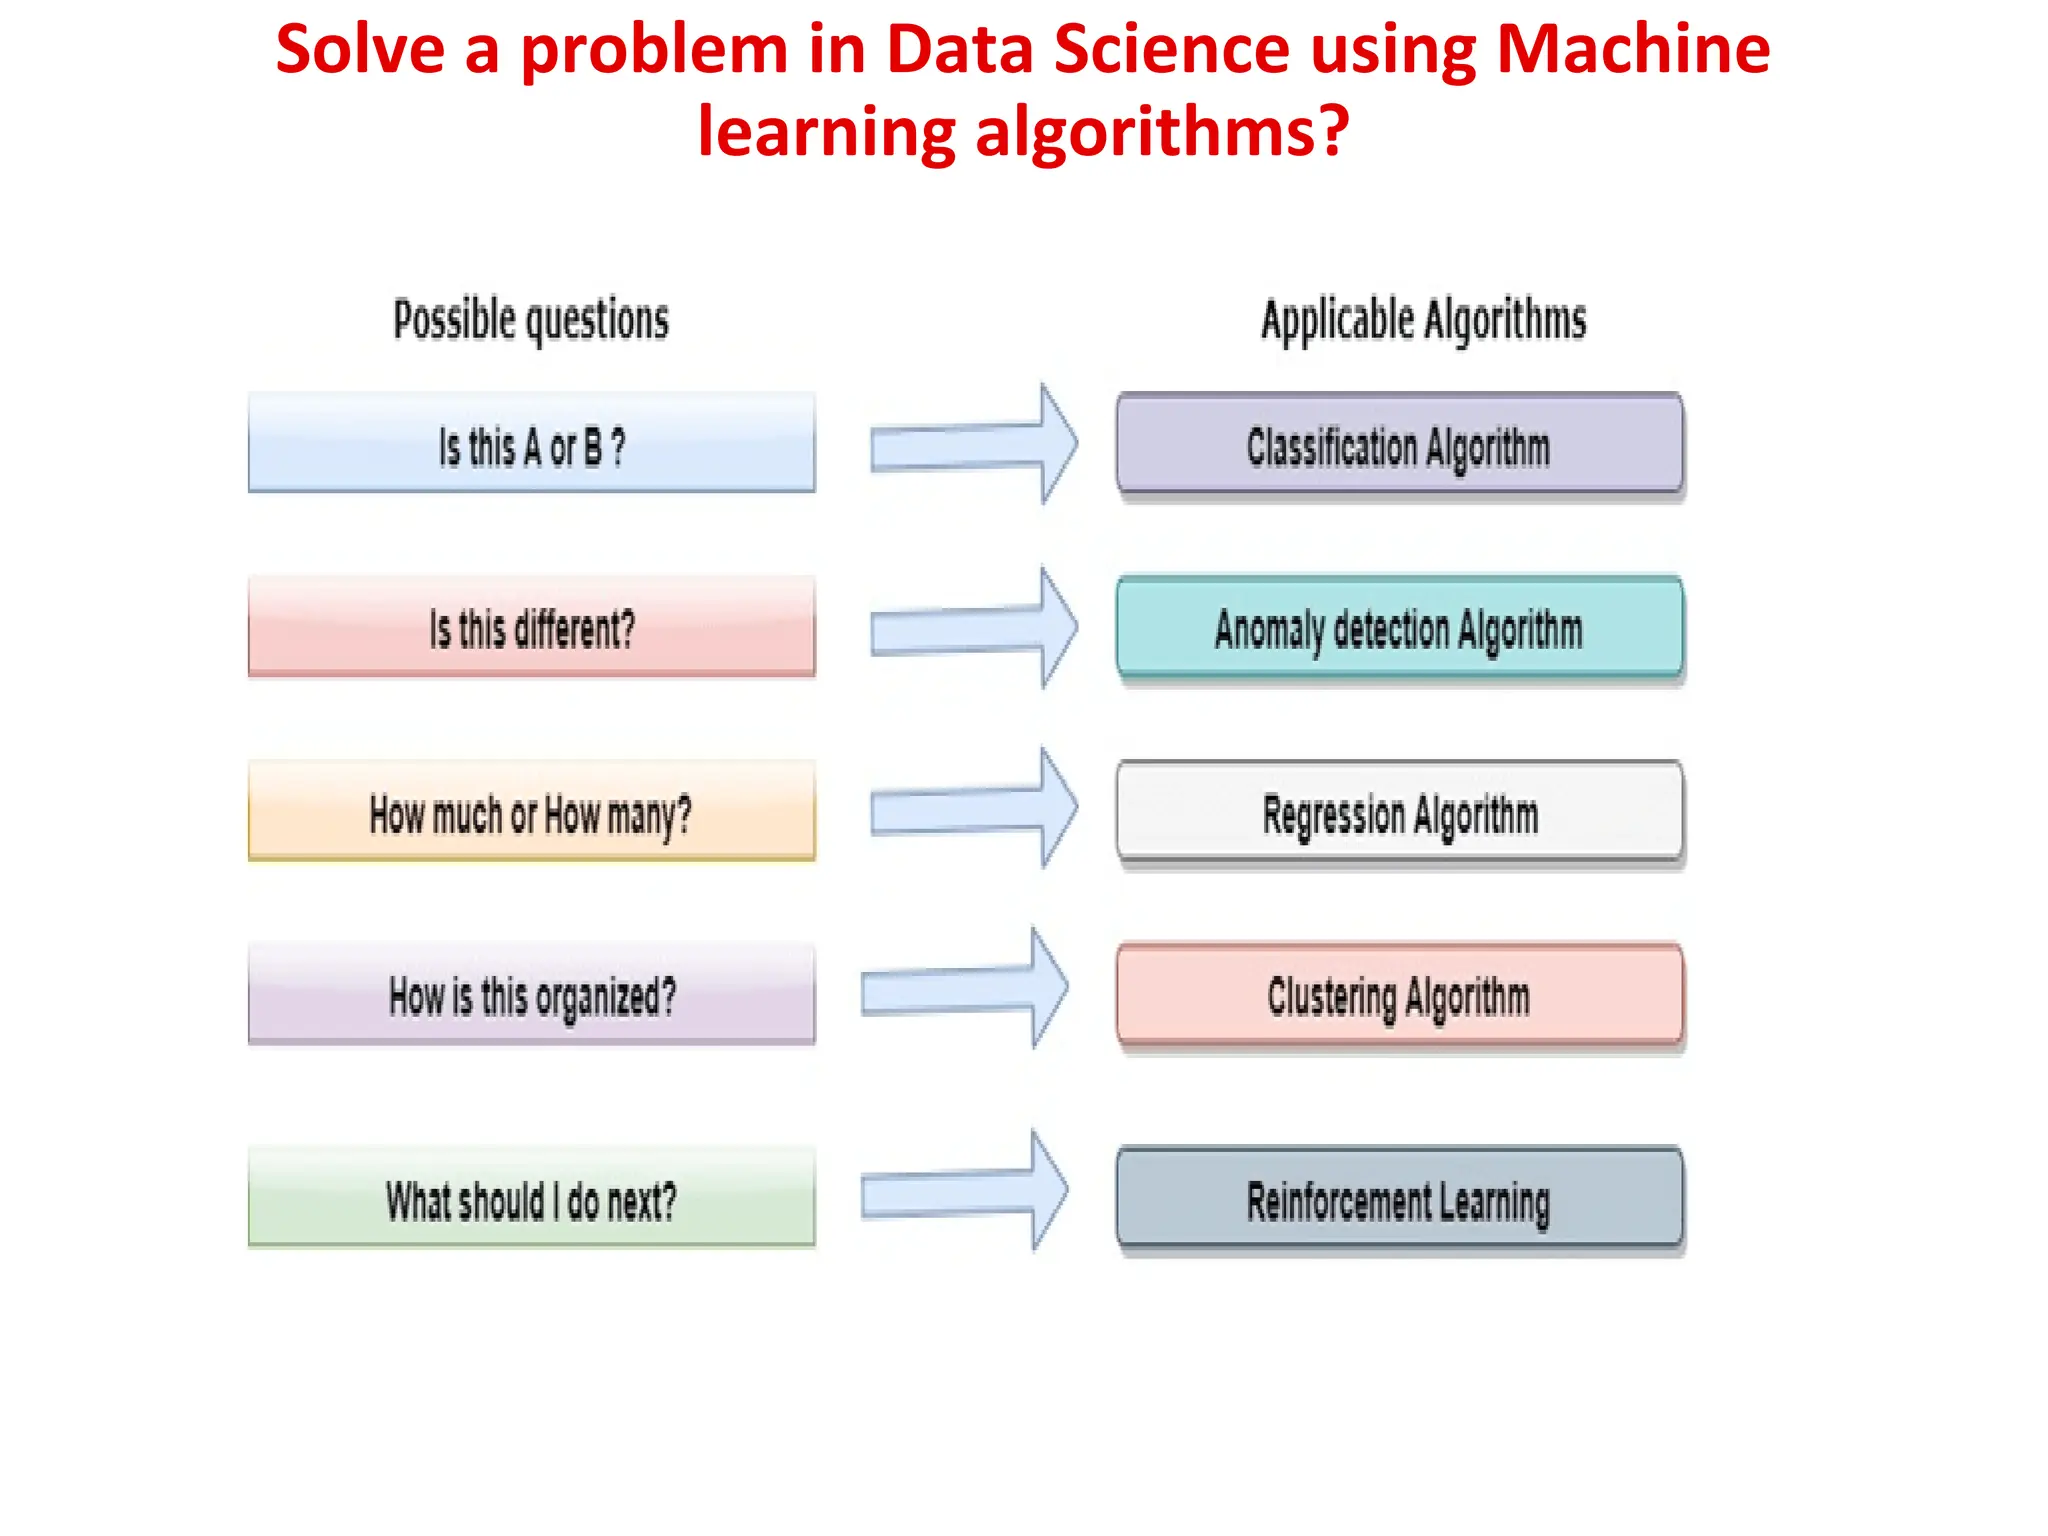
Solve a problemin Data Science using Machine learning algorithms?
15.
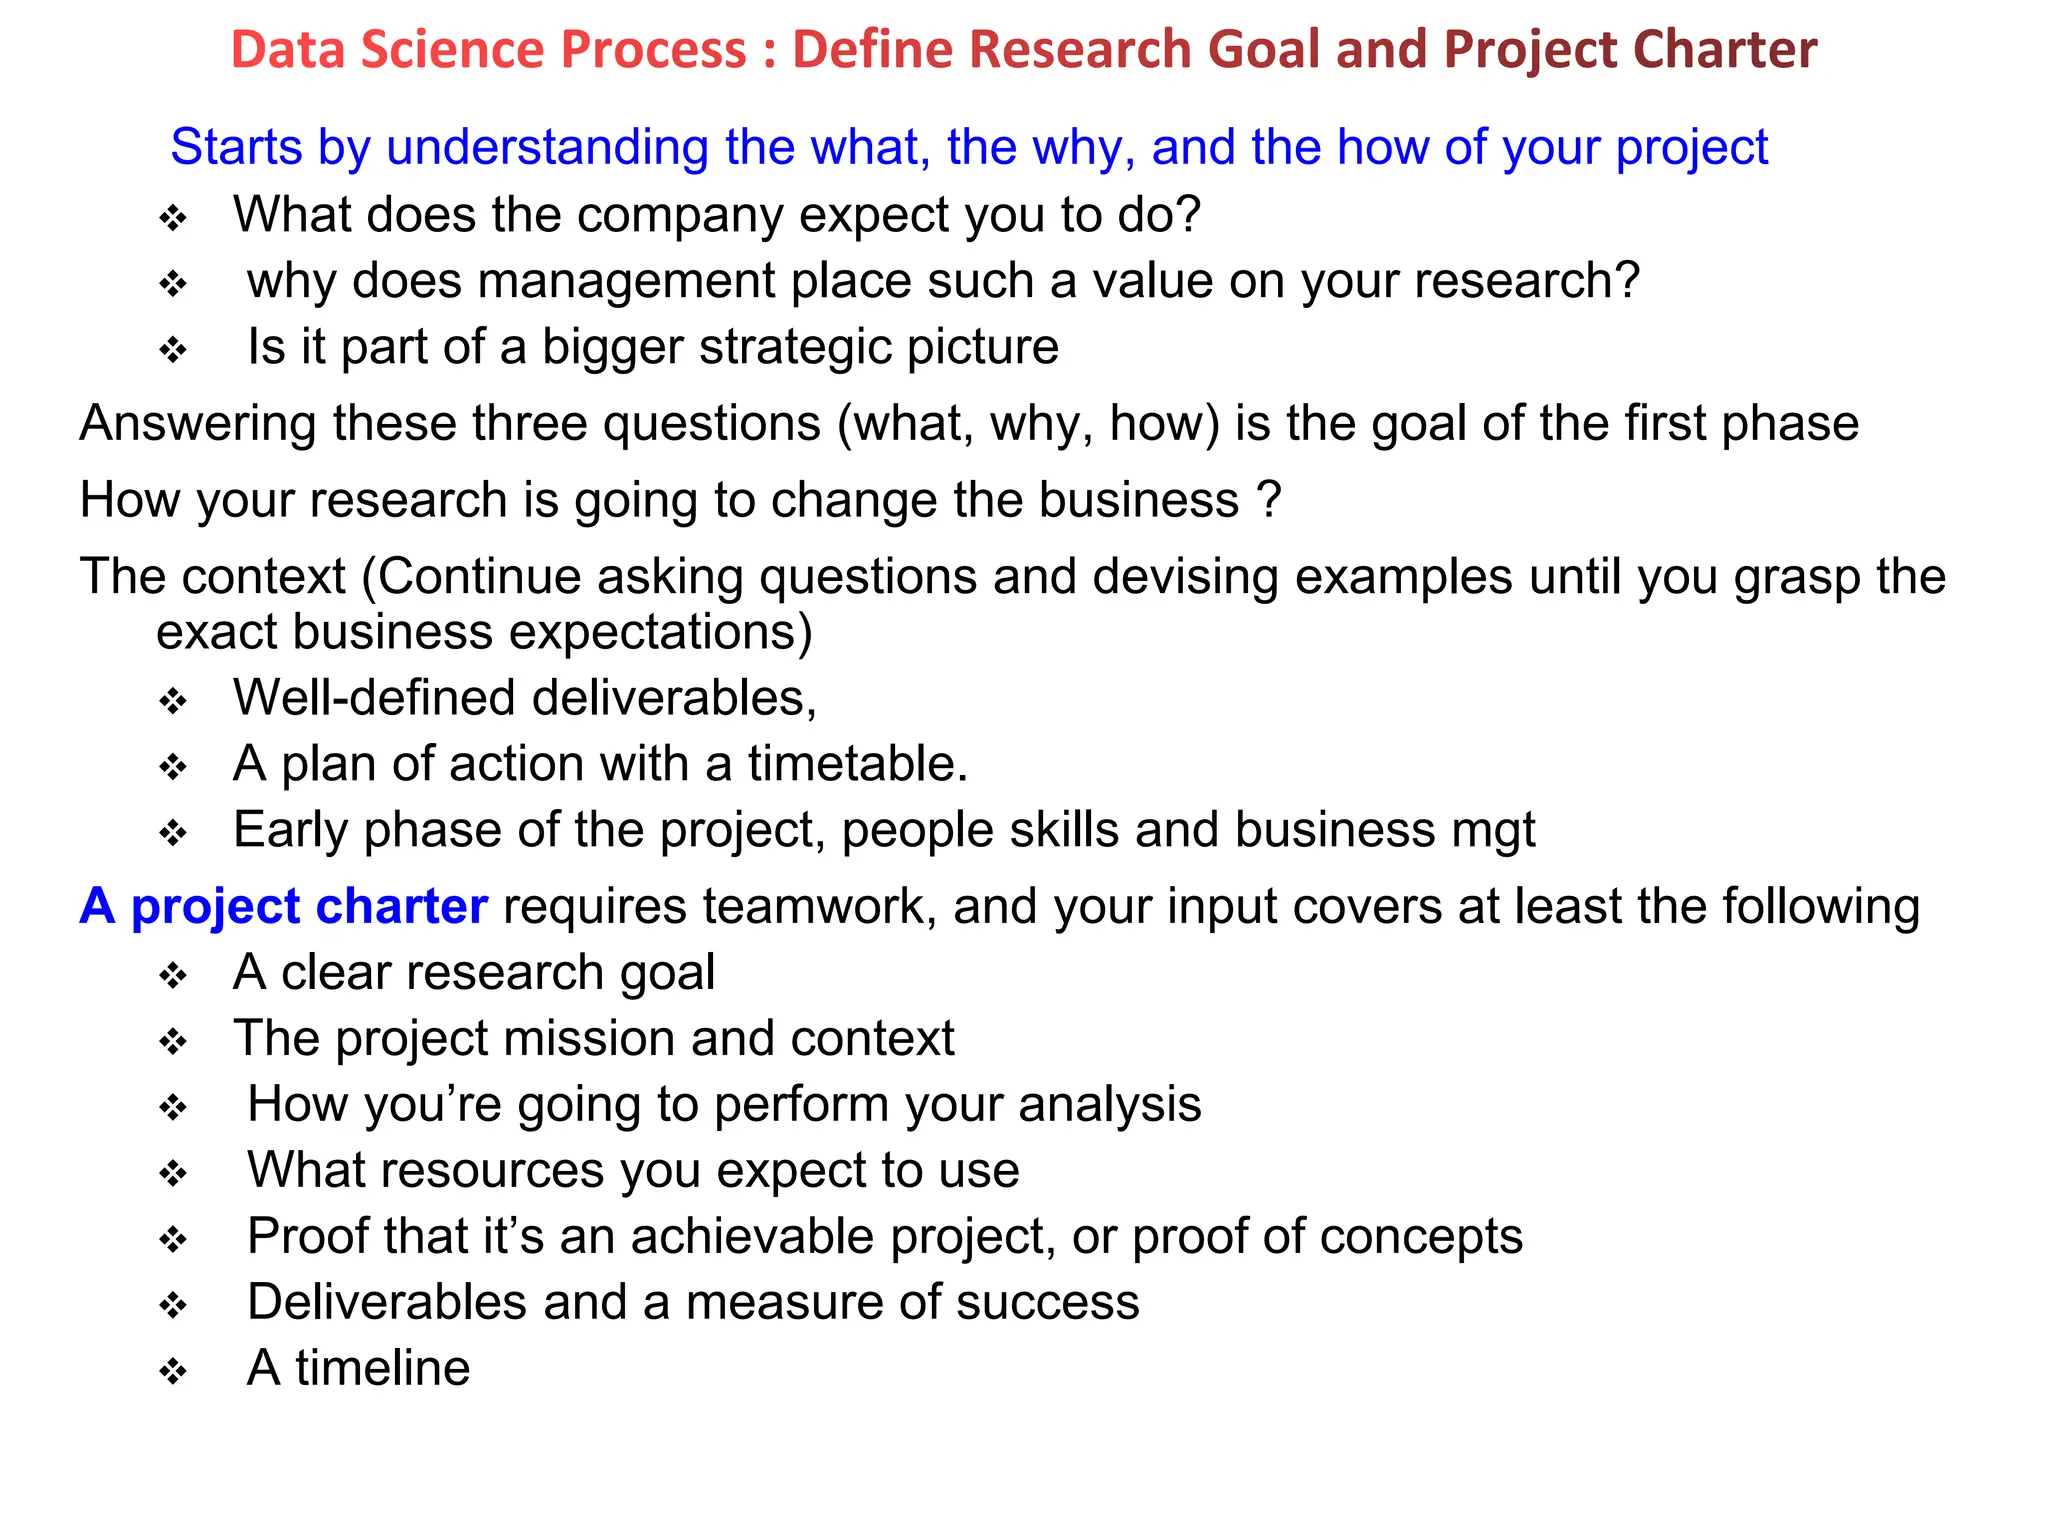
Starts by understandingthe what, the why, and the how of your project What does the company expect you to do? why does management place such a value on your research? Is it part of a bigger strategic picture Answering these three questions (what, why, how) is the goal of the first phase How your research is going to change the business ? The context (Continue asking questions and devising examples until you grasp the exact business expectations) Well-defined deliverables, A plan of action with a timetable. Early phase of the project, people skills and business mgt A project charter requires teamwork, and your input covers at least the following A clear research goal The project mission and context How you’re going to perform your analysis What resources you expect to use Proof that it’s an achievable project, or proof of concepts Deliverables and a measure of success A timeline
16.
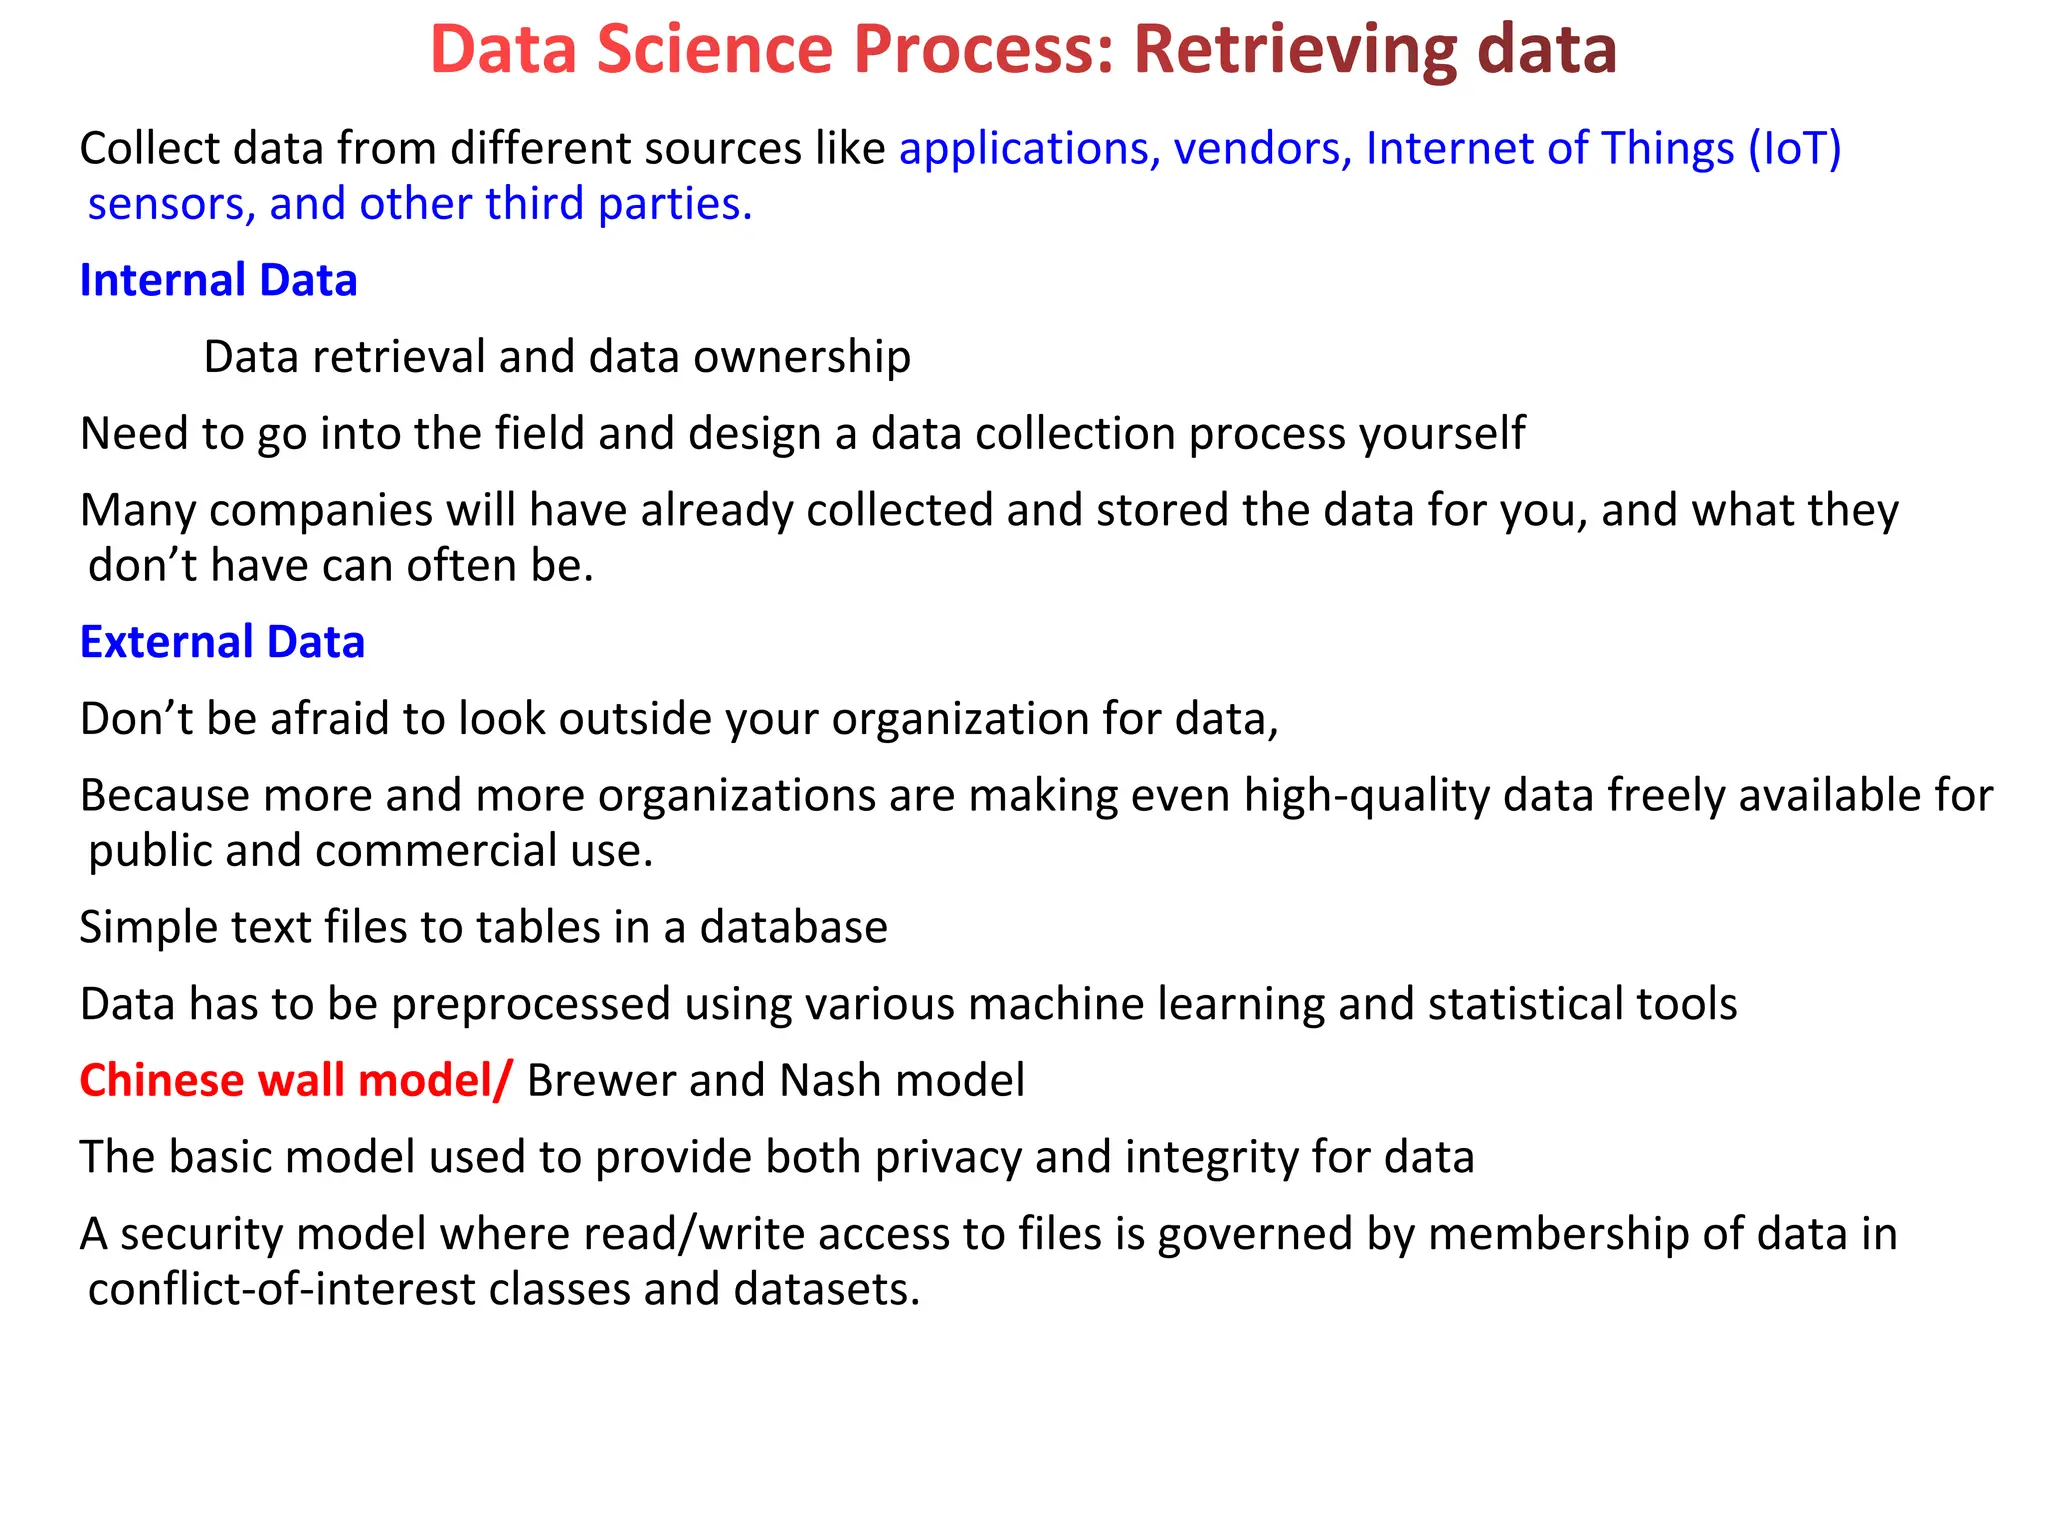
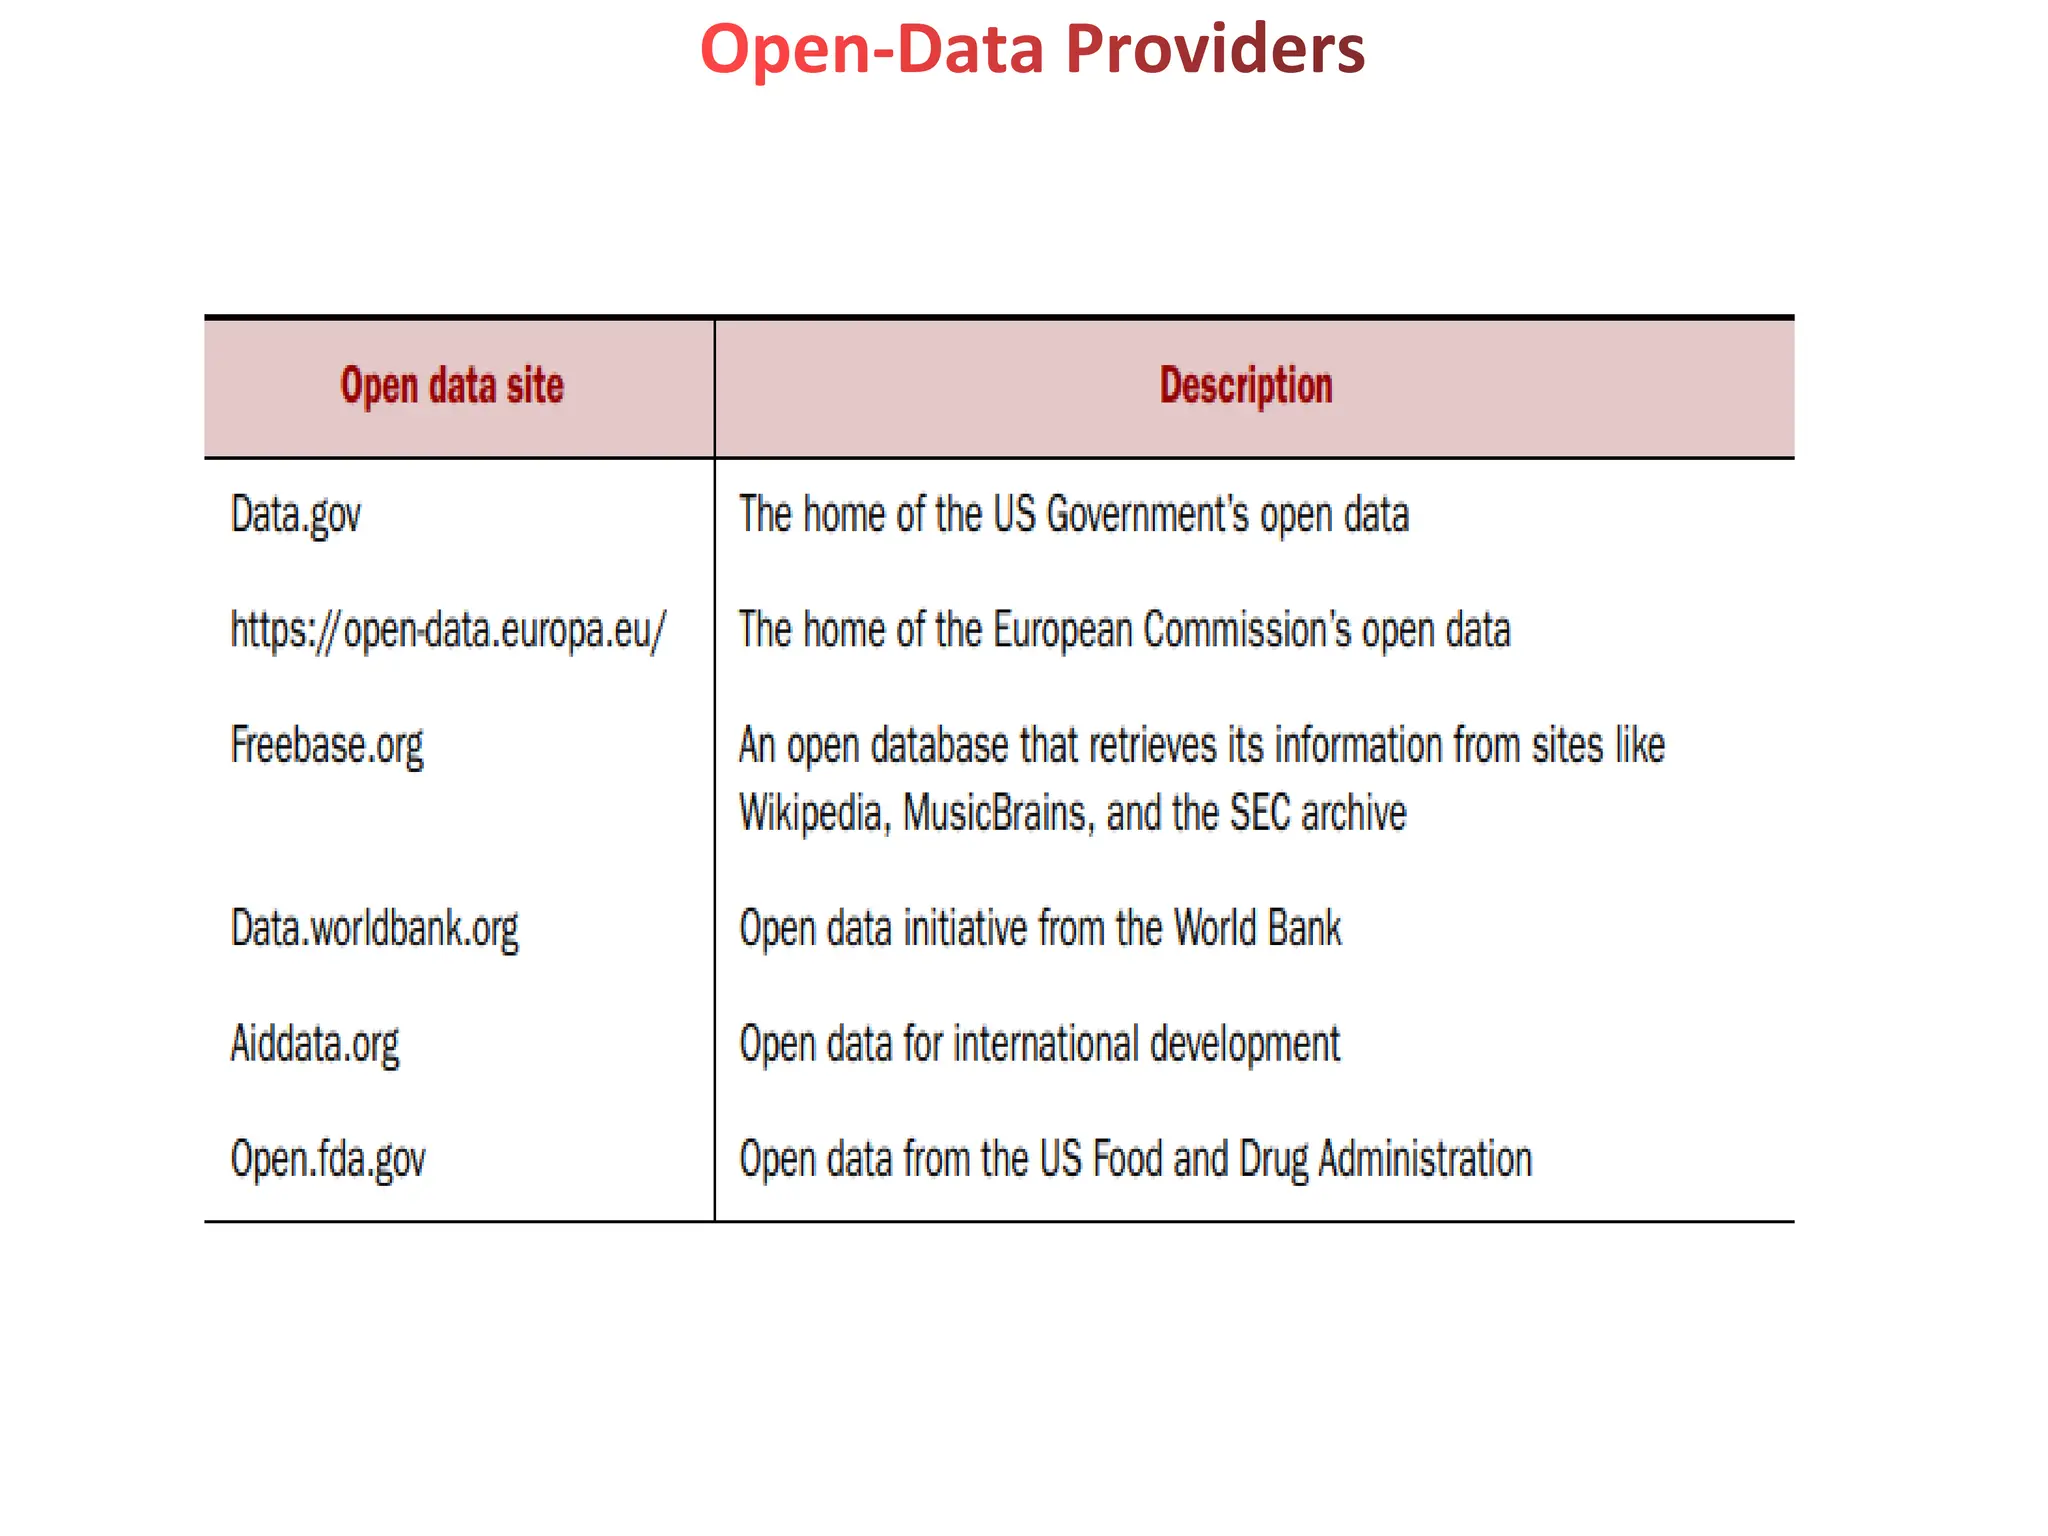
Collect data fromdifferent sources like applications, vendors, Internet of Things (IoT) sensors, and other third parties. Internal Data Data retrieval and data ownership Need to go into the field and design a data collection process yourself Many companies will have already collected and stored the data for you, and what they don’t have can often be. External Data Don’t be afraid to look outside your organization for data, Because more and more organizations are making even high-quality data freely available for public and commercial use. Simple text files to tables in a database Data has to be preprocessed using various machine learning and statistical tools Chinese wall model/ Brewer and Nash model The basic model used to provide both privacy and integrity for data A security model where read/write access to files is governed by membership of data in conflict-of-interest classes and datasets.
17.
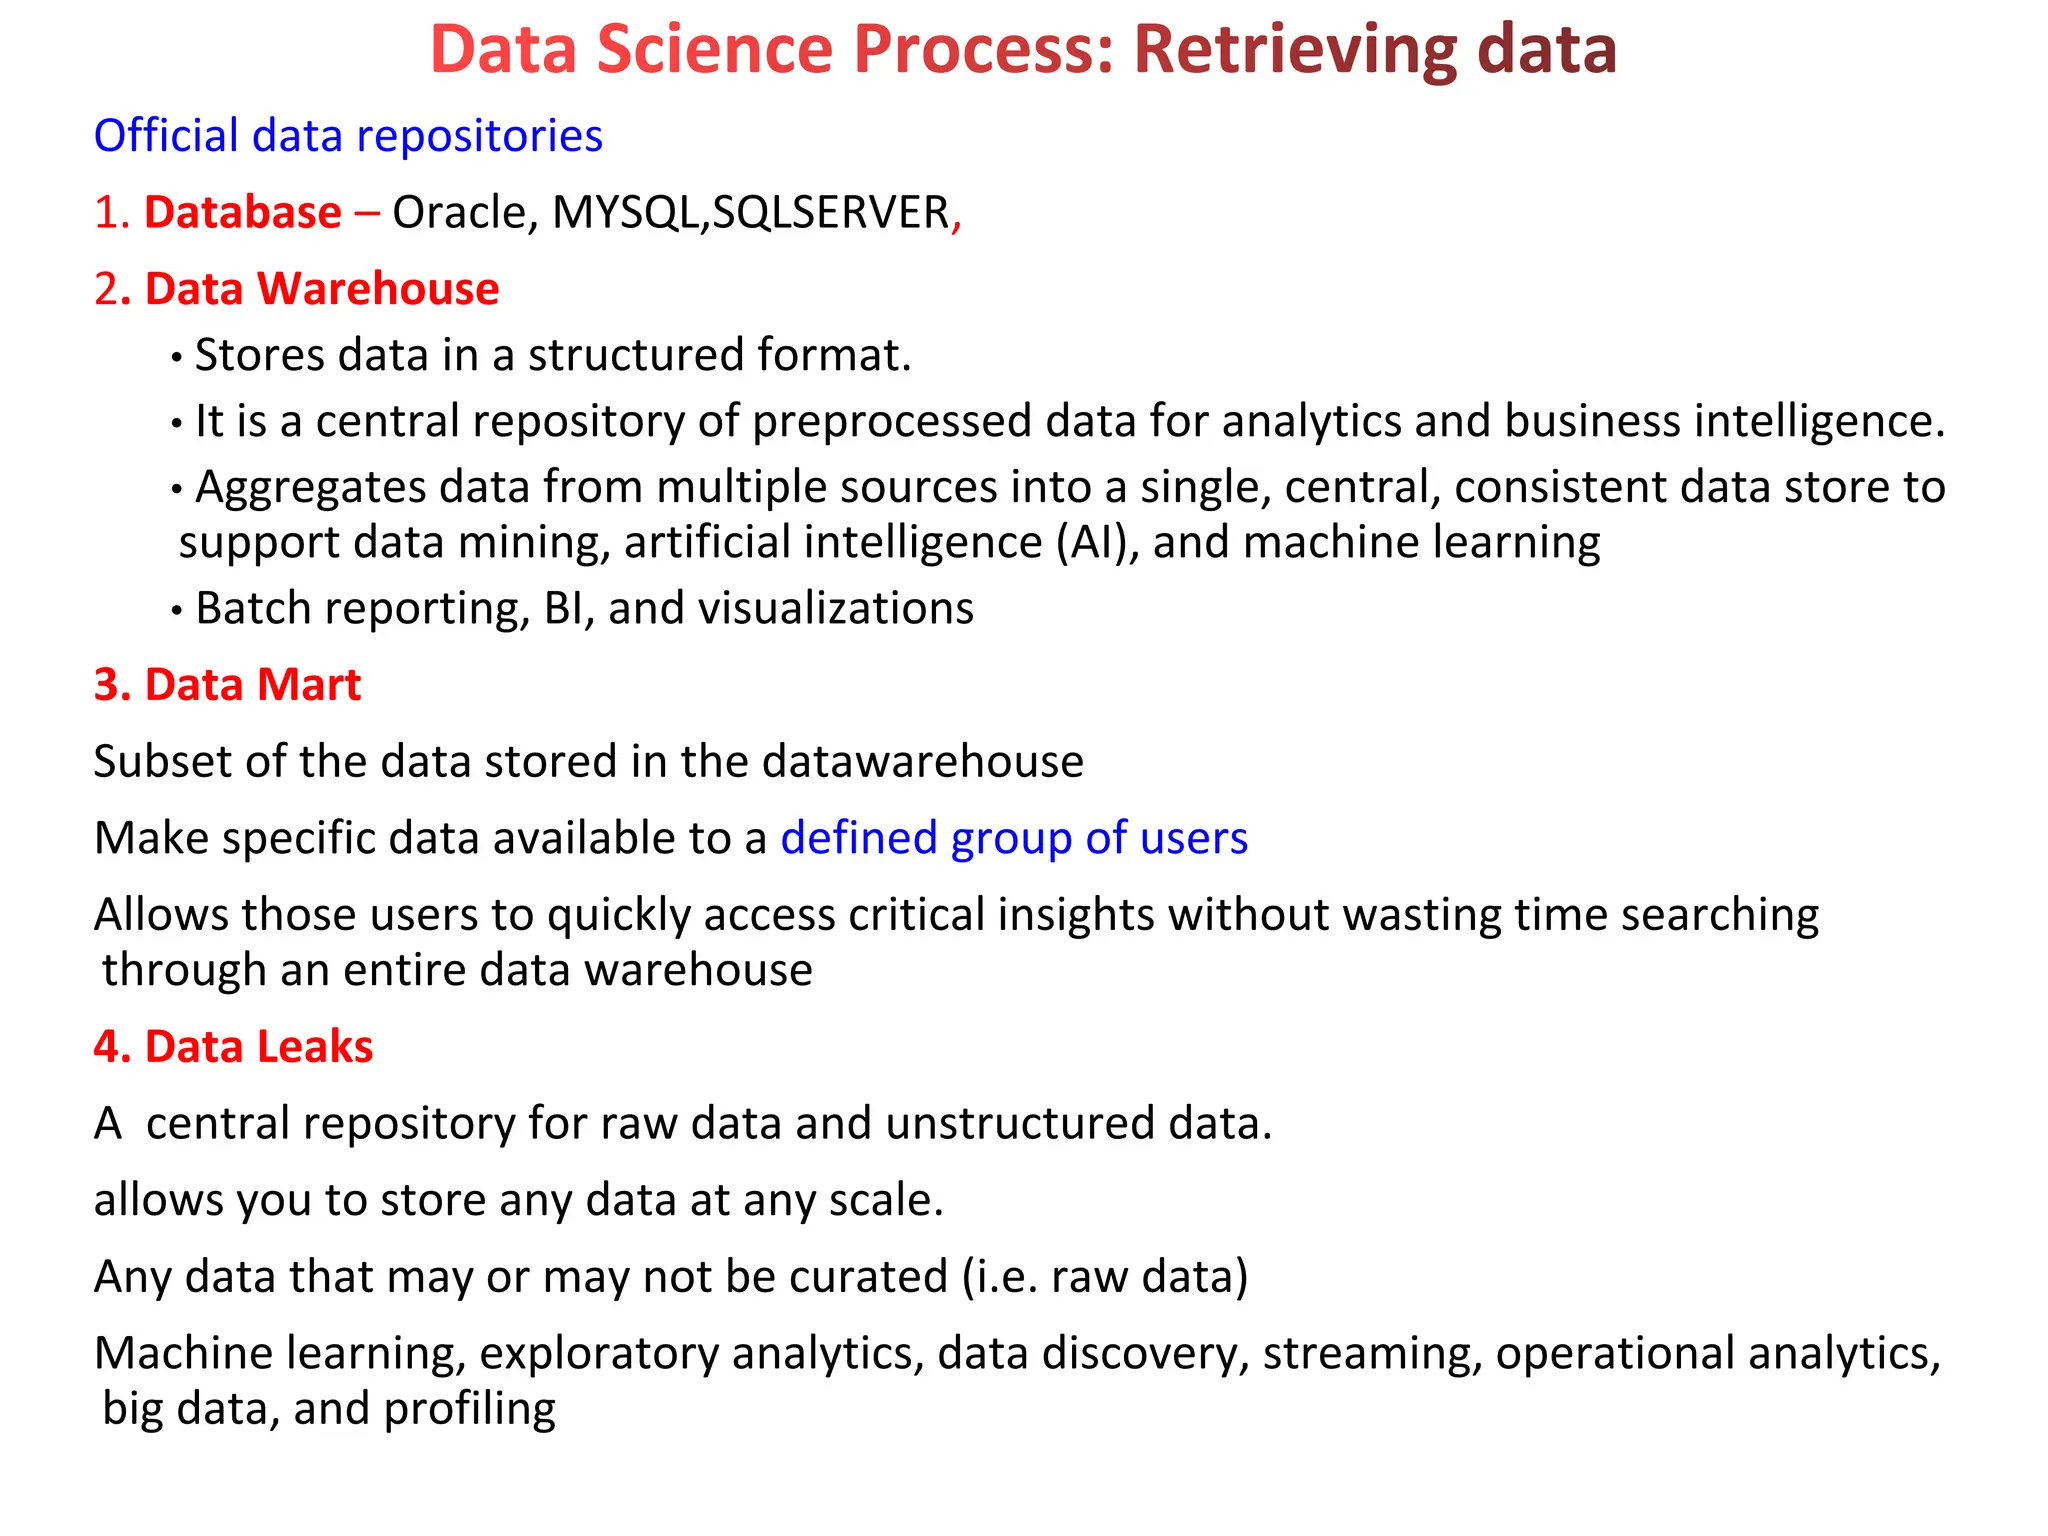
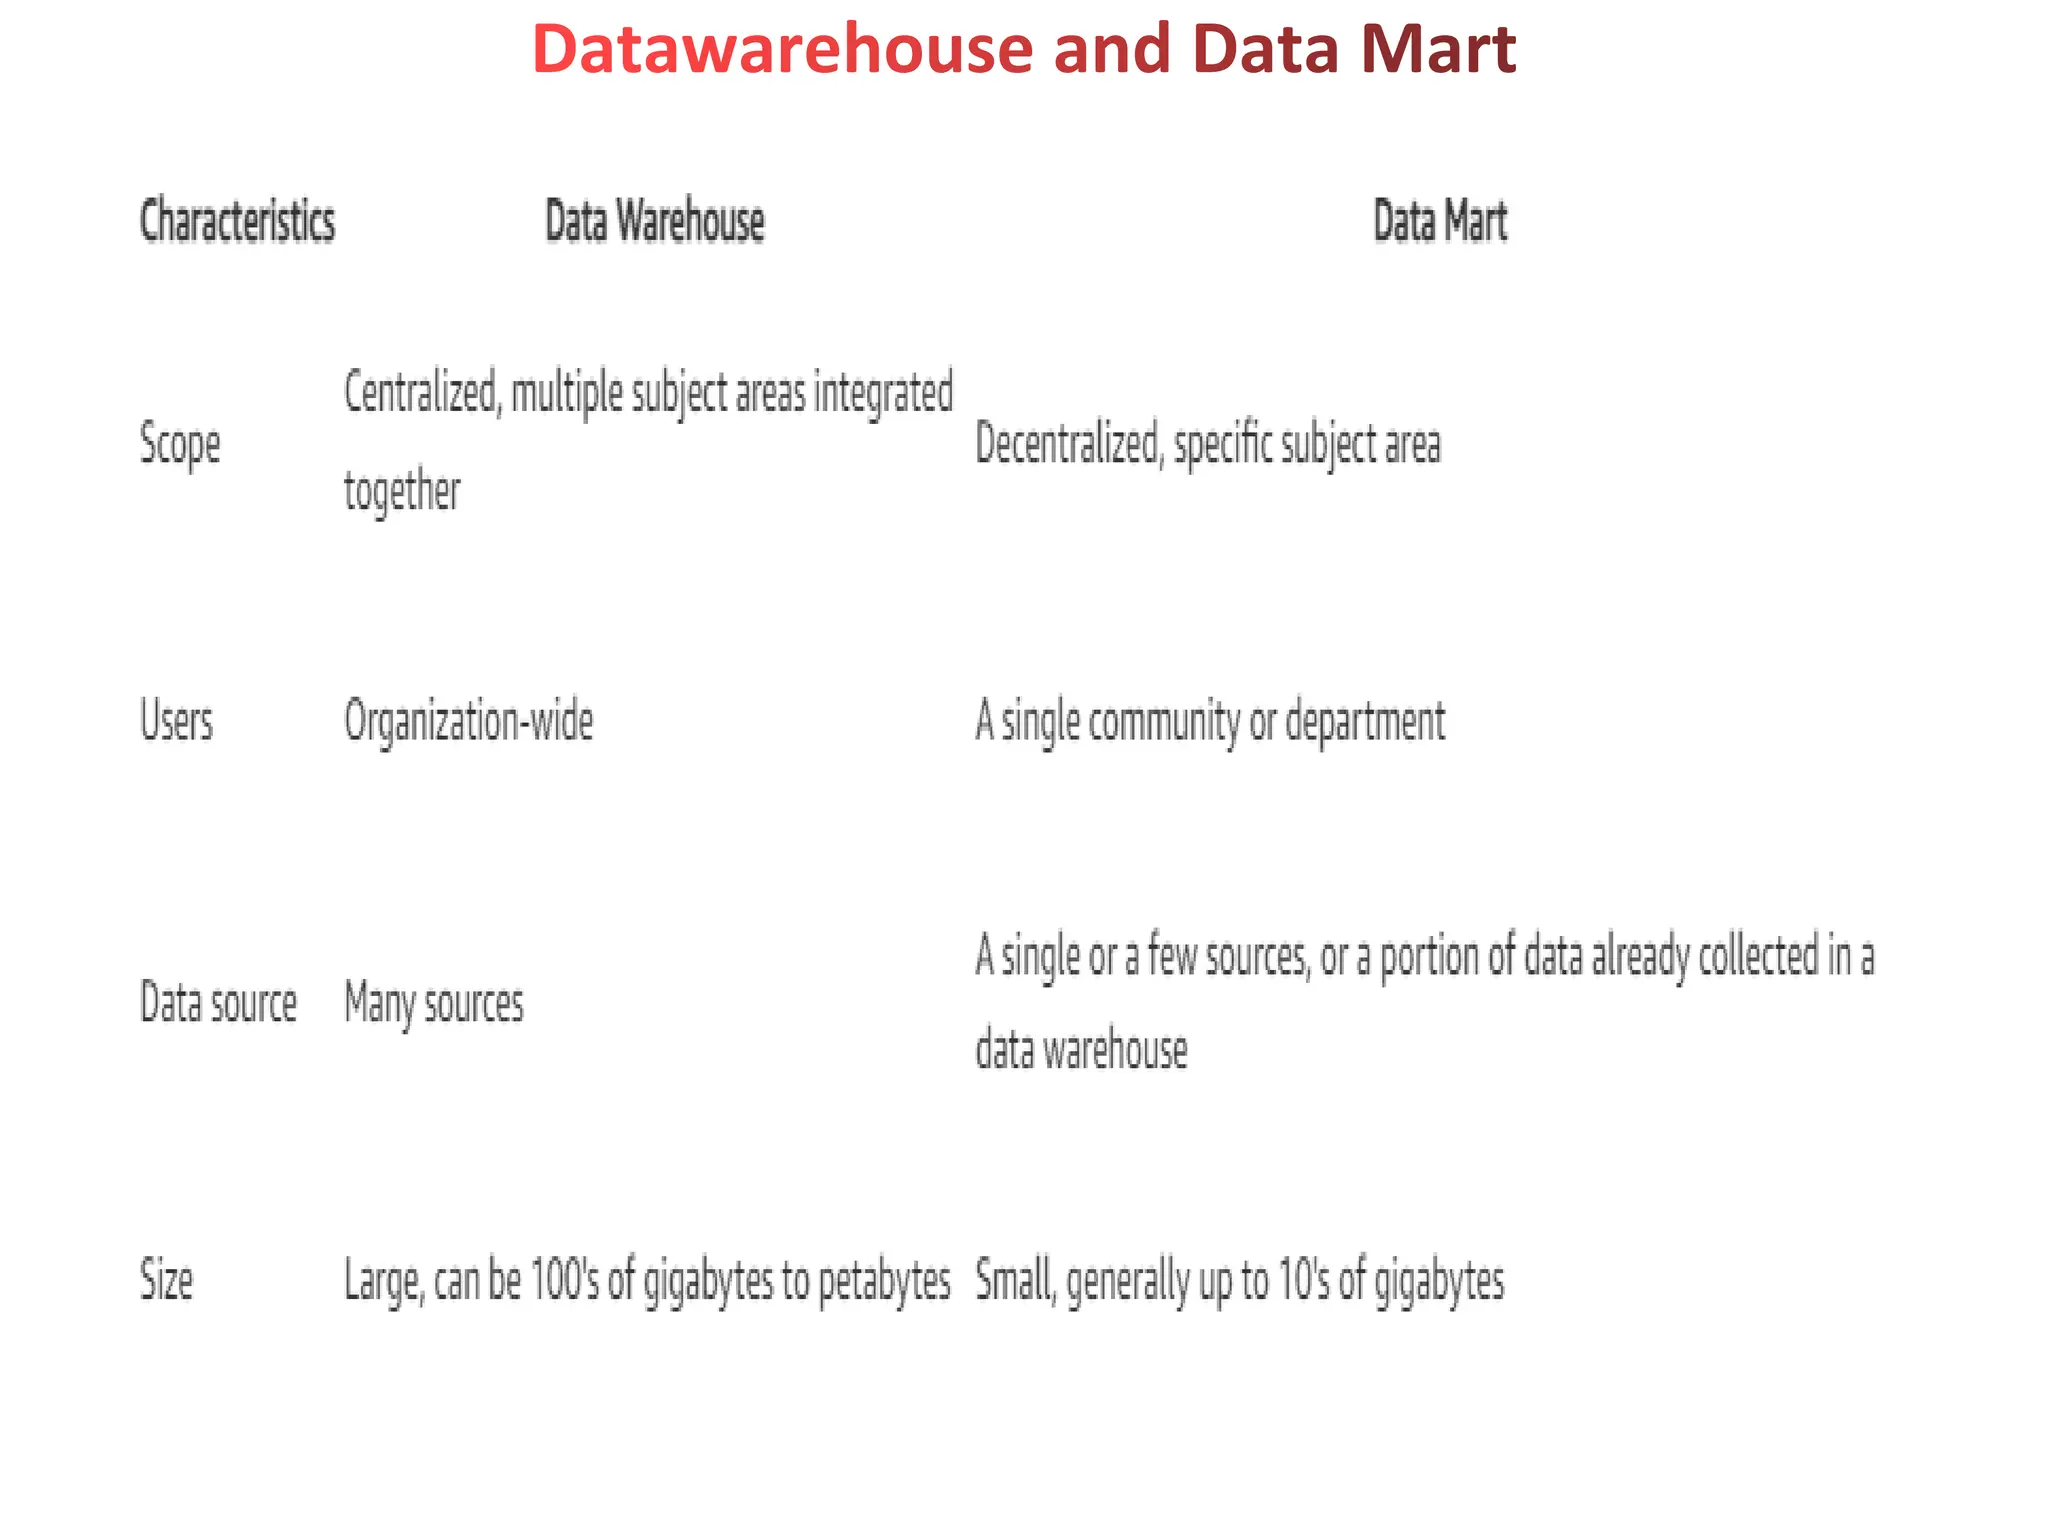
Official data repositories 1.Database – Oracle, MYSQL,SQLSERVER, 2. Data Warehouse • Stores data in a structured format. • It is a central repository of preprocessed data for analytics and business intelligence. • Aggregates data from multiple sources into a single, central, consistent data store to support data mining, artificial intelligence (AI), and machine learning • Batch reporting, BI, and visualizations 3. Data Mart Subset of the data stored in the datawarehouse Make specific data available to a defined group of users Allows those users to quickly access critical insights without wasting time searching through an entire data warehouse 4. Data Leaks A central repository for raw data and unstructured data. allows you to store any data at any scale. Any data that may or may not be curated (i.e. raw data) Machine learning, exploratory analytics, data discovery, streaming, operational analytics, big data, and profiling
21.
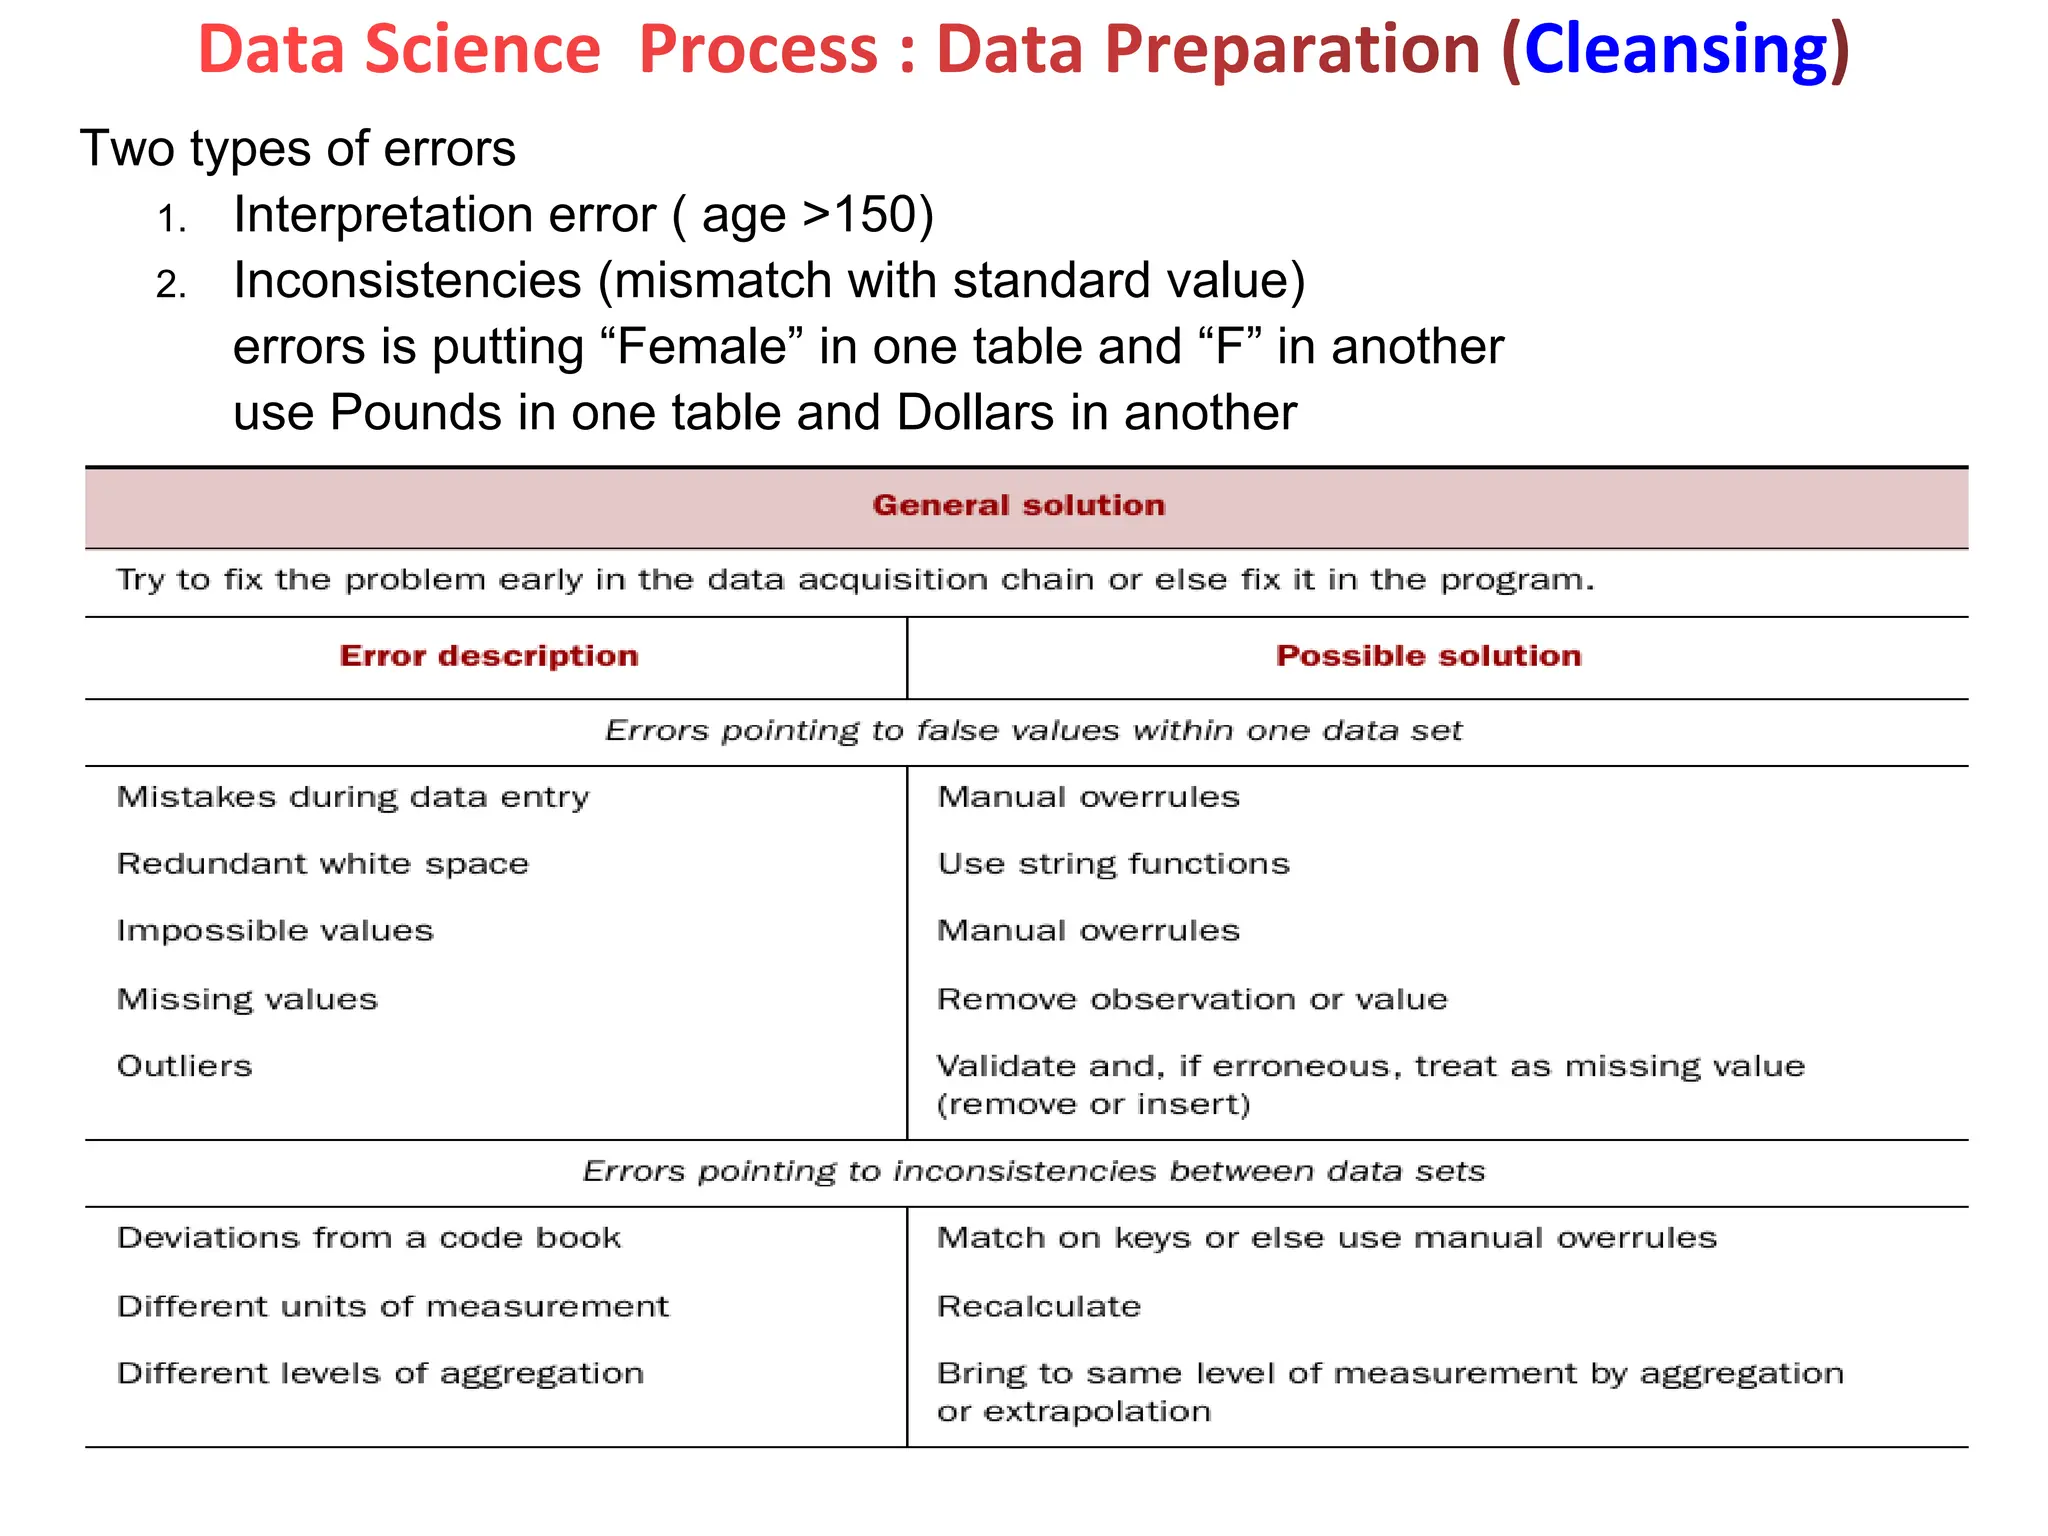
Cleansing Two types oferrors 1. Interpretation error ( age >150) 2. Inconsistencies (mismatch with standard value) errors is putting “Female” in one table and “F” in another use Pounds in one table and Dollars in another
22.
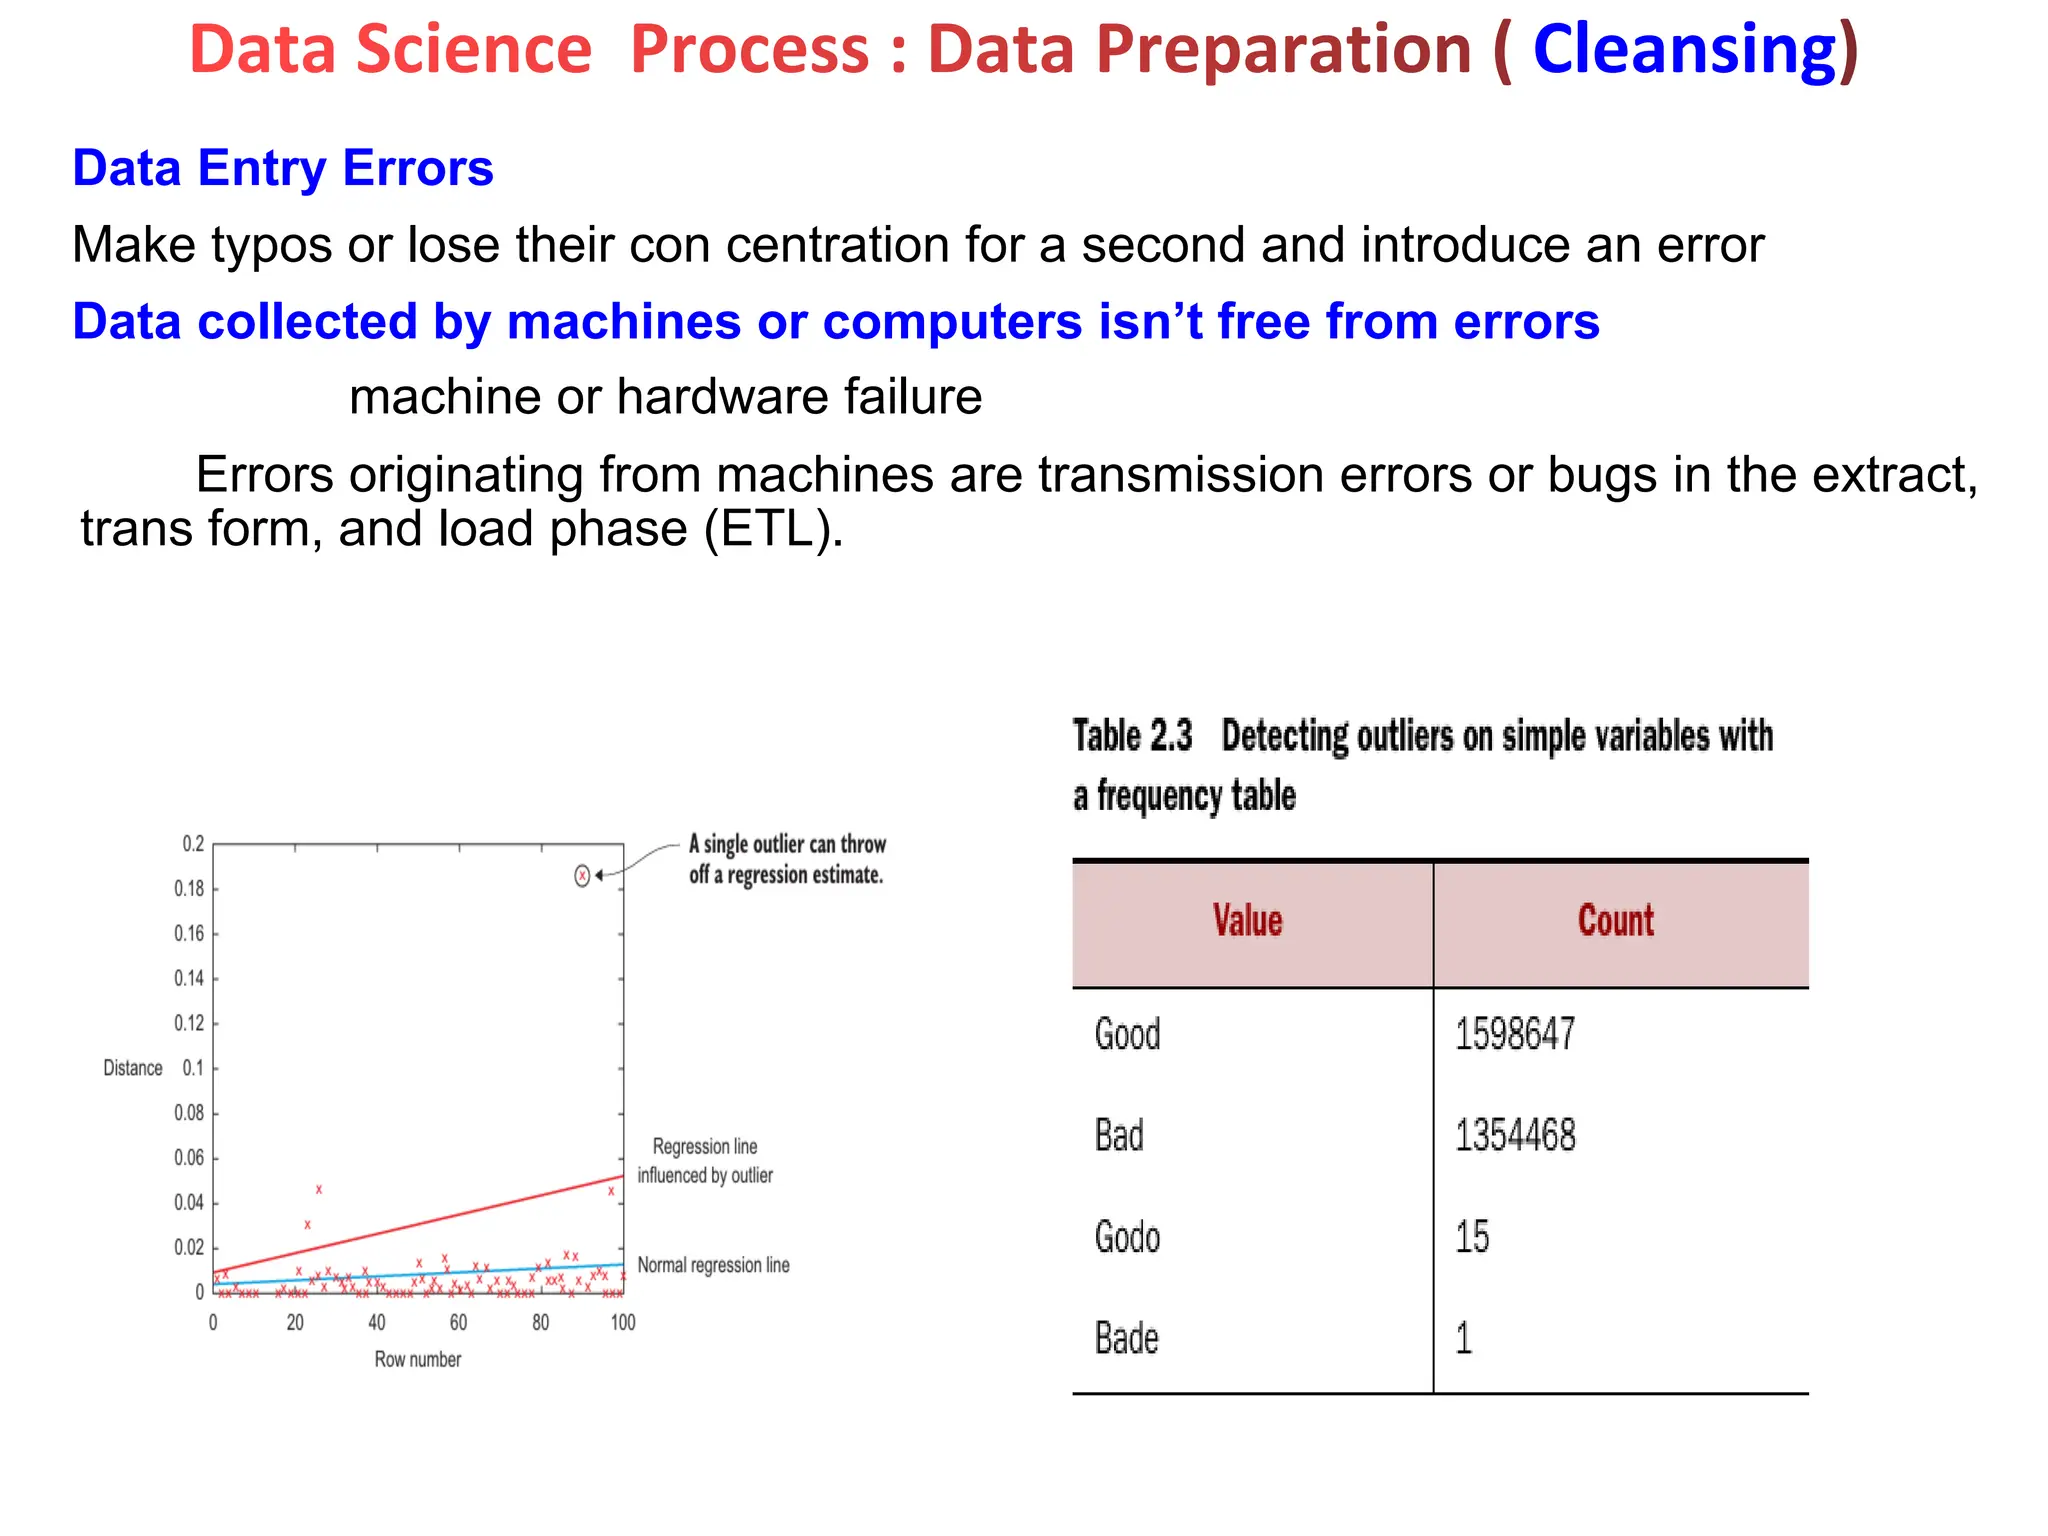
Cleansing Data Entry Errors Maketypos or lose their con centration for a second and introduce an error Data collected by machines or computers isn’t free from errors machine or hardware failure Errors originating from machines are transmission errors or bugs in the extract, trans form, and load phase (ETL).
23.
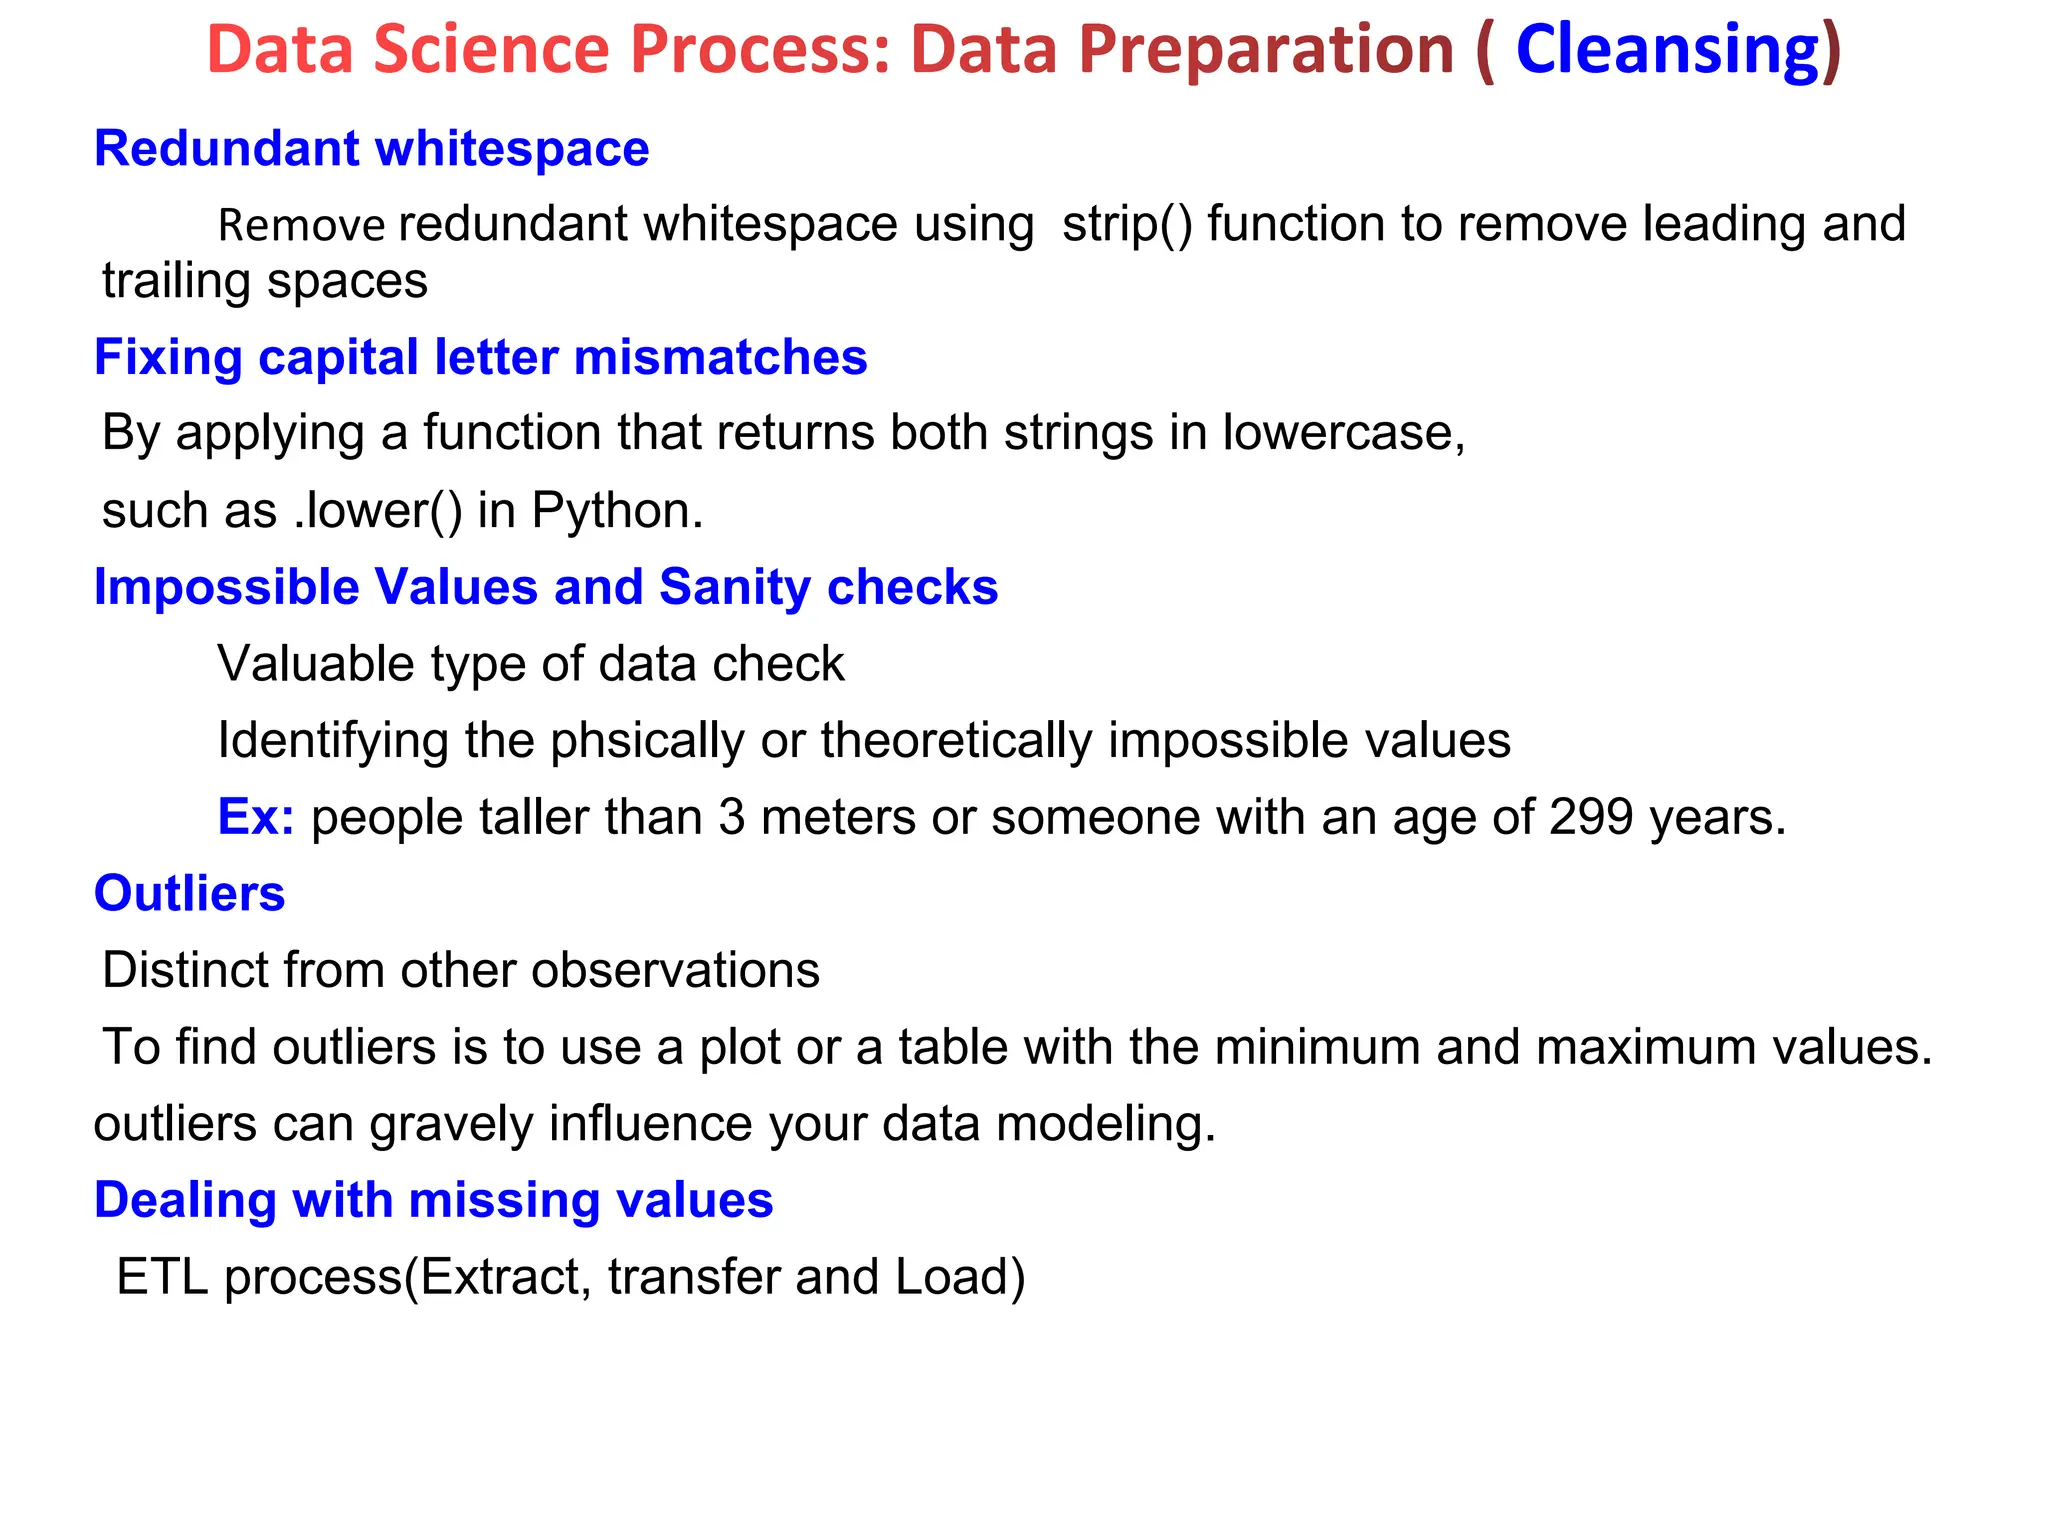
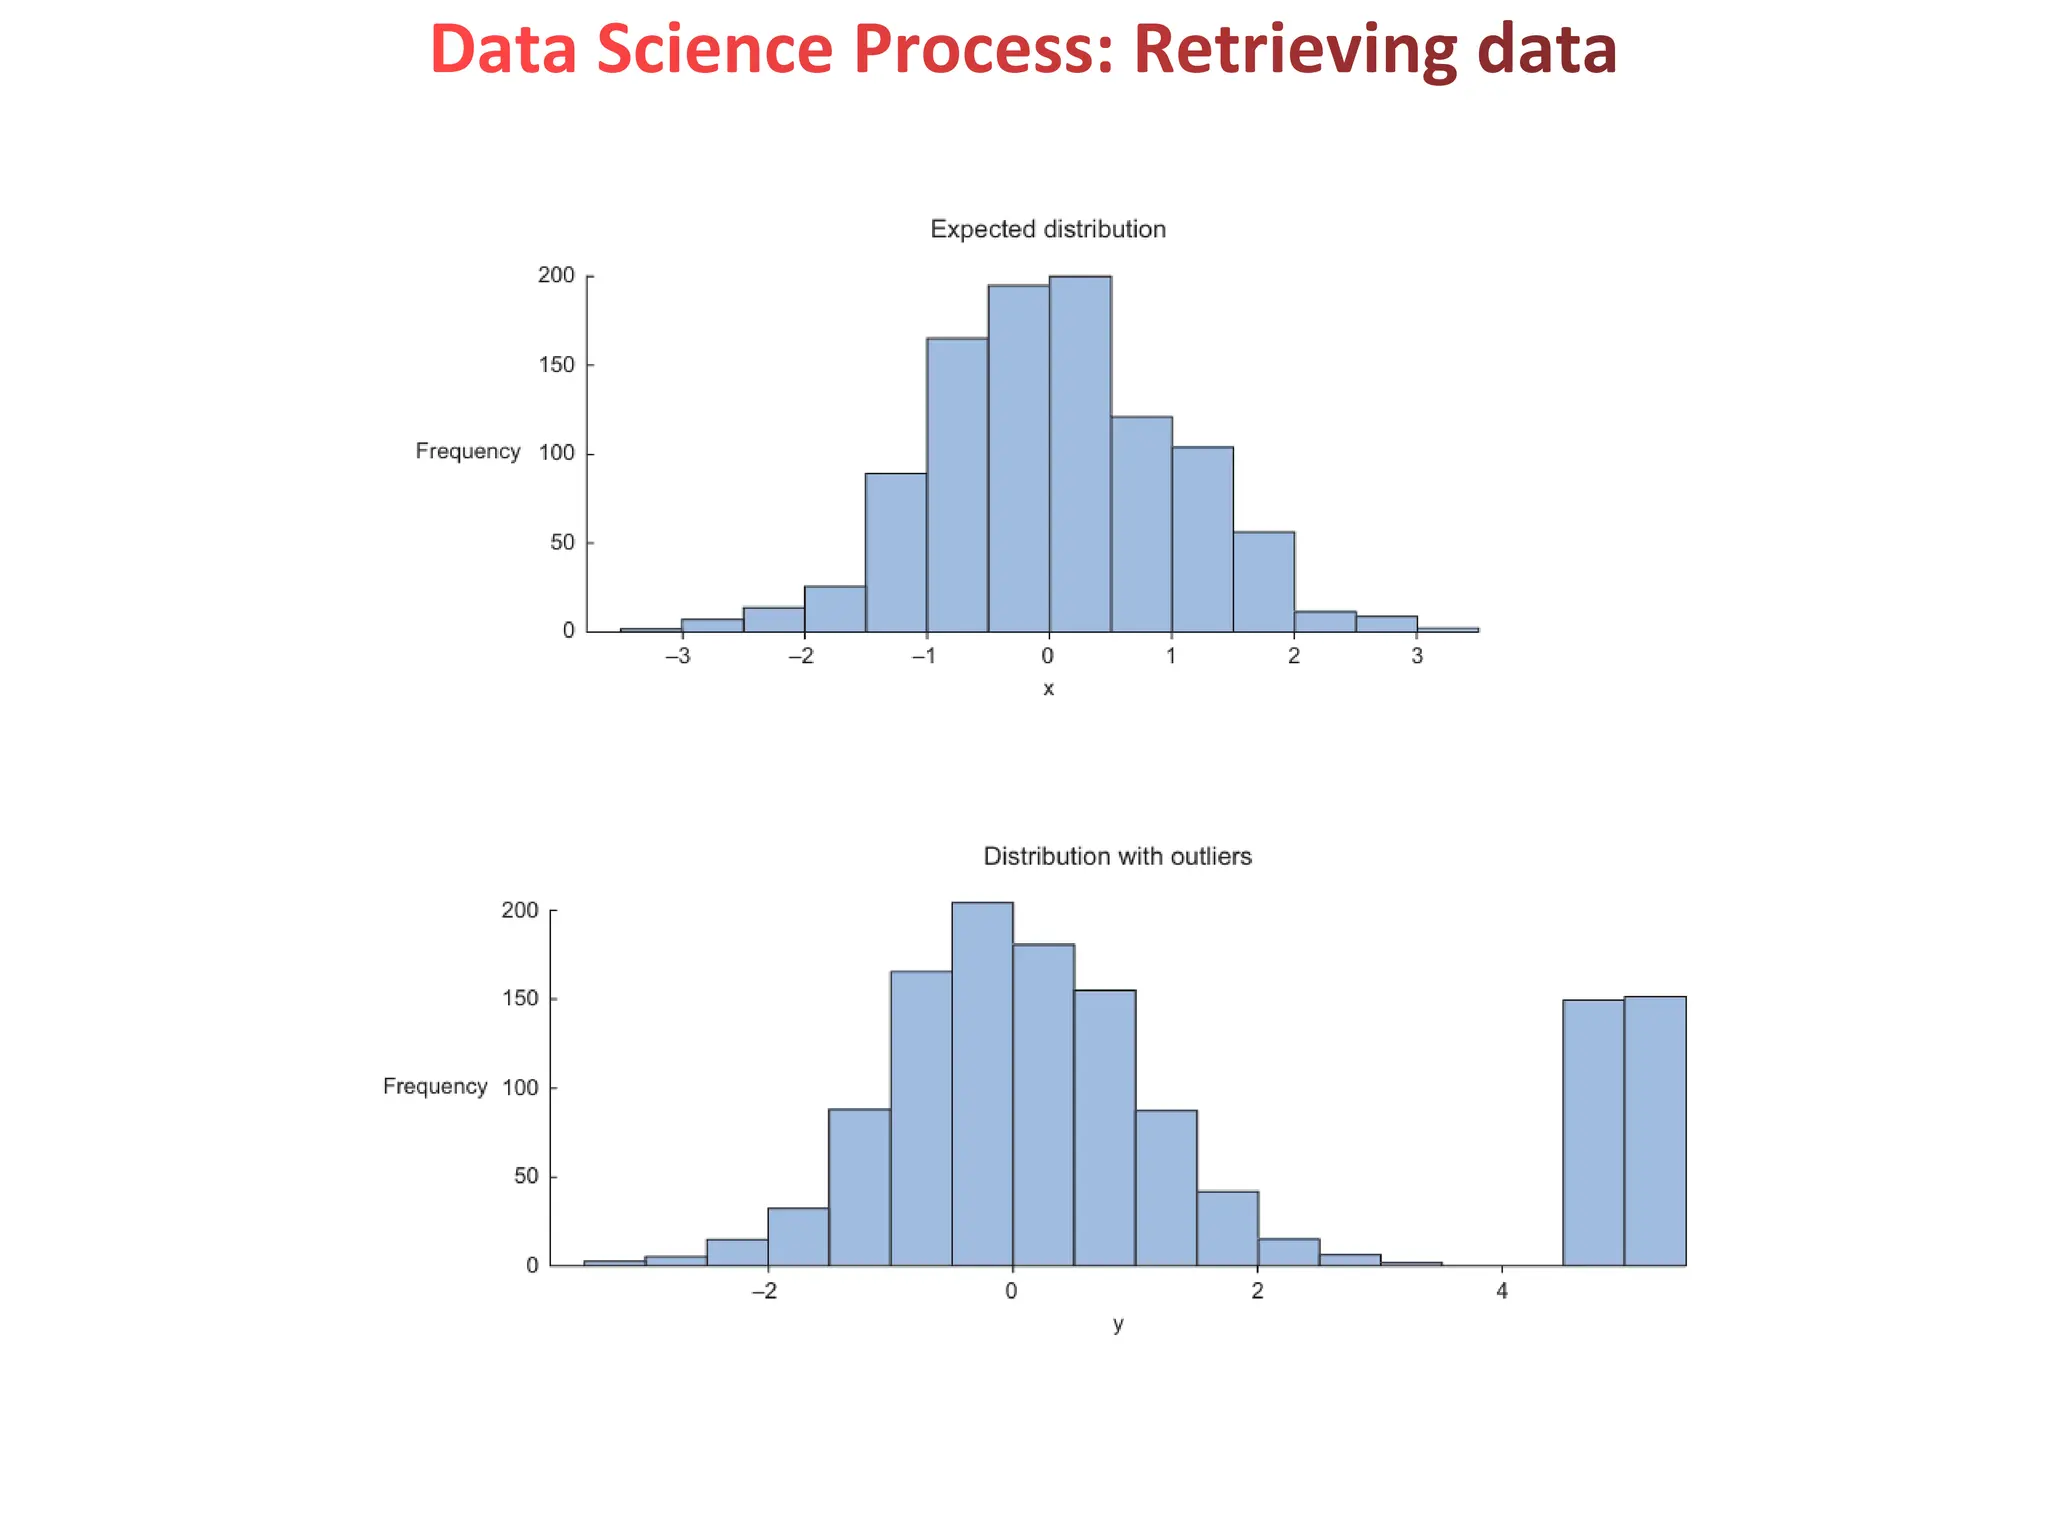
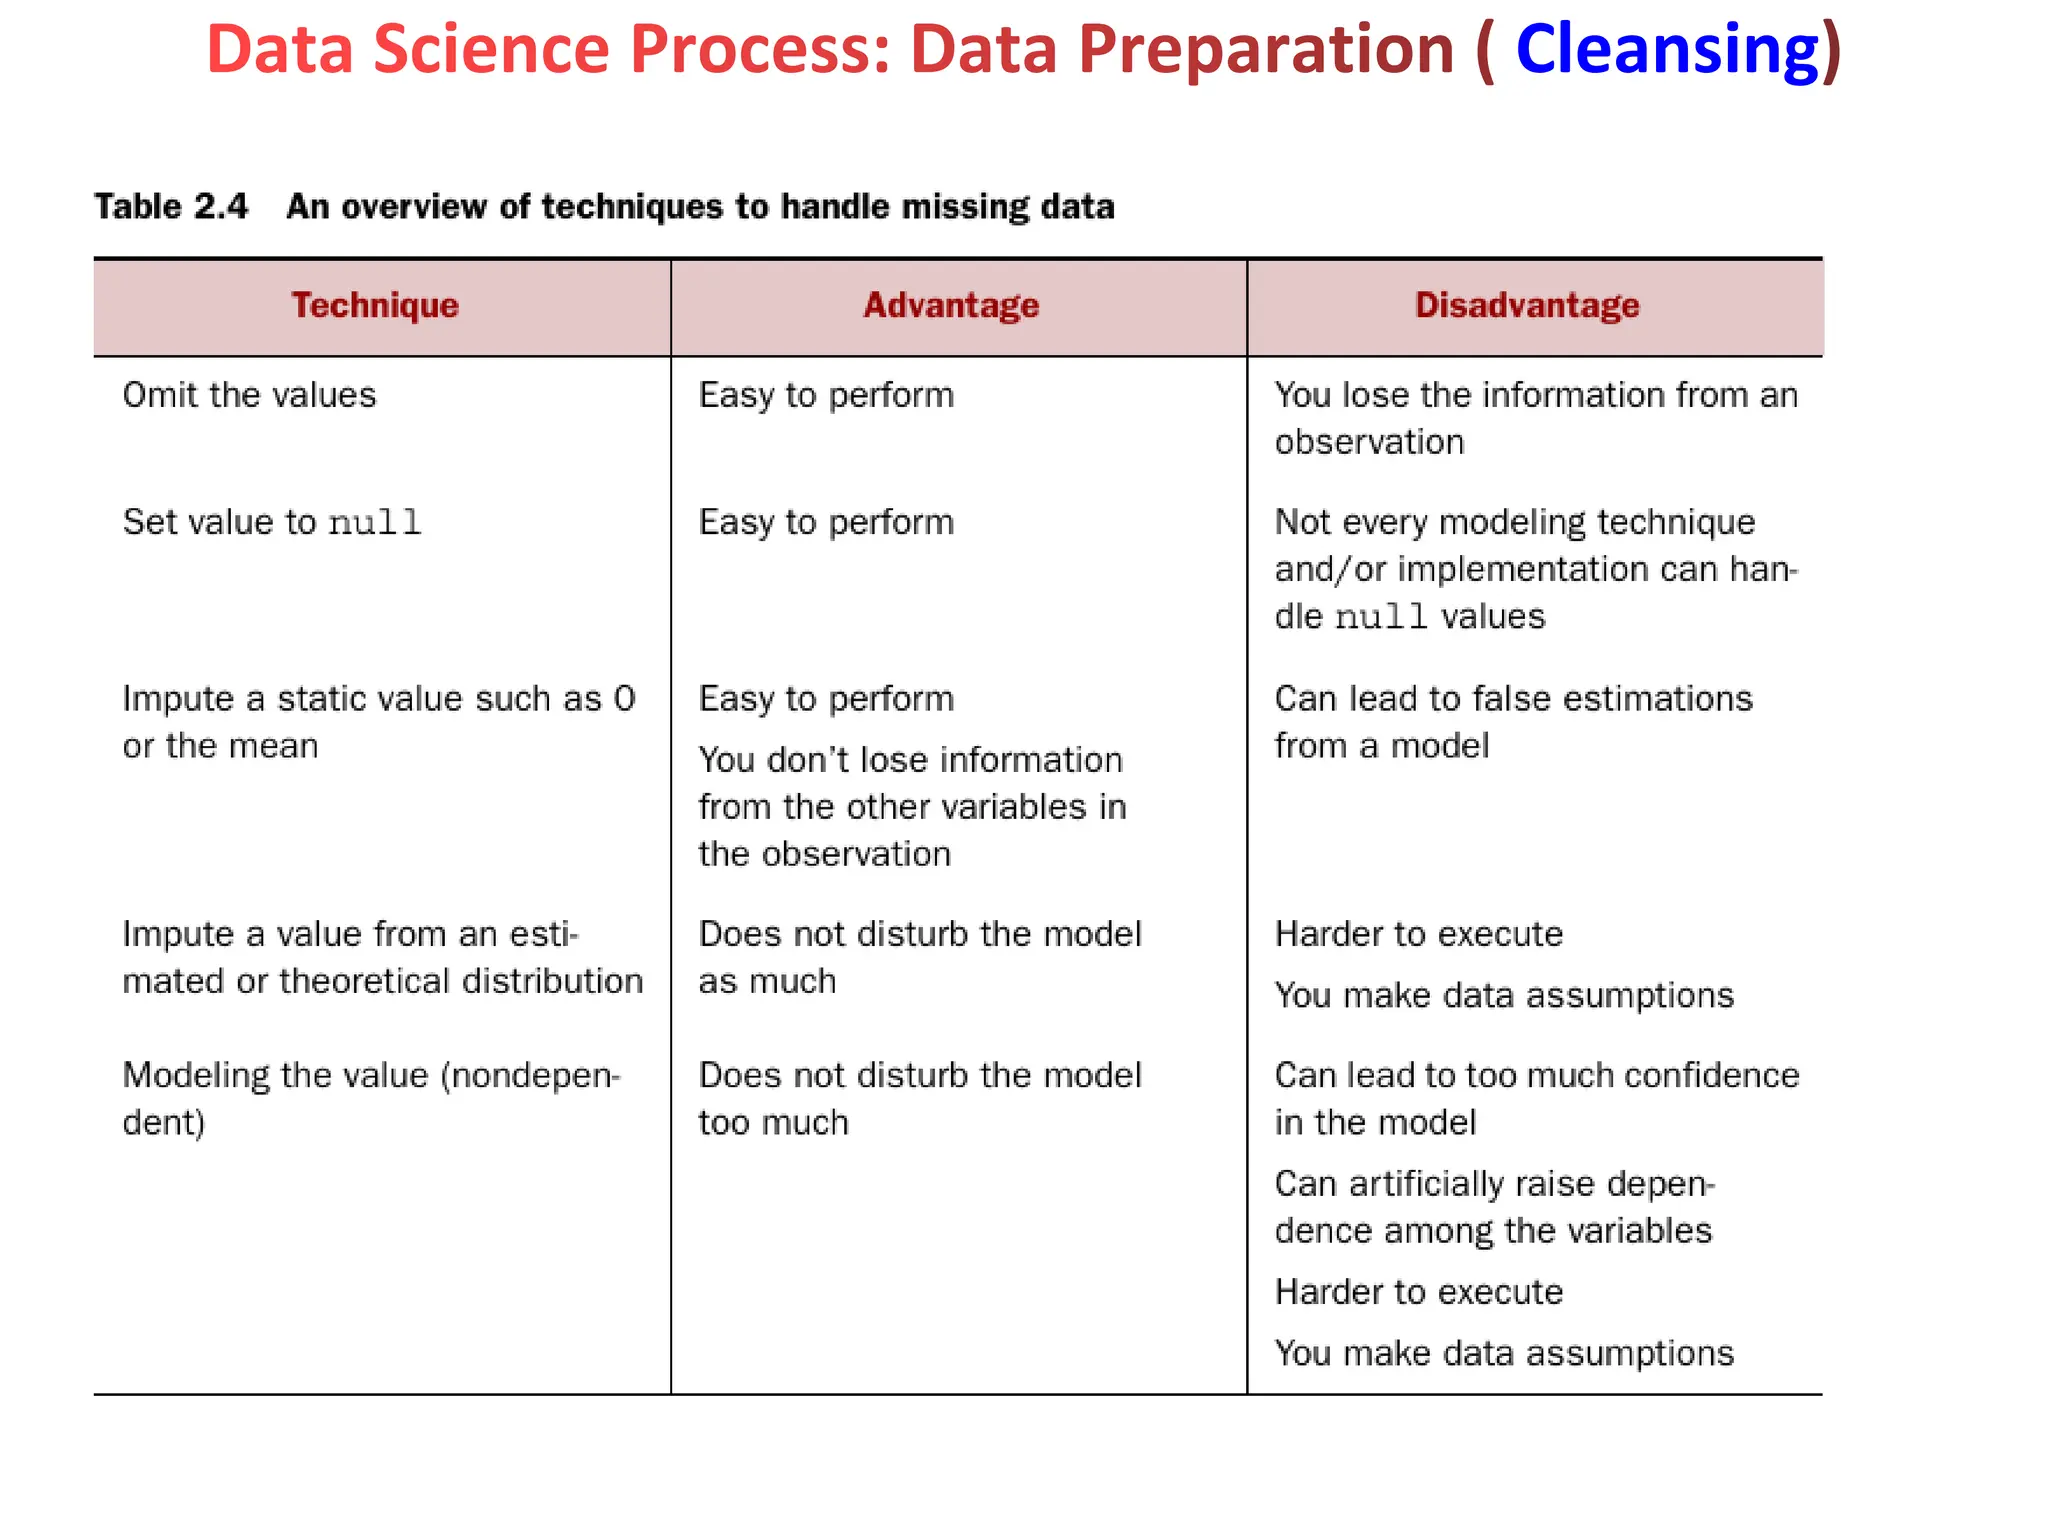
Cleansing Redundant whitespace Remove redundantwhitespace using strip() function to remove leading and trailing spaces Fixing capital letter mismatches By applying a function that returns both strings in lowercase, such as .lower() in Python. Impossible Values and Sanity checks Valuable type of data check Identifying the phsically or theoretically impossible values Ex: people taller than 3 meters or someone with an age of 299 years. Outliers Distinct from other observations To find outliers is to use a plot or a table with the minimum and maximum values. outliers can gravely influence your data modeling. Dealing with missing values ETL process(Extract, transfer and Load)
Cleansing Deviations from acode book Code Book A description of your data, a form of metadata. number of variables per observation, number of observations, what each encoding within a variable means. (For instance “0” equals “negative”, “5” stands for “very positive”.) Detecting error in the large dataset using let of operations Different units of measurement Integrating two data sets - units of measurement must be same prices per gallon , prices per liter for prices of petrol Different levels of aggregation Occurs from different data sources.