Big data • Bigdata collection of data sets so large or complex that it becomes difficult to process them using traditional data management techniques such as, for example, the RDBMS • Data science involves using methods to analyze massive amounts of data and extract the knowledge it contains. • big data and data science like the relationship between crude oil and an oil refinery • Data science and big data evolved from statistics and traditional data management
3.
• The characteristicsof big data are often referred to as the three Vs: ■ Volume—How much data is there? ■ ■ Variety —How diverse are different types of data? ■ ■ Velocity—At what speed is new data generated?
4.
Facets of data •The main categories of data are these: • Structured • Unstructured • Natural language Machine-generated Graph-based Audio • video • images Streaming
5.
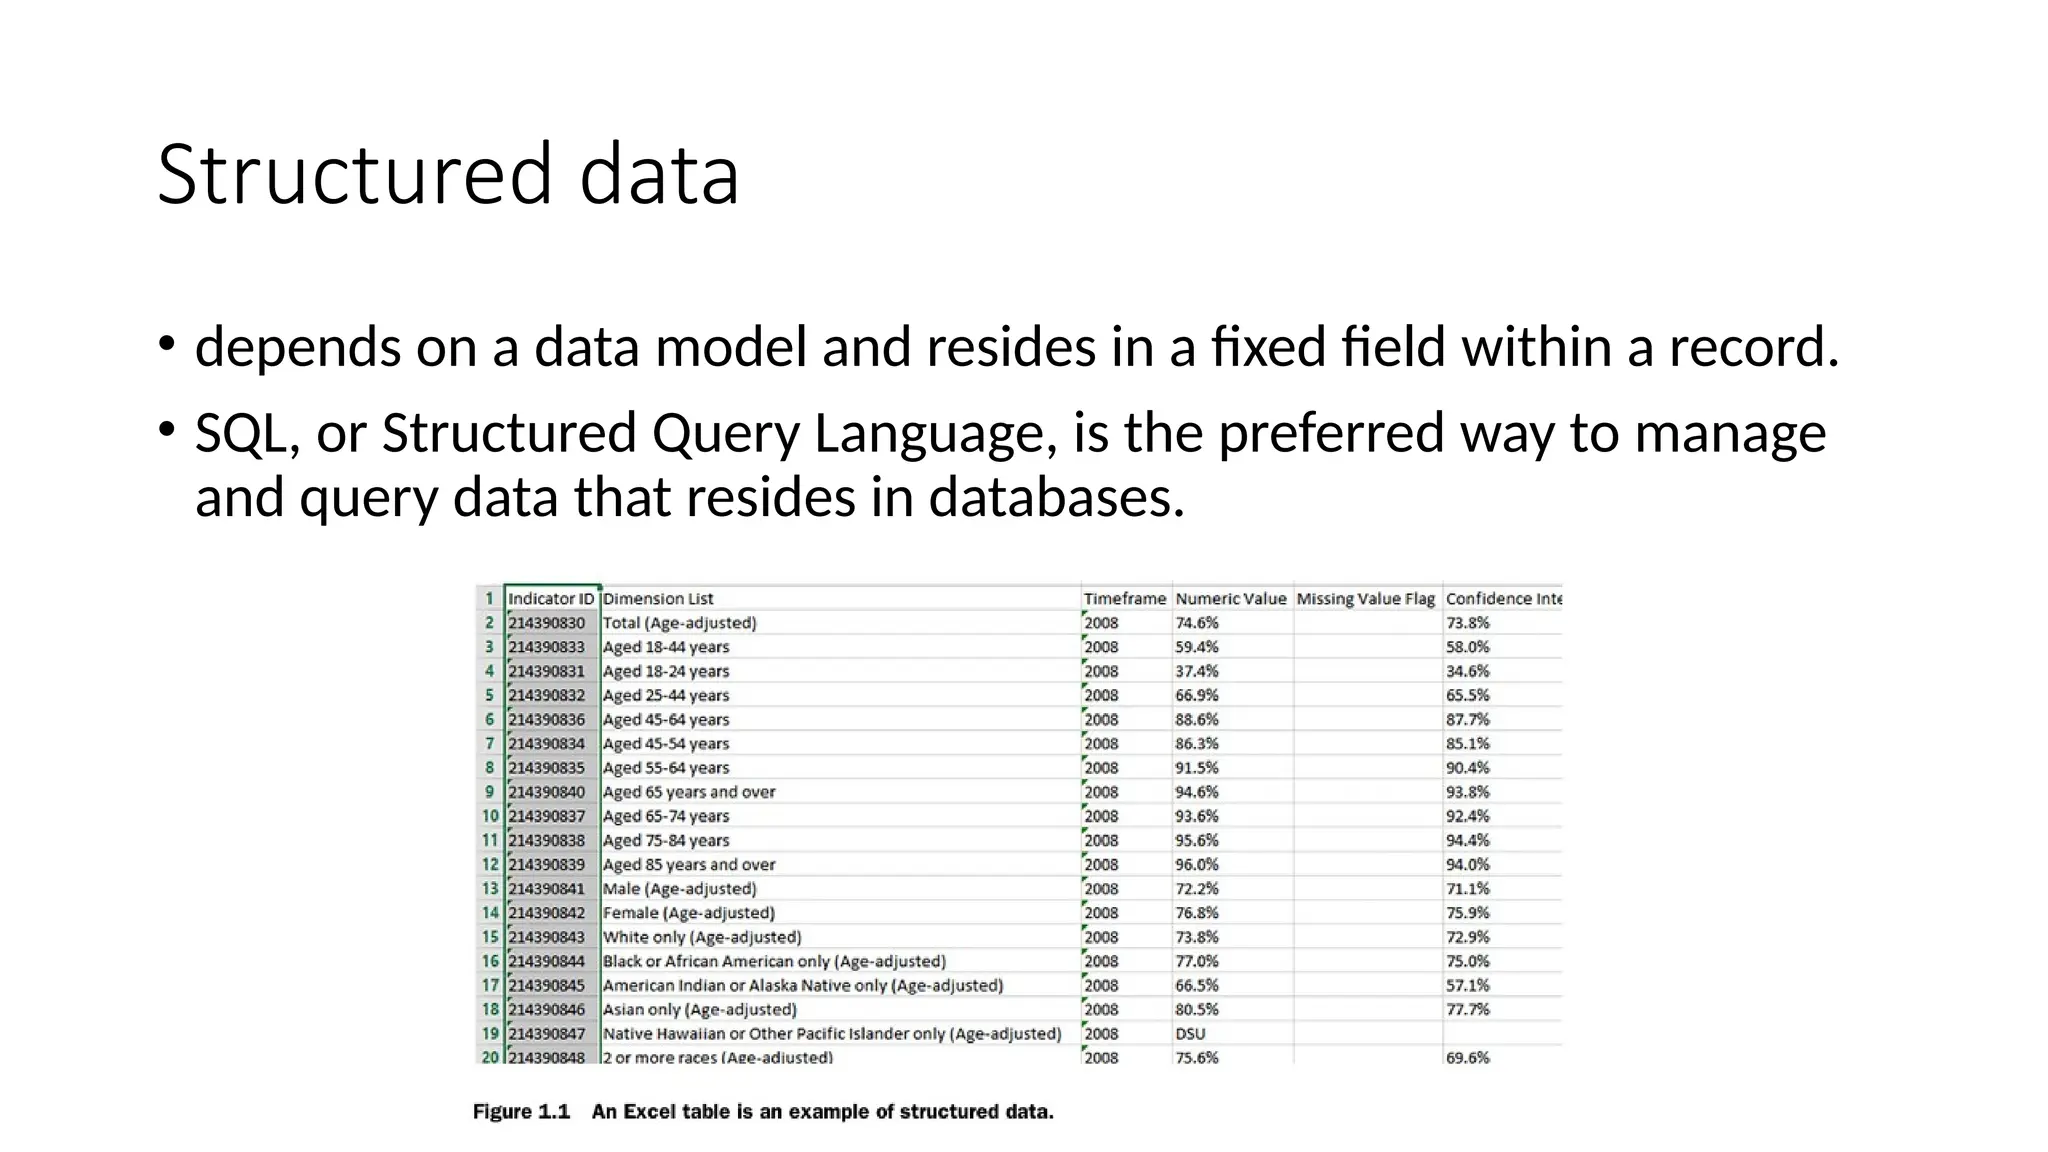
Structured data • dependson a data model and resides in a fixed field within a record. • SQL, or Structured Query Language, is the preferred way to manage and query data that resides in databases.
6.
Unstructured data • datathat isn’t easy to fit into a data model because the content is context-specific or varying. • One example : regular email • Natural language requires knowledge of specific data science techniques and linguistics. • entity recognition, topic recognition, summarization, text completion, and sentiment analysis, but mod els trained in one domain don’t generalize well to other domains.
7.
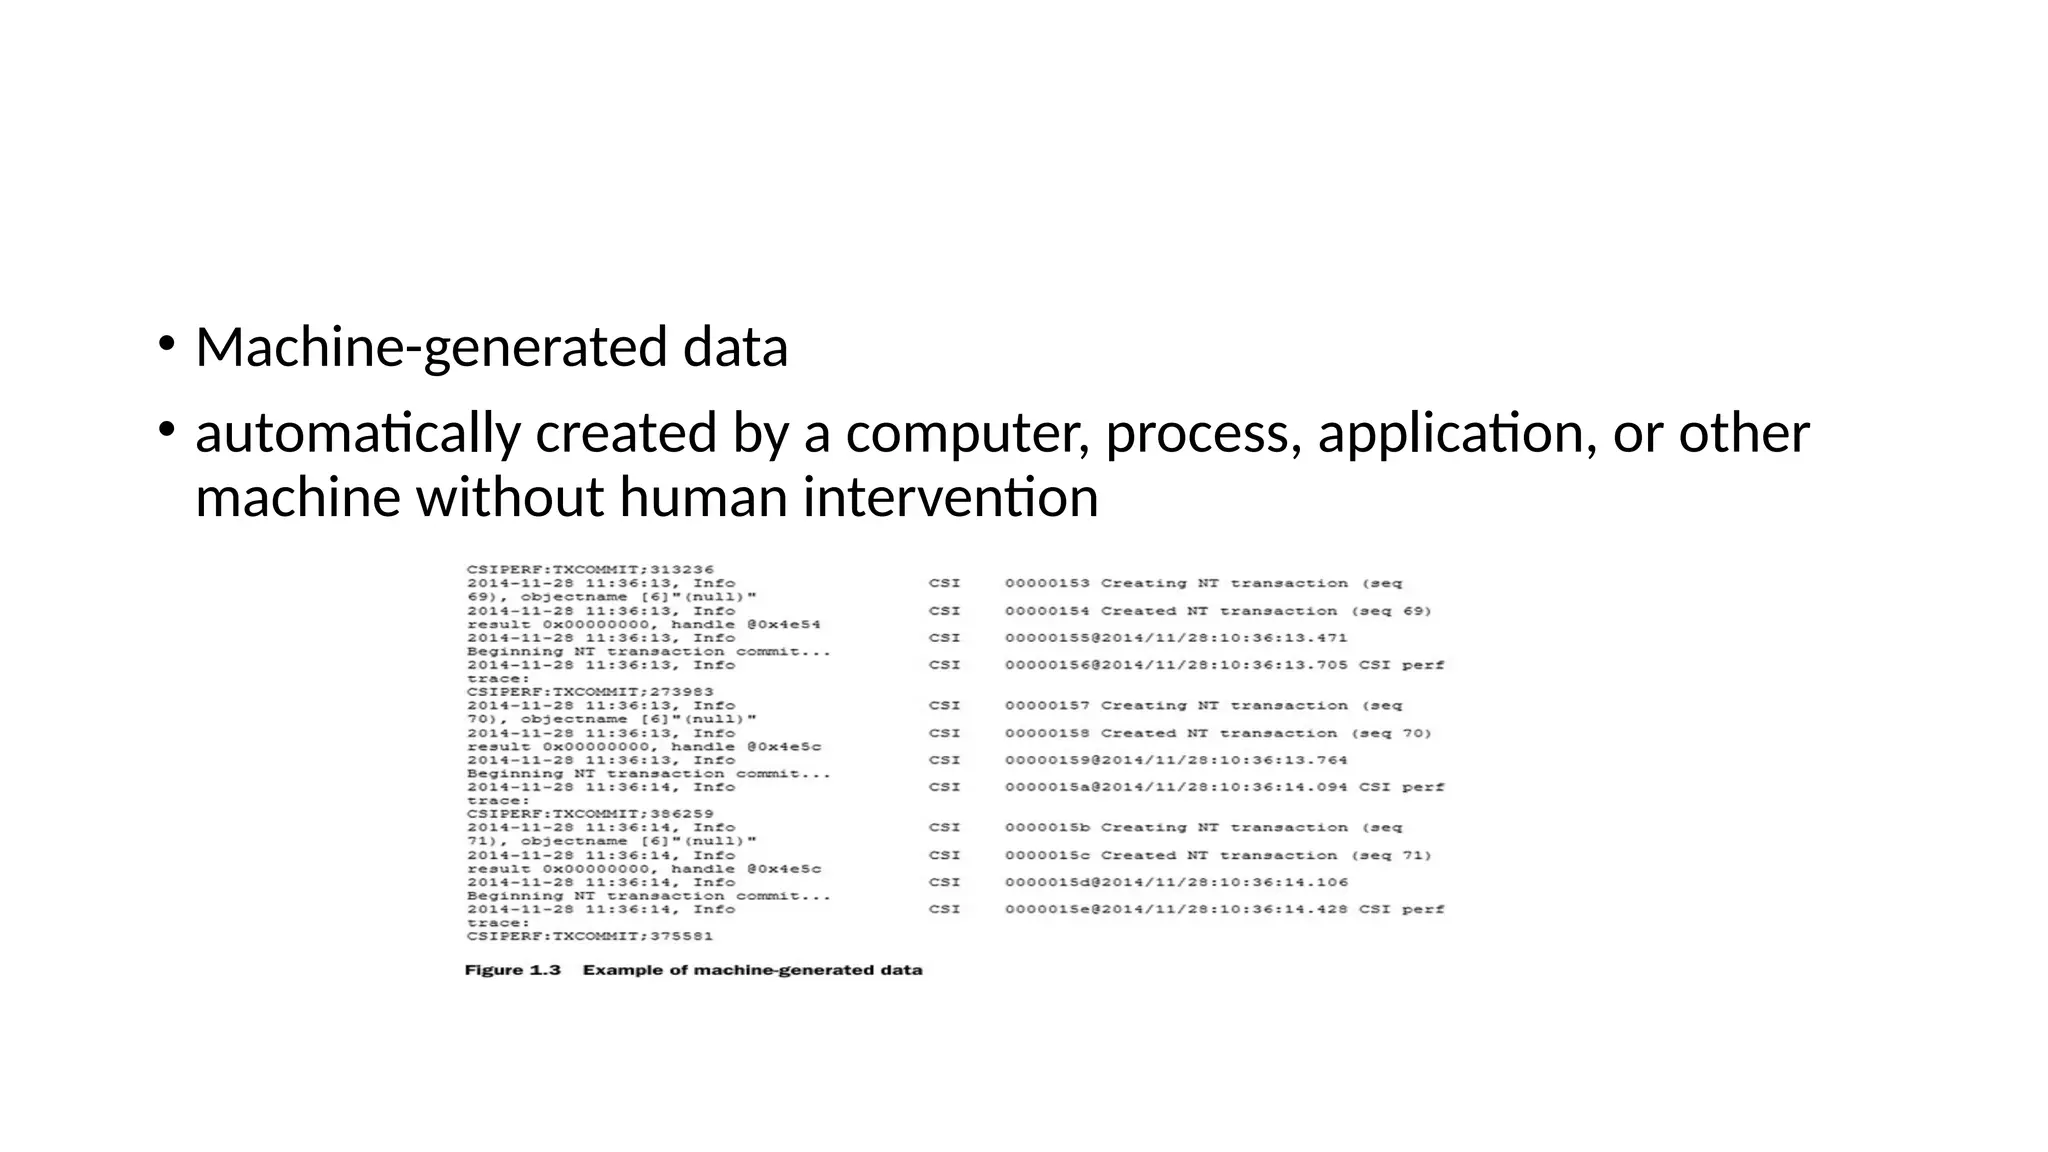
• Machine-generated data •automatically created by a computer, process, application, or other machine without human intervention
8.
• Graph-based ornetwork data • graph is a mathematical structure to model pair-wise relationships between objects. • focuses on the relationship or adjacency of objects. • The graph structures use nodes, edges, and properties to represent and store graphical data • social networks, and its structure allows to calculate specific metrics such as the influence of a person and the shortest path between two people.
9.
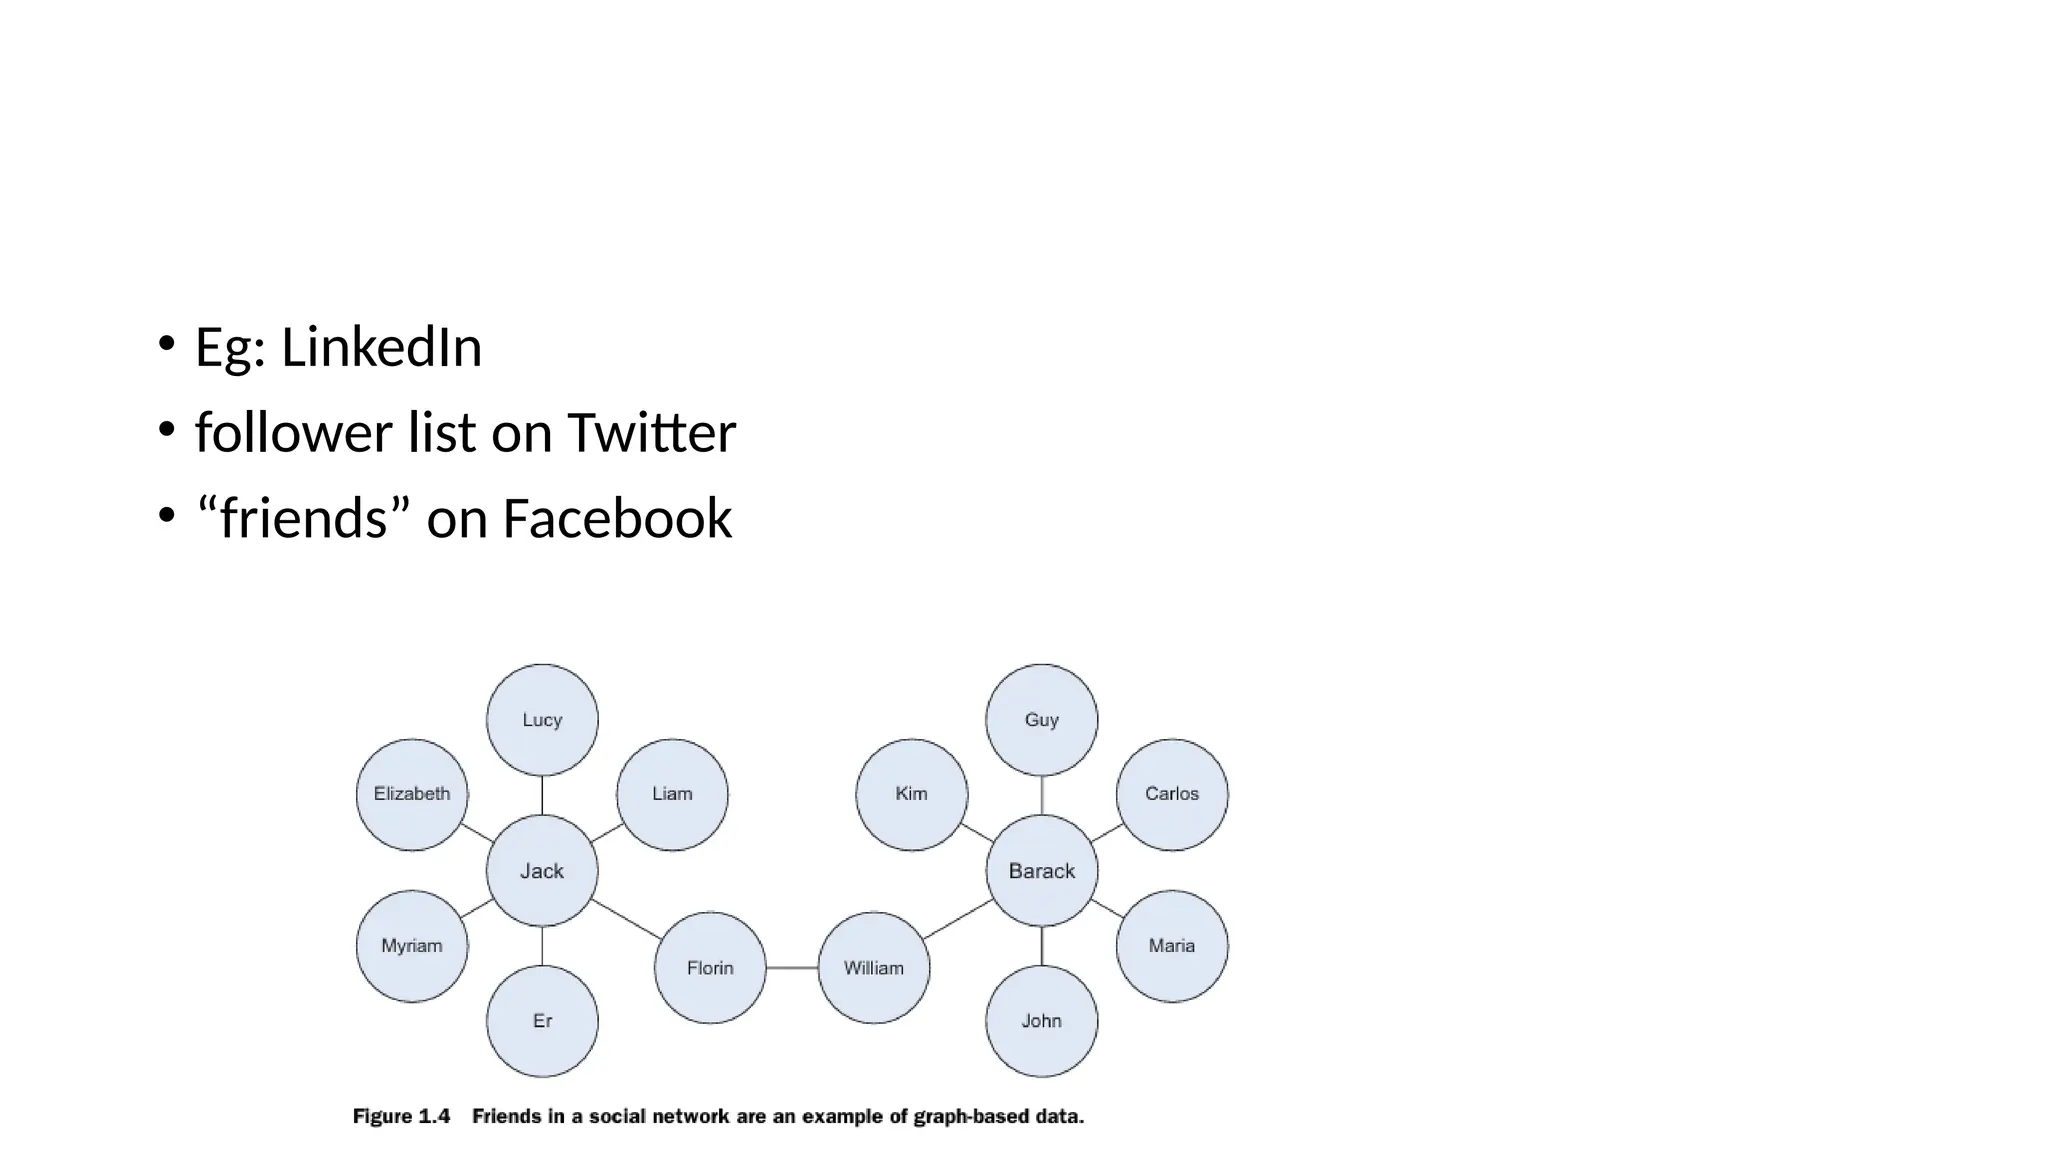
• Eg: LinkedIn •follower list on Twitter • “friends” on Facebook
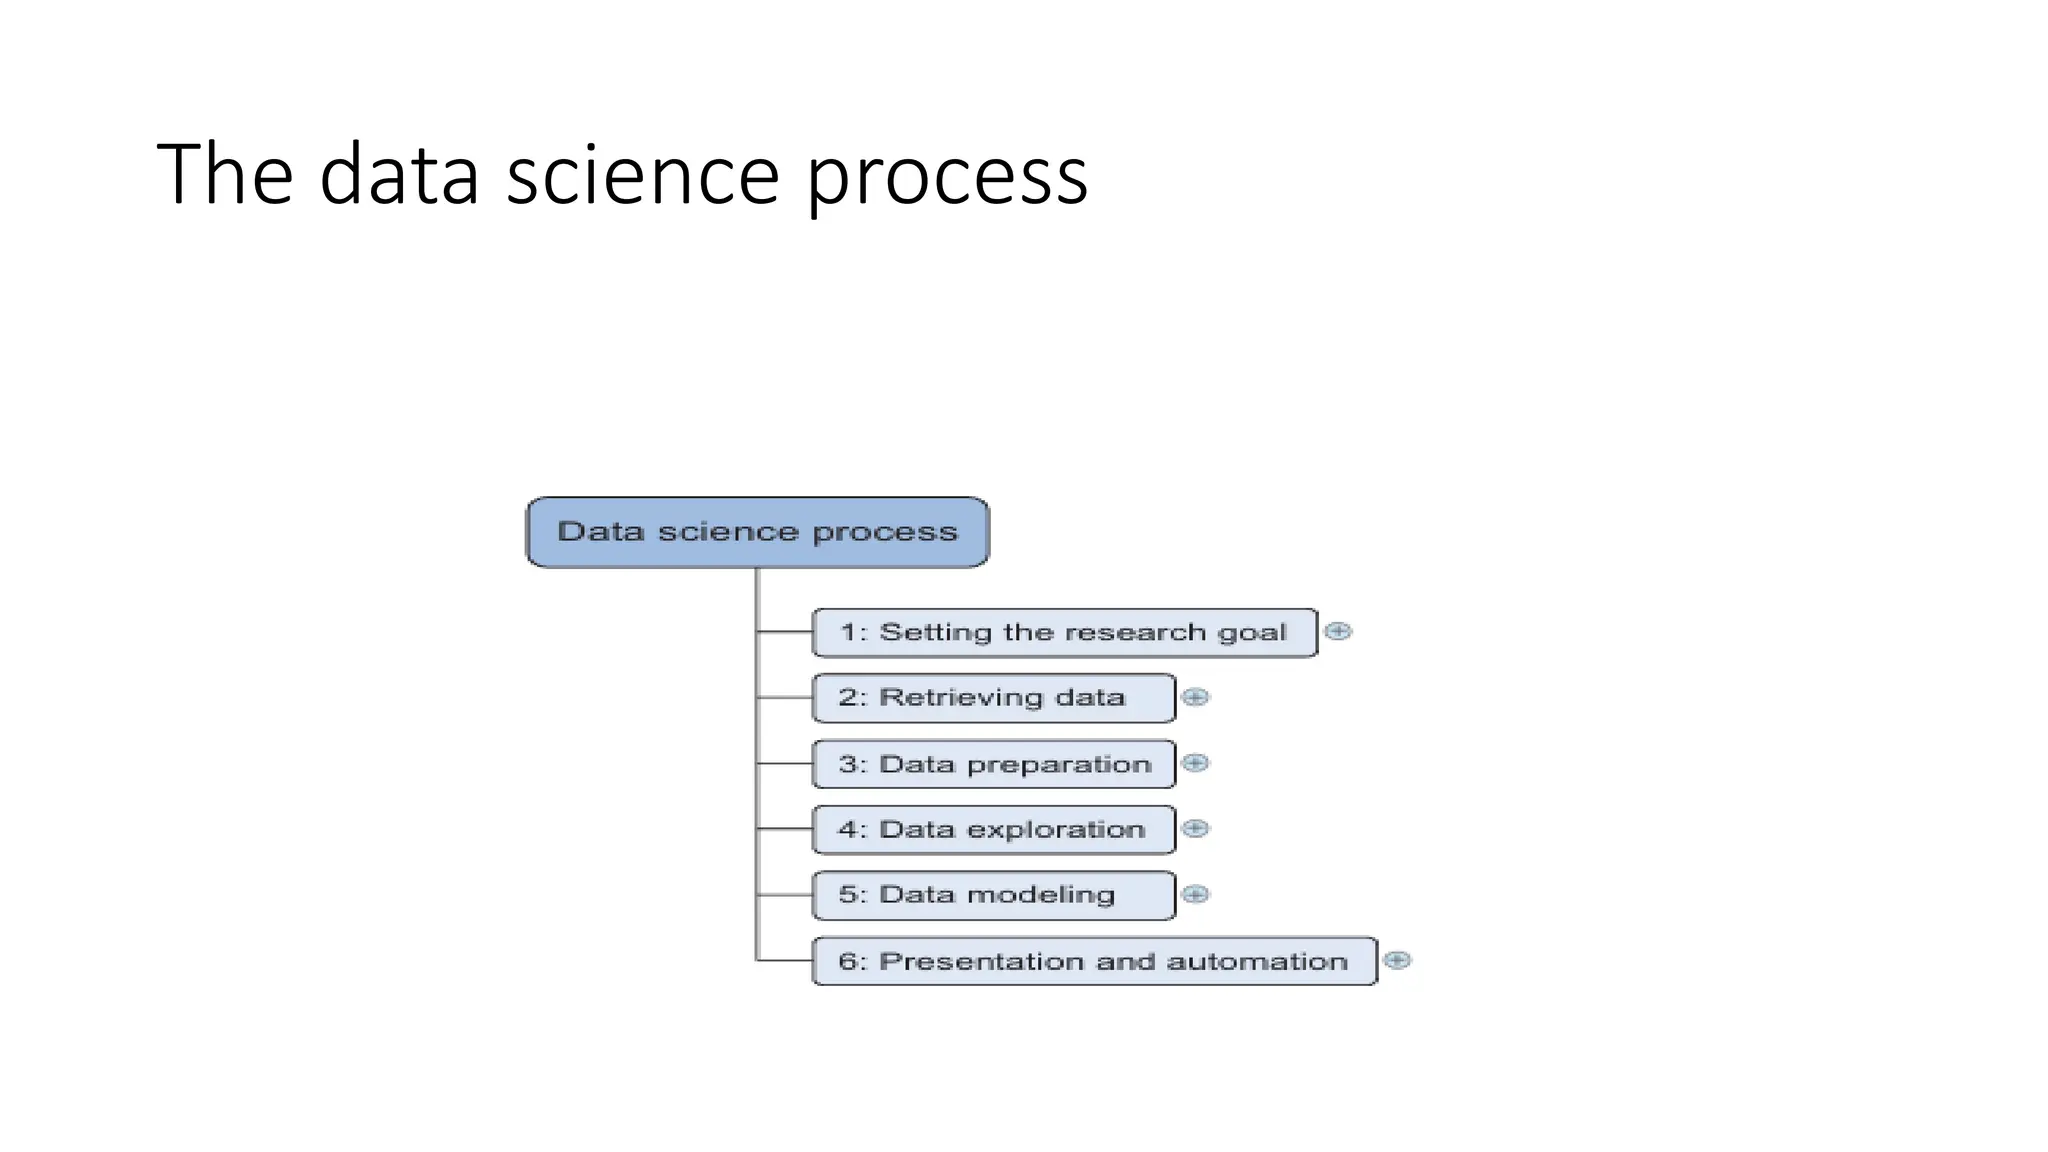
Step1 :Setting theresearch goal • Step 1: Defining research goals and creating a project charter understanding the what, the why, and the how of your project • What does the company expect you to do? • And why does management place such a value on your research? • Is it part of a bigger strategic picture or a “lone wolf” project originating from an opportunity someone detected? • information is then best placed in a project charter
13.
• Spend timeunderstanding the goals and context of your research • Create a project charter • A project charter requires teamwork, and your input covers at least the following: • A clear research goal • The project mission and context • How you’re going to perform your analysis • What resources you expect to use • Proof that it’s an achievable project, or proof of concepts • Deliverables and a measure of success • A timeline
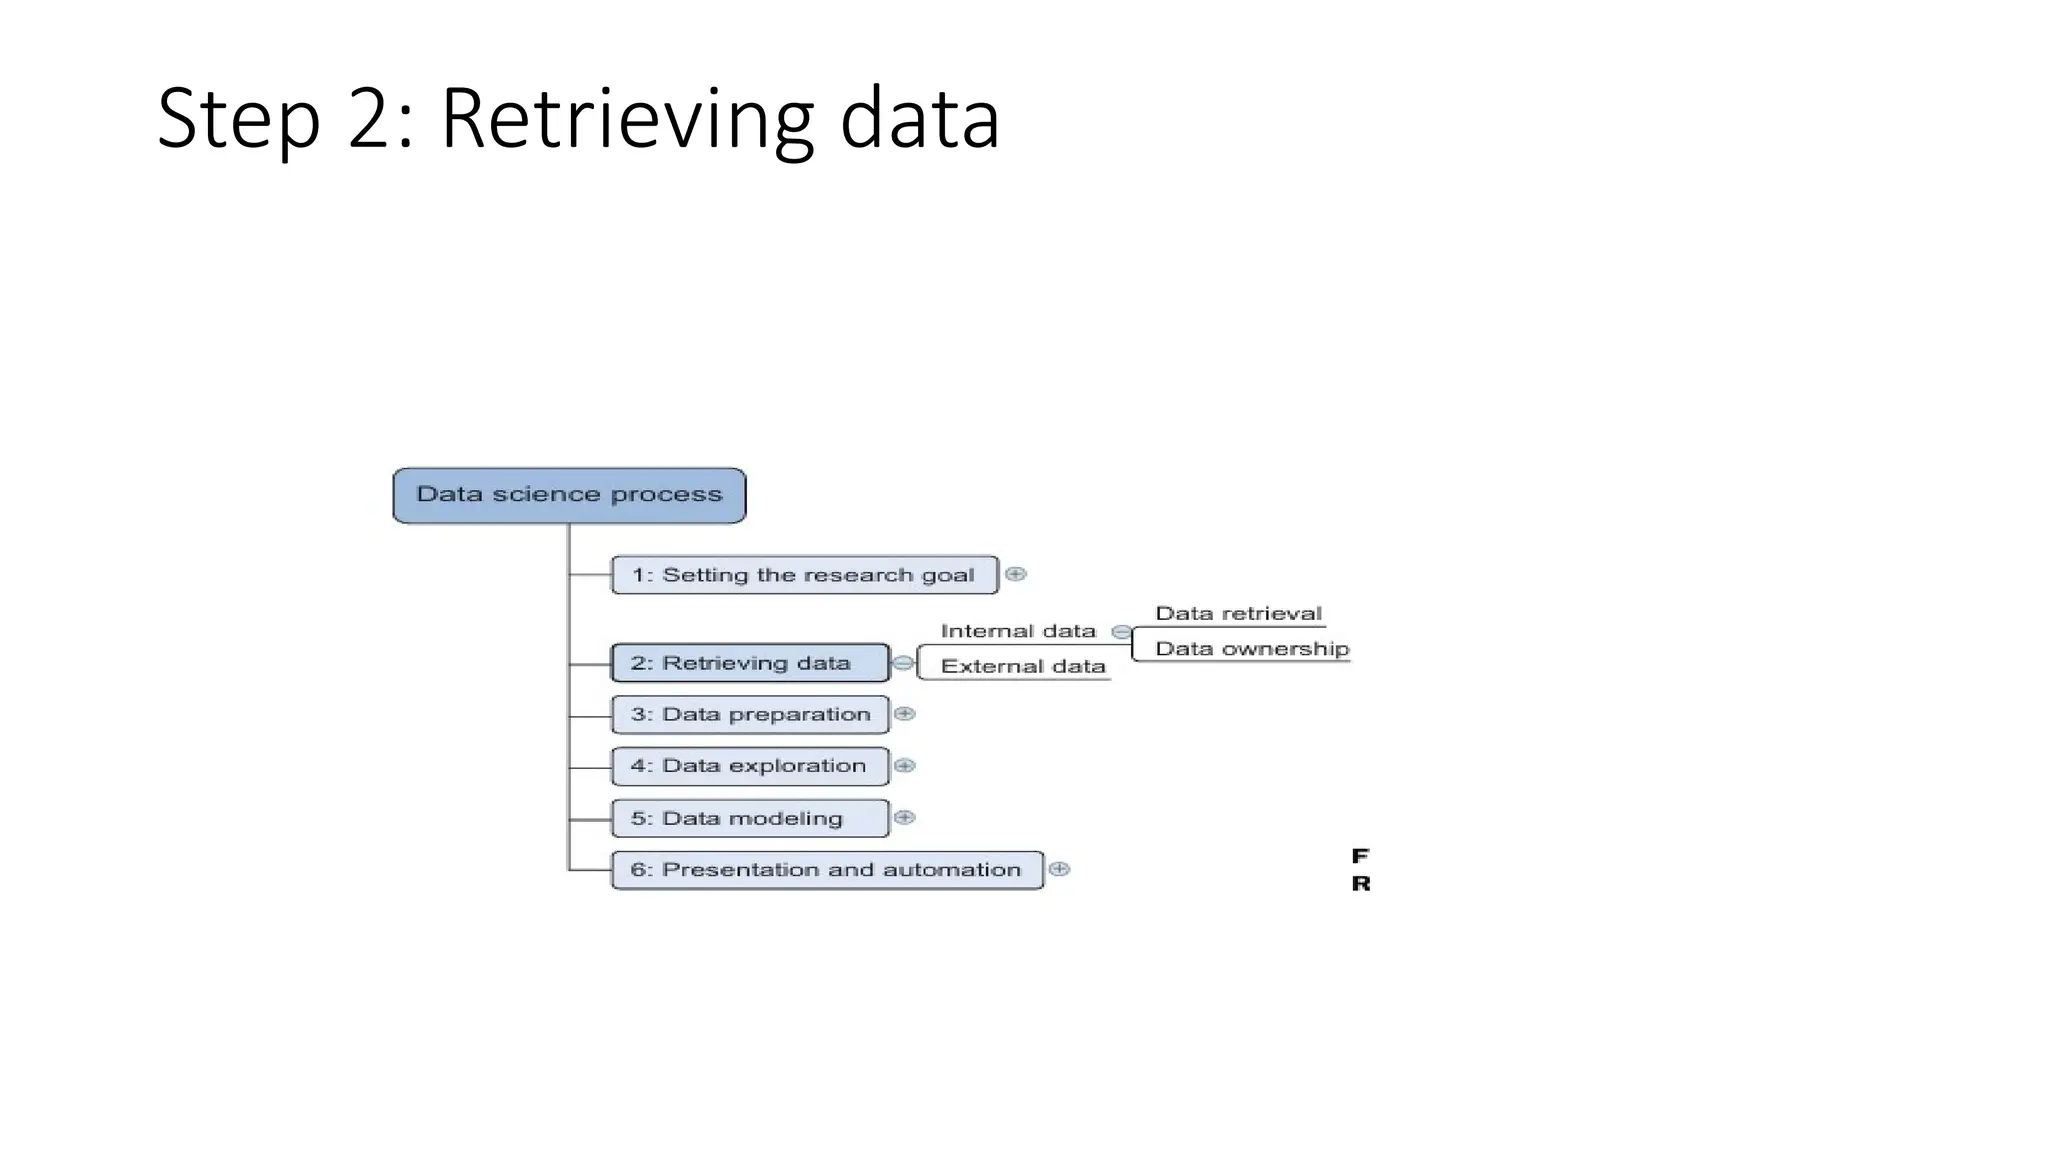
• Start withdata stored within the company • databases, data marts, data warehouses, and data lakes • primary goal • database is data storage • data warehouse -reading and analyzing that data. • A data mart - subset of the data warehouse and geared toward serving a specific business unit. • data warehouses and data marts are home to preprocessed data, data lakes contains data in its natural or raw format.
16.
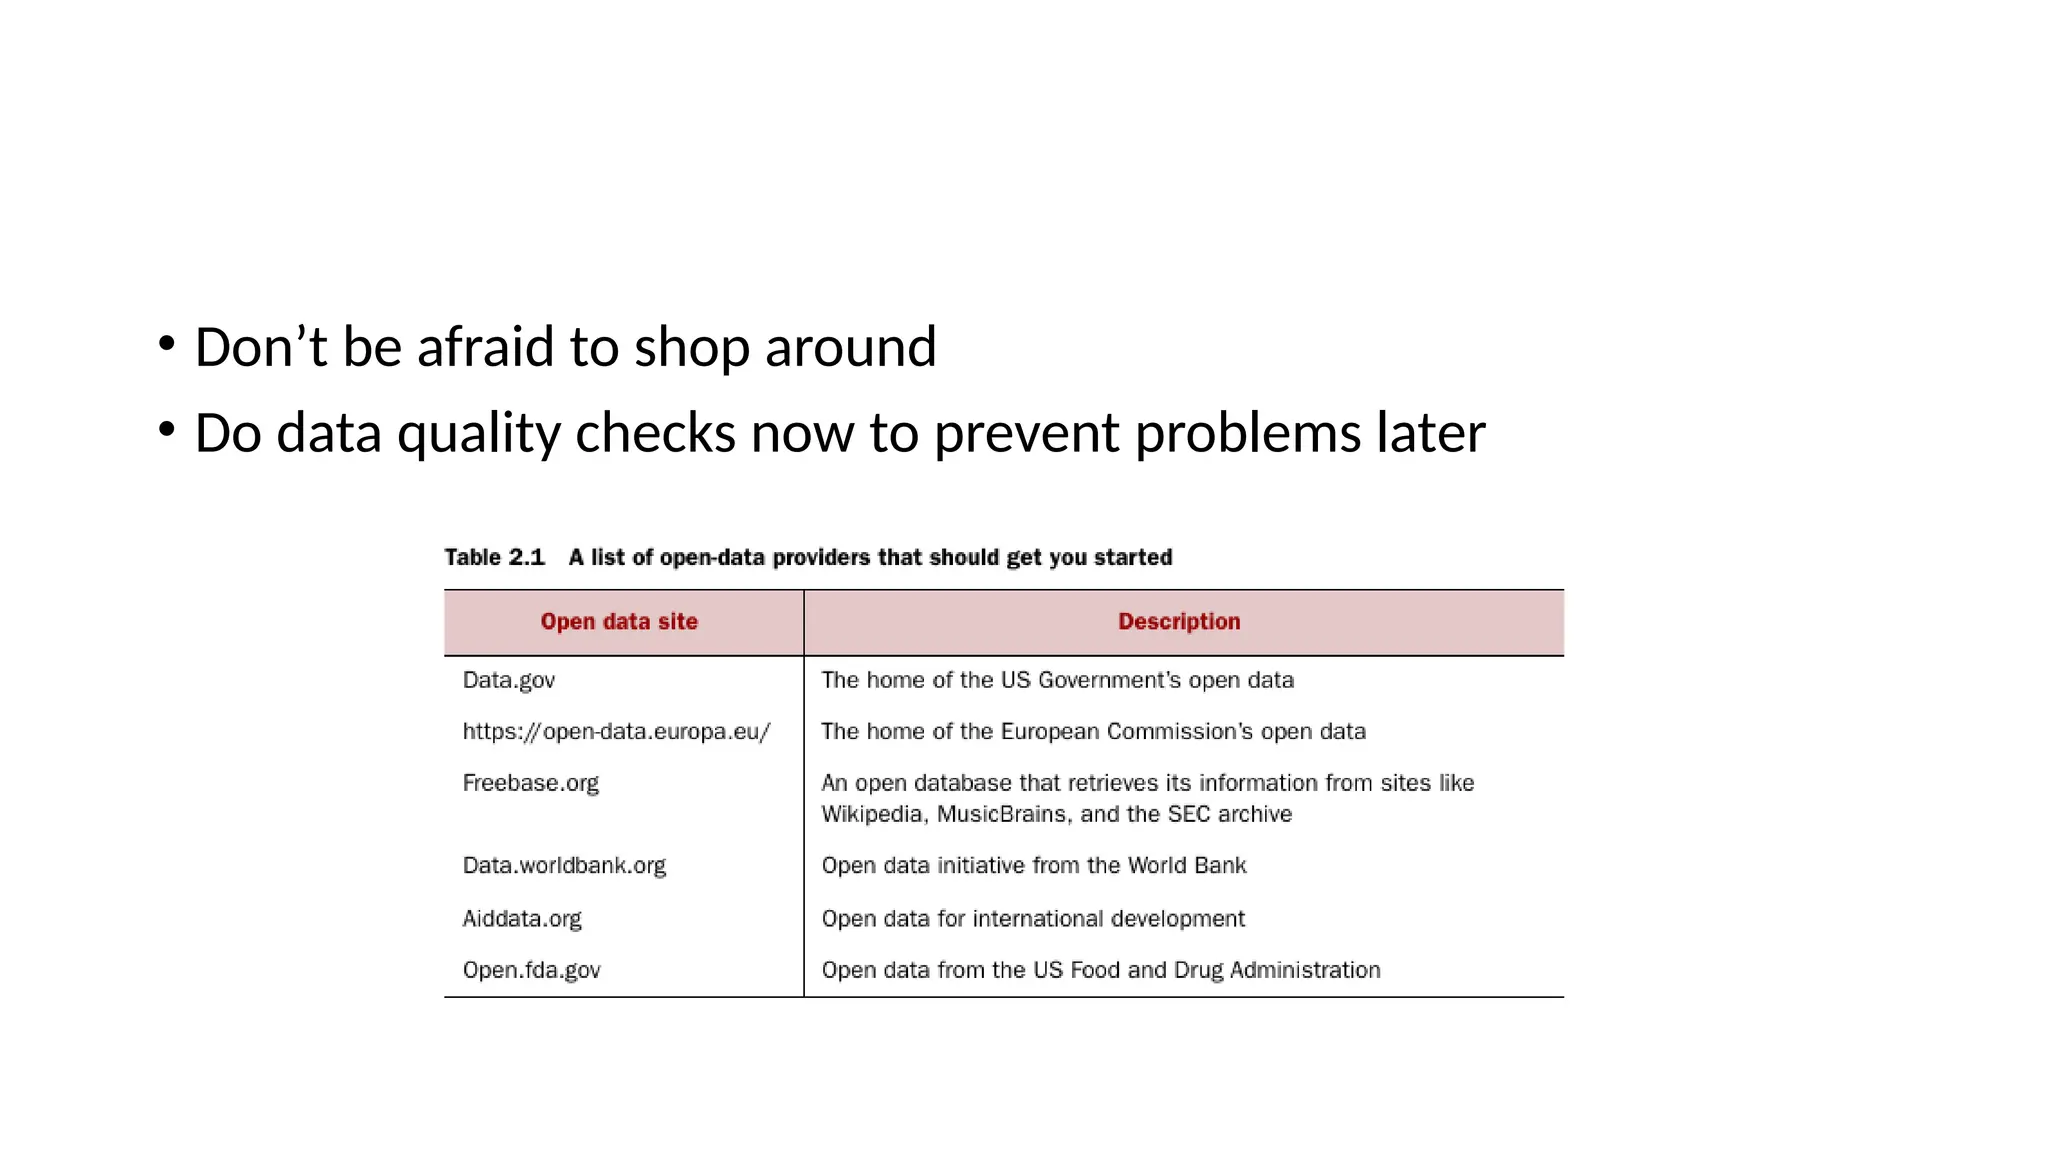
• Don’t beafraid to shop around • Do data quality checks now to prevent problems later
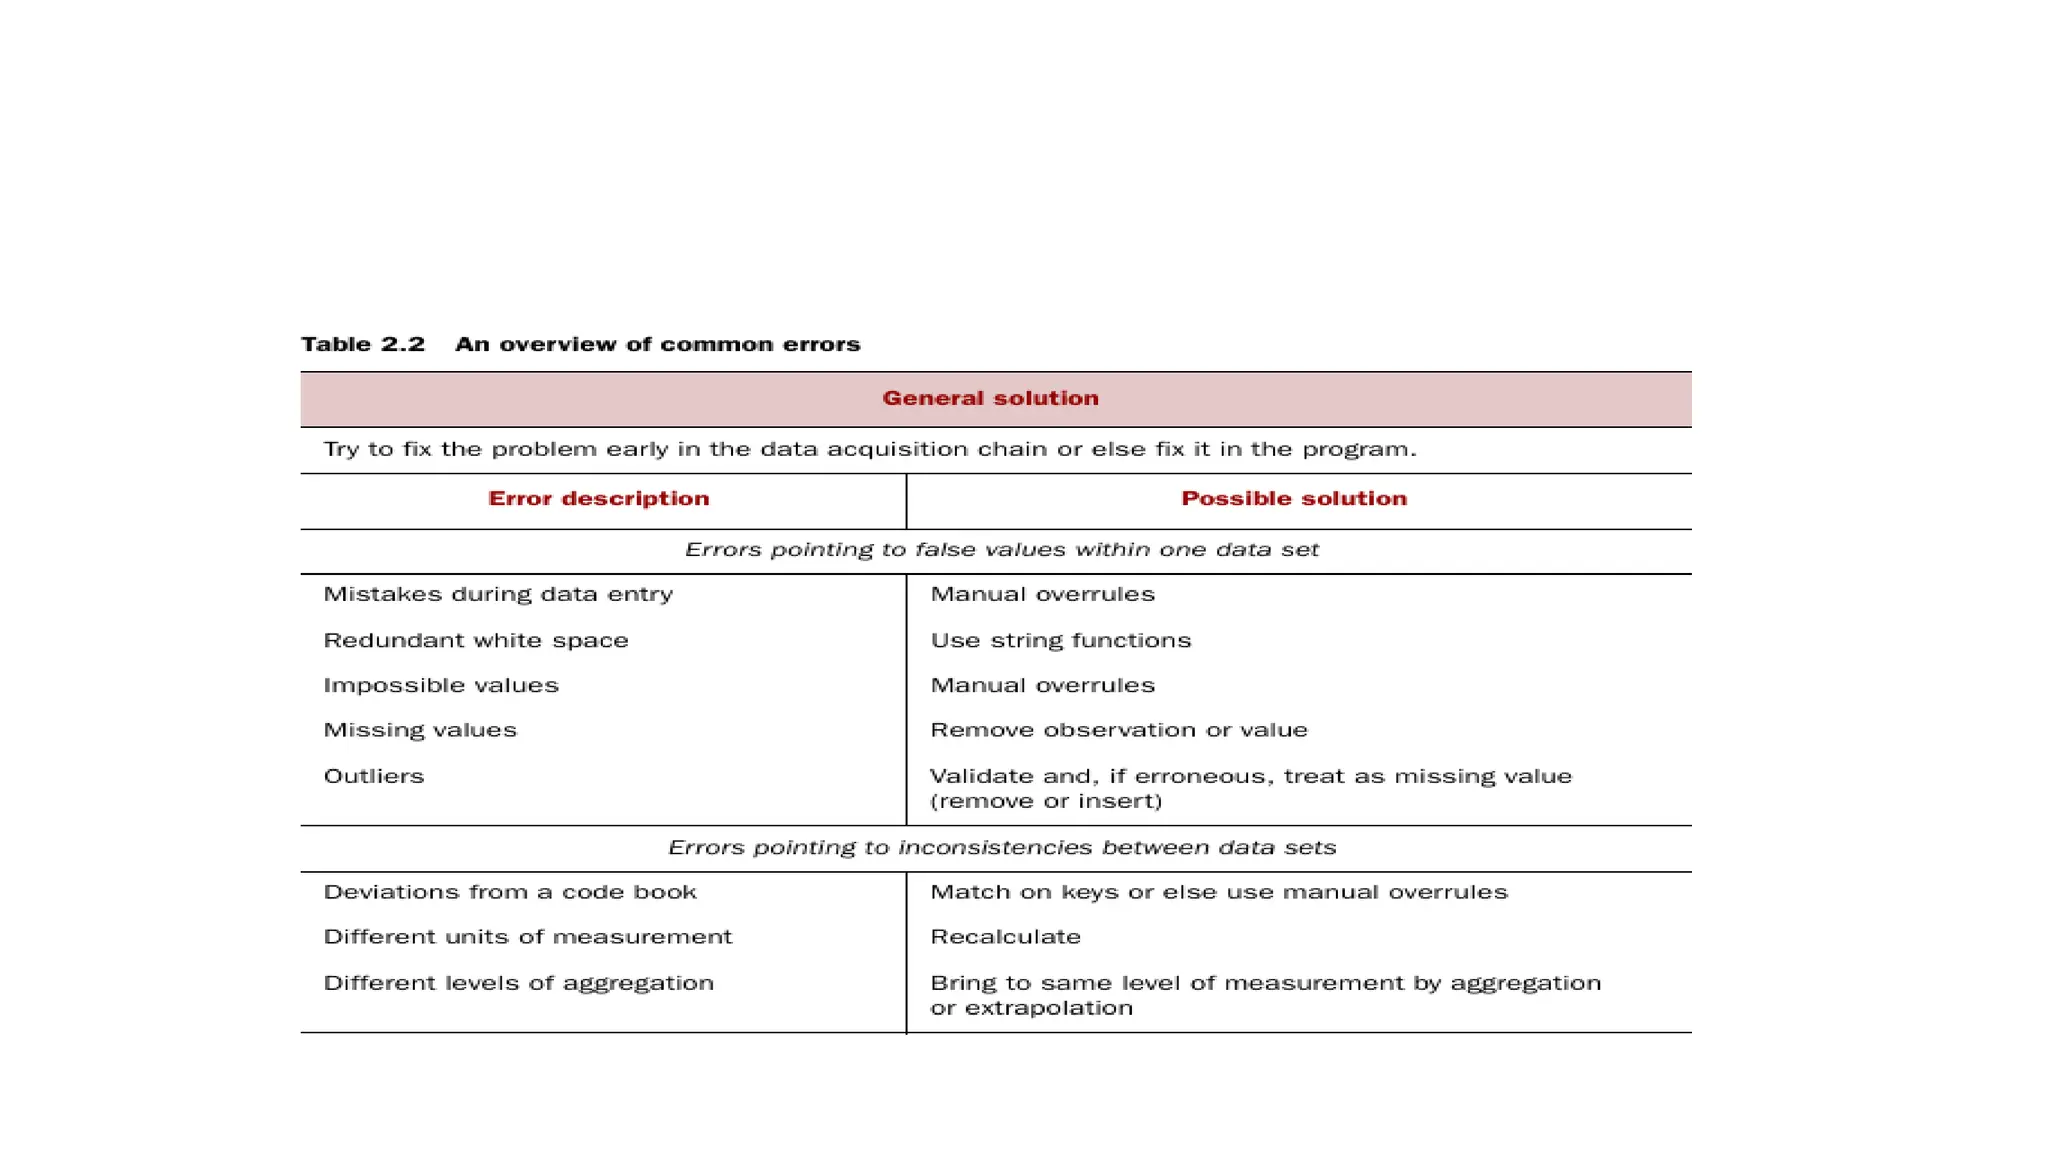
Cleansing data • subprocessof the data science process that focuses on removing errors in your data • data becomes a true and consistent representation of the process • two types of errors • interpretation error--person’s age is greater than 300 years. • Inconsistencies between data sources or against company’s standardized values.
20.
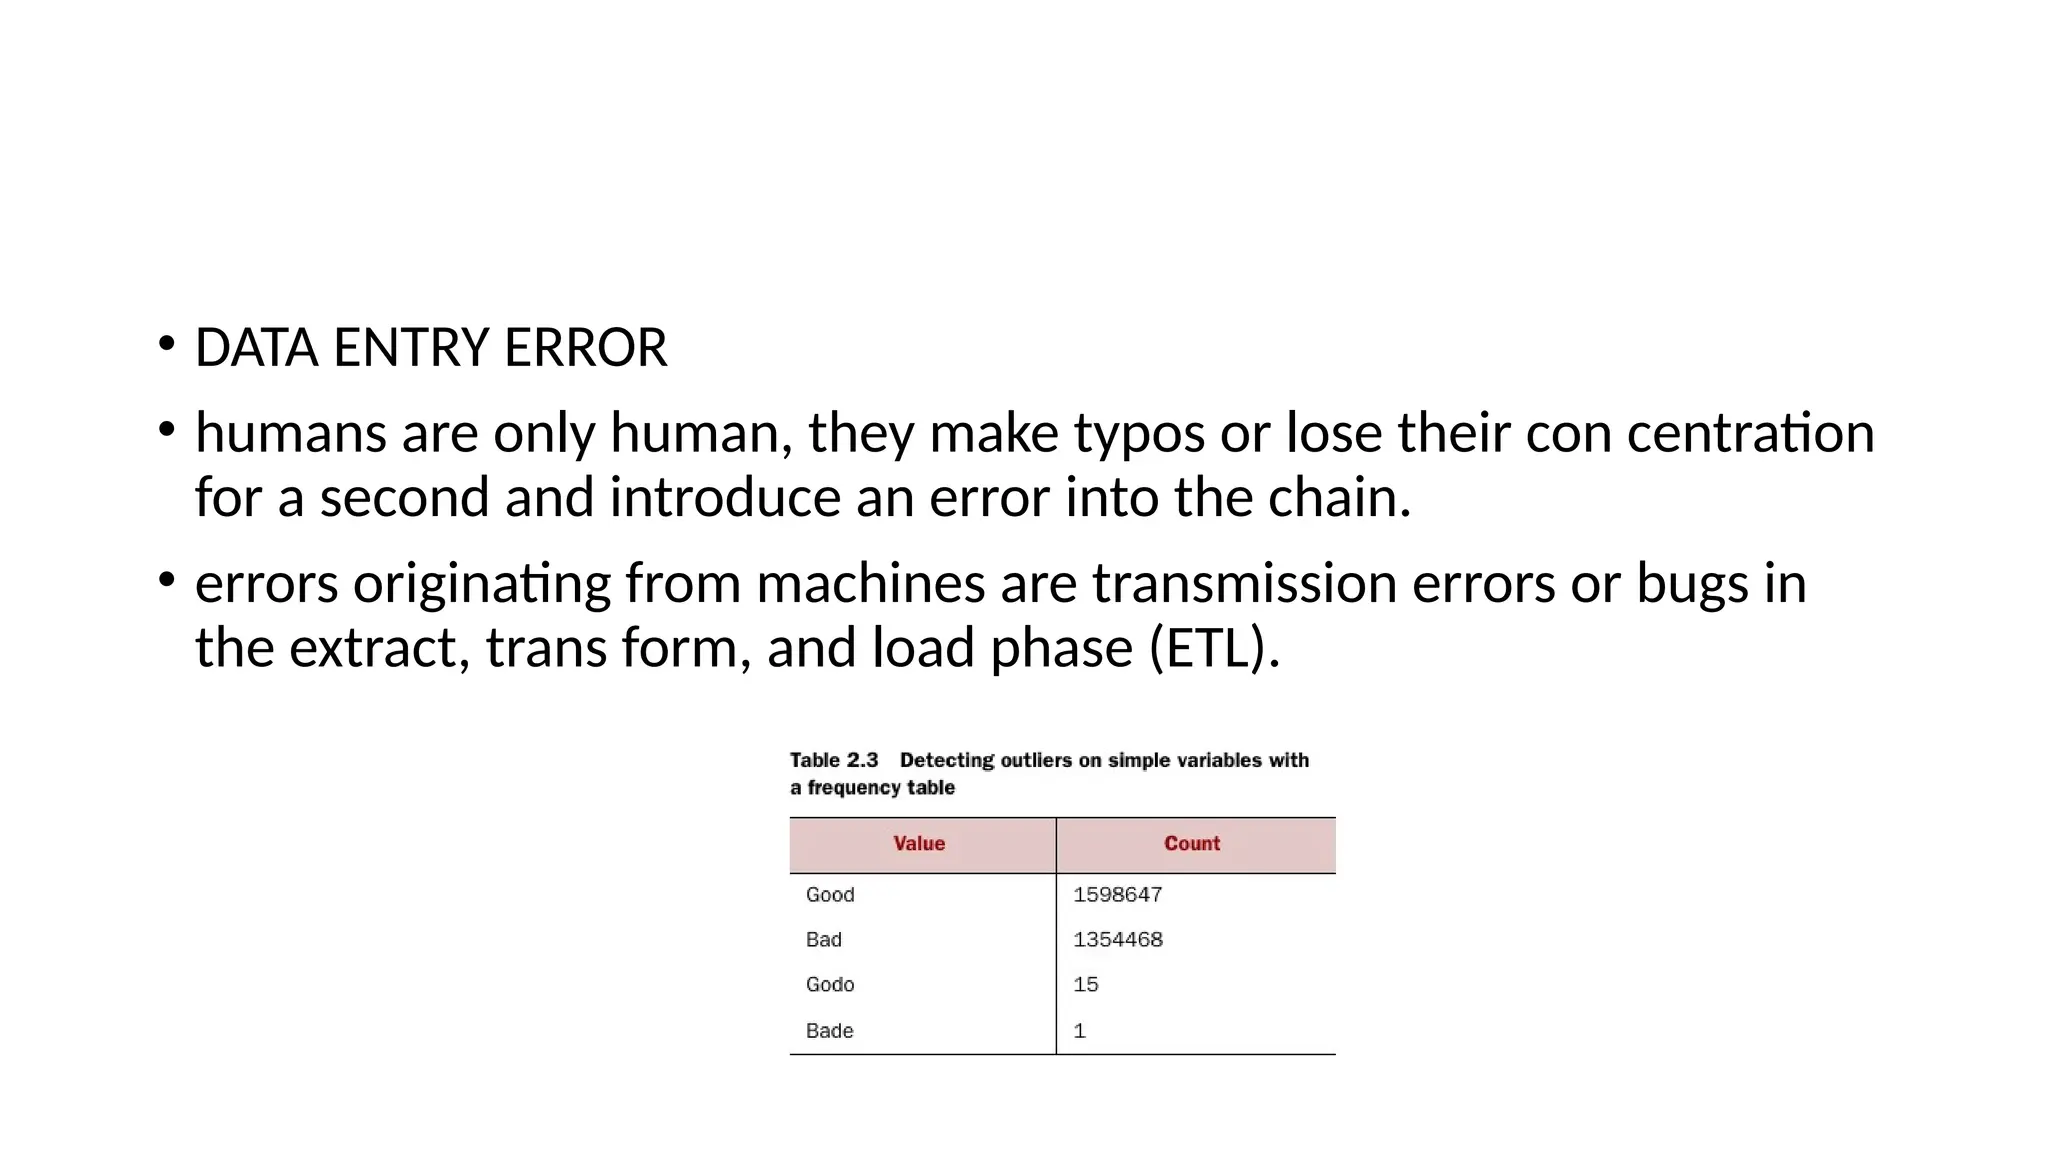
• DATA ENTRYERROR • humans are only human, they make typos or lose their con centration for a second and introduce an error into the chain. • errors originating from machines are transmission errors or bugs in the extract, trans form, and load phase (ETL).
21.
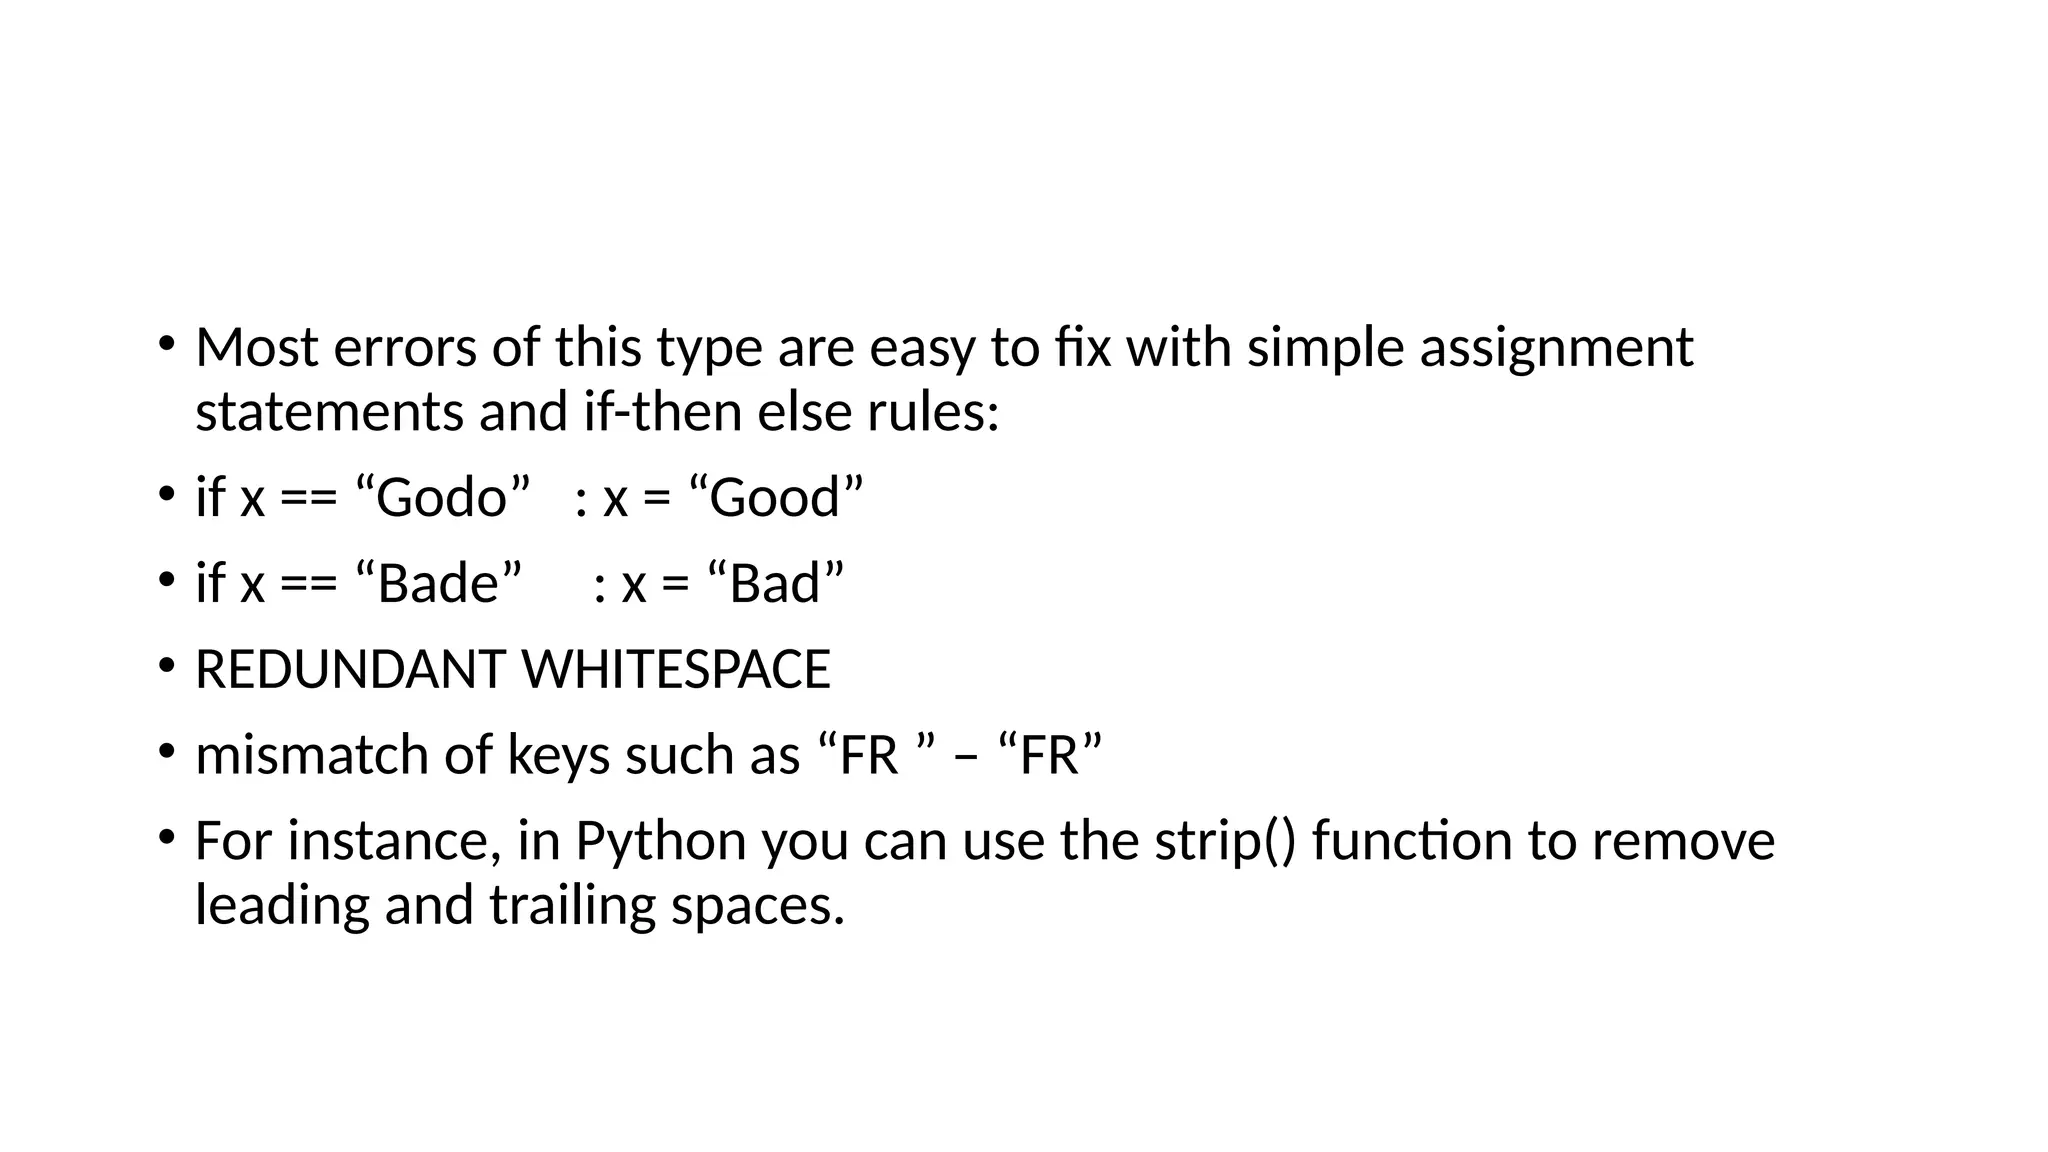
• Most errorsof this type are easy to fix with simple assignment statements and if-then else rules: • if x == “Godo” : x = “Good” • if x == “Bade” : x = “Bad” • REDUNDANT WHITESPACE • mismatch of keys such as “FR ” – “FR” • For instance, in Python you can use the strip() function to remove leading and trailing spaces.
22.
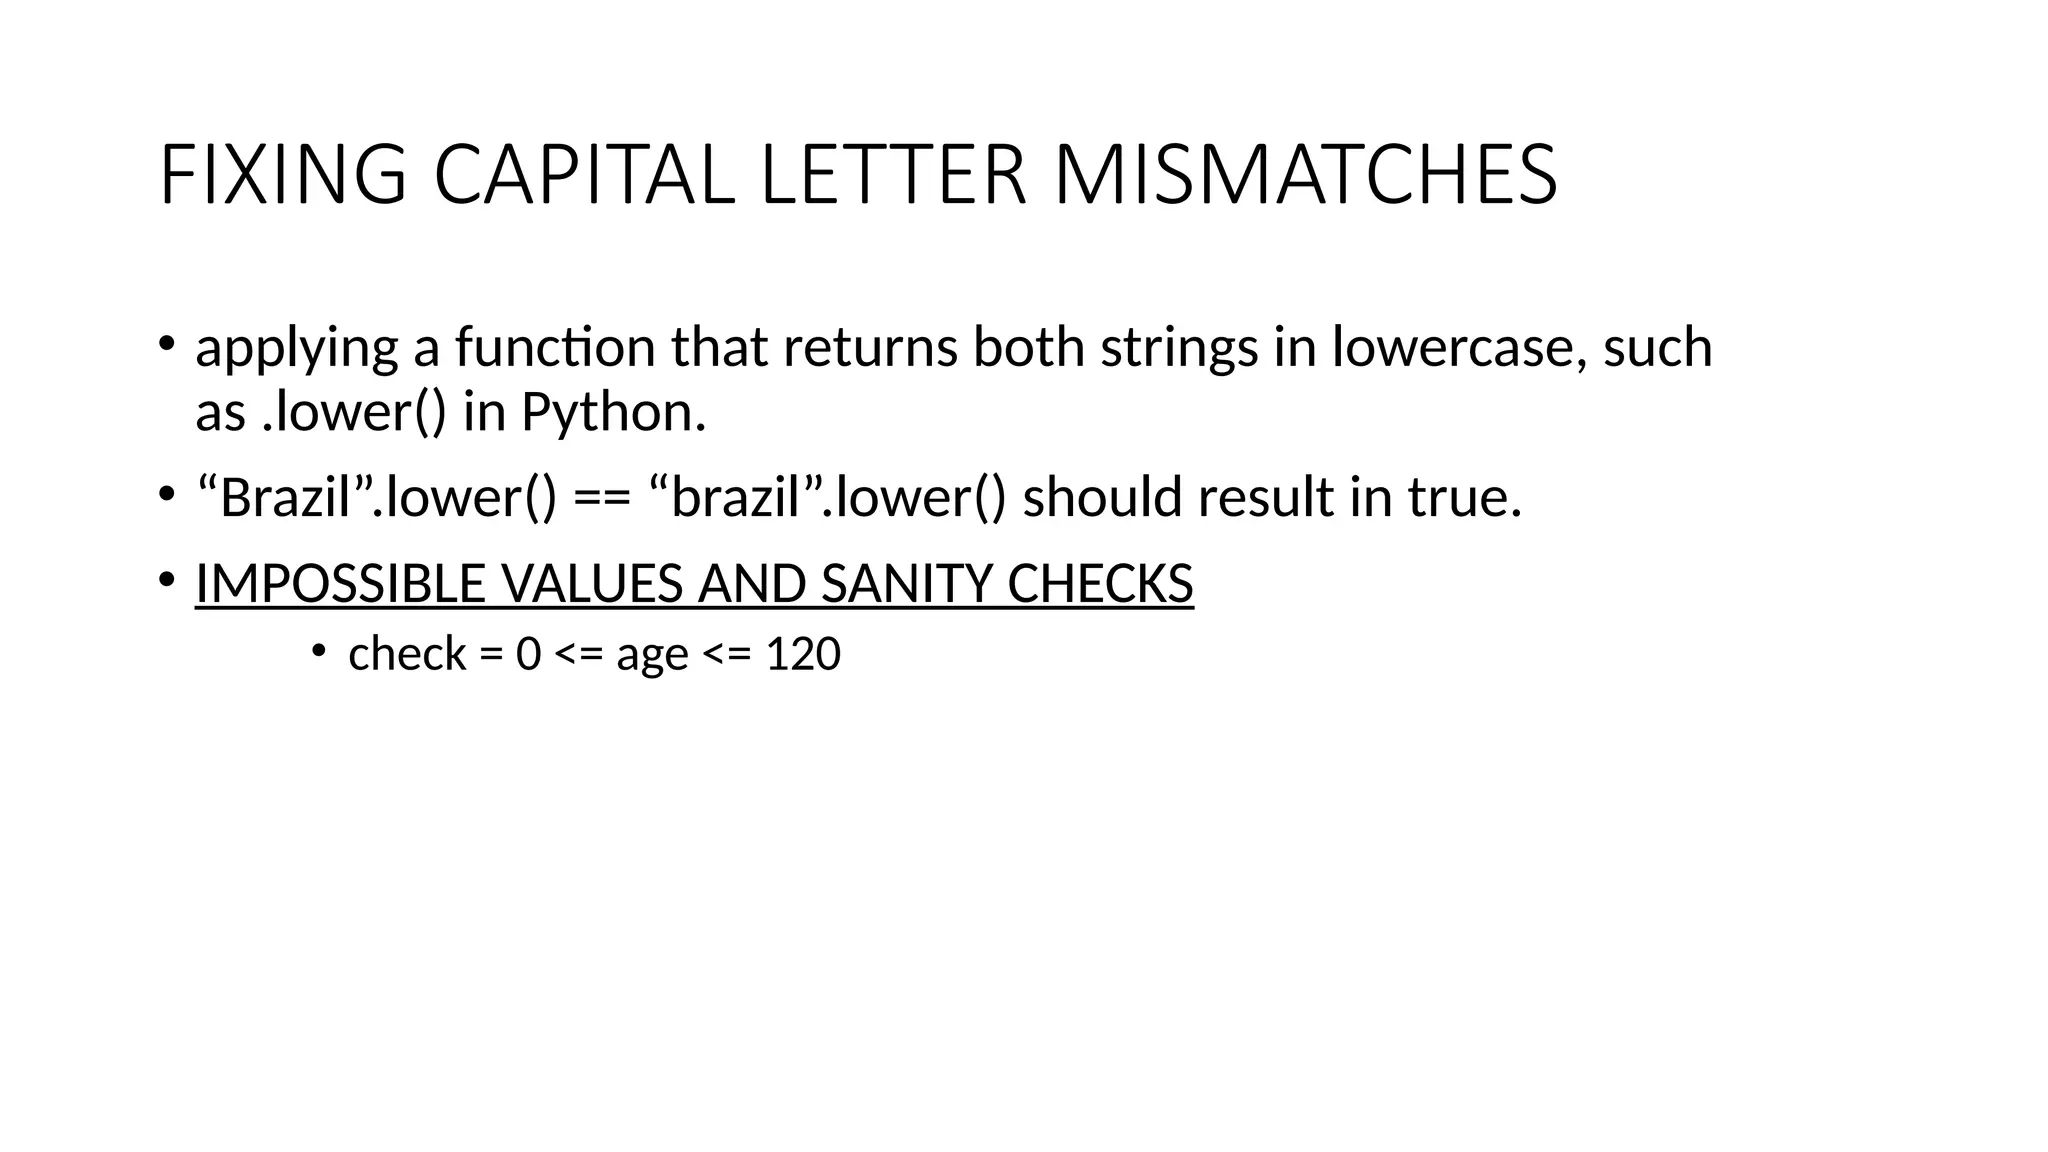
FIXING CAPITAL LETTERMISMATCHES • applying a function that returns both strings in lowercase, such as .lower() in Python. • “Brazil”.lower() == “brazil”.lower() should result in true. • IMPOSSIBLE VALUES AND SANITY CHECKS • check = 0 <= age <= 120
23.
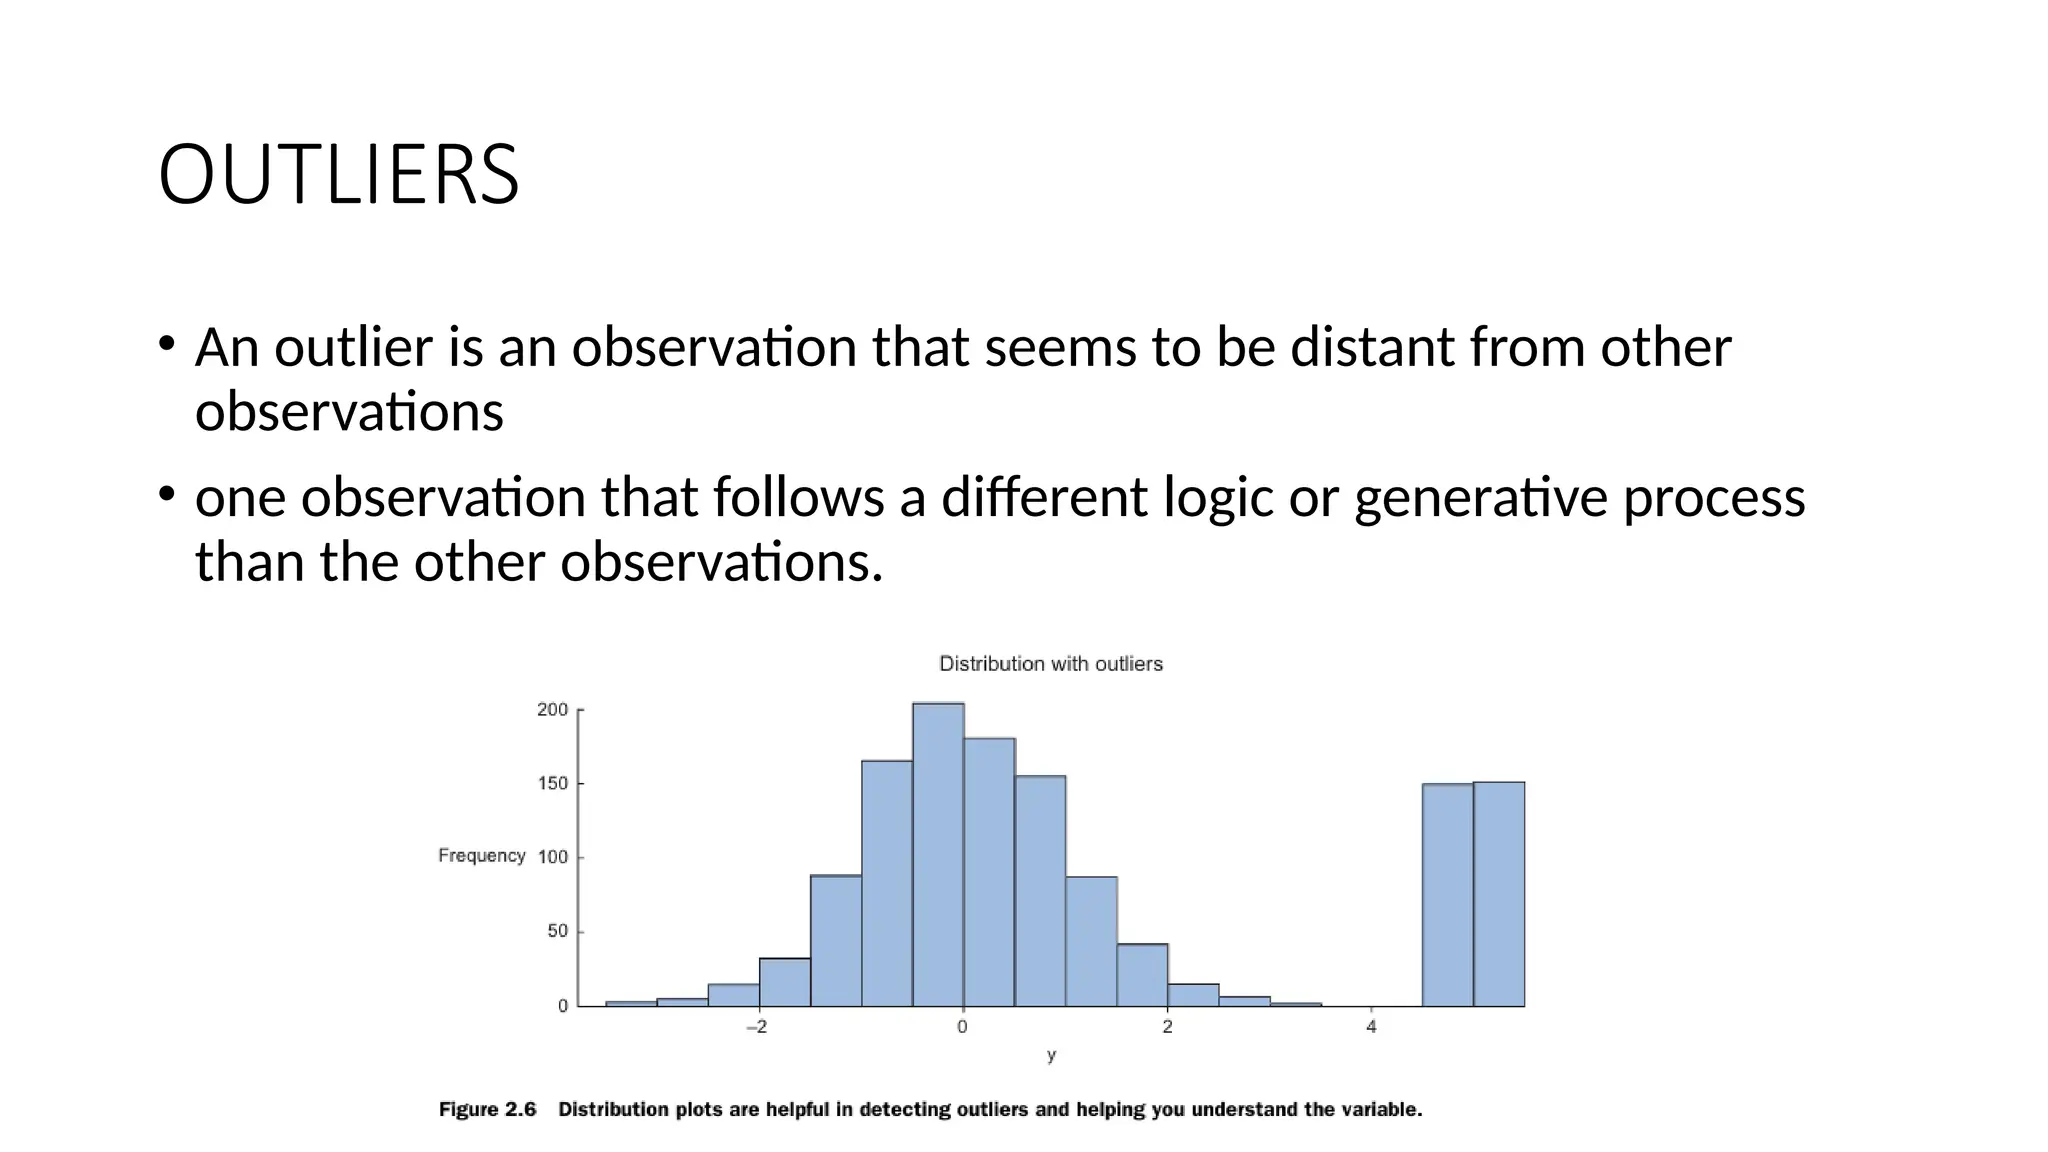
OUTLIERS • An outlieris an observation that seems to be distant from other observations • one observation that follows a different logic or generative process than the other observations.
• DEVIATIONS FROMA CODE BOOK • A code book is a description of your data, a form of metadata. • It contains things such as the number of variables per observation, the number of observations, and what each encoding within a variable means. • (For instance “0” equals “negative”, “5” stands for “very positive”.) • DIFFERENT UNITS OF MEASUREMENT • DIFFERENT LEVELS OF AGGREGATION • Correct errors as early as possible
26.
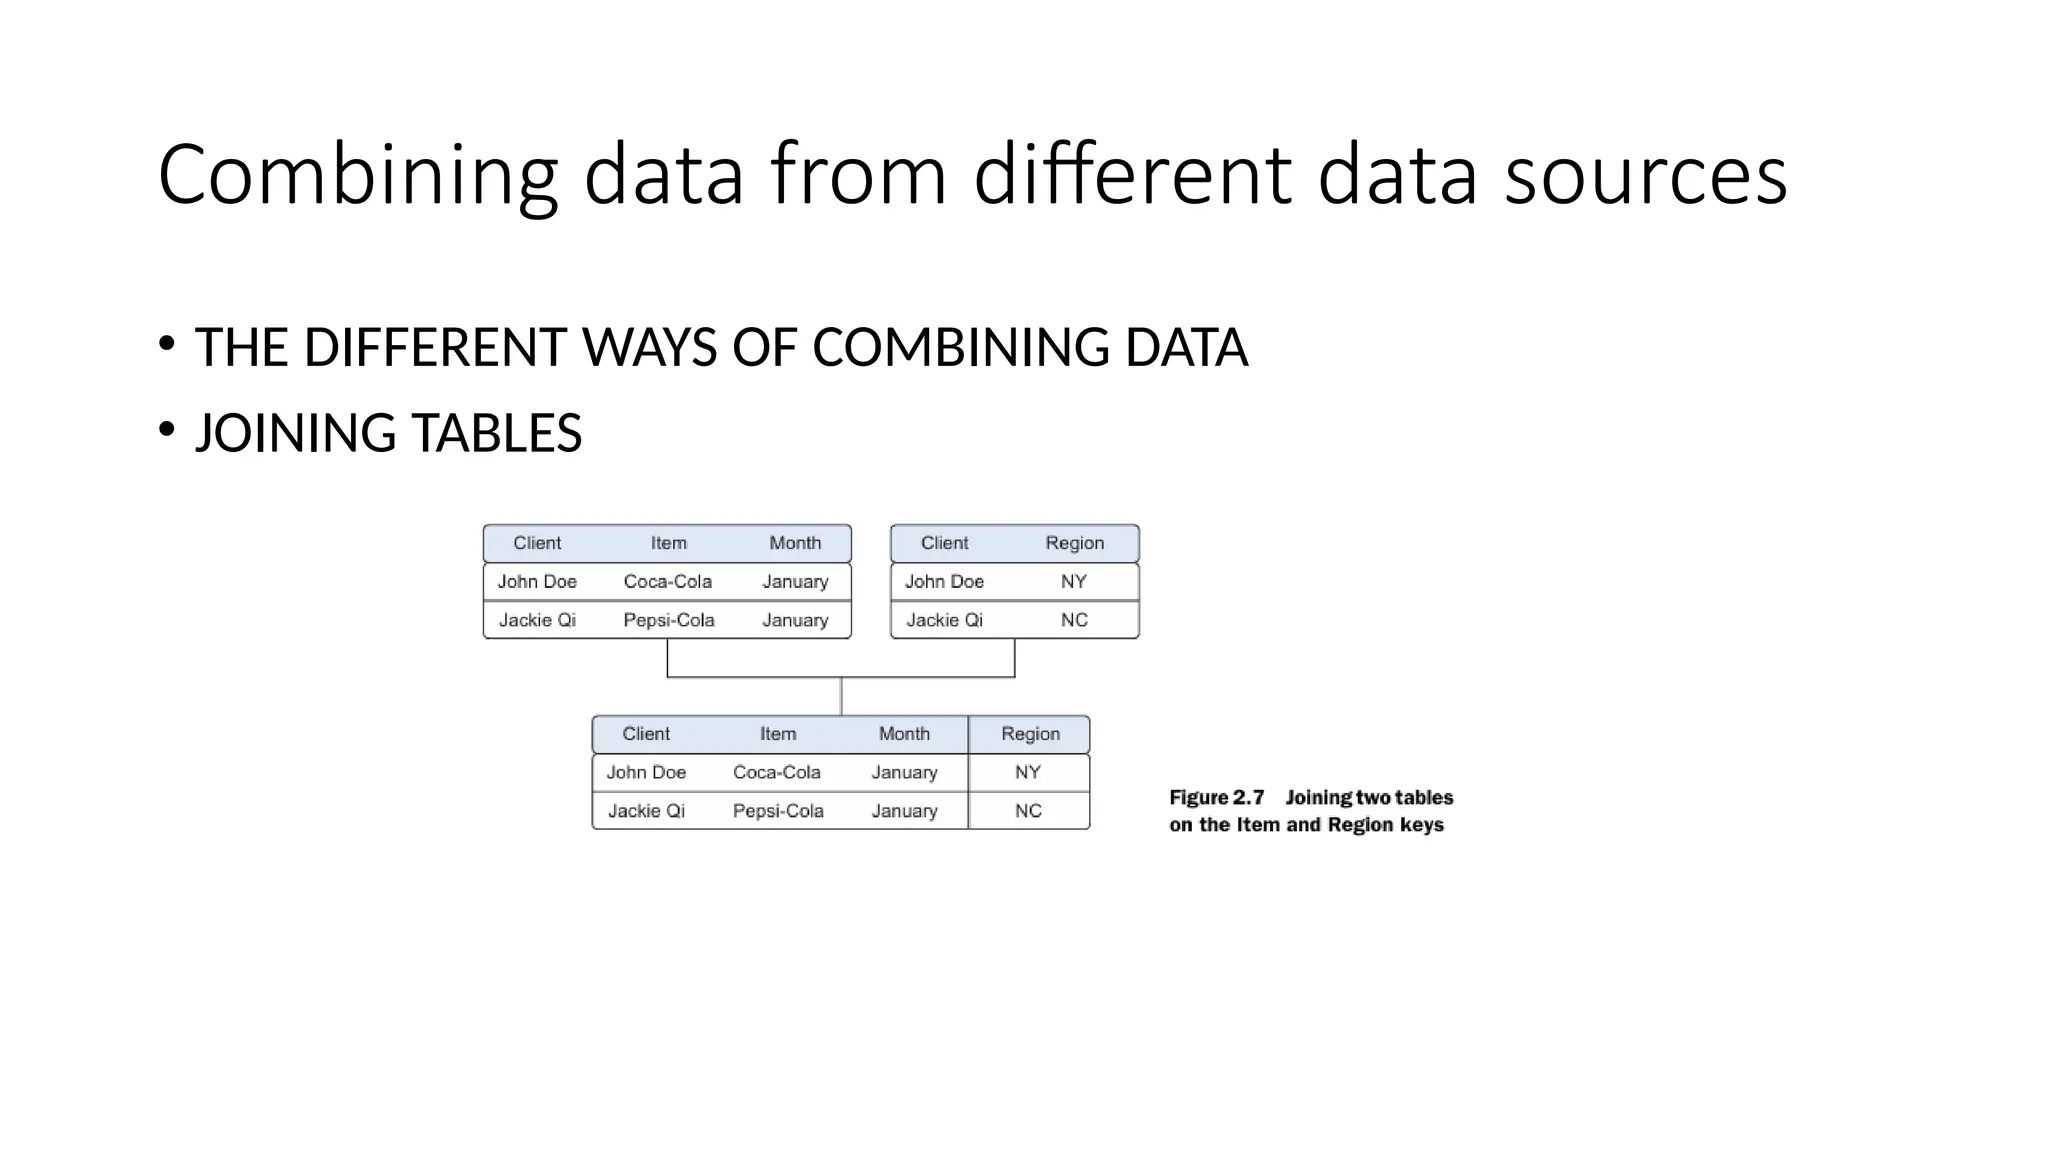
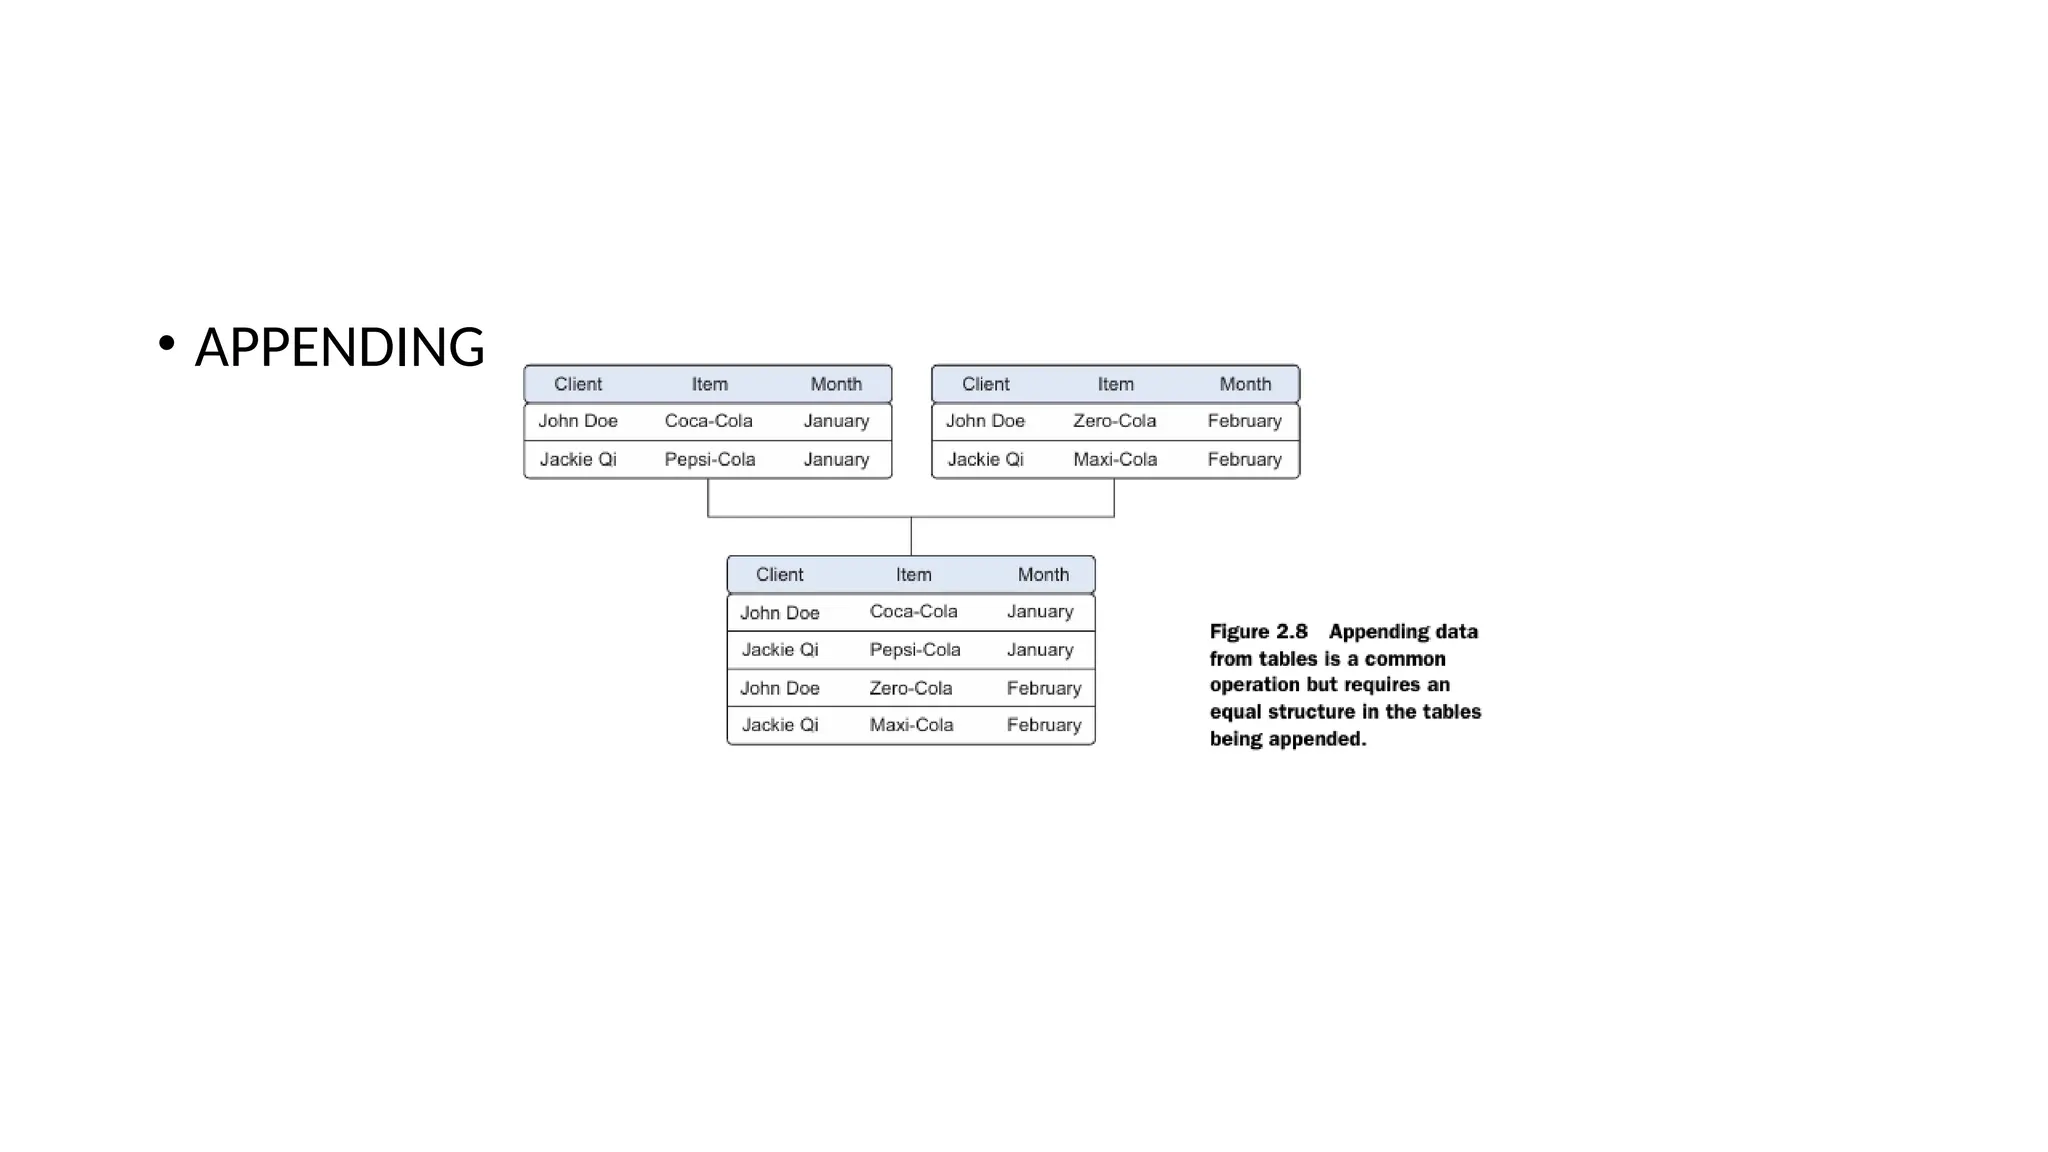
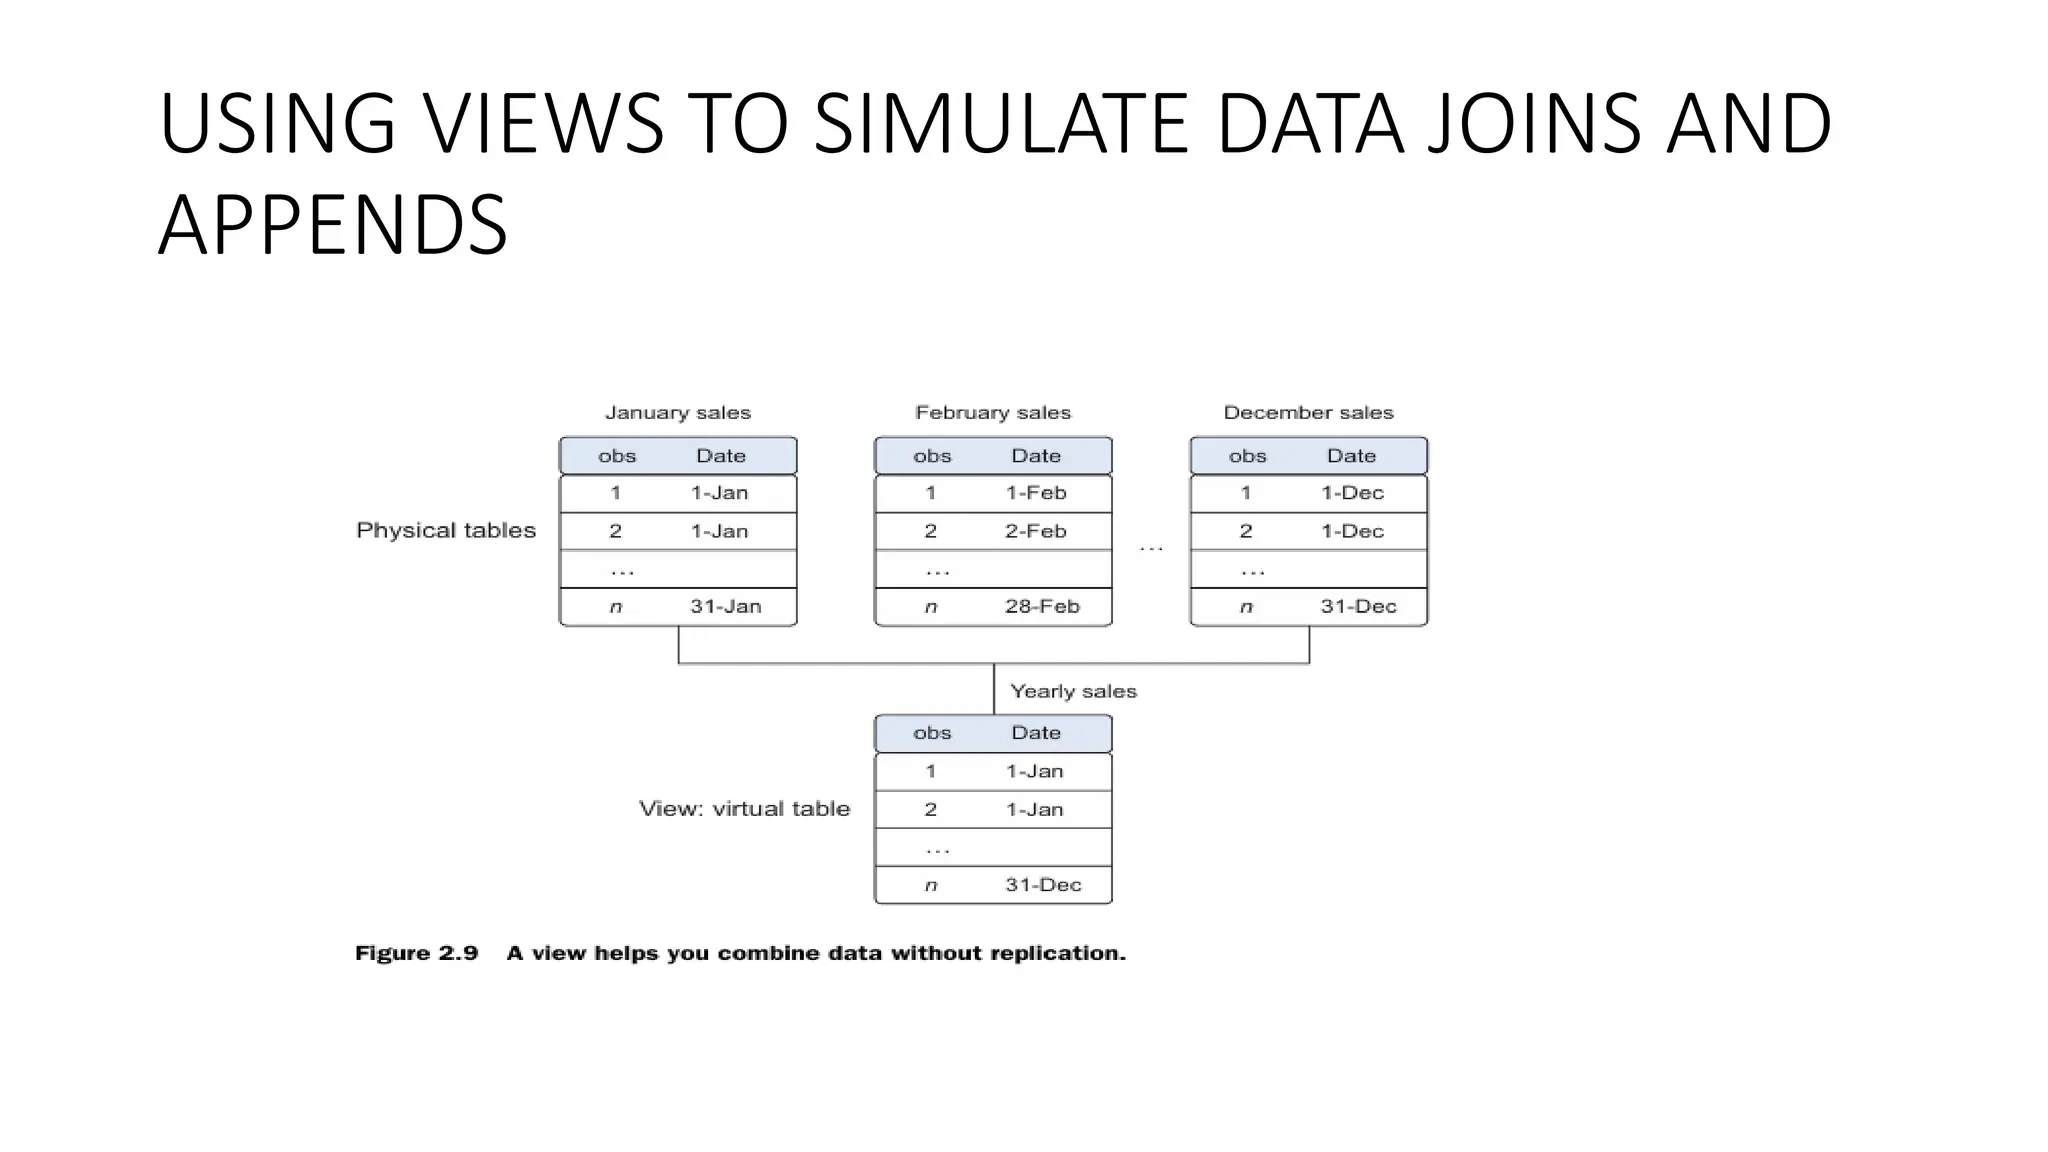
Combining data fromdifferent data sources • THE DIFFERENT WAYS OF COMBINING DATA • JOINING TABLES
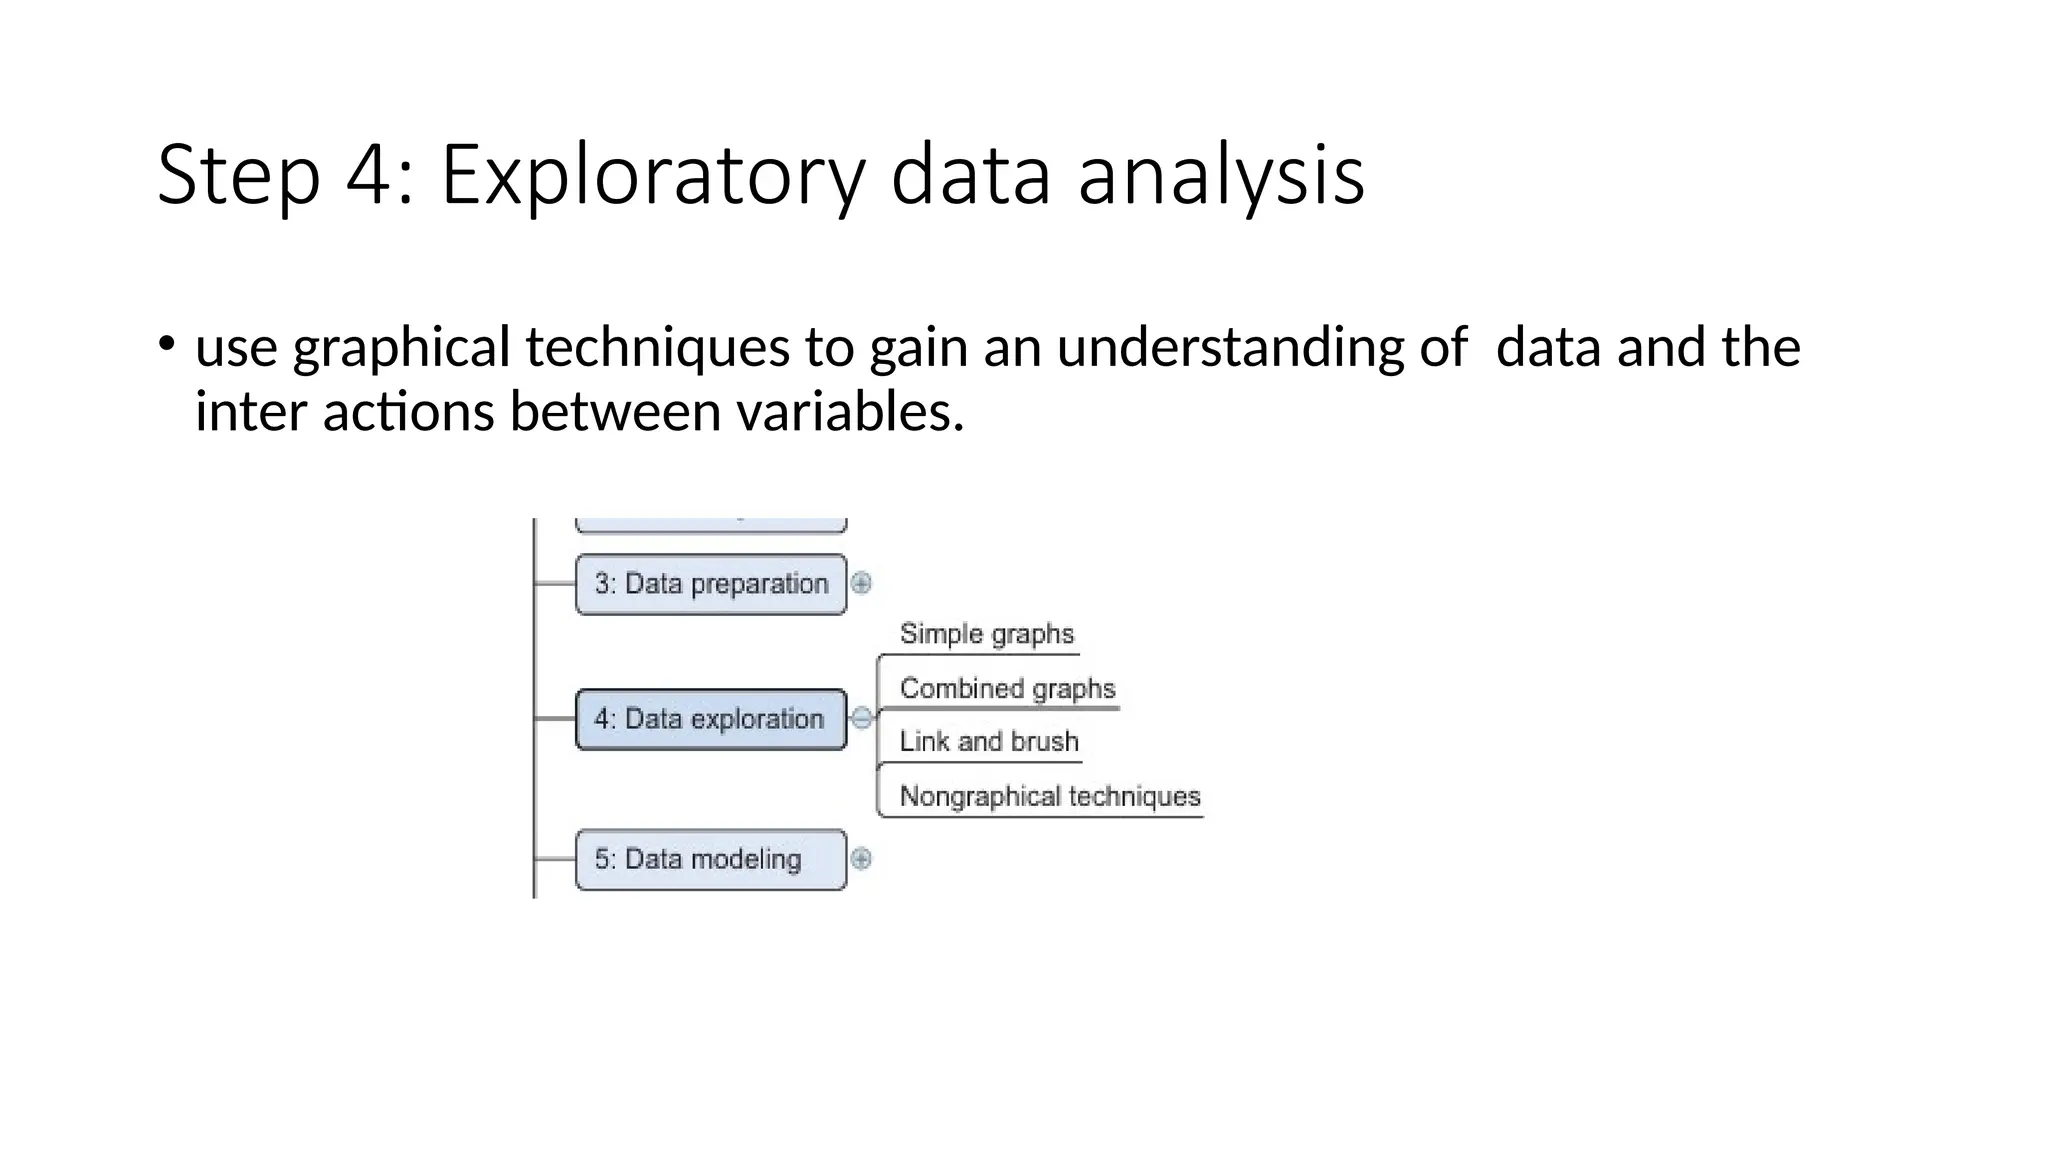
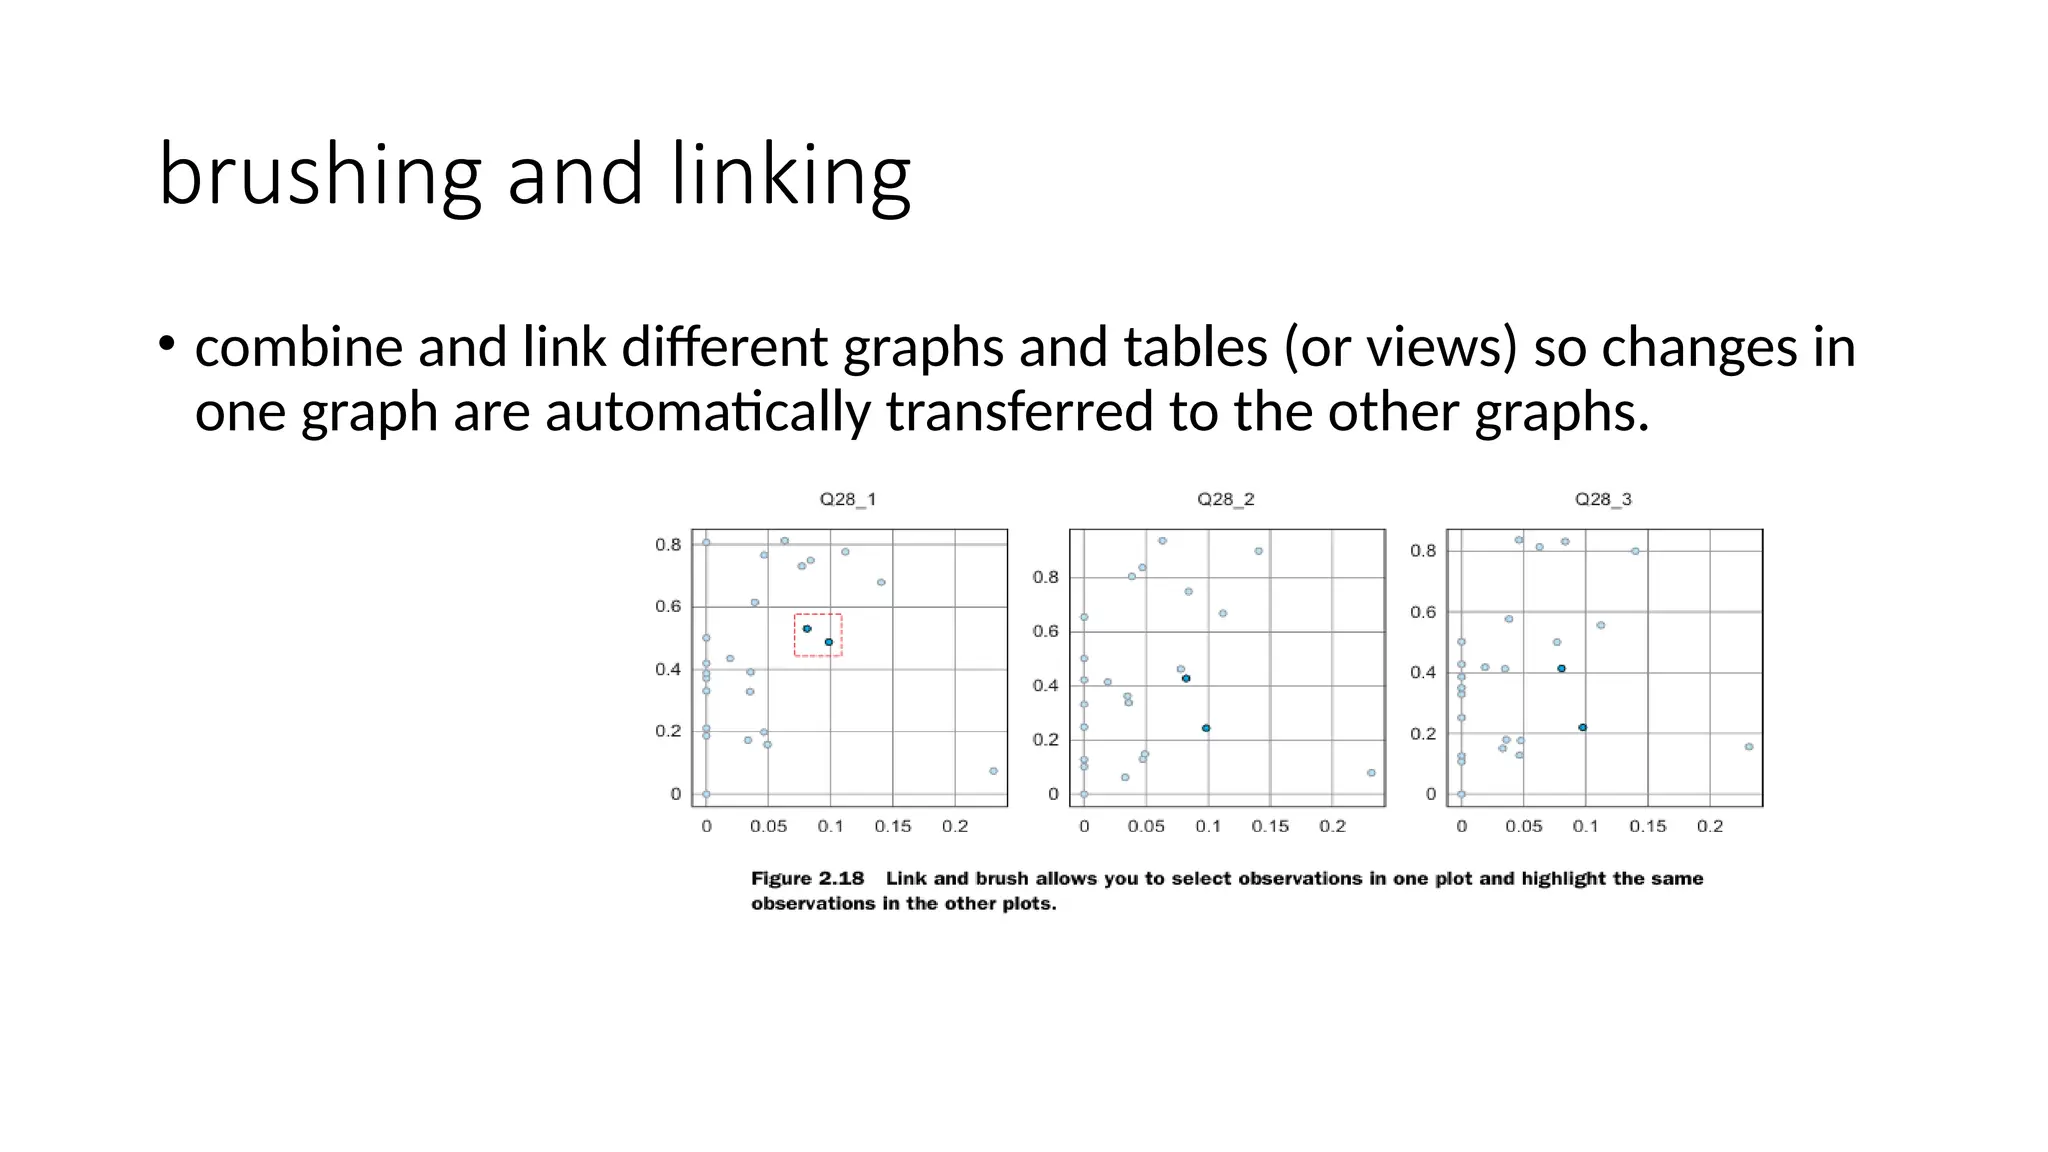
brushing and linking •combine and link different graphs and tables (or views) so changes in one graph are automatically transferred to the other graphs.
37.
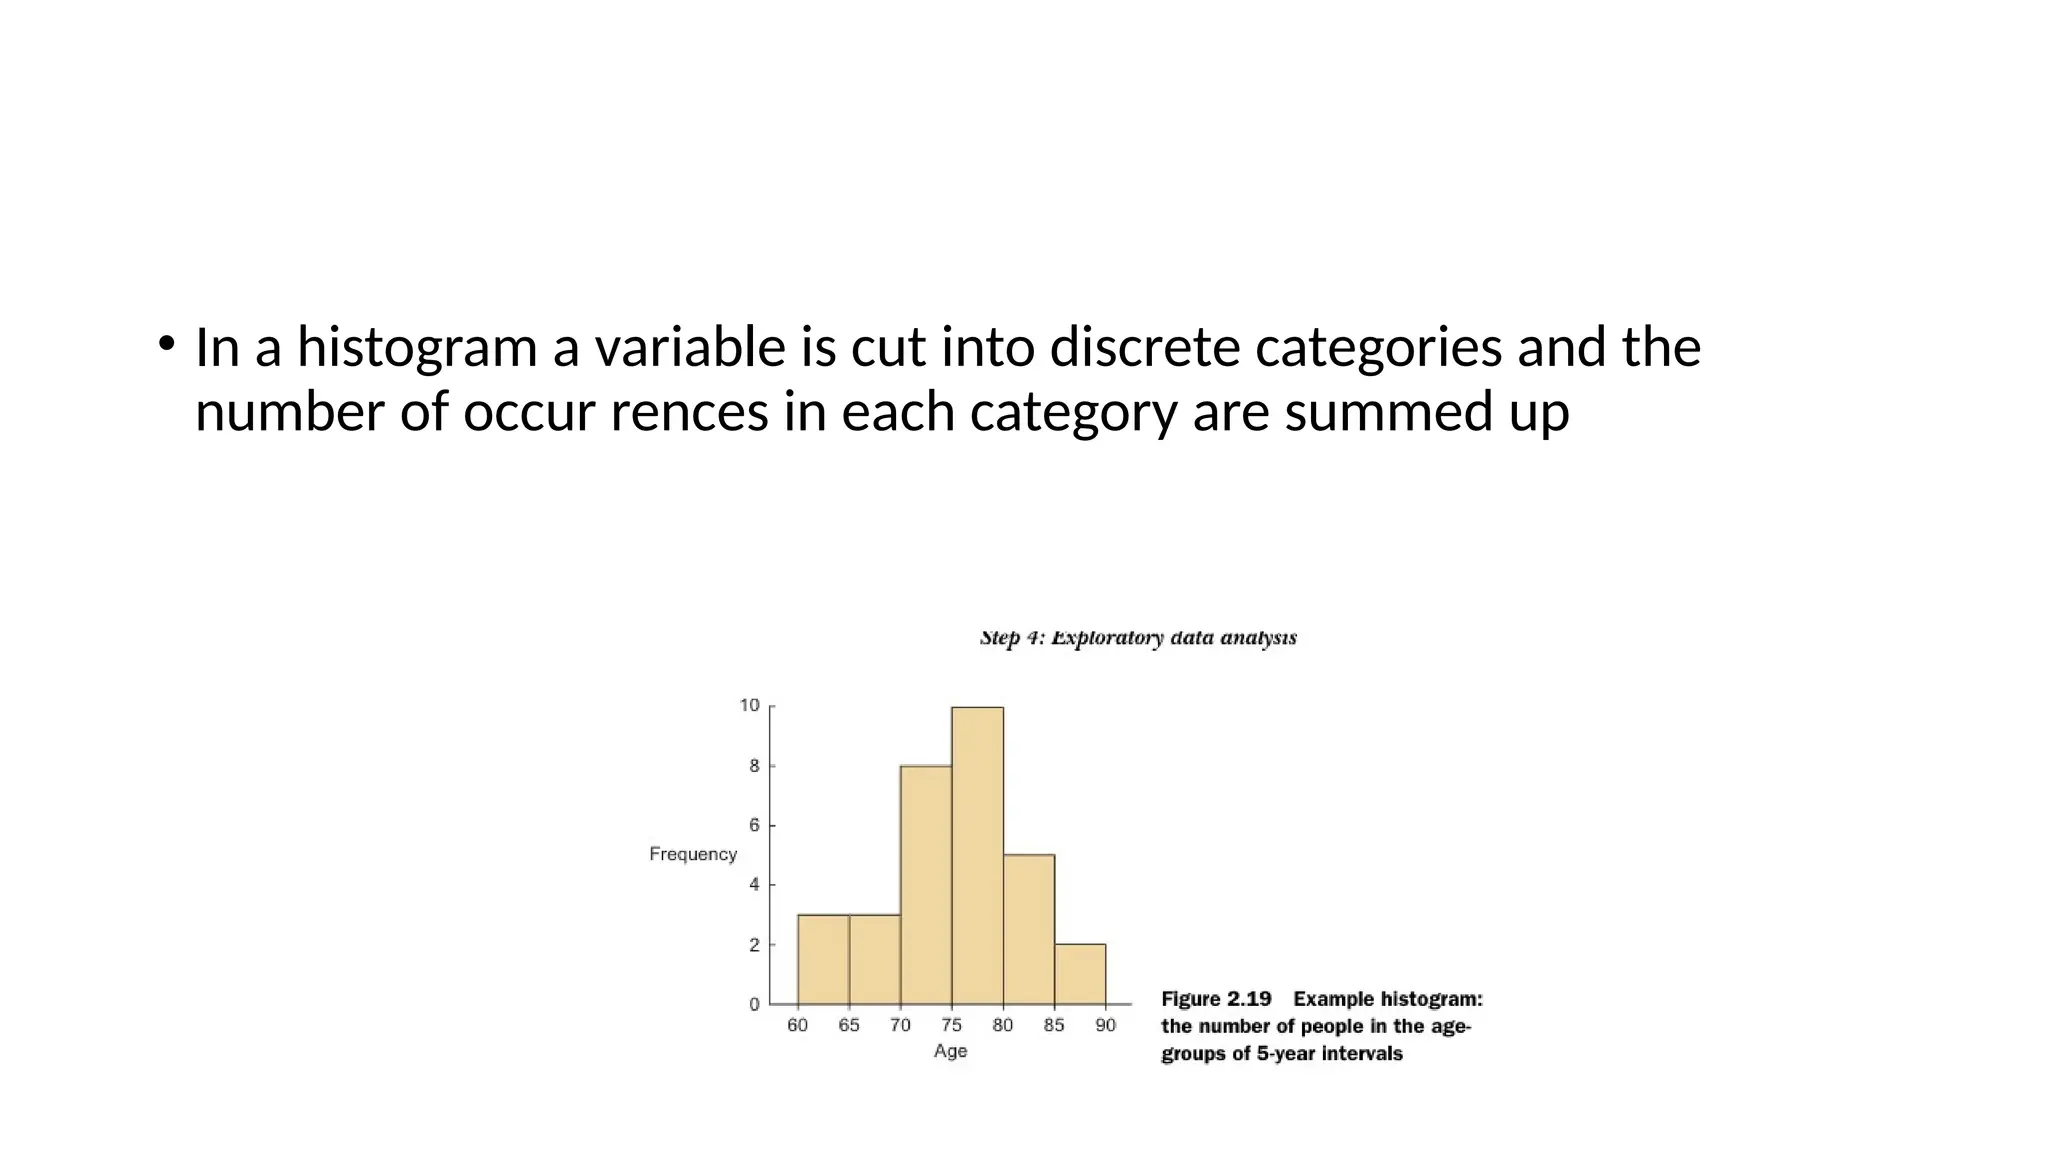
• In ahistogram a variable is cut into discrete categories and the number of occur rences in each category are summed up
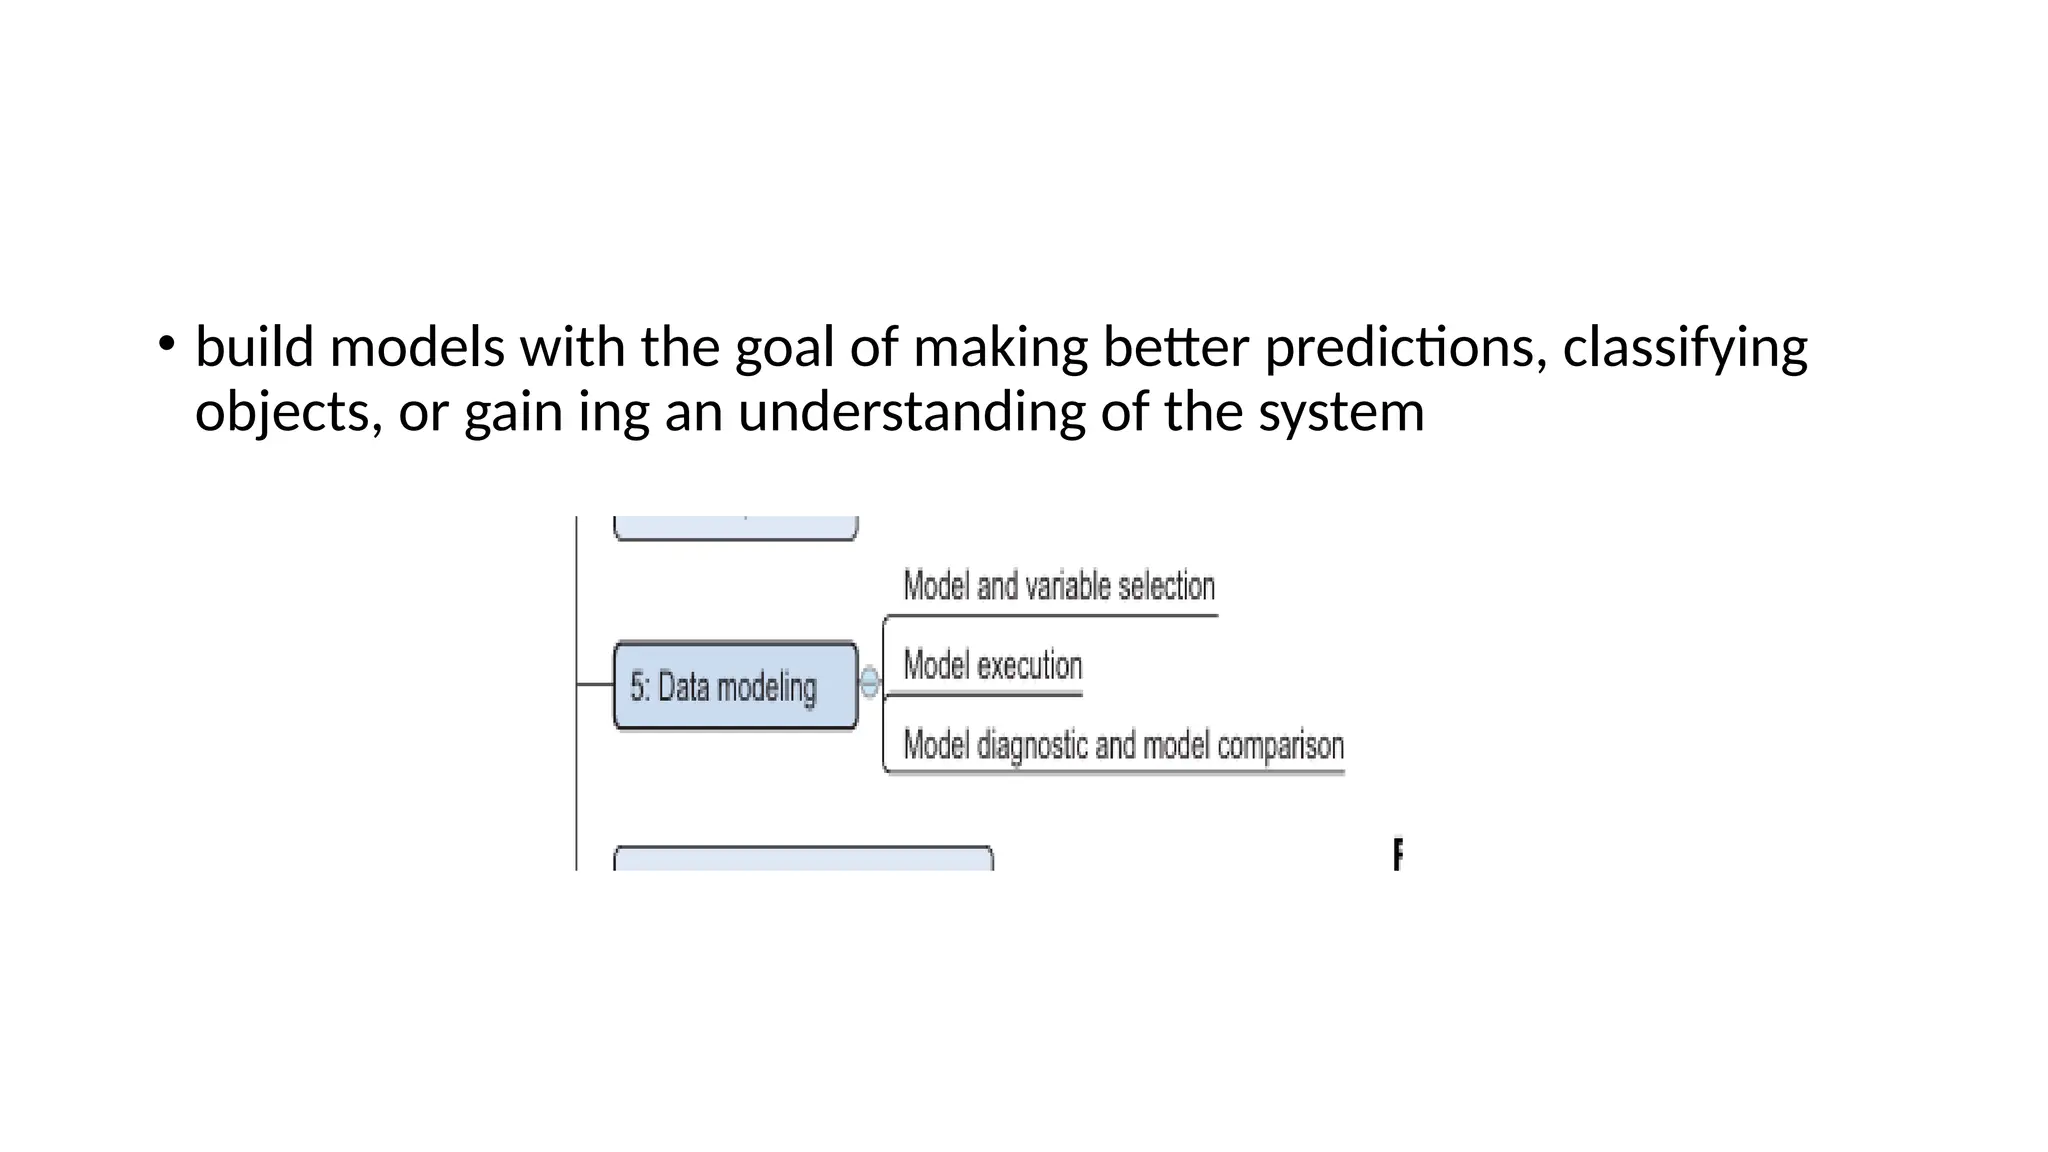
• build modelswith the goal of making better predictions, classifying objects, or gain ing an understanding of the system
40.
• Building amodel is an iterative process. • most models consist of the following main steps: • 1 Selection of a modeling technique and variables to enter in the model • 2 Execution of the model • 3 Diagnosis and model comparison
41.
Model and variableselection • select the variables you want to include in our model and a modeling technique. • Must the model be moved to a production environment and, if so, would it be easy to implement? • How difficult is the maintenance on the model: • how long will it remain relevant if left untouched? • Does the model need to be easy to explain?
42.
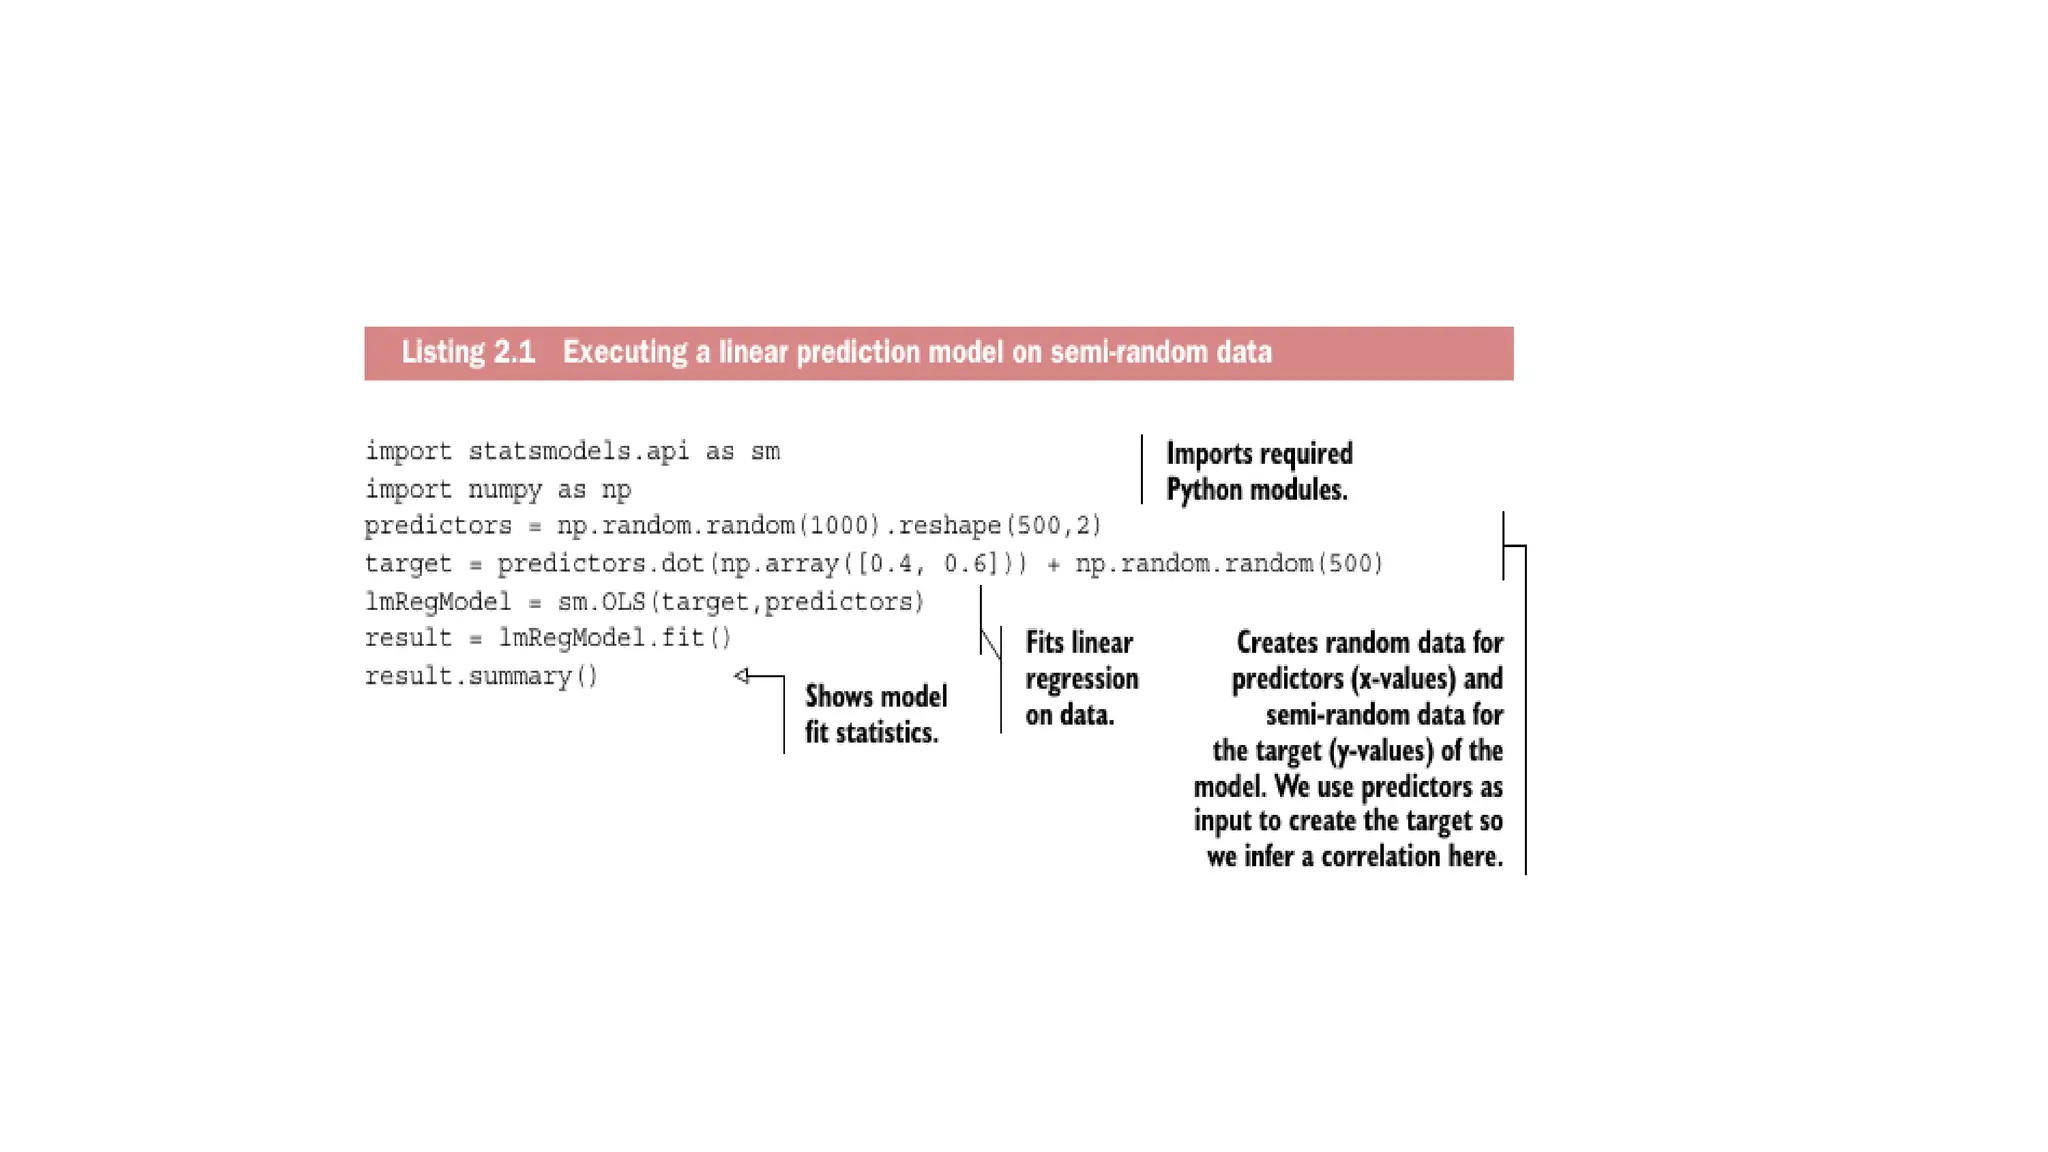
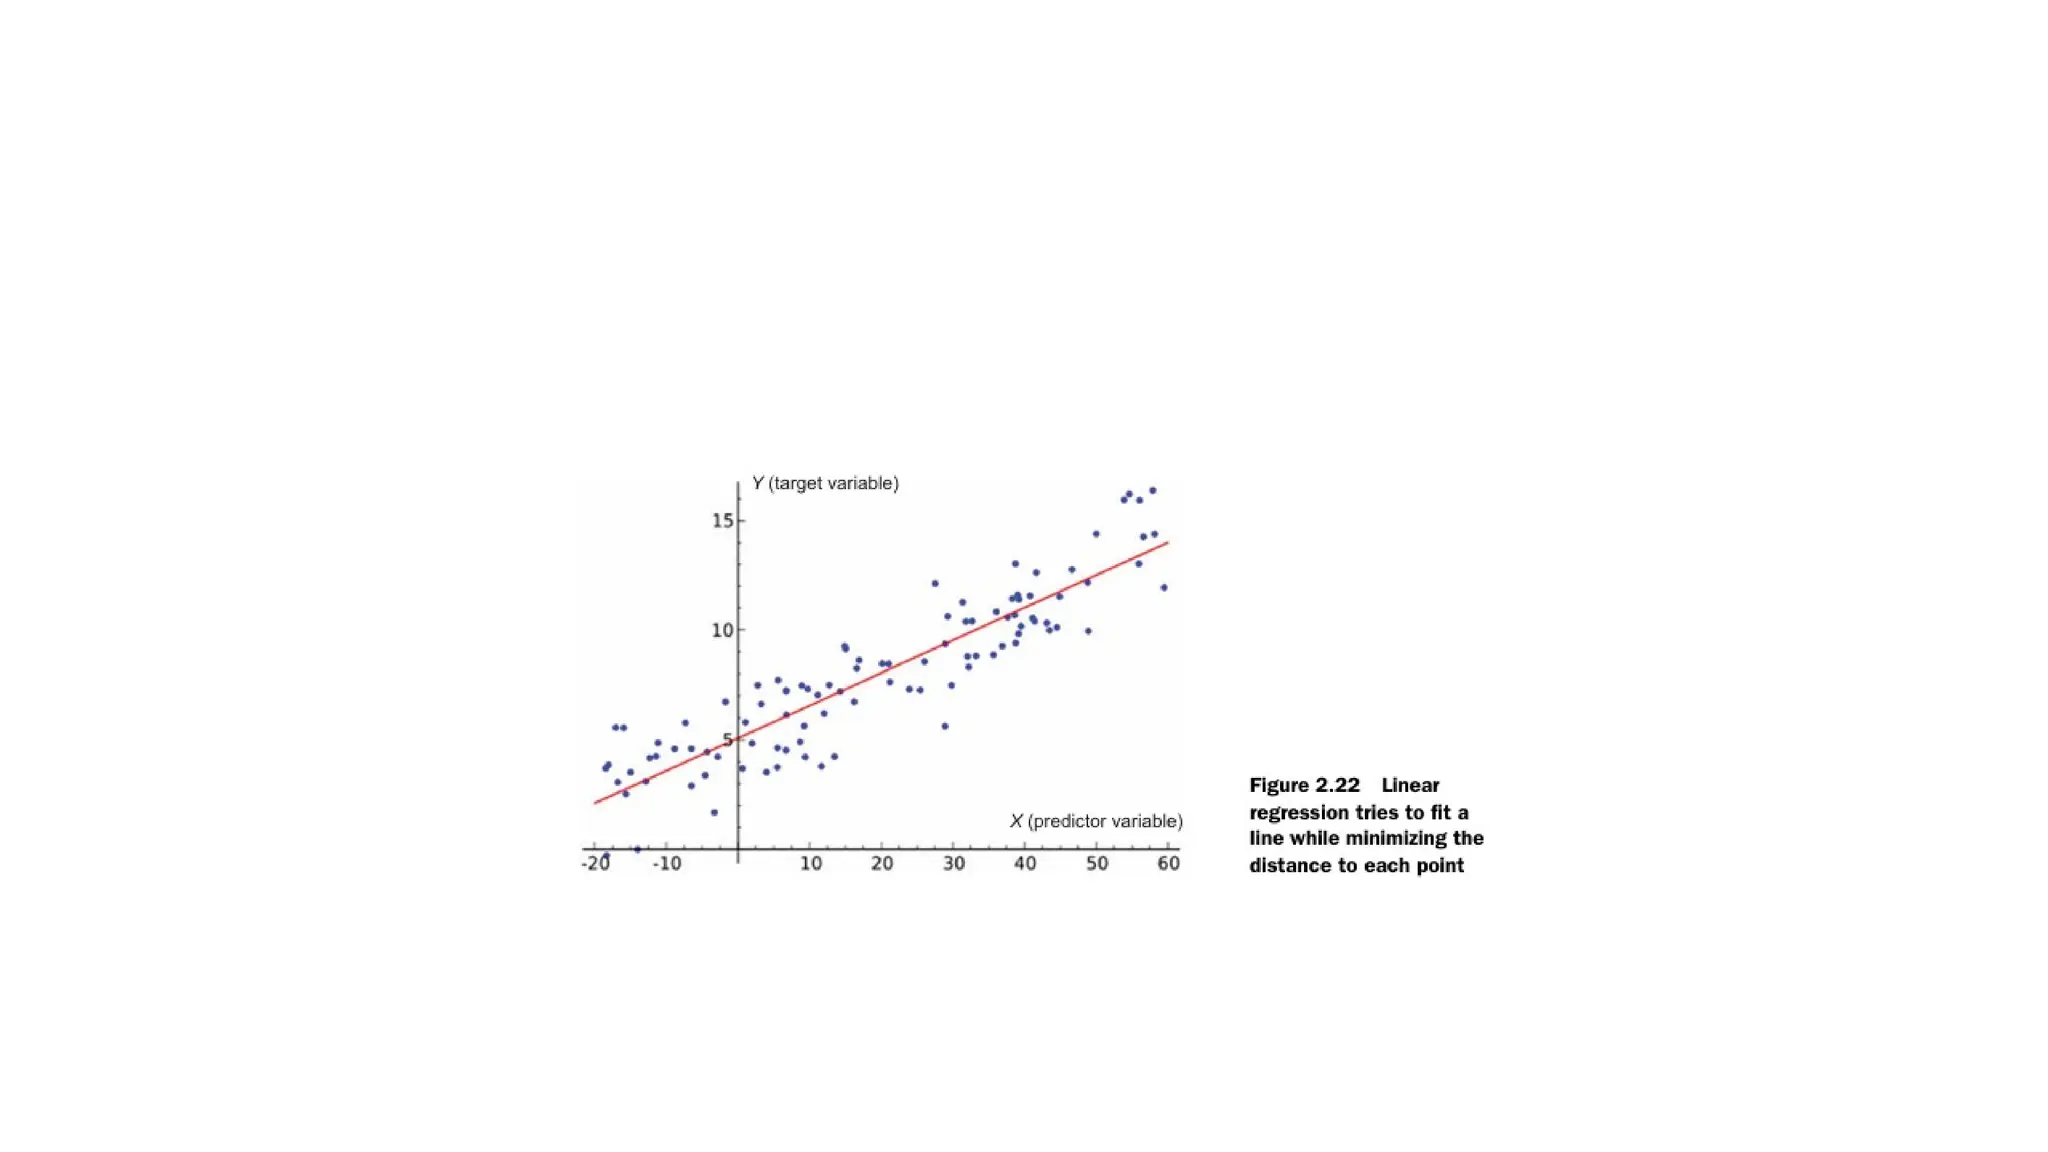
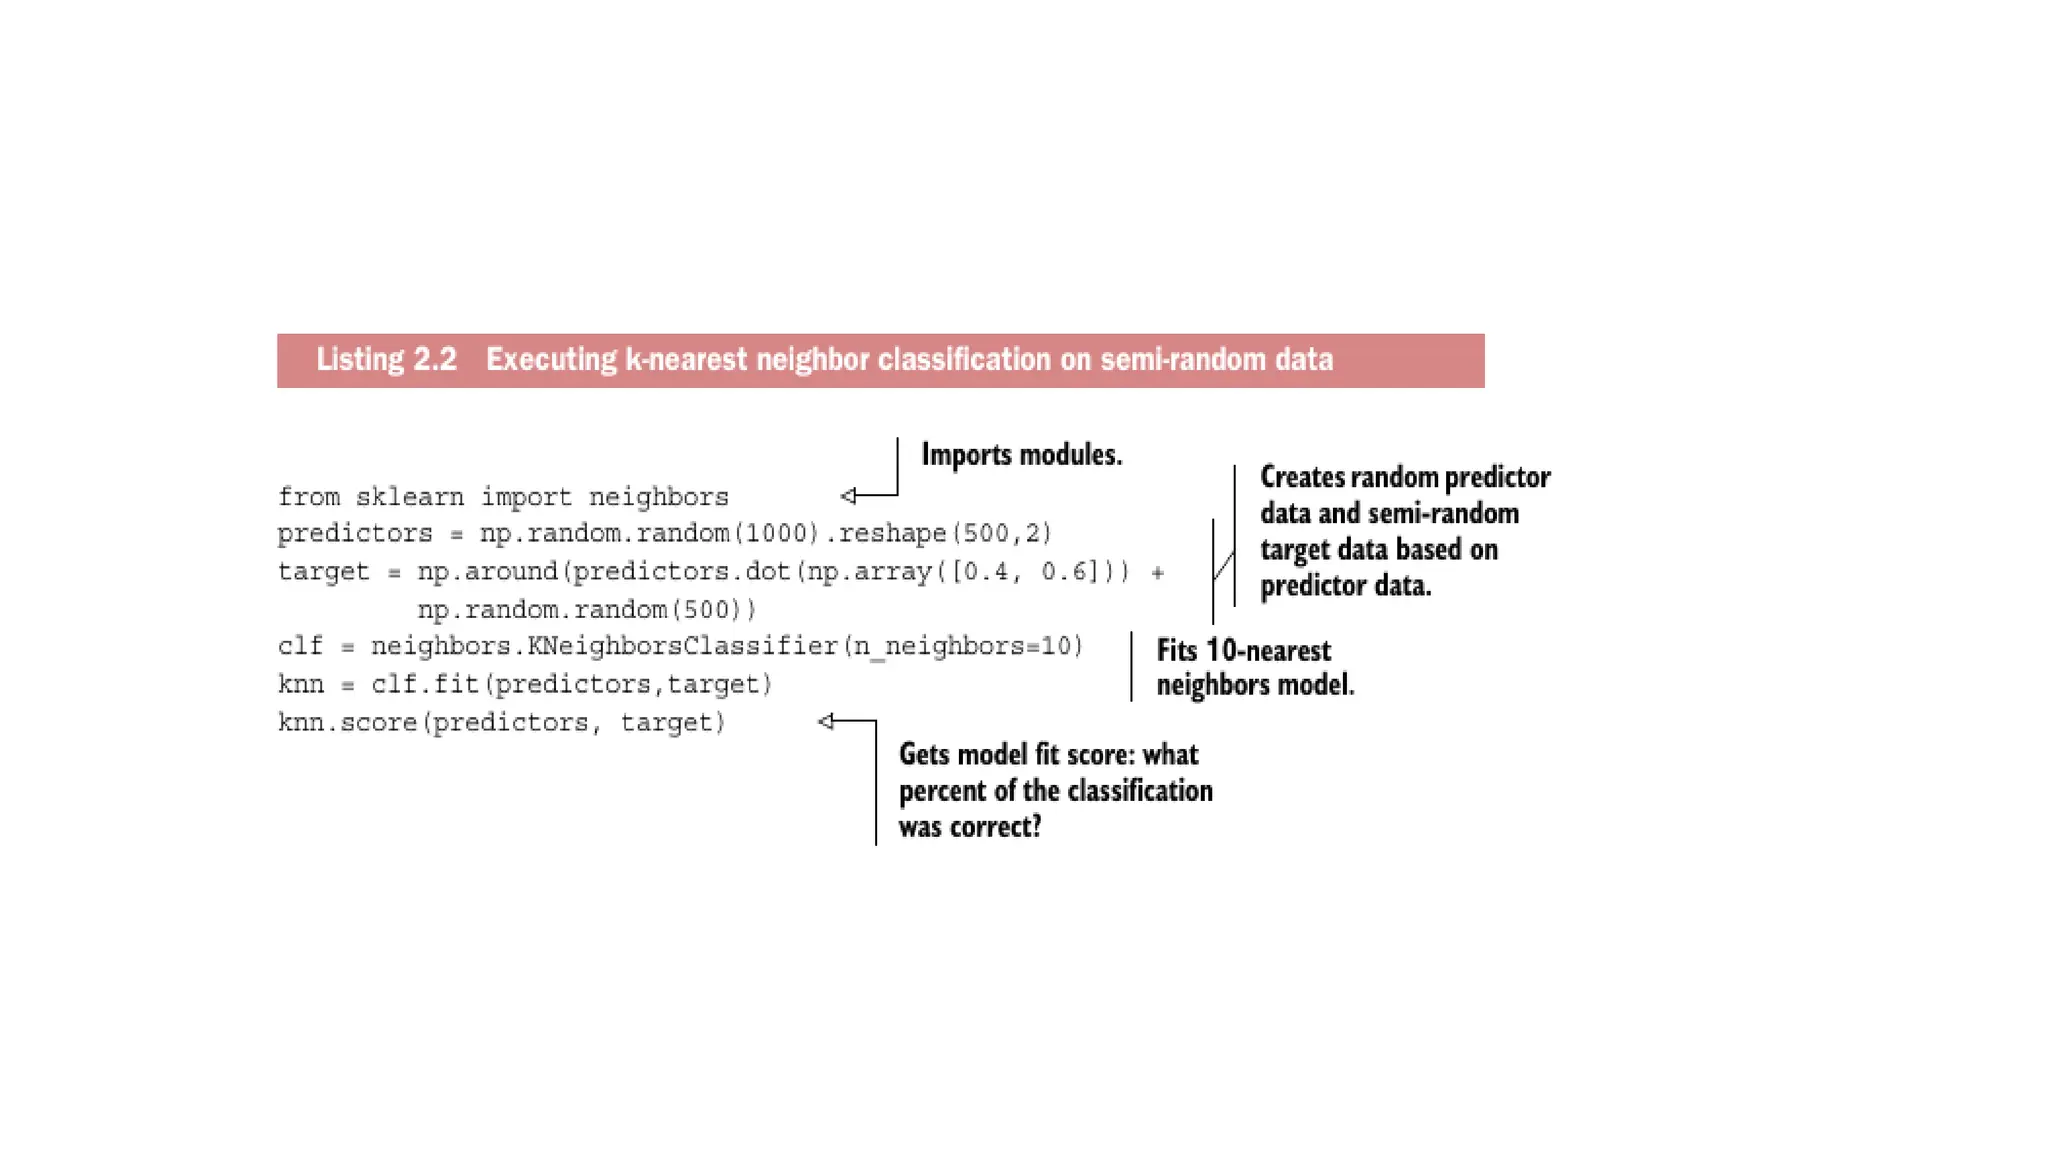
Model execution • chosena model - need to implement it in code • most programming languages, such as Python, already have libraries such as StatsModels or Scikit-learn.
47.
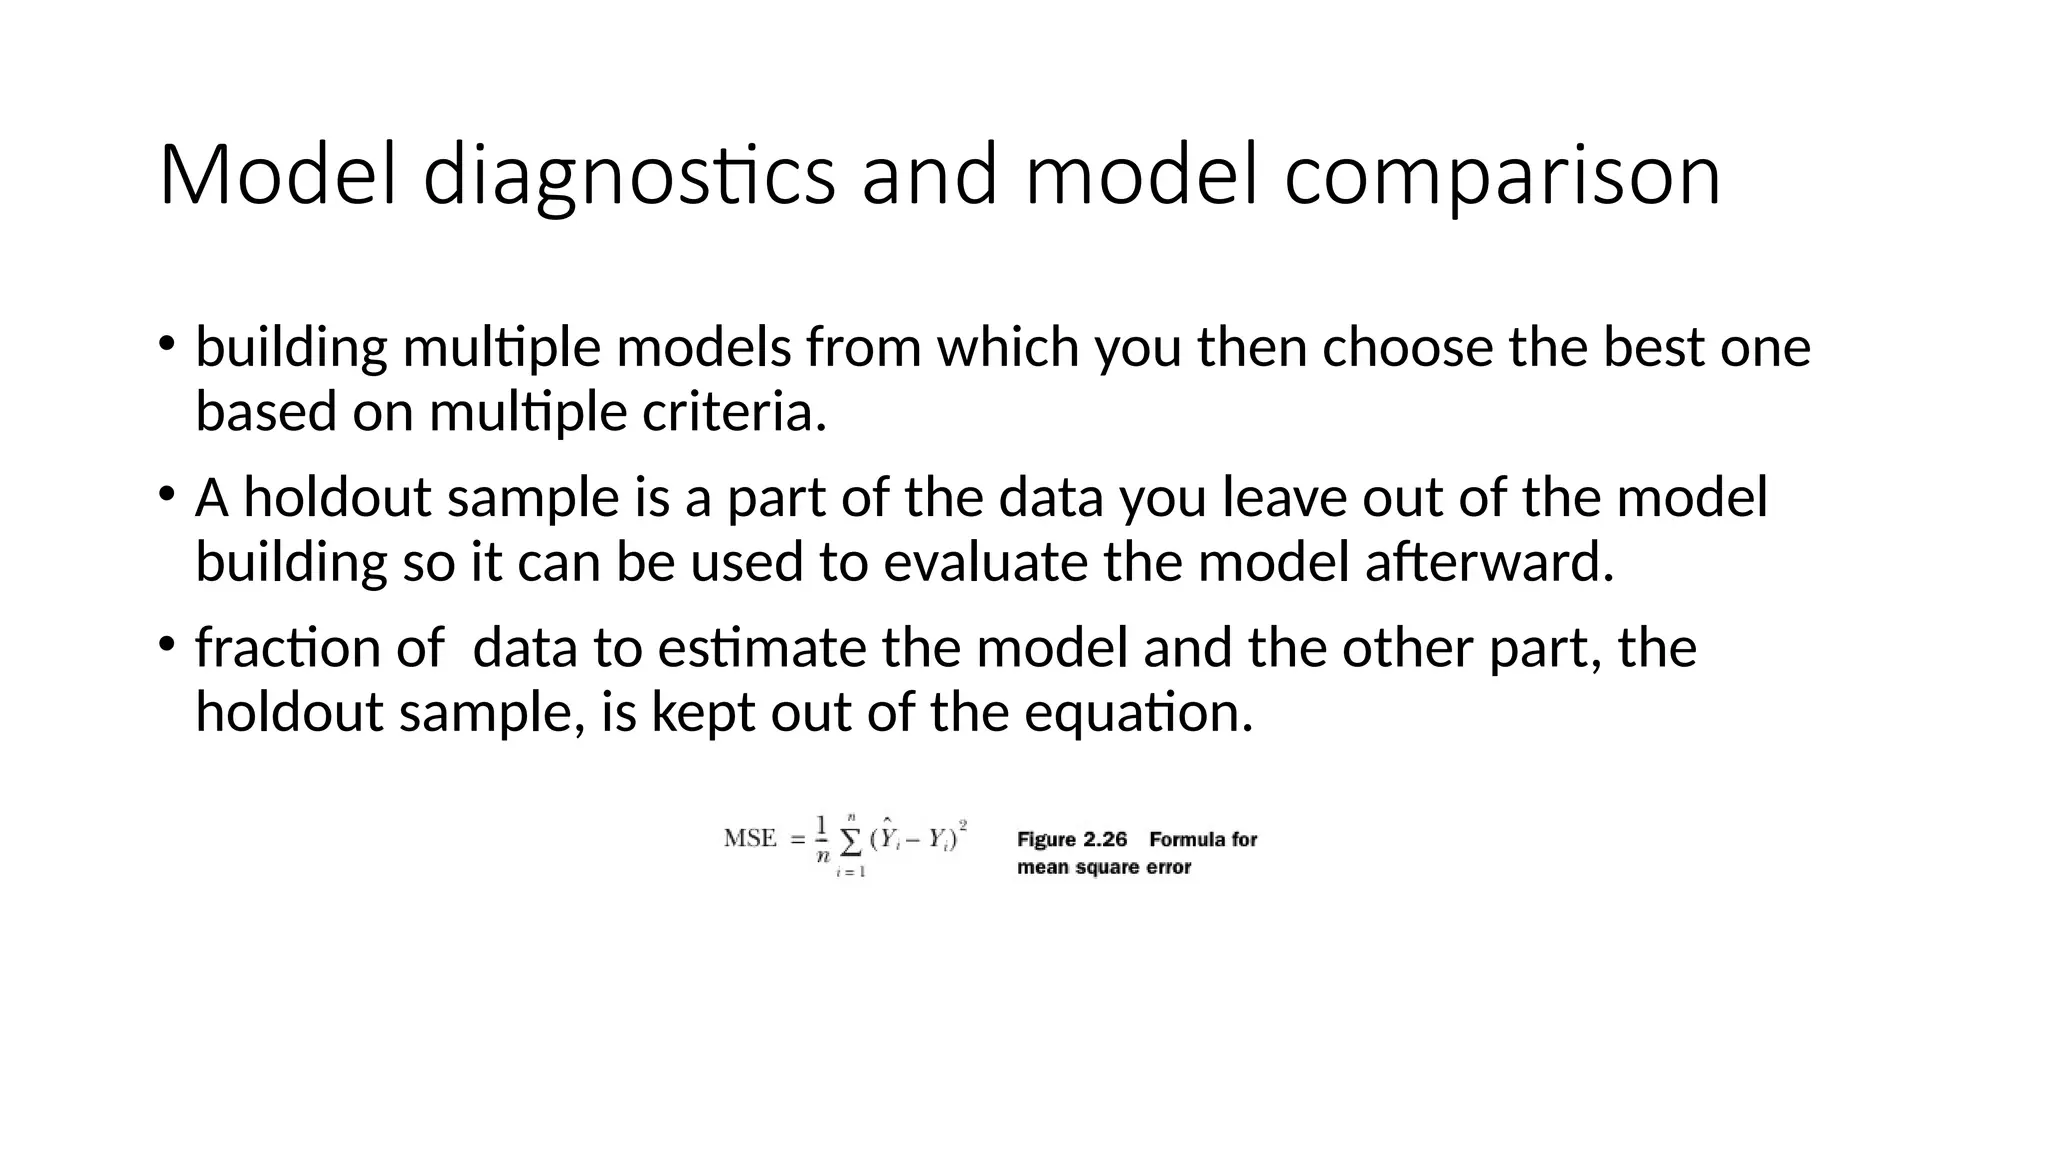
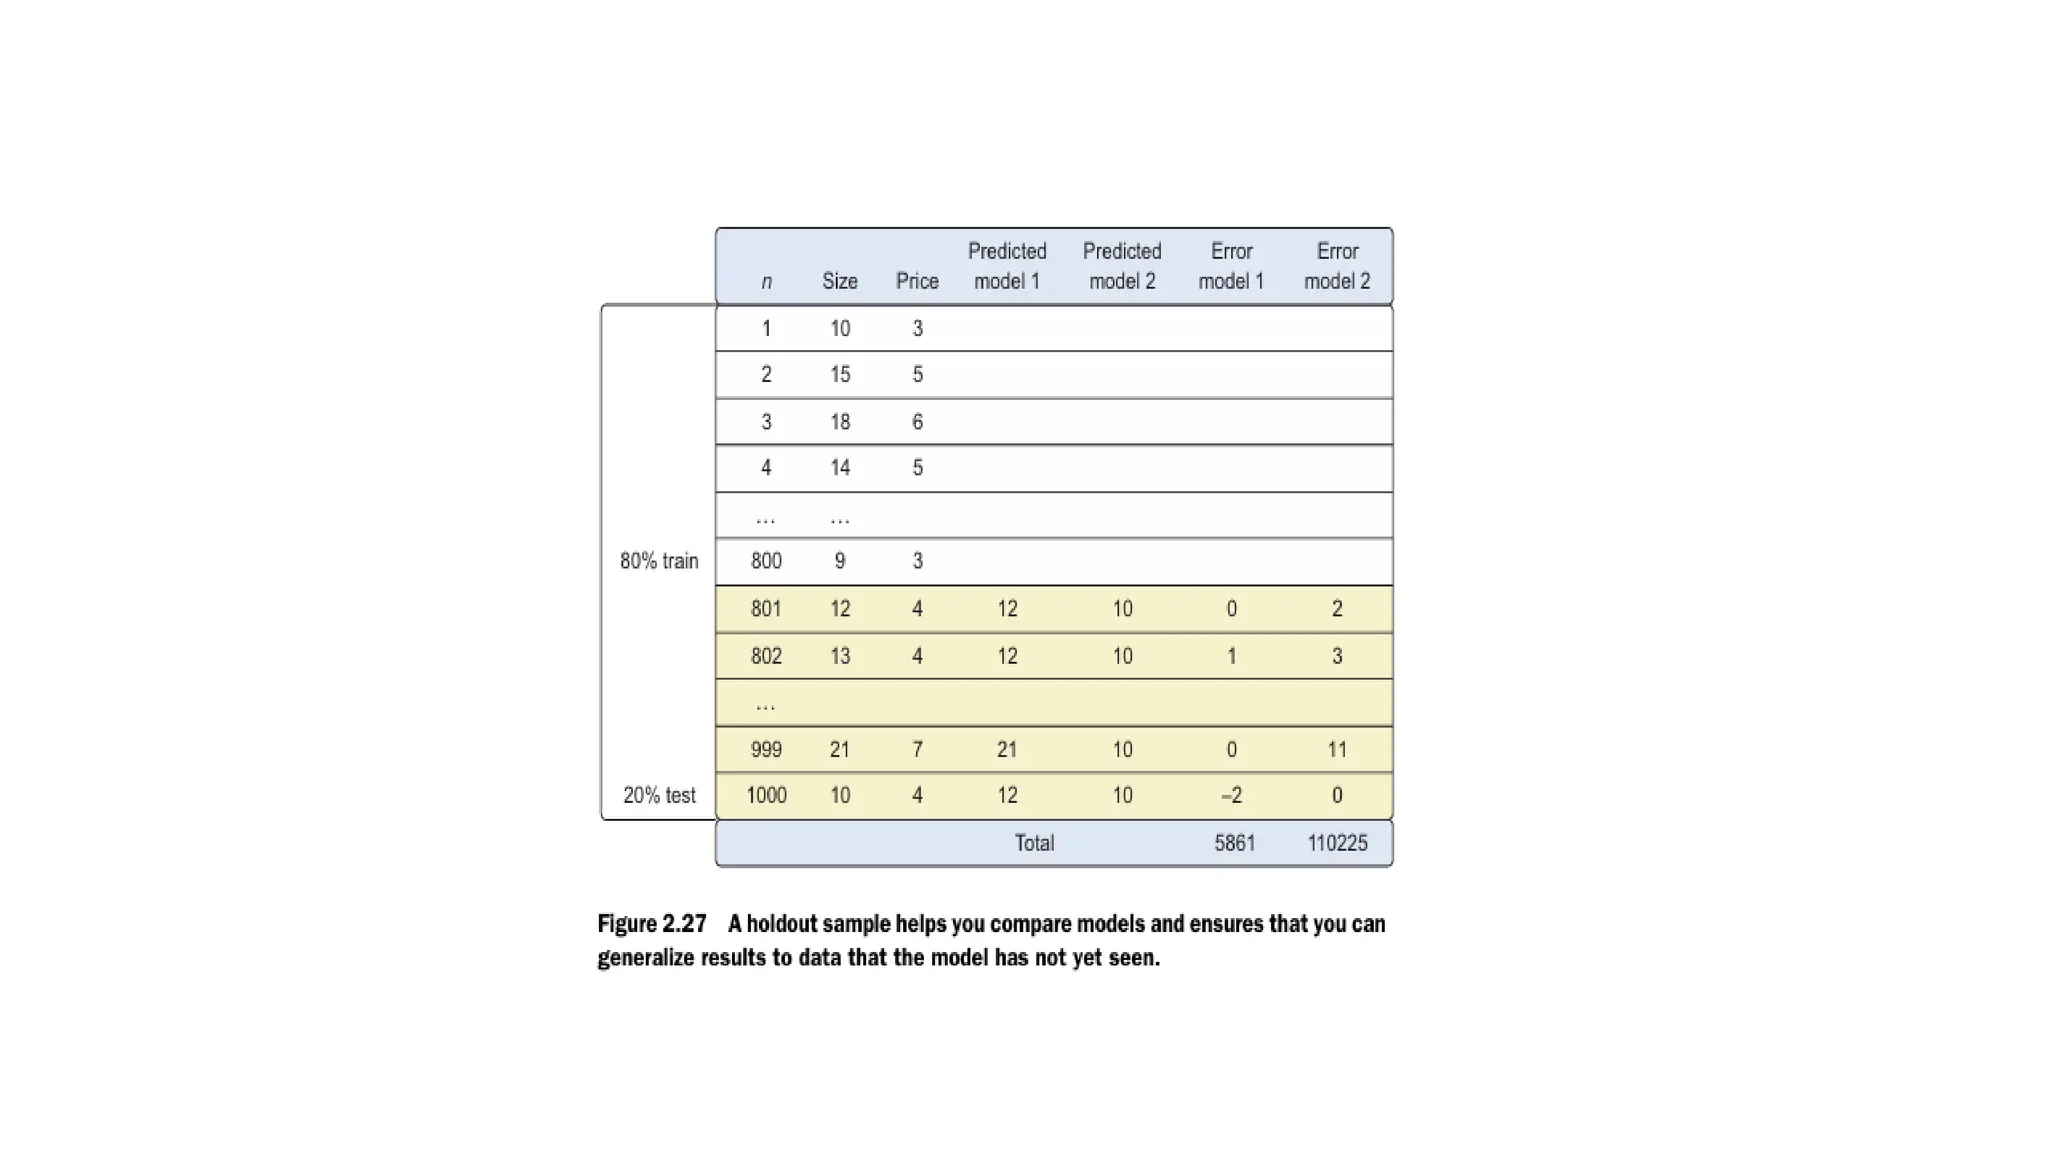
Model diagnostics andmodel comparison • building multiple models from which you then choose the best one based on multiple criteria. • A holdout sample is a part of the data you leave out of the model building so it can be used to evaluate the model afterward. • fraction of data to estimate the model and the other part, the holdout sample, is kept out of the equation.
49.
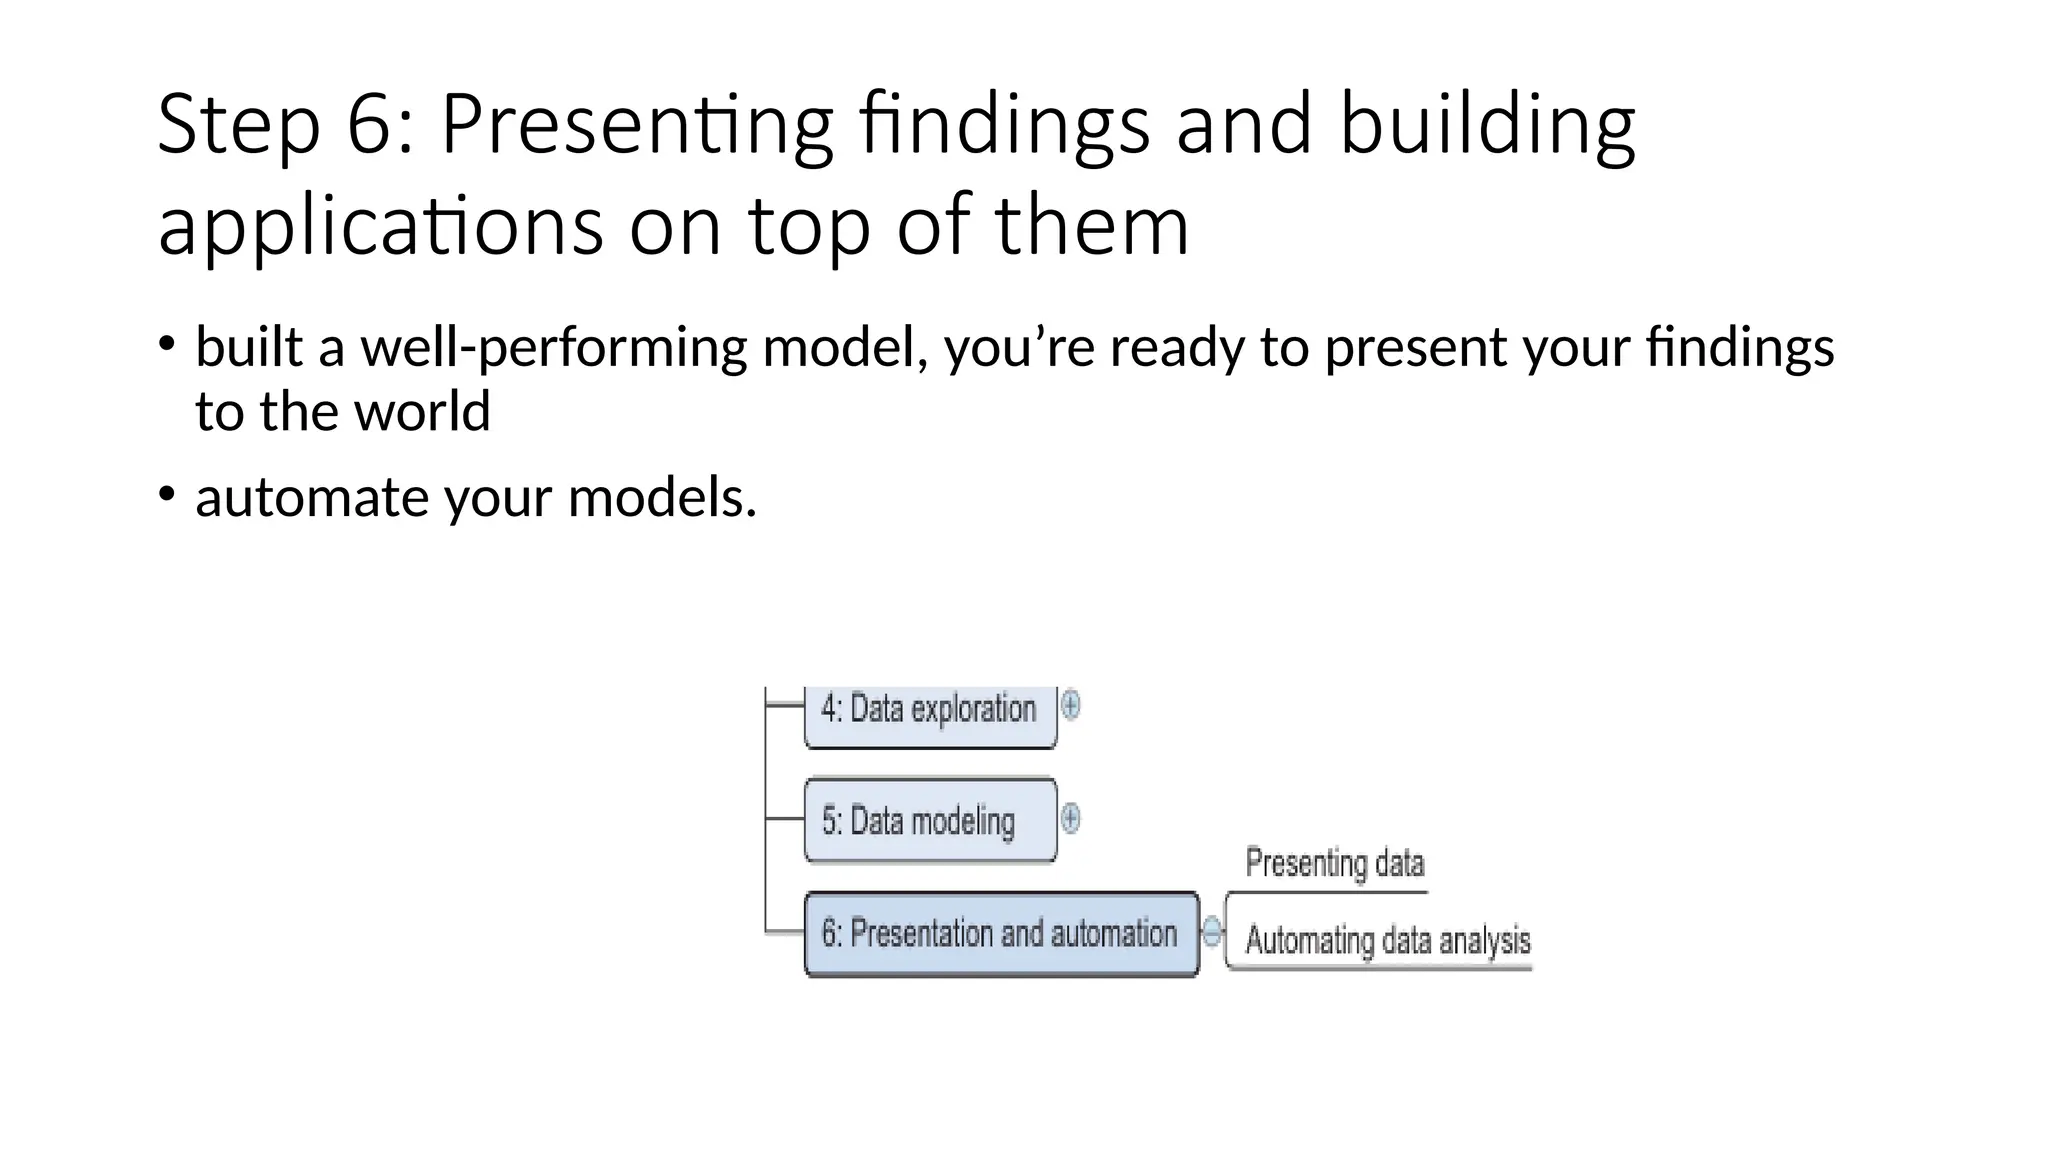
Step 6: Presentingfindings and building applications on top of them • built a well-performing model, you’re ready to present your findings to the world • automate your models.