The document discusses various problem-solving concepts, particularly in relation to data, algorithms, and programming. It emphasizes the six steps for effective problem-solving and differentiates between algorithmic and heuristic solutions while outlining essential programming terminology and techniques. Additionally, it includes organizational tools like problem analysis charts and flowcharts to facilitate understanding and documentation in programming tasks.
Problem Solving Concepts POINTSTO BE DISCUSSED: What is mean by data, information,data structure What is a problem?-Types of problems Problem Solving in everyday life. Six steps for general problem solving Problem solving concepts for computers- Constants, Variables, Operators, Hierarchy of operations, Data types, Equations, Functions, Expressions. Organising Problems- Problem Analysis Charts, Structure/Interactivity Charts, IPO Chart, Algorithm, Flowcharts, Internal and External documentation
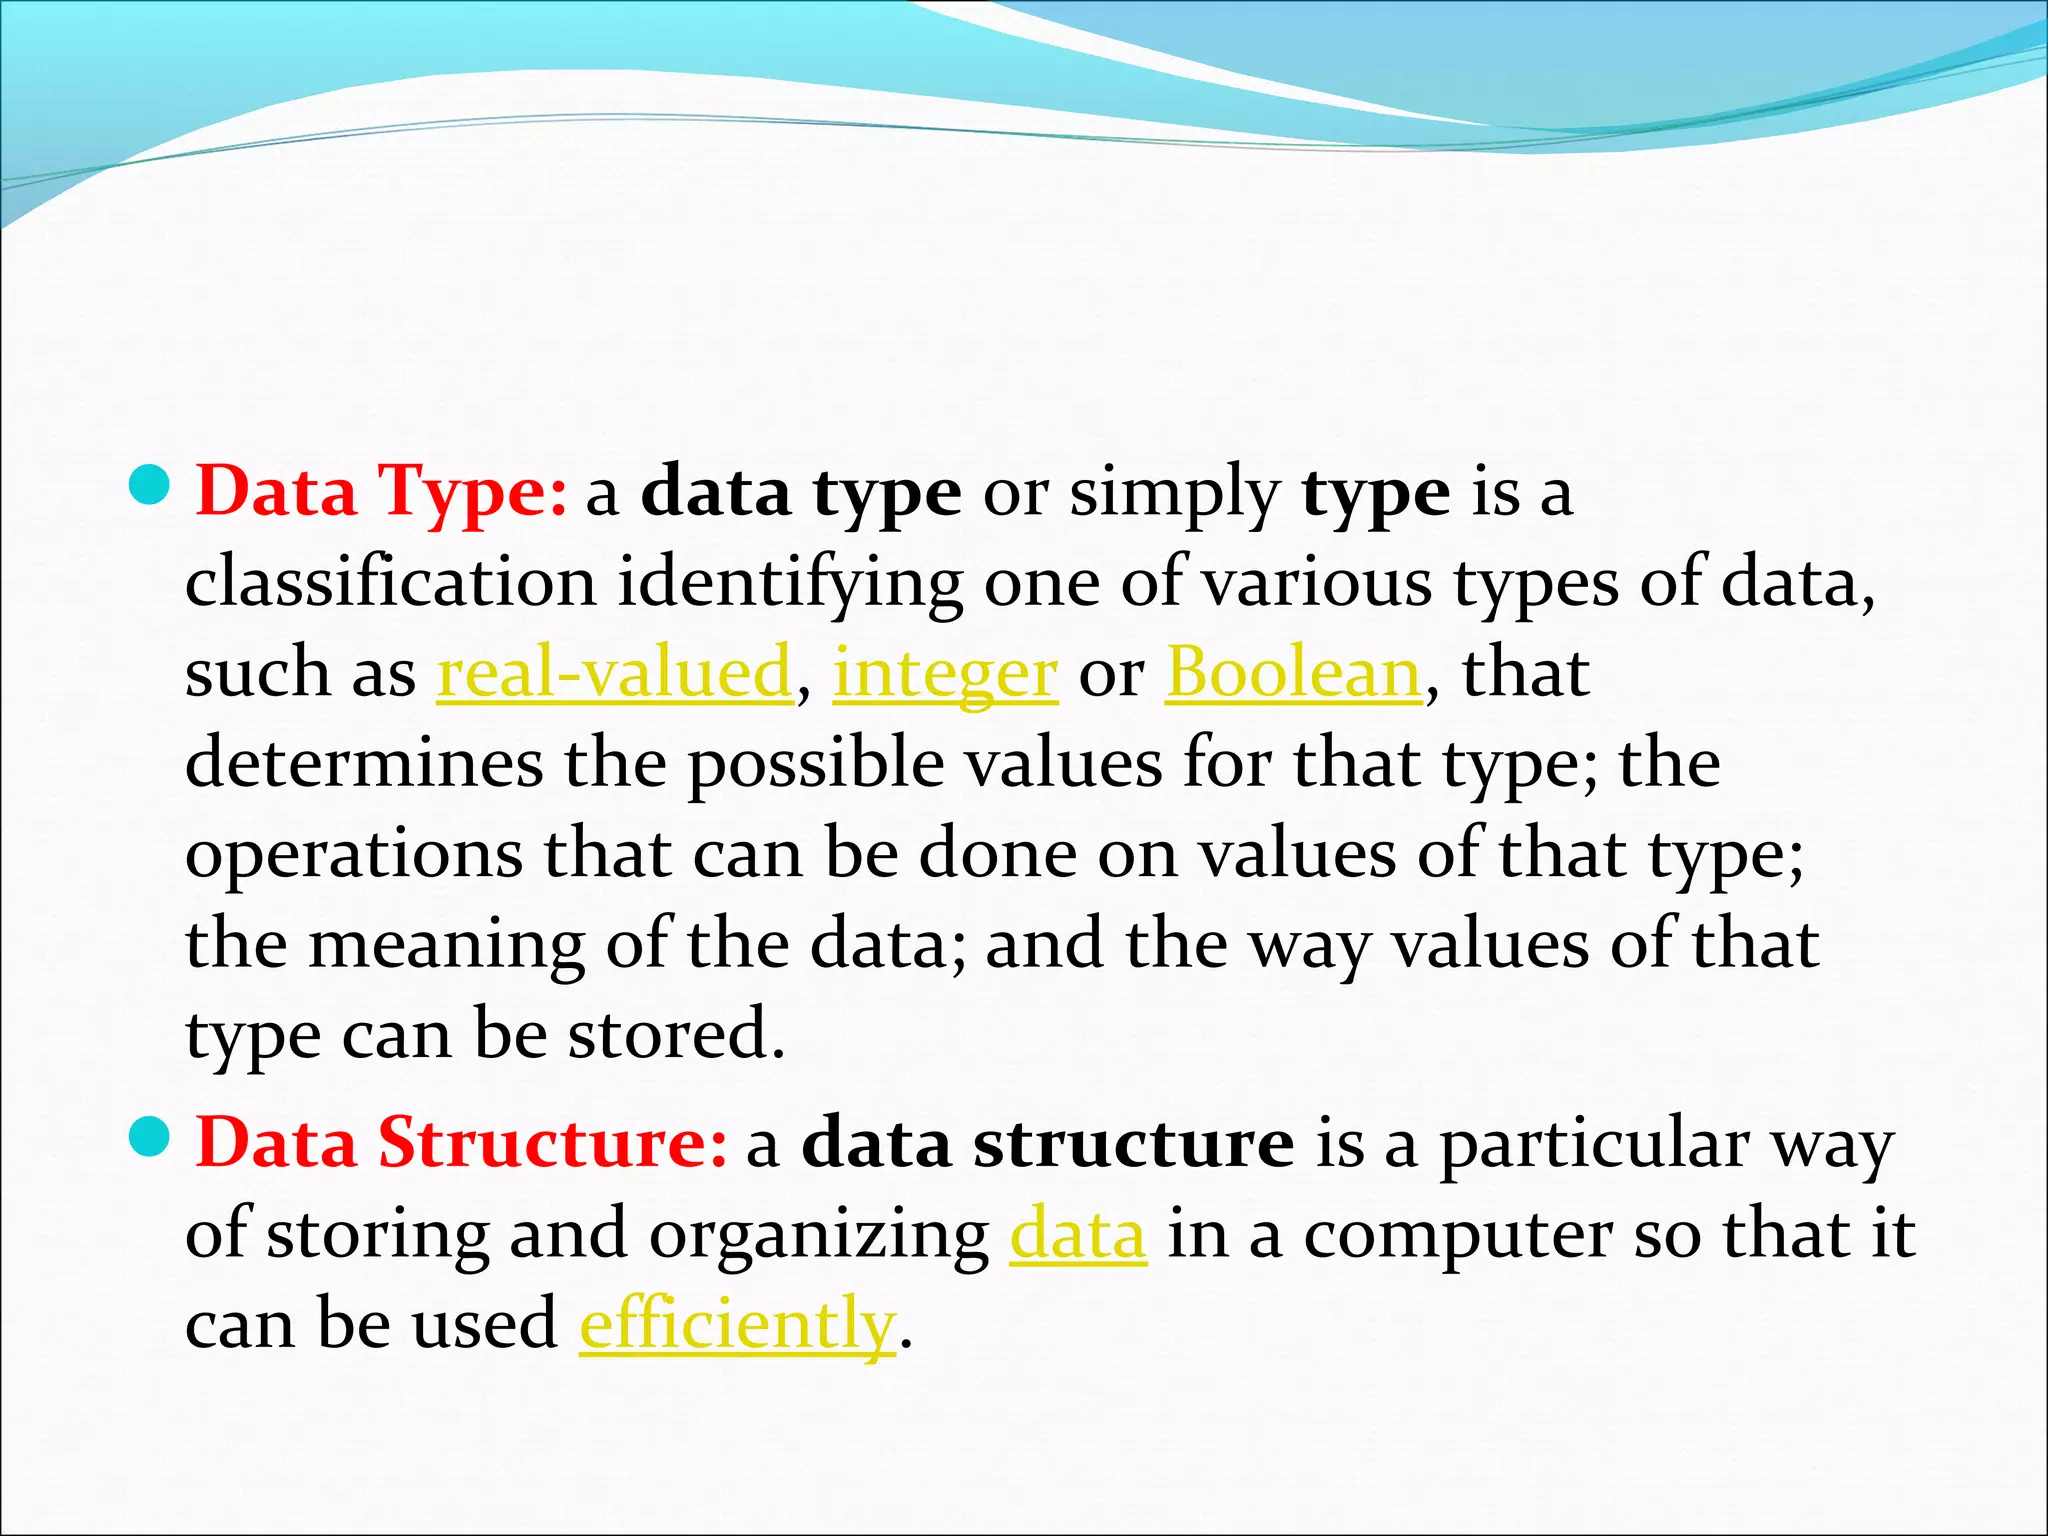
Data Type: adata type or simply type is a classification identifying one of various types of data, such as real-valued, integer or Boolean, that determines the possible values for that type; the operations that can be done on values of that type; the meaning of the data; and the way values of that type can be stored. Data Structure: a data structure is a particular way of storing and organizing data in a computer so that it can be used efficiently.
What is aProblem? A state of difficulty that needs to be resolved Problems exist where goals need to be attained and there is uncertainty about solution A Problem is an opportunity for improvement A problem is the difference between your current state and your goal state
6.
Problem Faced inEveryday in Life People make decisions everyday Examples: Should I wear casual or formal today? Should I watch TV or go out to cinema? what career? what course? What shoes? Everything needs a DECISION AS A SOLUTION TO THE PROBLEM
7.
What happens whenbad decisions are made? WASTAGE OF TIME AND RESOURCES
8.
Six steps toensure a Best decision in PROBLEM SOLVING Identify the problem Understand the problem Identify alternative ways to solve the problem Select the best way to solve the problem from the list of alternative solutions List instructions that enable you to solve the problem using selected solution Evaluate the solution
9.
How do theindividual wish to spend the evening knowledege base-playing chesss example watch television,go to movie etc select best one prepare list of steps that will result in a fun evening are we having the fun yet? Take the problem of what to do this evening
10.
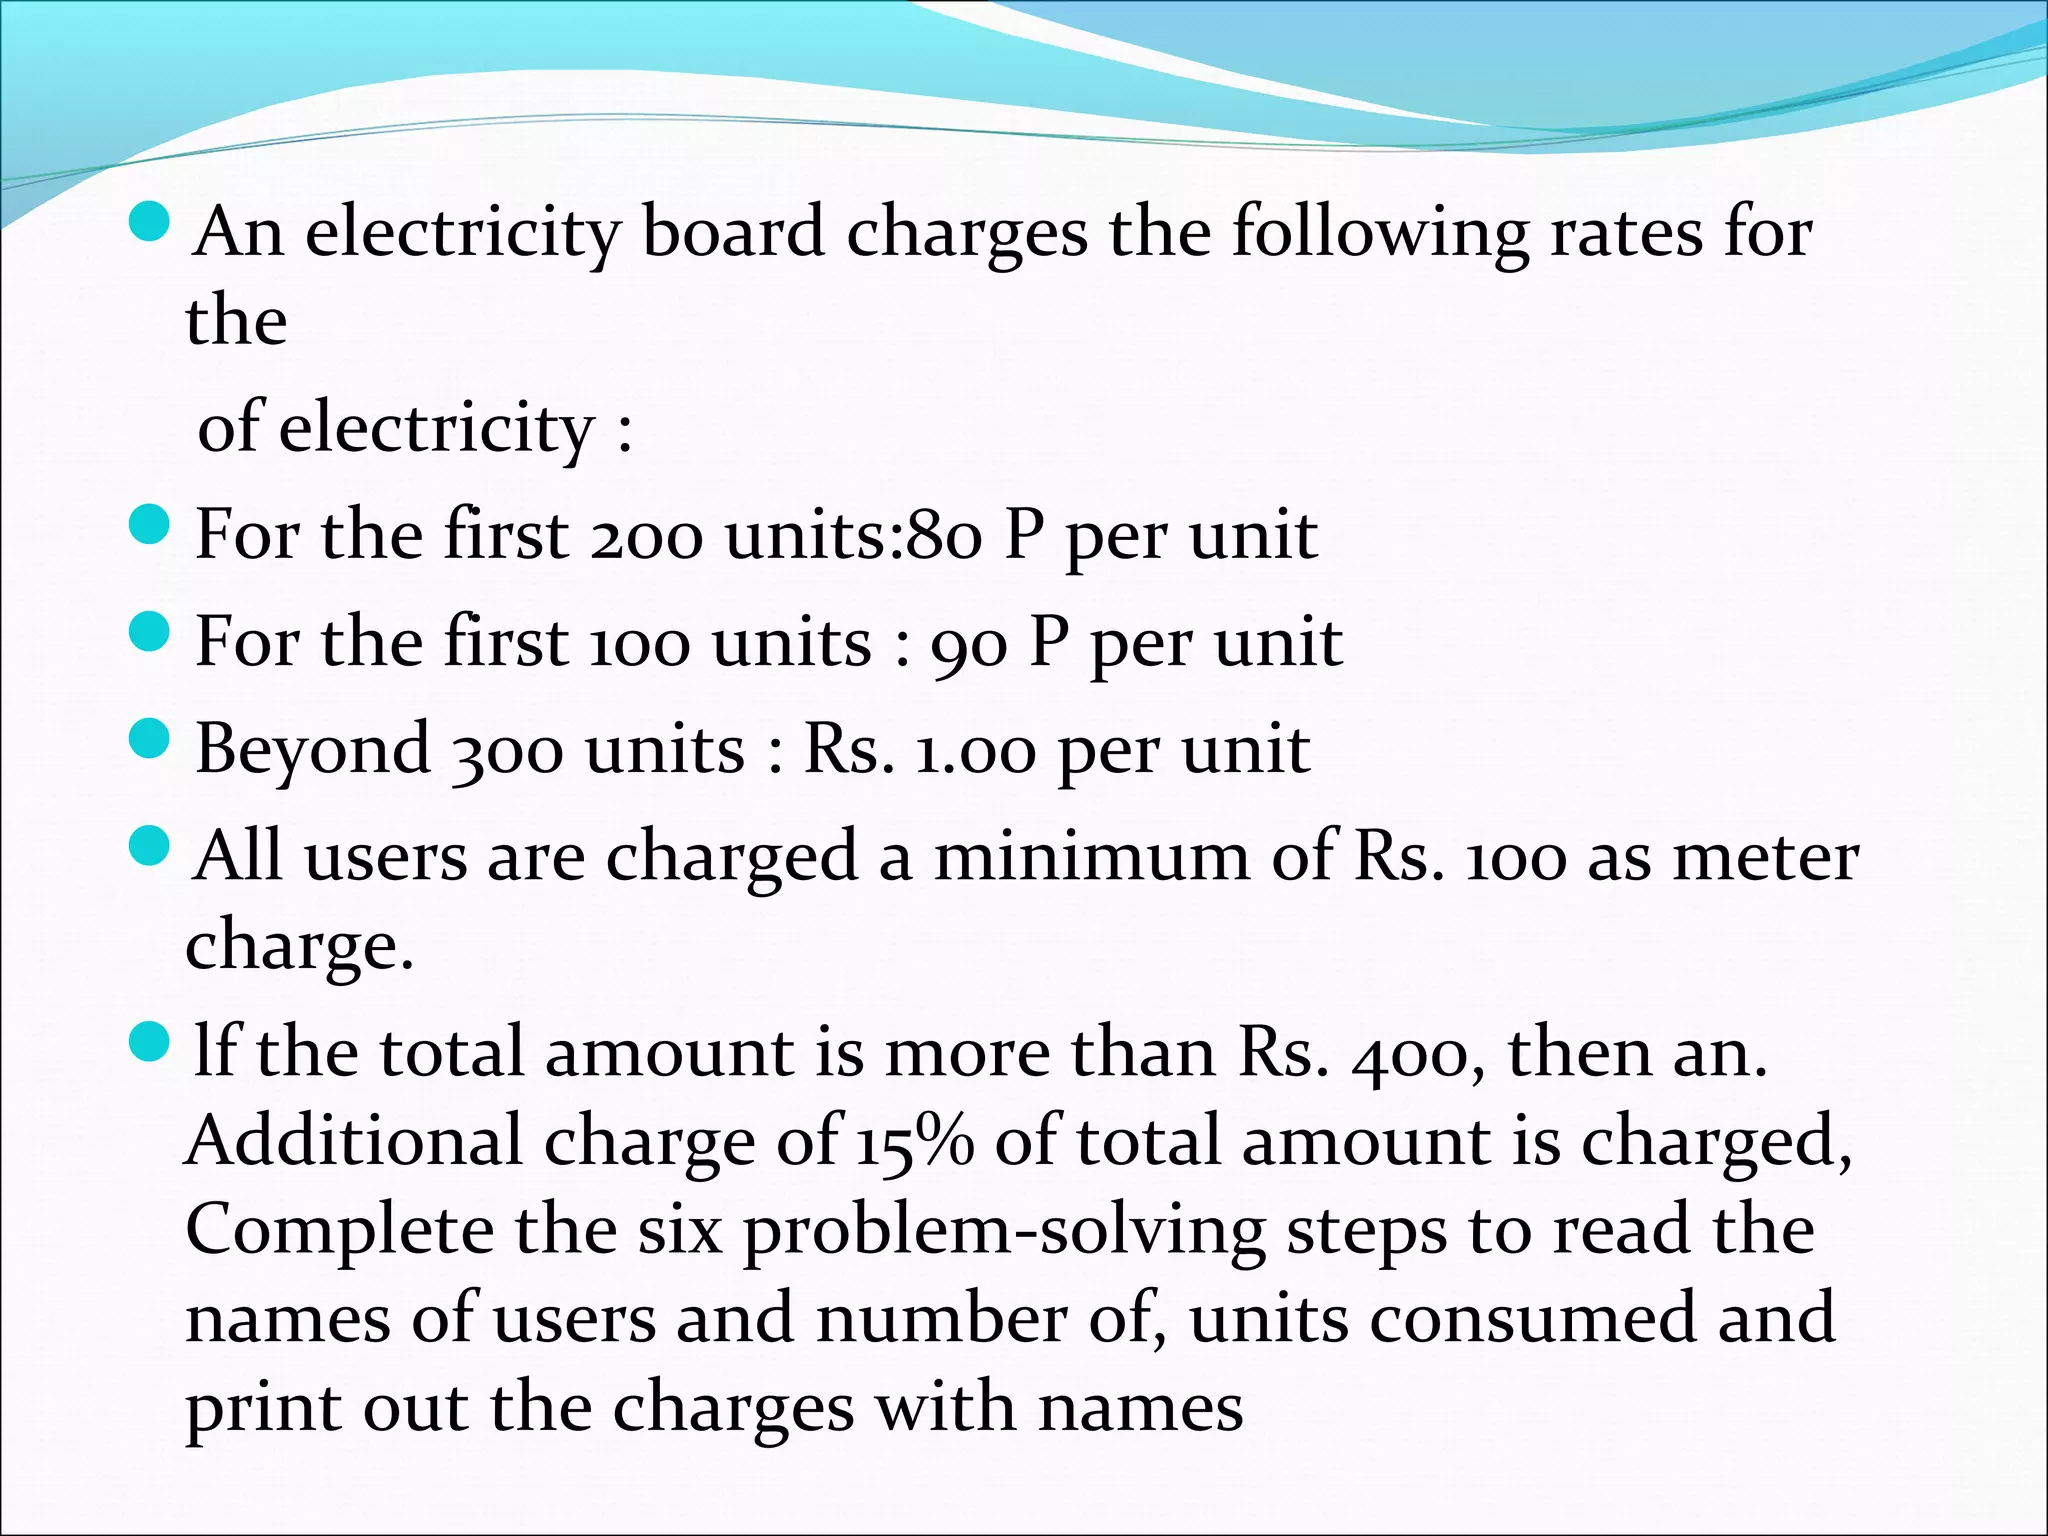
An electricity boardcharges the following rates for the of electricity : For the first 200 units:80 P per unit For the first 100 units : 90 P per unit Beyond 300 units : Rs. 1.00 per unit All users are charged a minimum of Rs. 100 as meter charge. lf the total amount is more than Rs. 400, then an. Additional charge of 15% of total amount is charged, Complete the six problem-solving steps to read the names of users and number of, units consumed and print out the charges with names
11.
Approaches to solvea problem: Algorithmic Heuristic Solutions that can be solved with a series of known actions are called Algorithmic Solutions Employing a self-learning approach to the solution of a problems is known as Heuristic Solutions Important definitions
12.
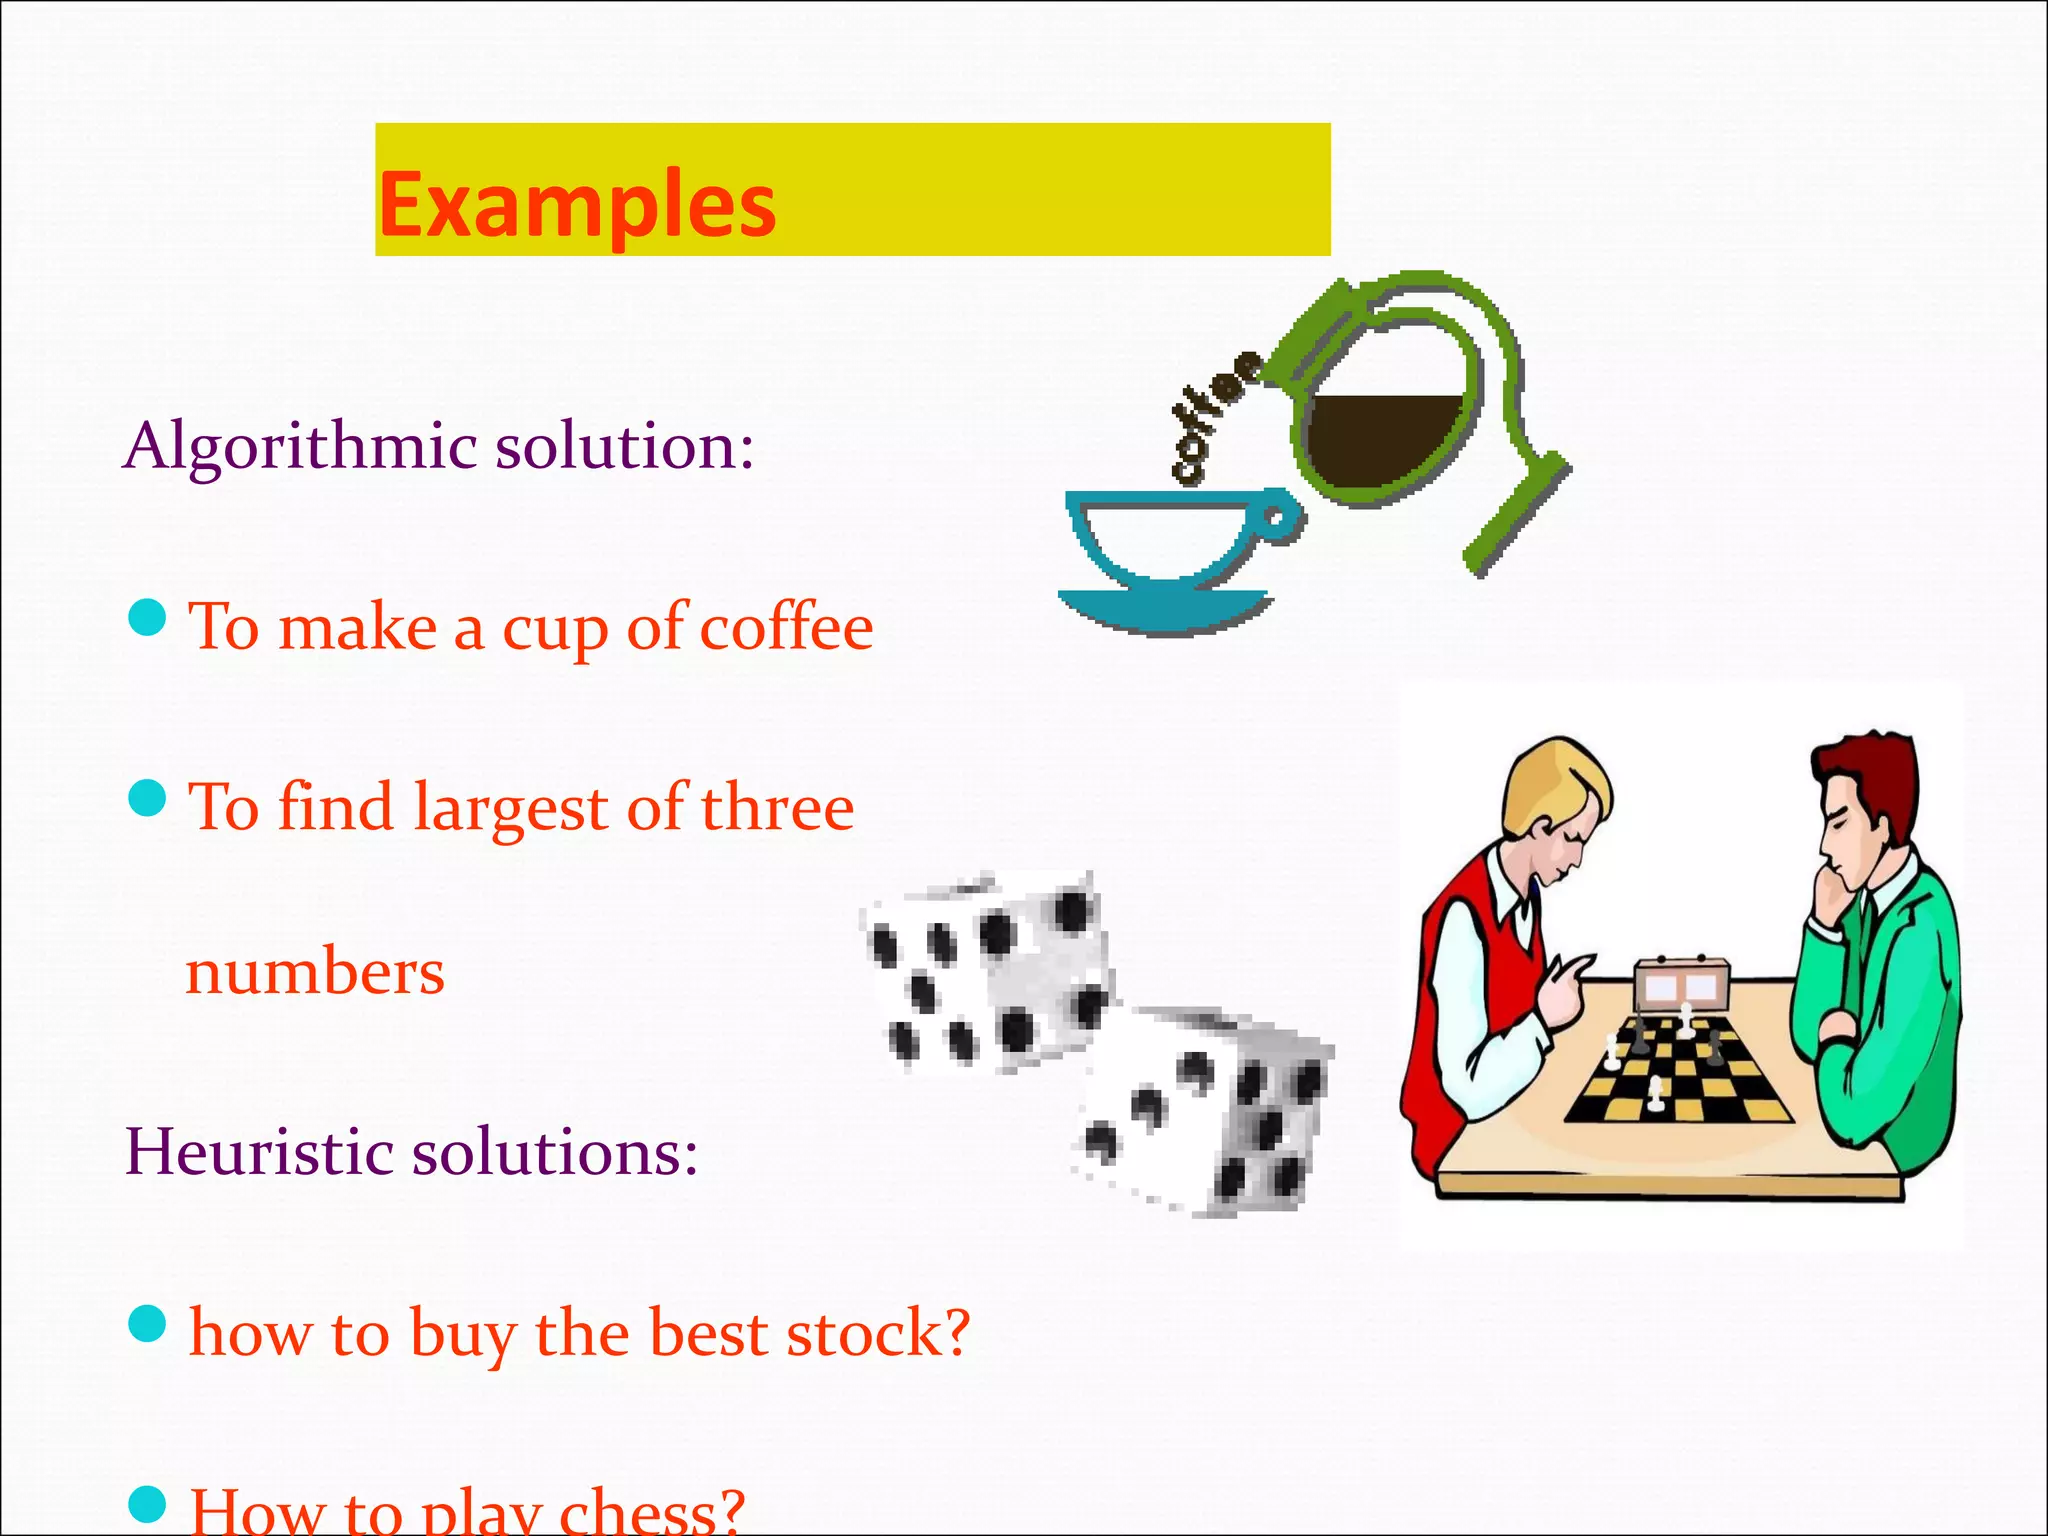
Examples Algorithmic solution: To makea cup of coffee To find largest of three numbers Heuristic solutions: how to buy the best stock? How to play chess?
13.
Problem solving withcomputers Computers use algorithmic solutions Program – set of instructions that make up solution to a problem Results – outcome of running the program Testing – Are the outcomes what you expected and correct Documentation – two types manual documentation – instructions telling users how to use the program
14.
Problem solving withcomputers involves several steps Clearly define the problem. Analyse the problem and formulate a method to solve it (see also .validation.). Describe the solution in the form of an algorithm. Draw a flowchart of the algorithm. Write the computer program. Compile and run the program (debugging). Test the program (debugging) (see also verification.).
15.
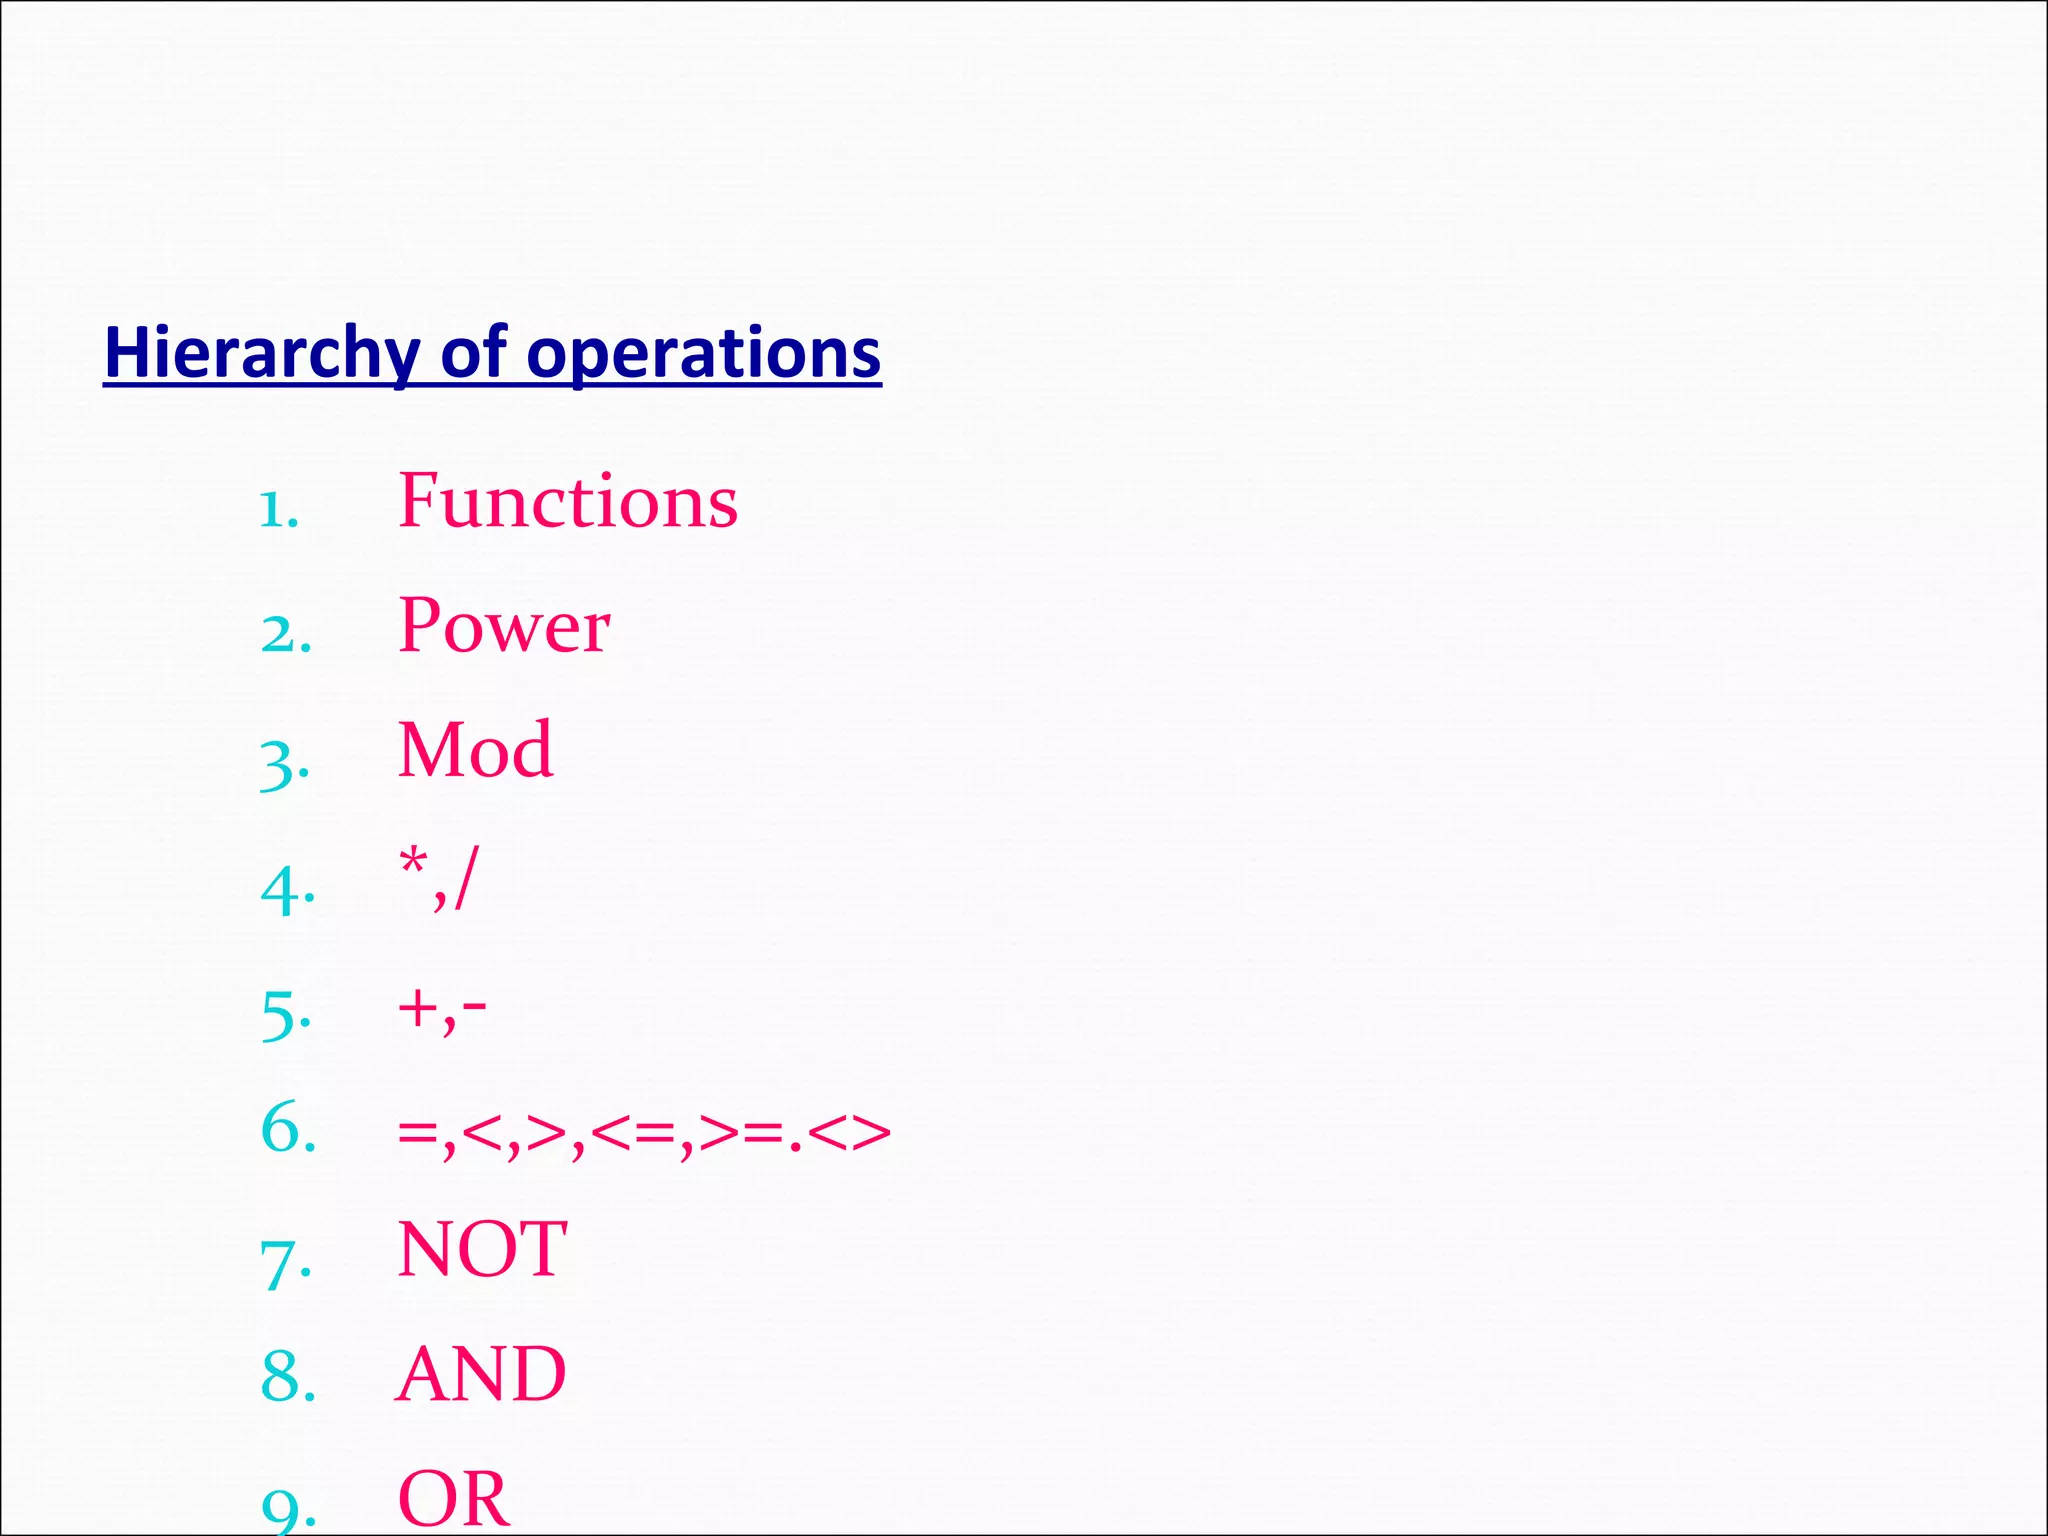
Problem solving conceptsfor computers Constants Variables Operators Hierarchy of operations Data types Equations Functions Expressions
16.
Constant: A variablewhose value is determined when a program description is written and doesn’t change from that value during program execution. A constant is a value in a program, that stays the same throughout the program's execution-numeric, alphabetical, special symbols. Ex:PI=3.142857 Rules: Constant cannot be changed after it is initially given a value
17.
Variable: a namedlocation in memory for storing data. Variables are values that can change as much as needed during the execution of a program. Ex:city=“chennai”
18.
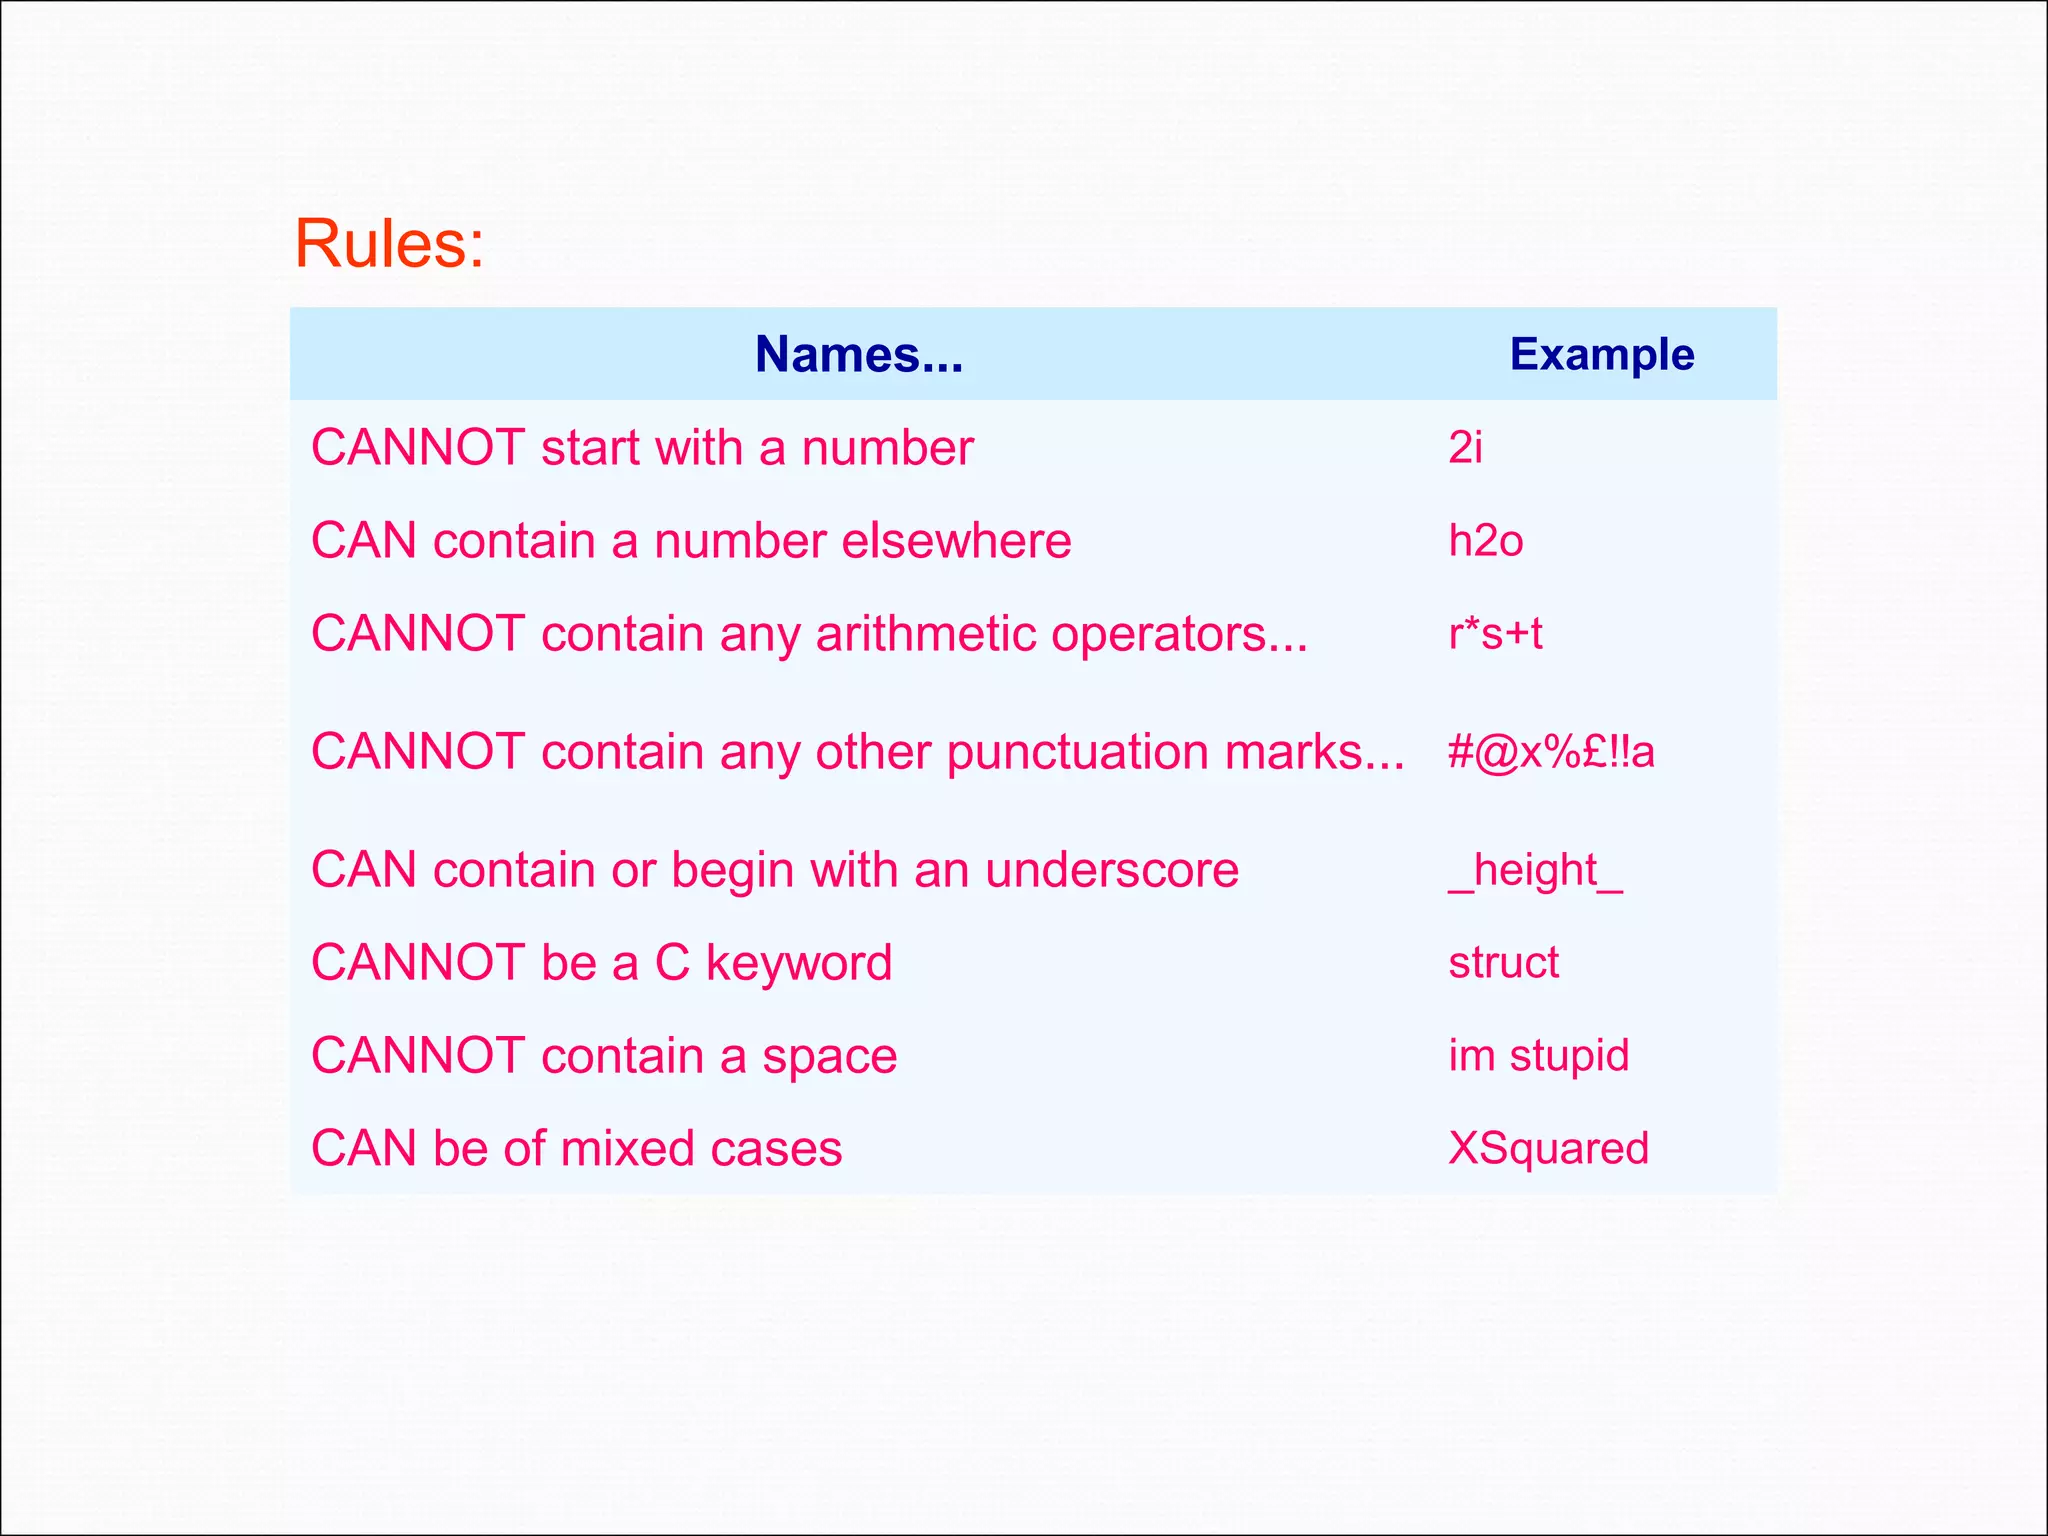
Names... Example CANNOT startwith a number 2i CAN contain a number elsewhere h2o CANNOT contain any arithmetic operators... r*s+t CANNOT contain any other punctuation marks... #@x%£!!a CAN contain or begin with an underscore _height_ CANNOT be a C keyword struct CANNOT contain a space im stupid CAN be of mixed cases XSquared Rules:
19.
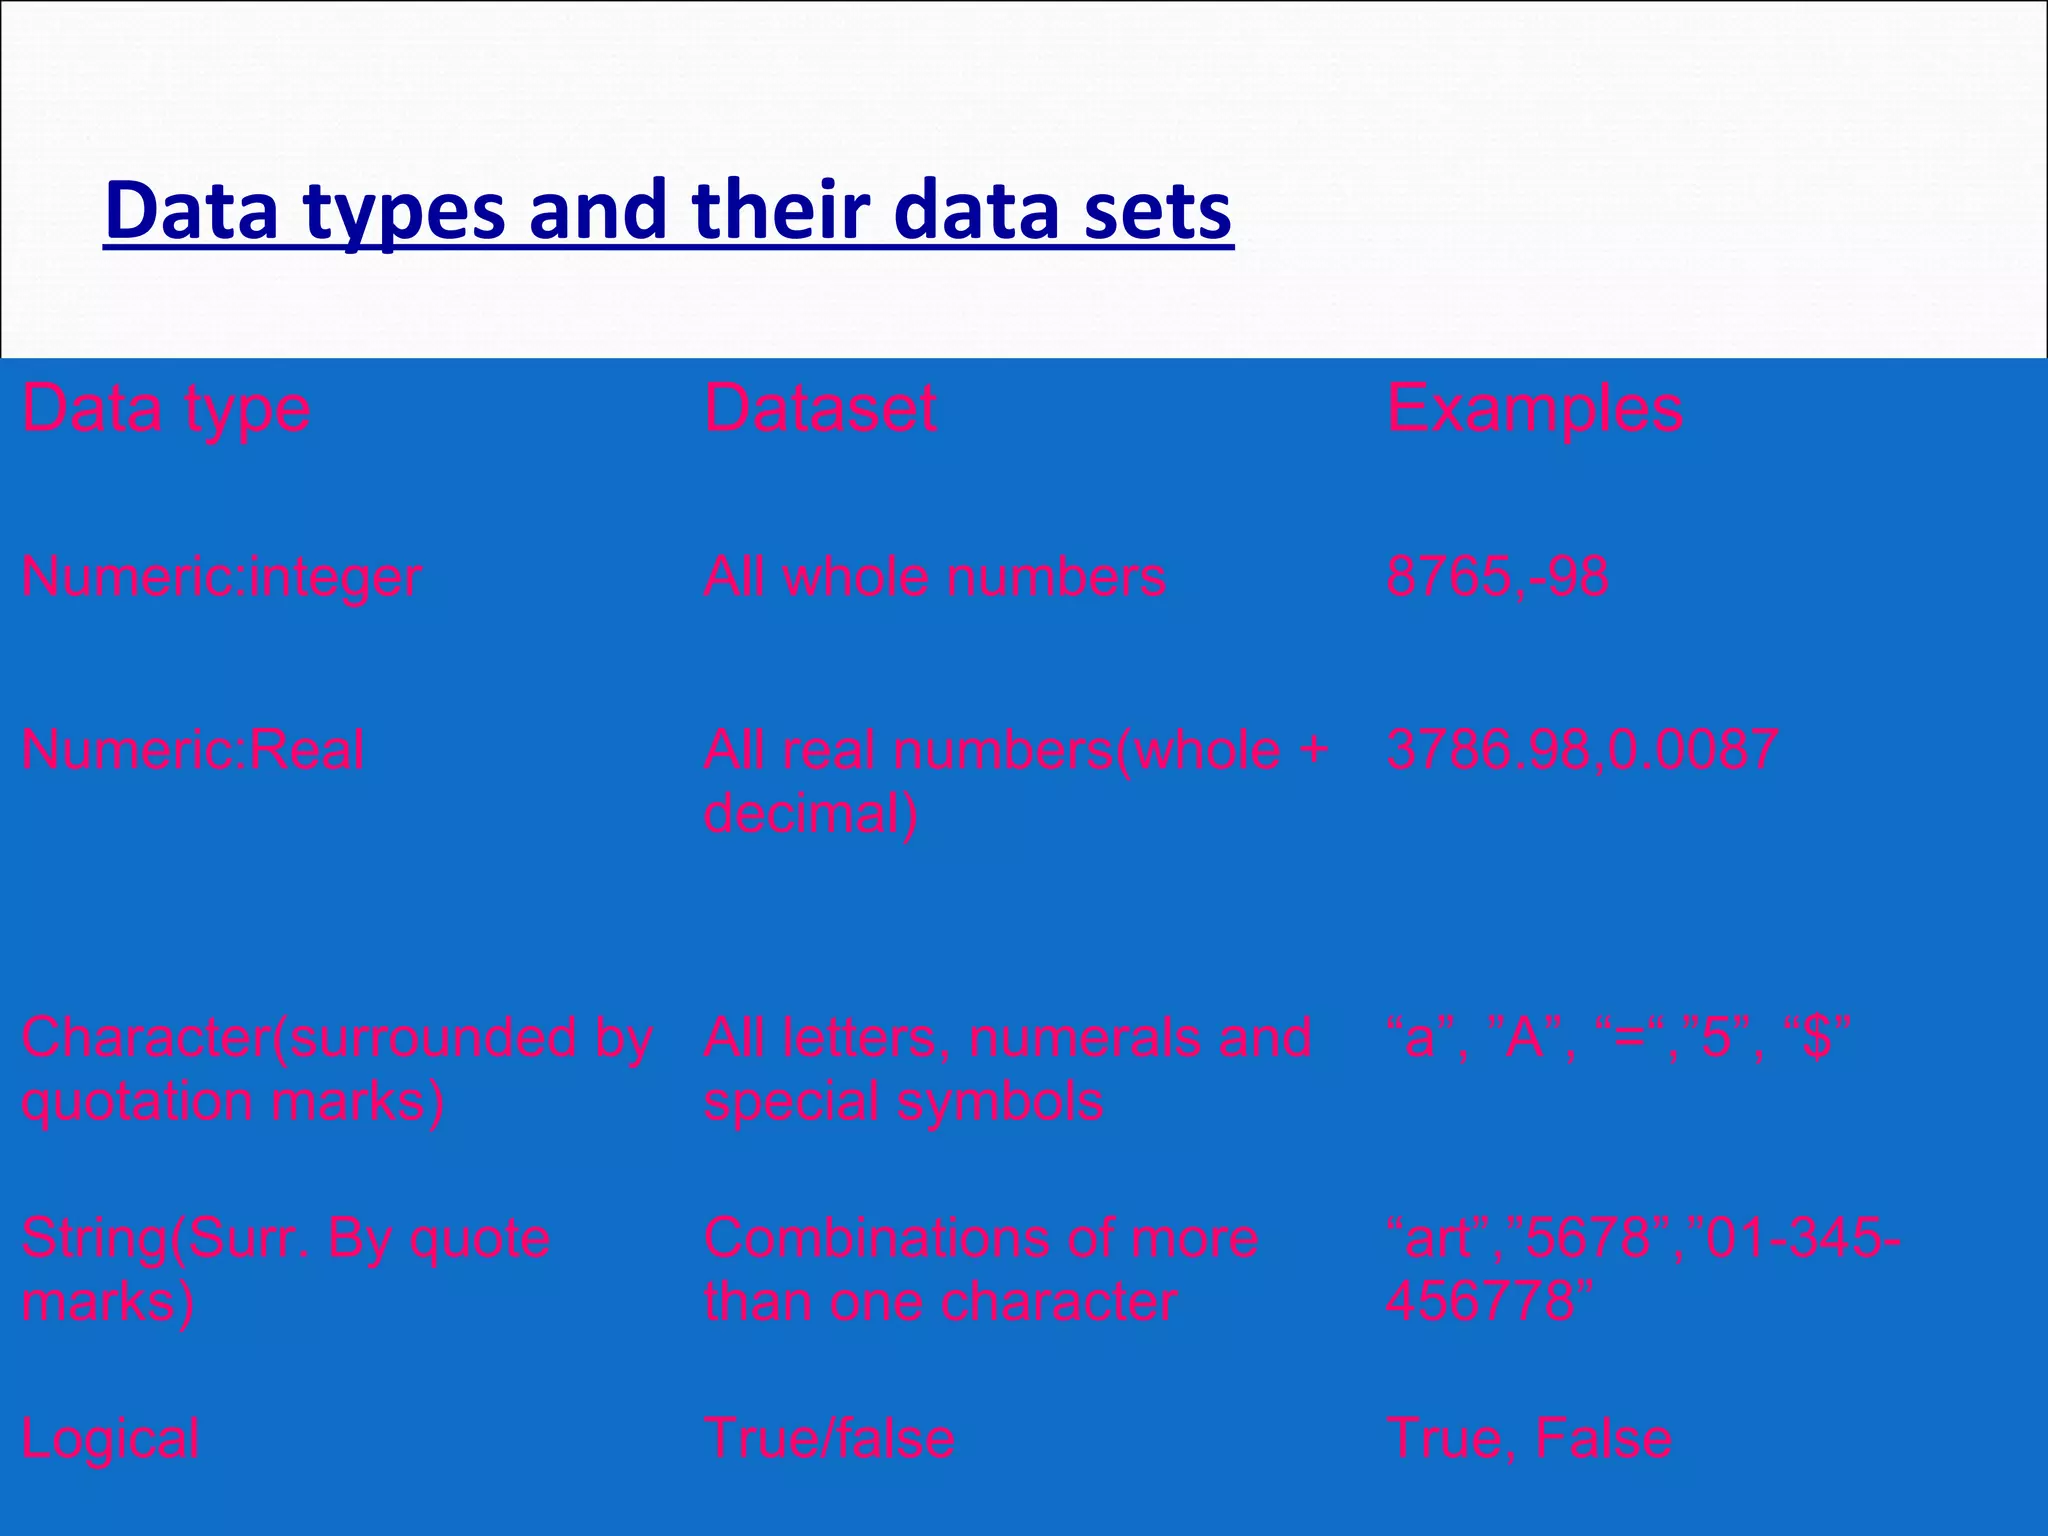
Data types andtheir data sets Data type Dataset Examples Numeric:integer All whole numbers 8765,-98 Numeric:Real All real numbers(whole + decimal) 3786.98,0.0087 Character(surrounded by quotation marks) All letters, numerals and special symbols “a”, ”A”, “=“,”5”, “$” String(Surr. By quote marks) Combinations of more than one character “art”,”5678”,”01-345- 456778” Logical True/false True, False
20.
Functions Small sets ofinstructions that perform specific tasks and return values Specify the basic tasks that are used repeatedly in the problem-solving process thus reducing time and improve the readability of the solution. Function name(data) Data used by the function are called parameters Ex: sqrt(n),max(n1,n2,n3)
21.
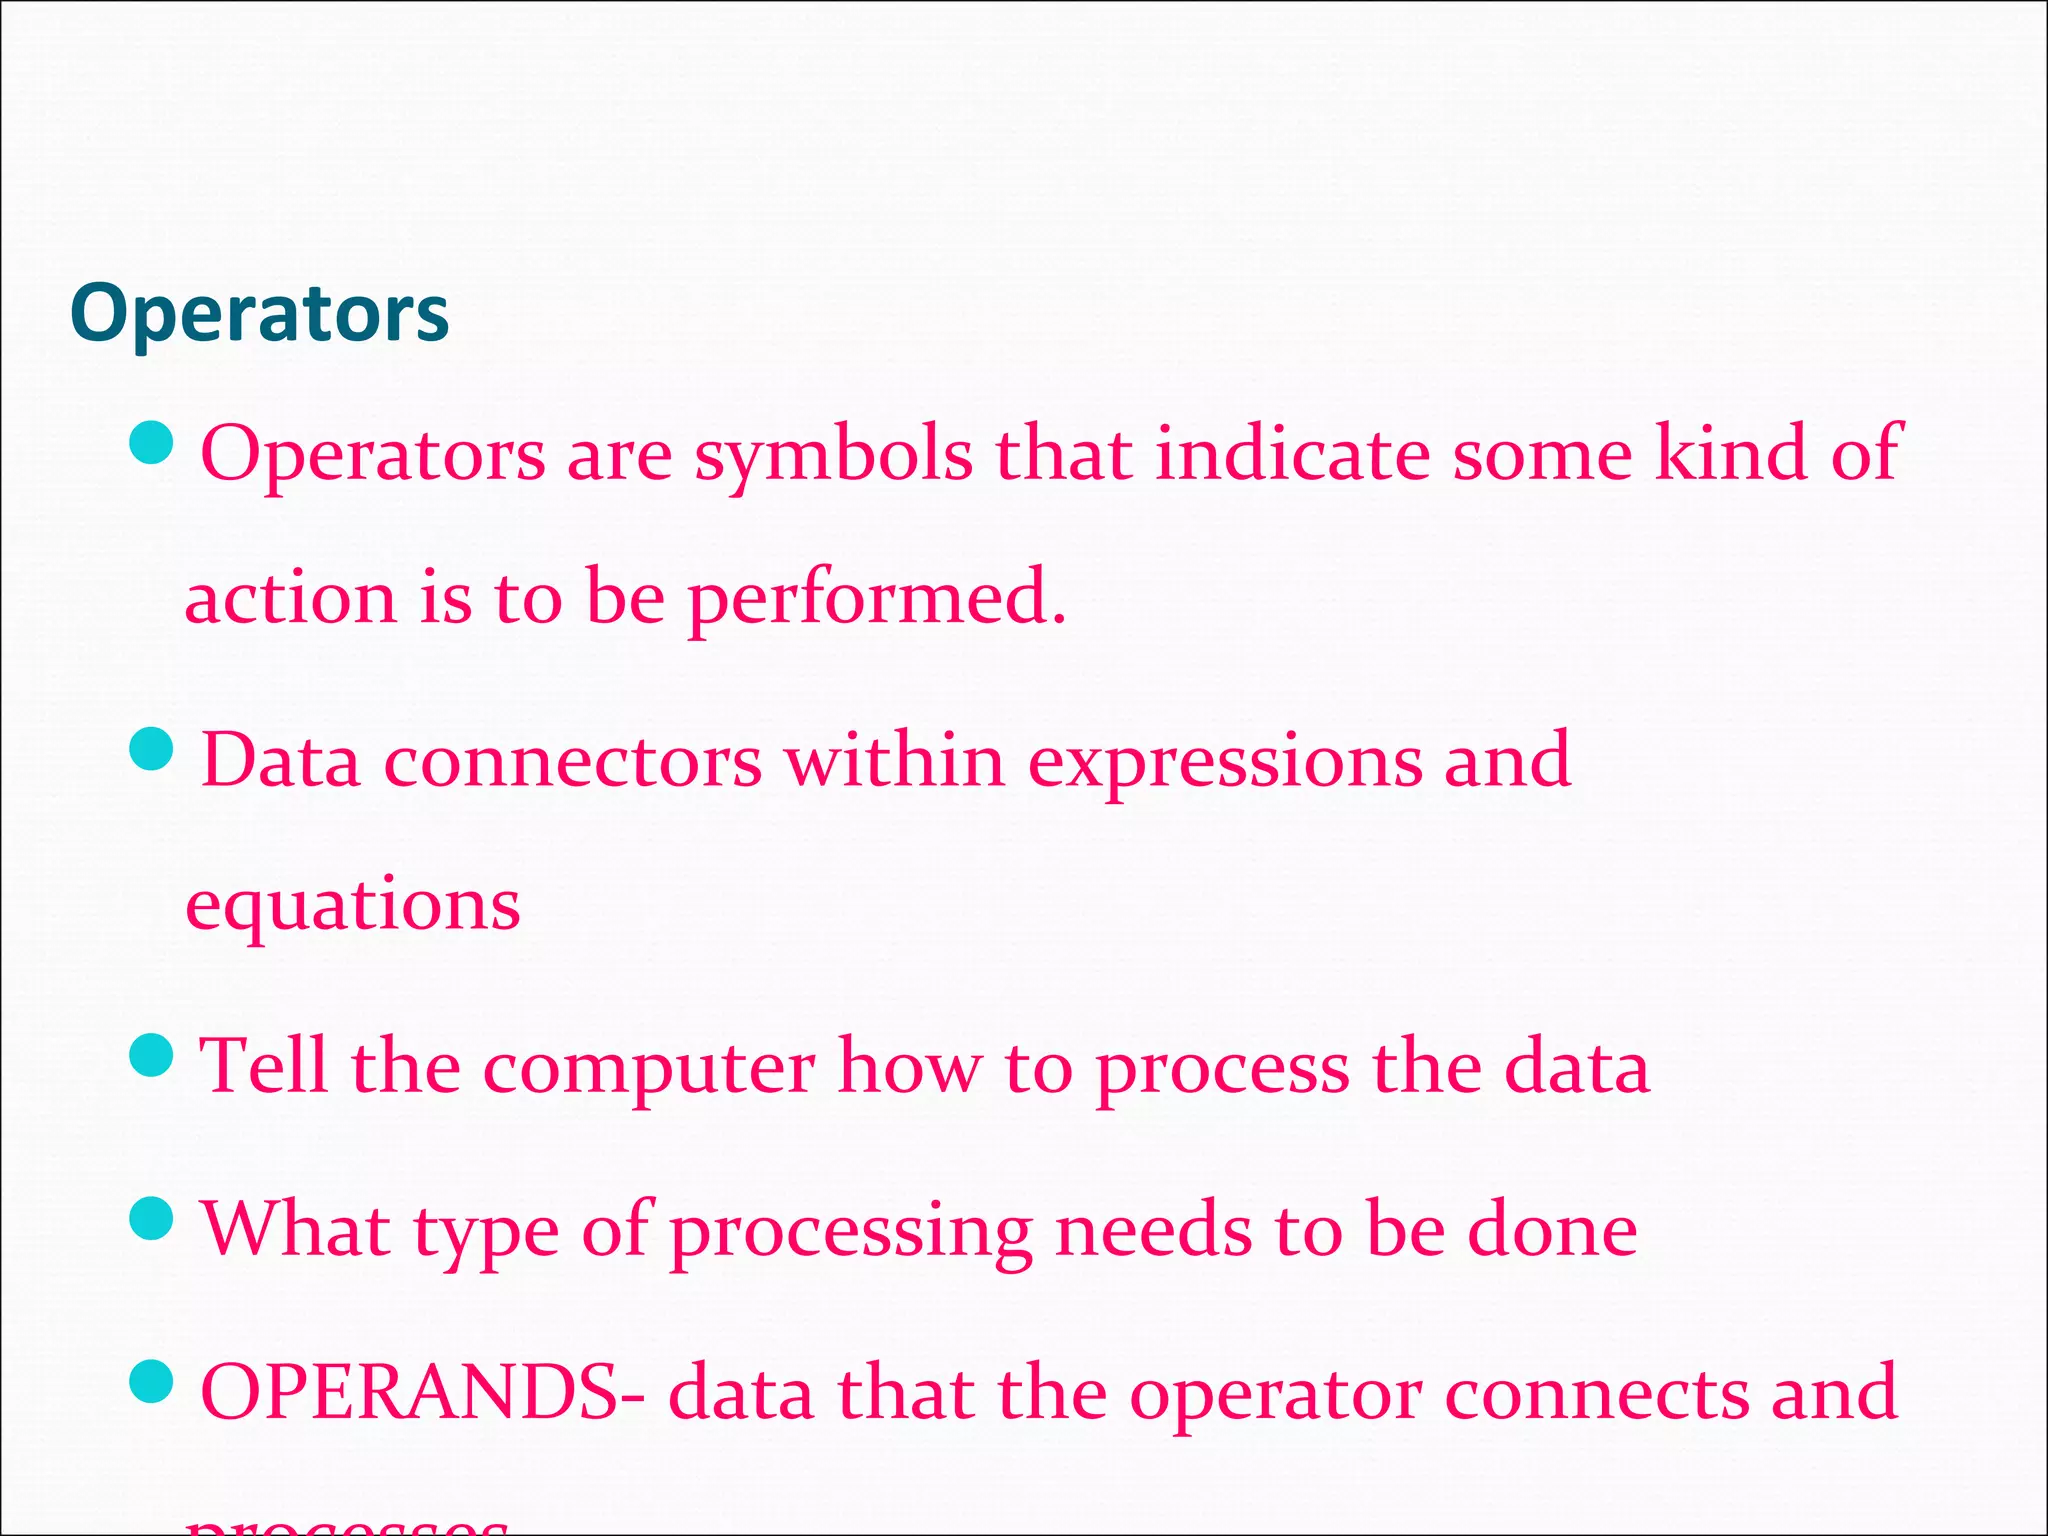
Operators Operators are symbolsthat indicate some kind of action is to be performed. Data connectors within expressions and equations Tell the computer how to process the data What type of processing needs to be done OPERANDS- data that the operator connects and
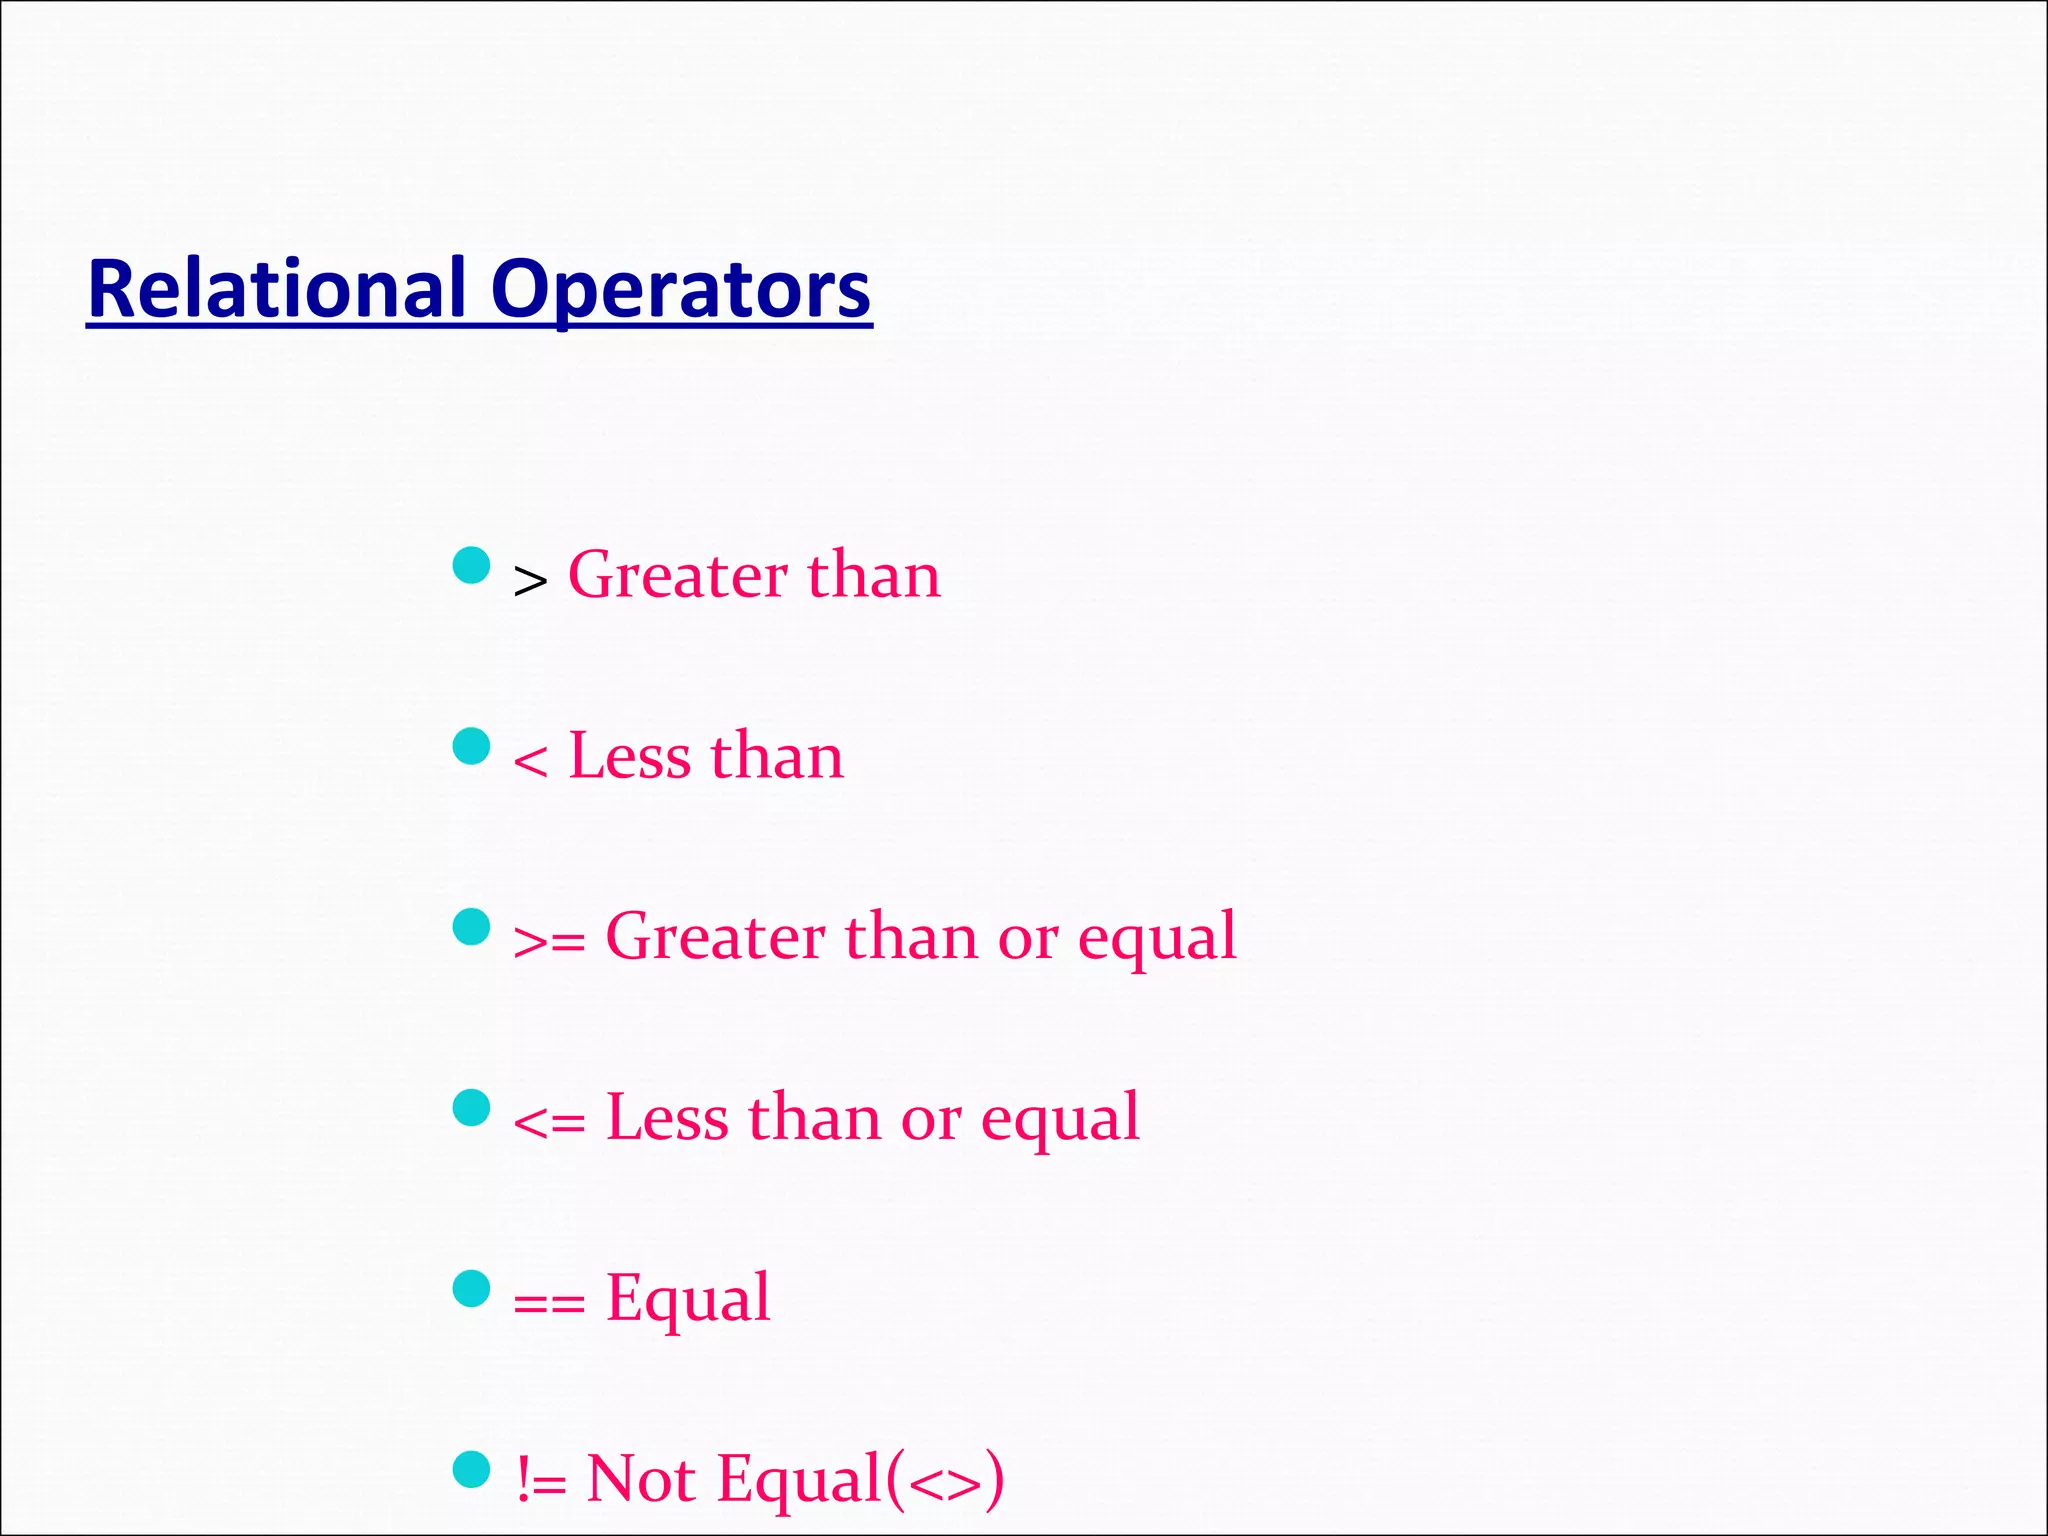
Relational Operators > Greaterthan < Less than >= Greater than or equal <= Less than or equal == Equal != Not Equal(<>)
24.
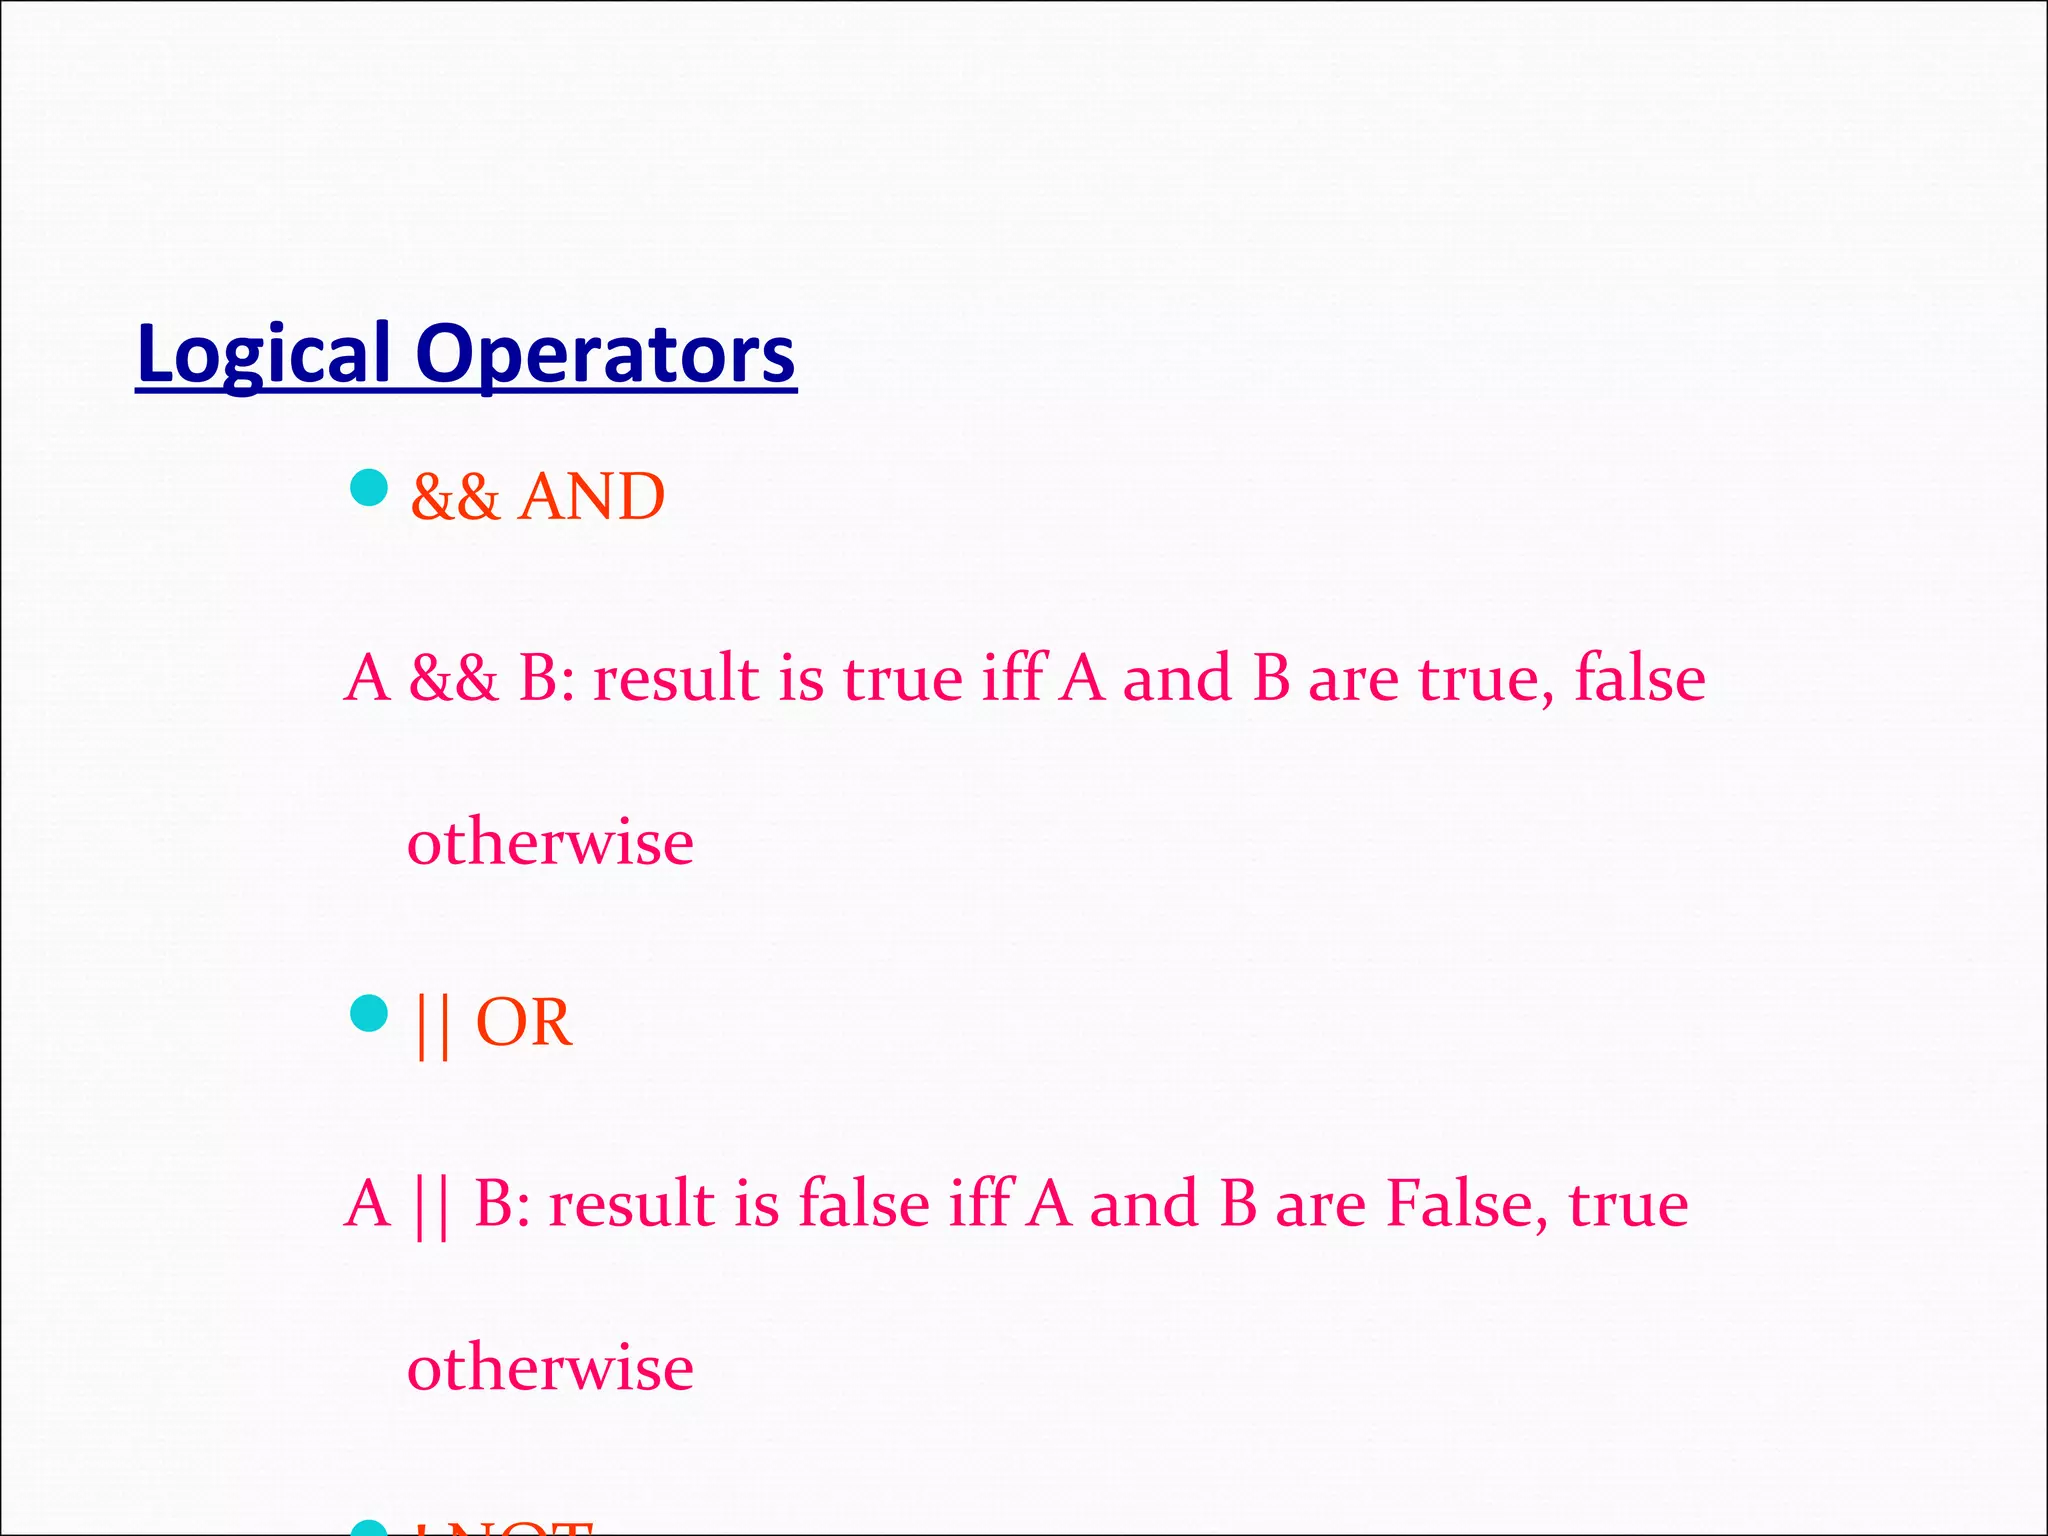
Logical Operators && AND A&& B: result is true iff A and B are true, false otherwise || OR A || B: result is false iff A and B are False, true otherwise
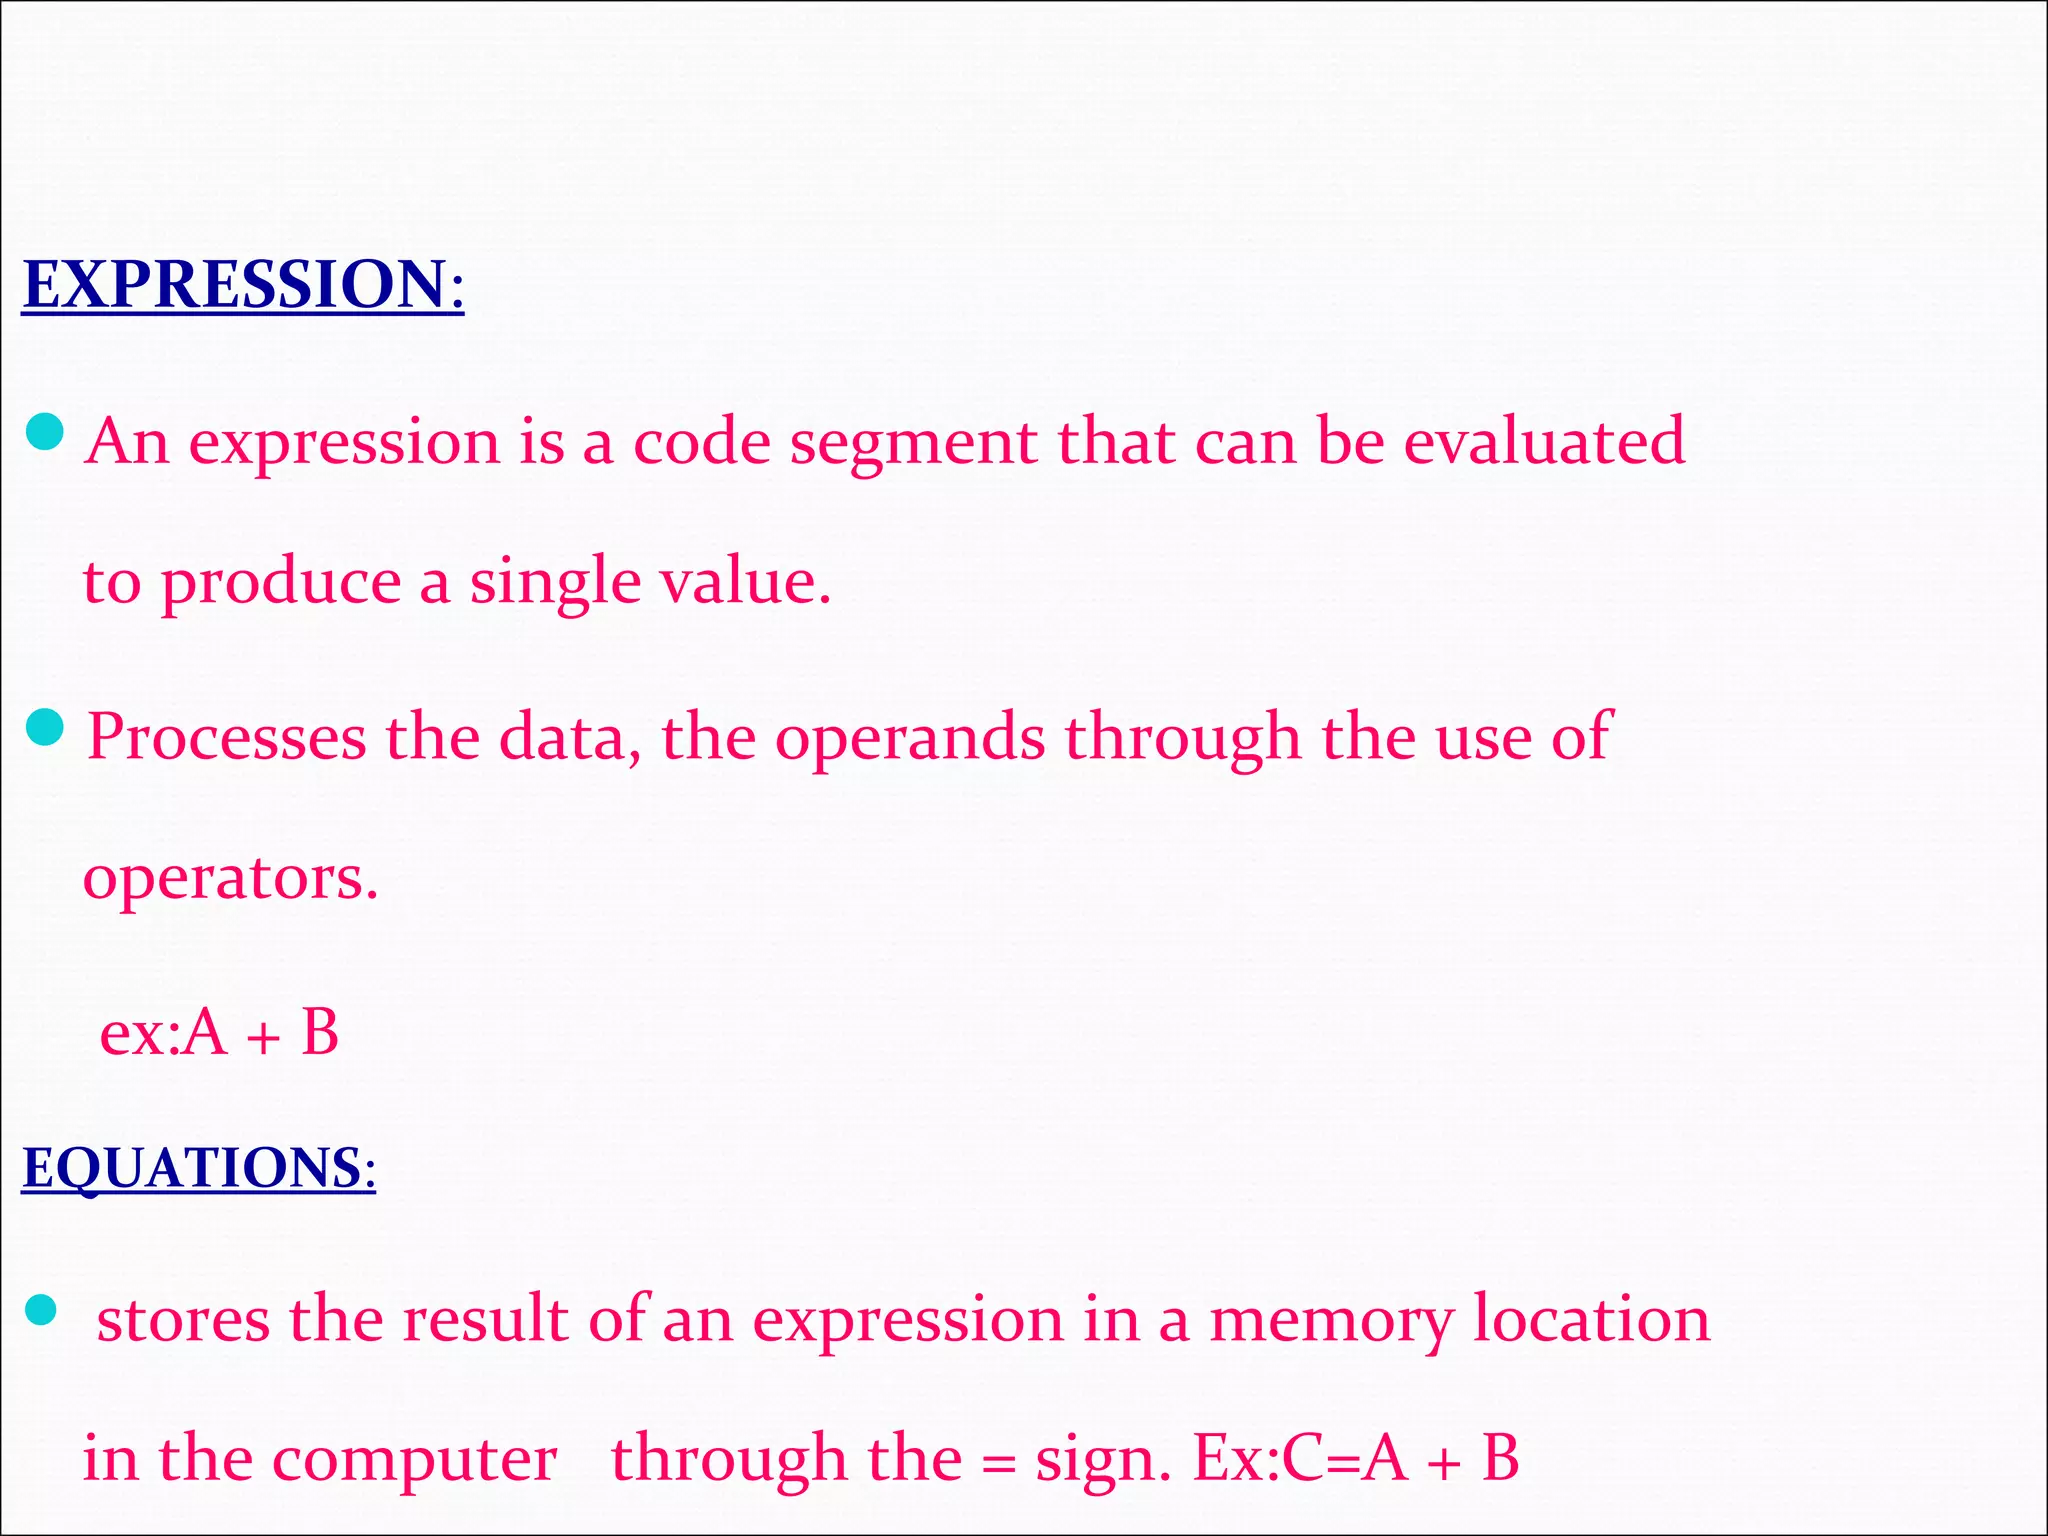
EXPRESSION: An expression isa code segment that can be evaluated to produce a single value. Processes the data, the operands through the use of operators. ex:A + B EQUATIONS: stores the result of an expression in a memory location in the computer through the = sign. Ex:C=A + B
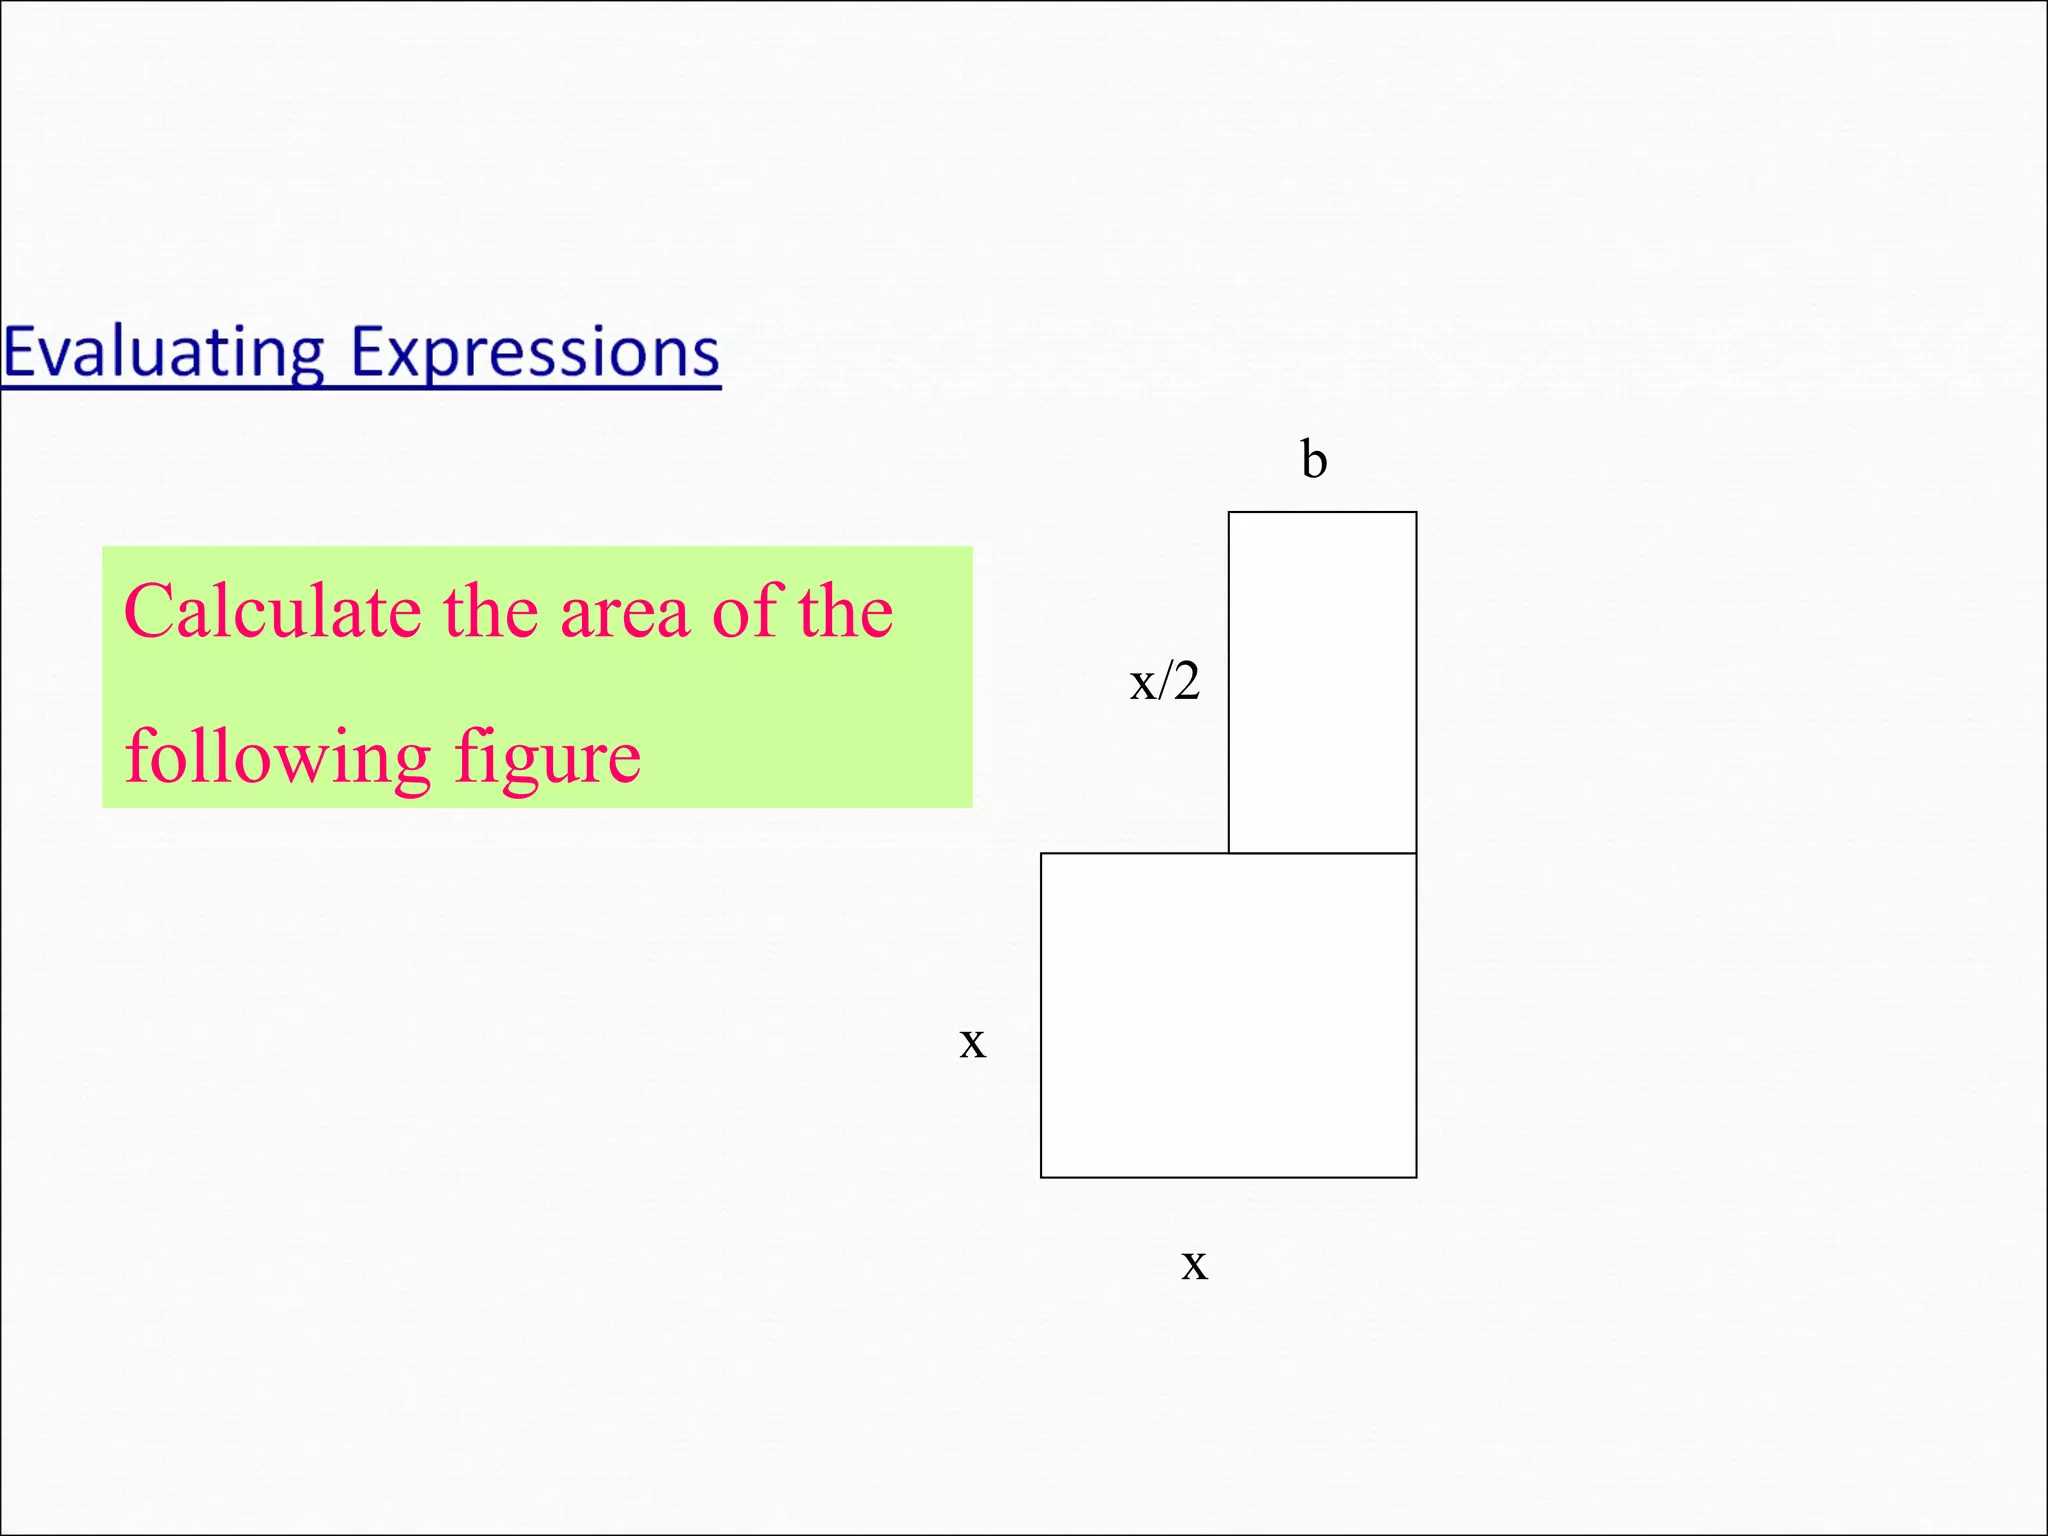
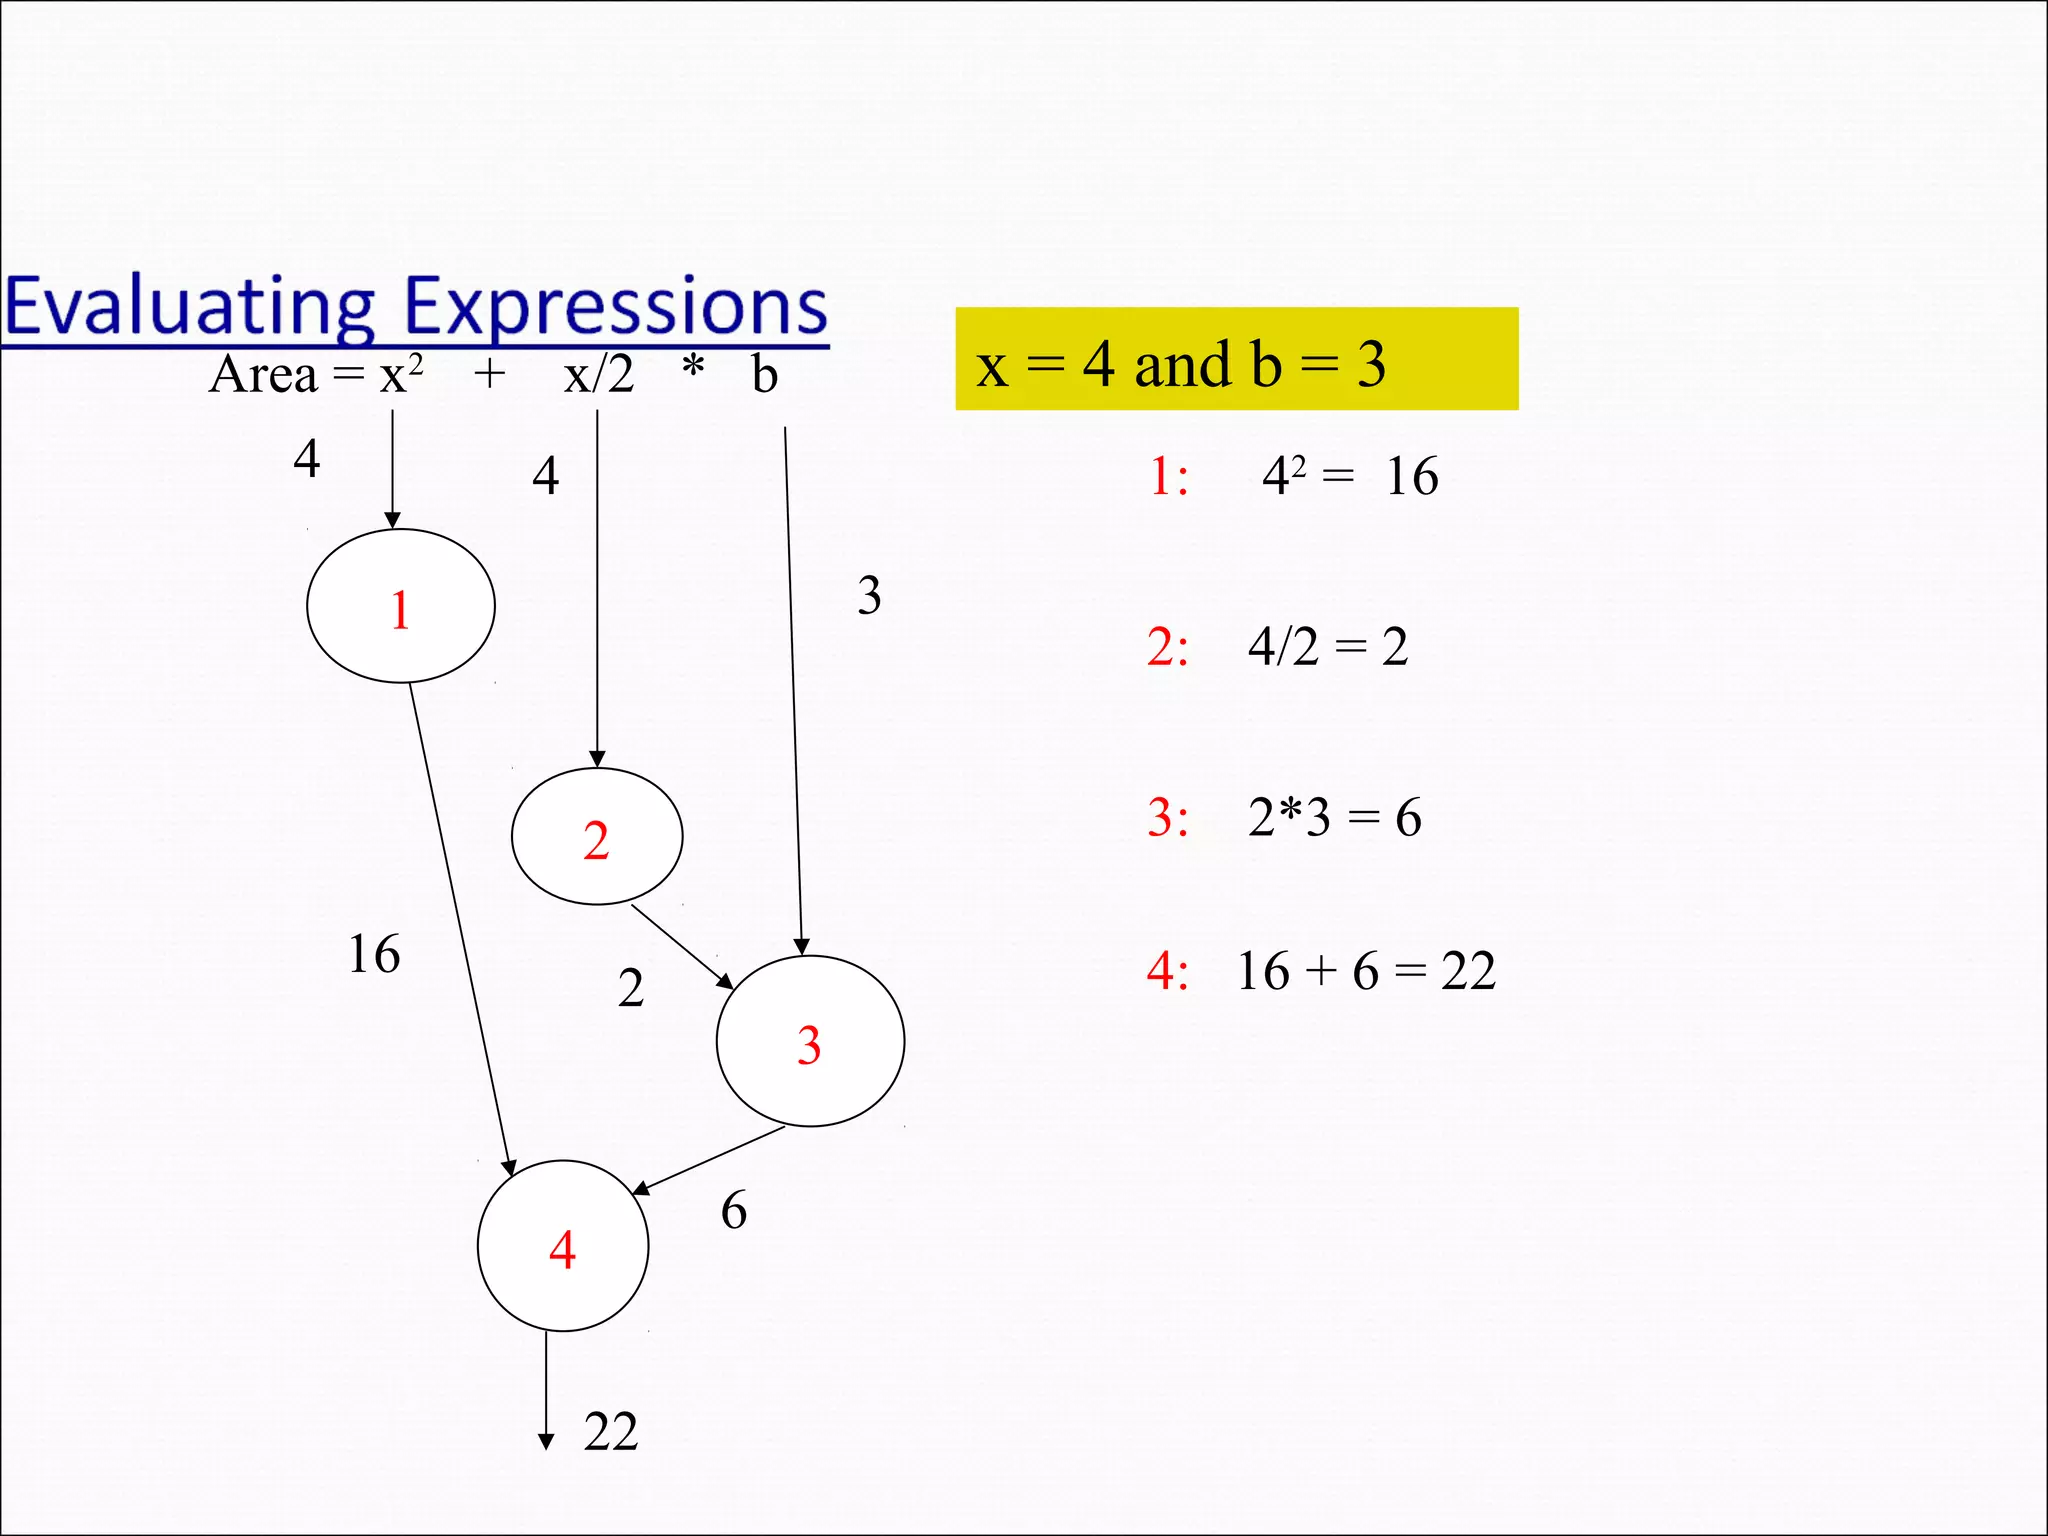
Area = x2 +x/2 * b 1 2 3 4 4 1: 42 = 16 16 4 3 2 2: 4/2 = 2 3: 2*3 = 6 4: 16 + 6 = 22 6 22 x = 4 and b = 3
29.
How computer storesdata Each variable name is given a memory location which can hold one and only one value at a time. Internal memory is volatile The data, information and programs are stored in external medium as FILES –program files and data files.
30.
Communicating with computer Whatis a program? A set of step-by-step instructions that directs the computer to perform tasks and produce results. What is a Programming Language? A programming language is a set of rules that instructs a computer what operations to perform.
31.
Syntax: Rules governingthe computer oerating system, the language and the application BUG: It is an error Debugging: The process of locating and correcting an error.
32.
Organising Problems Certain organisationaltools can help us to solve problems :- Problem Analysis Charts – a beginning analysis of the problem Structure/Interactivity Charts – shows the overall layout or structure of the solution
33.
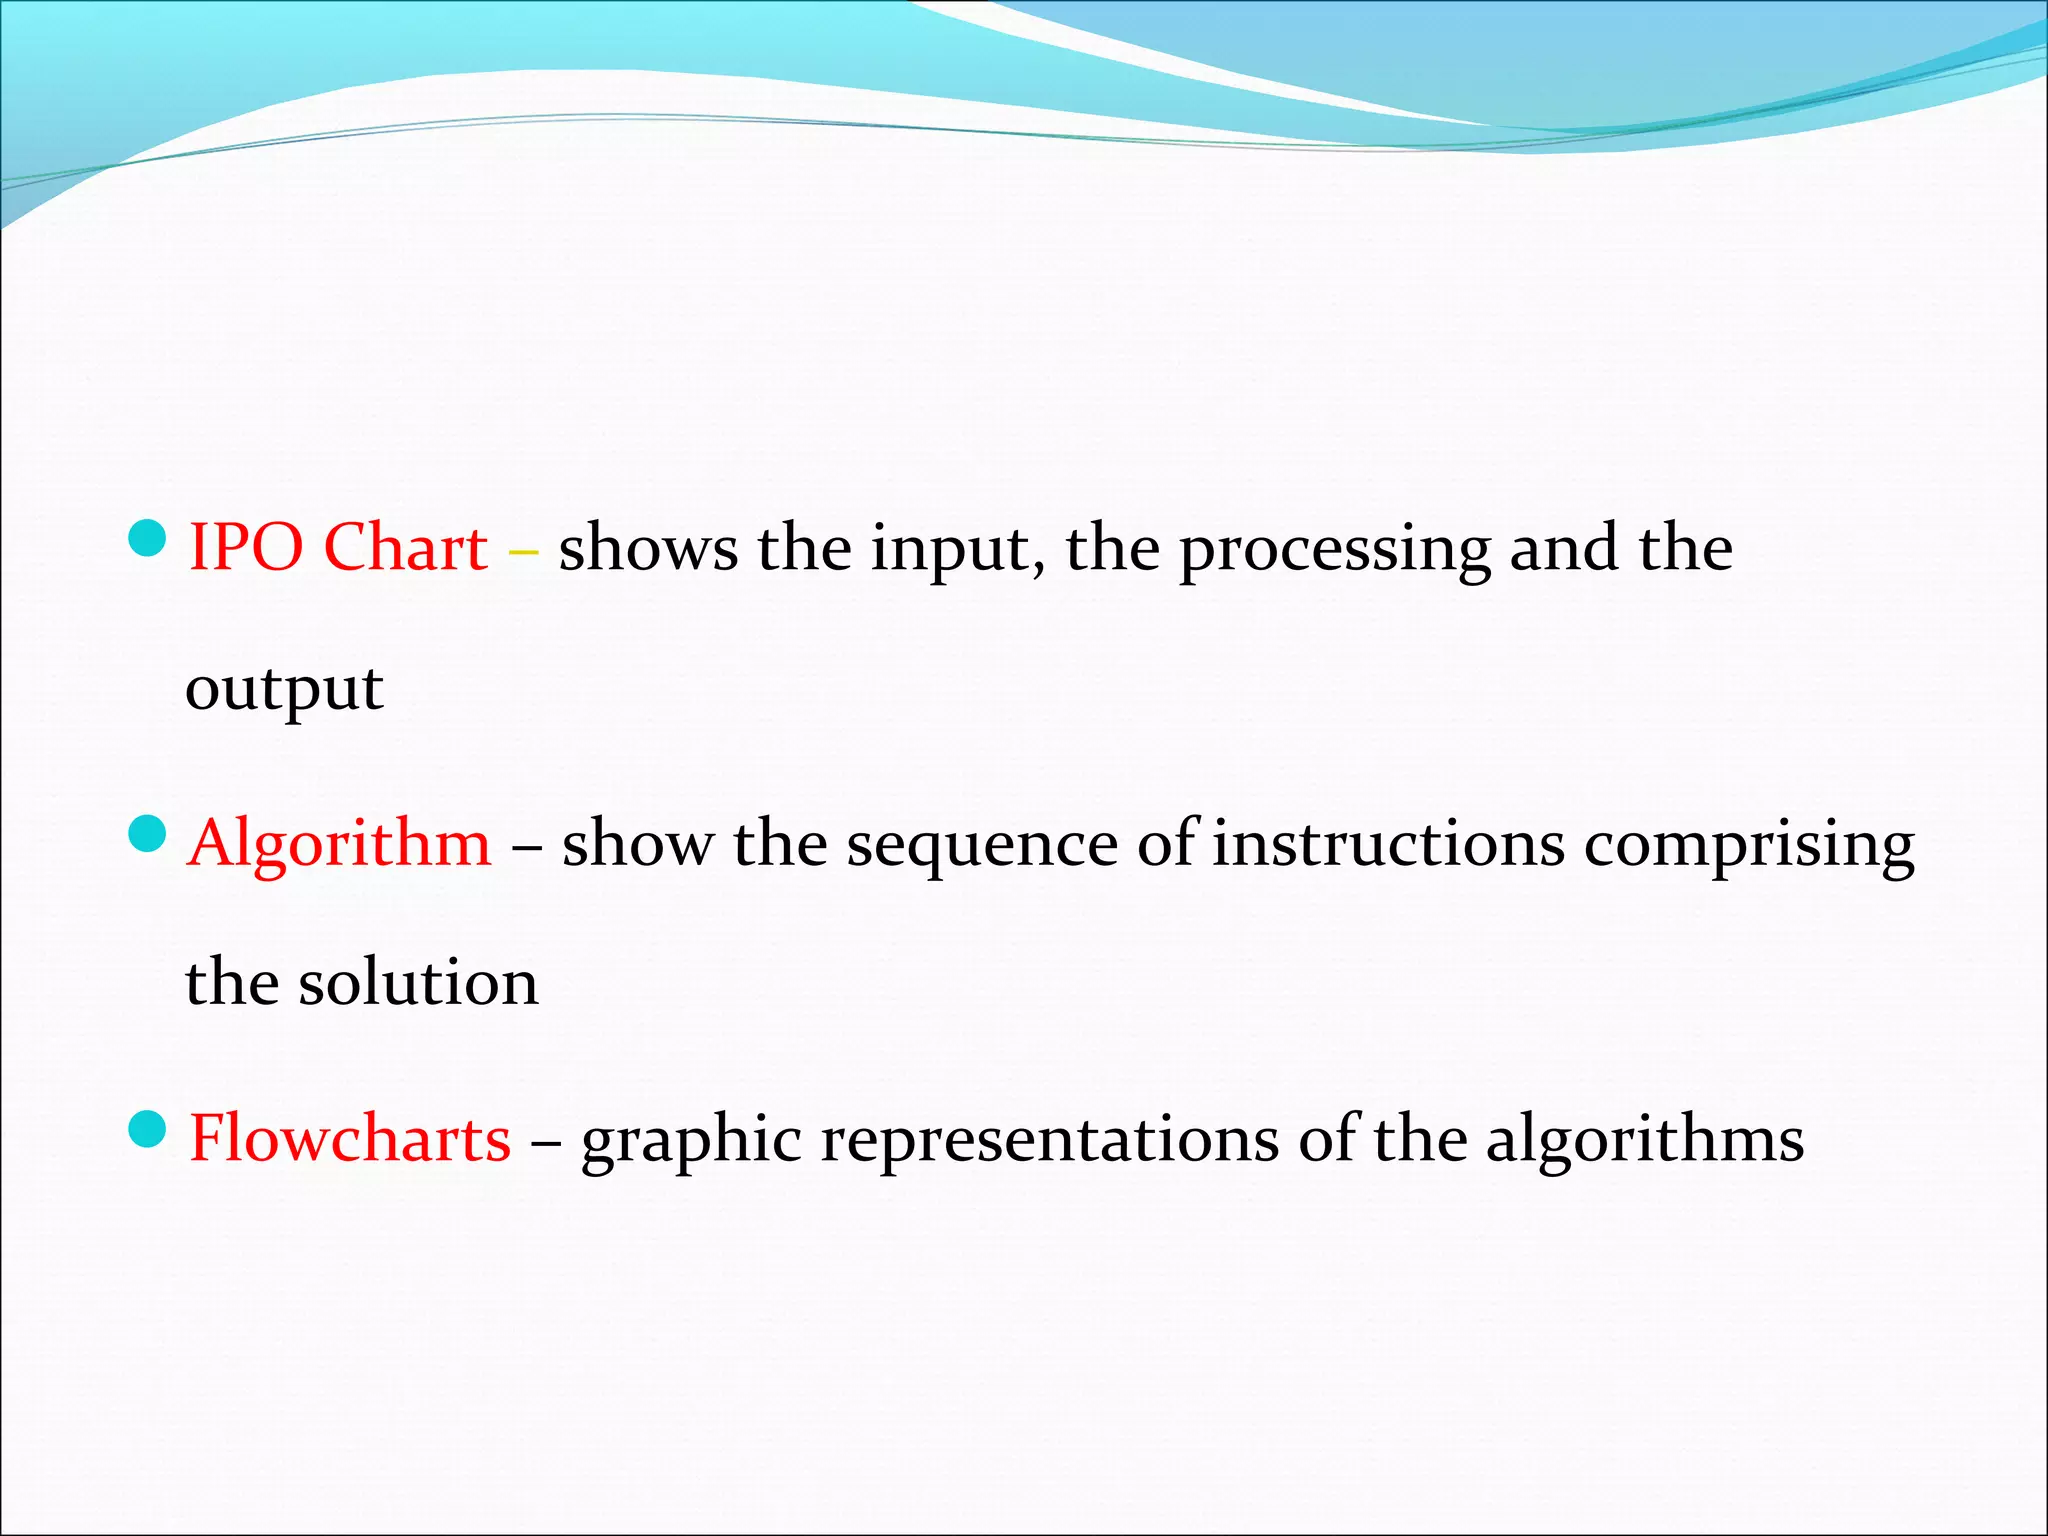
IPO Chart –shows the input, the processing and the output Algorithm – show the sequence of instructions comprising the solution Flowcharts – graphic representations of the algorithms
34.
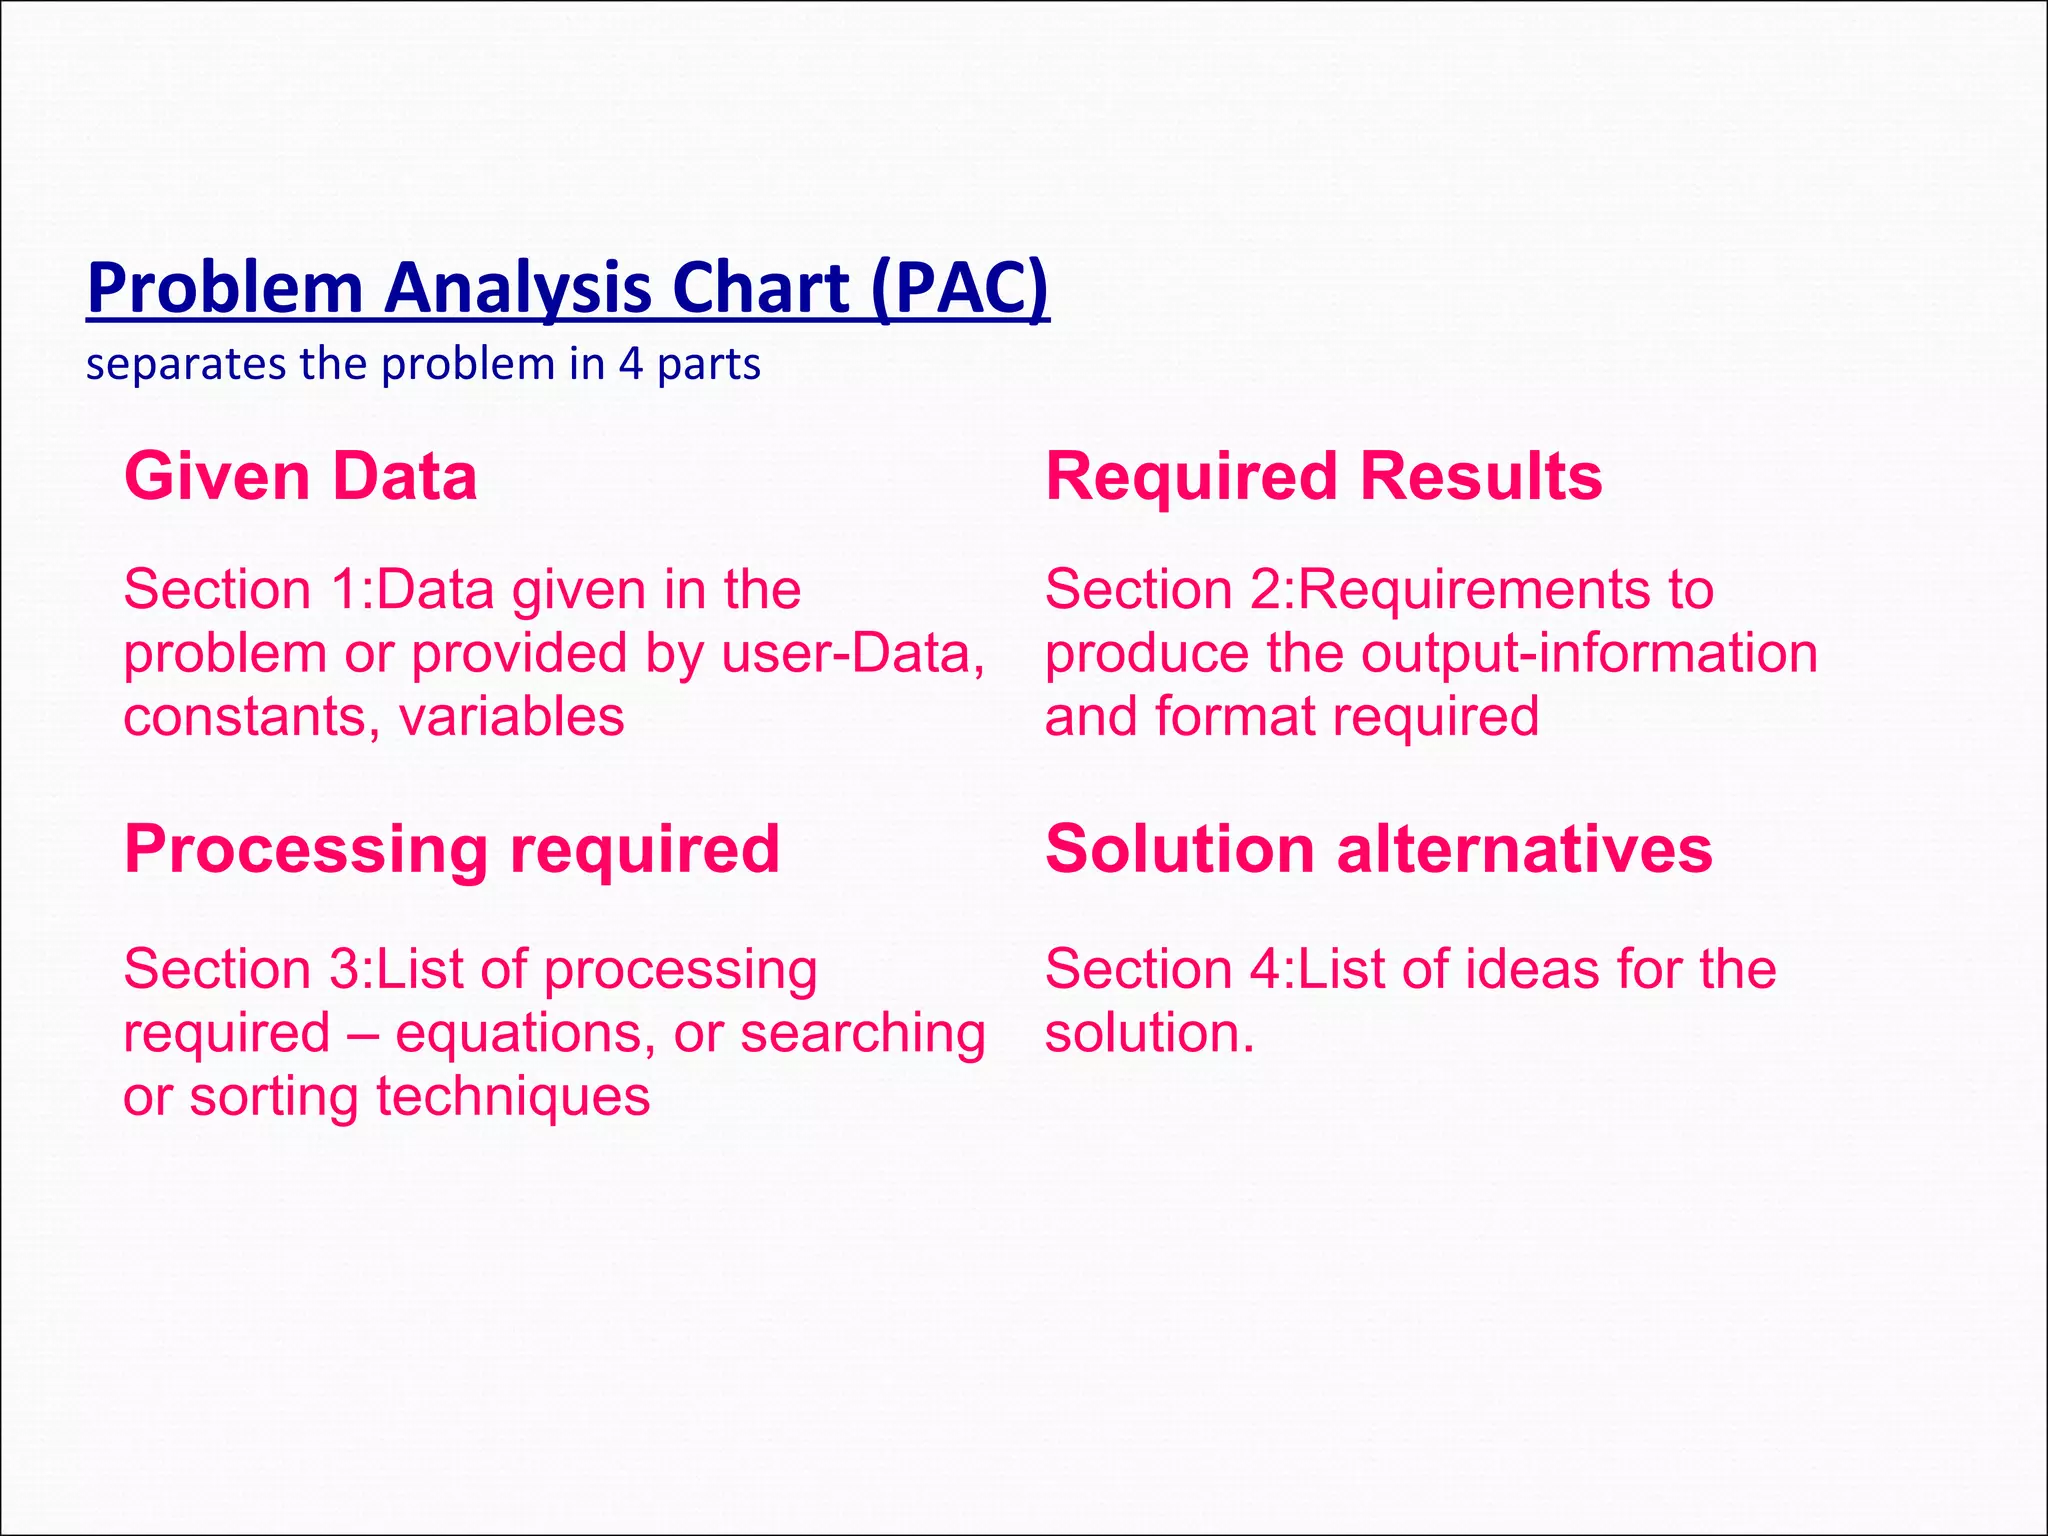
Problem Analysis Chart(PAC) separates the problem in 4 parts Given Data Required Results Section 1:Data given in the problem or provided by user-Data, constants, variables Section 2:Requirements to produce the output-information and format required Processing required Solution alternatives Section 3:List of processing required – equations, or searching or sorting techniques Section 4:List of ideas for the solution.
35.
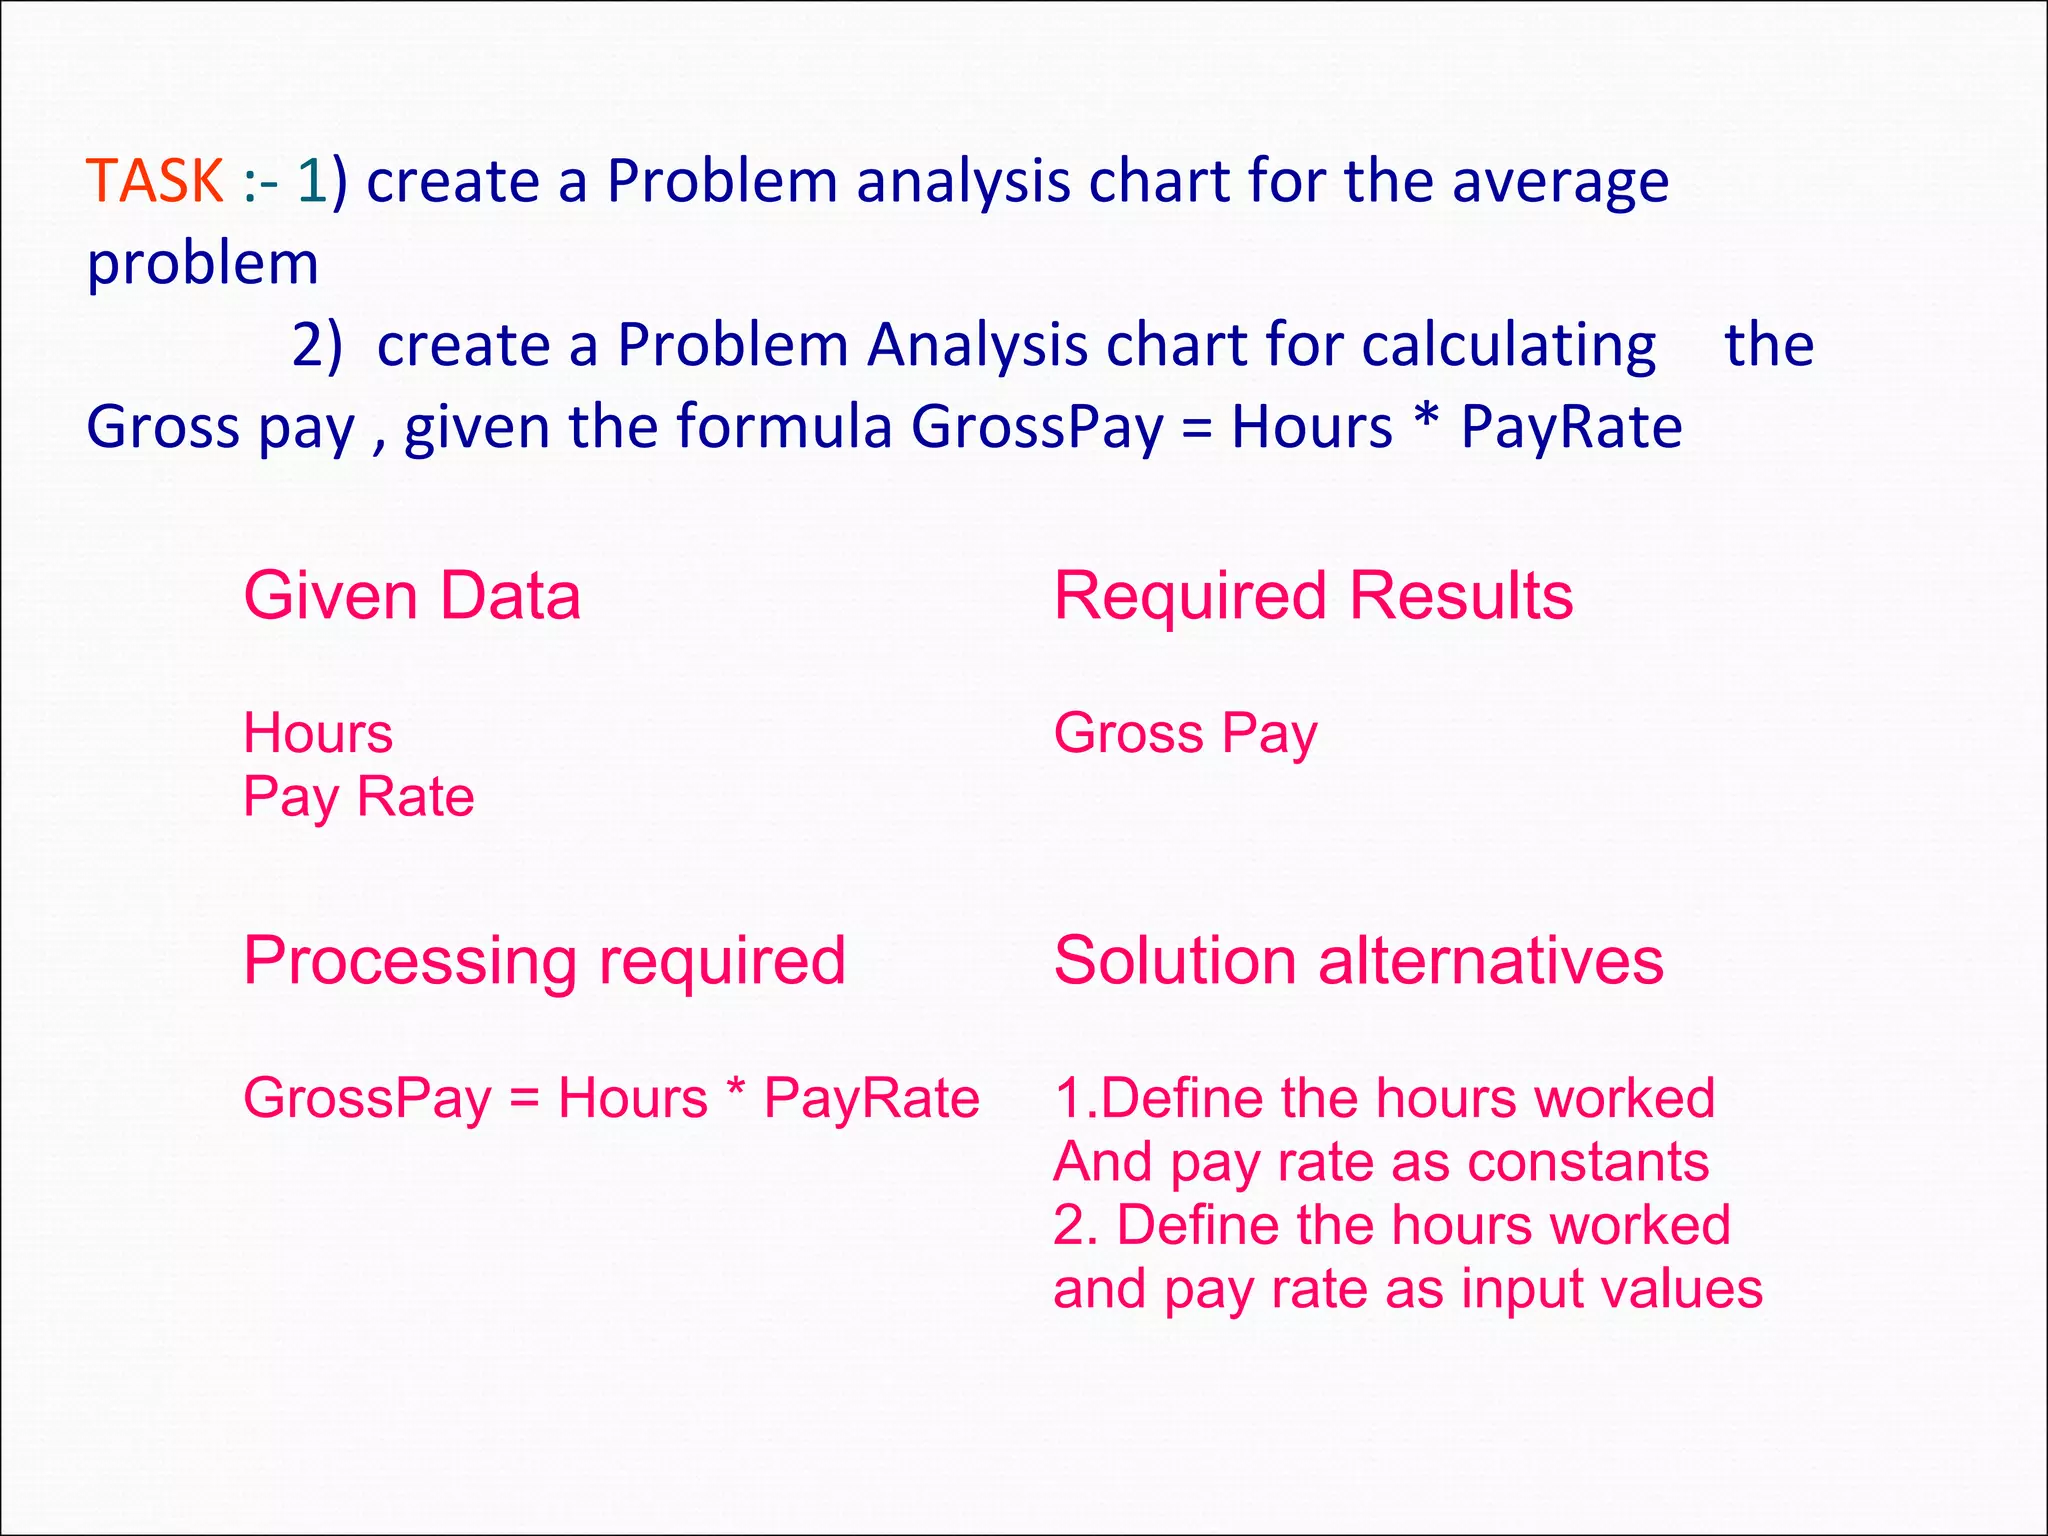
TASK :- 1)create a Problem analysis chart for the average problem 2) create a Problem Analysis chart for calculating the Gross pay , given the formula GrossPay = Hours * PayRate Given Data Required Results Hours Pay Rate Gross Pay Processing required Solution alternatives GrossPay = Hours * PayRate 1.Define the hours worked And pay rate as constants 2. Define the hours worked and pay rate as input values
36.
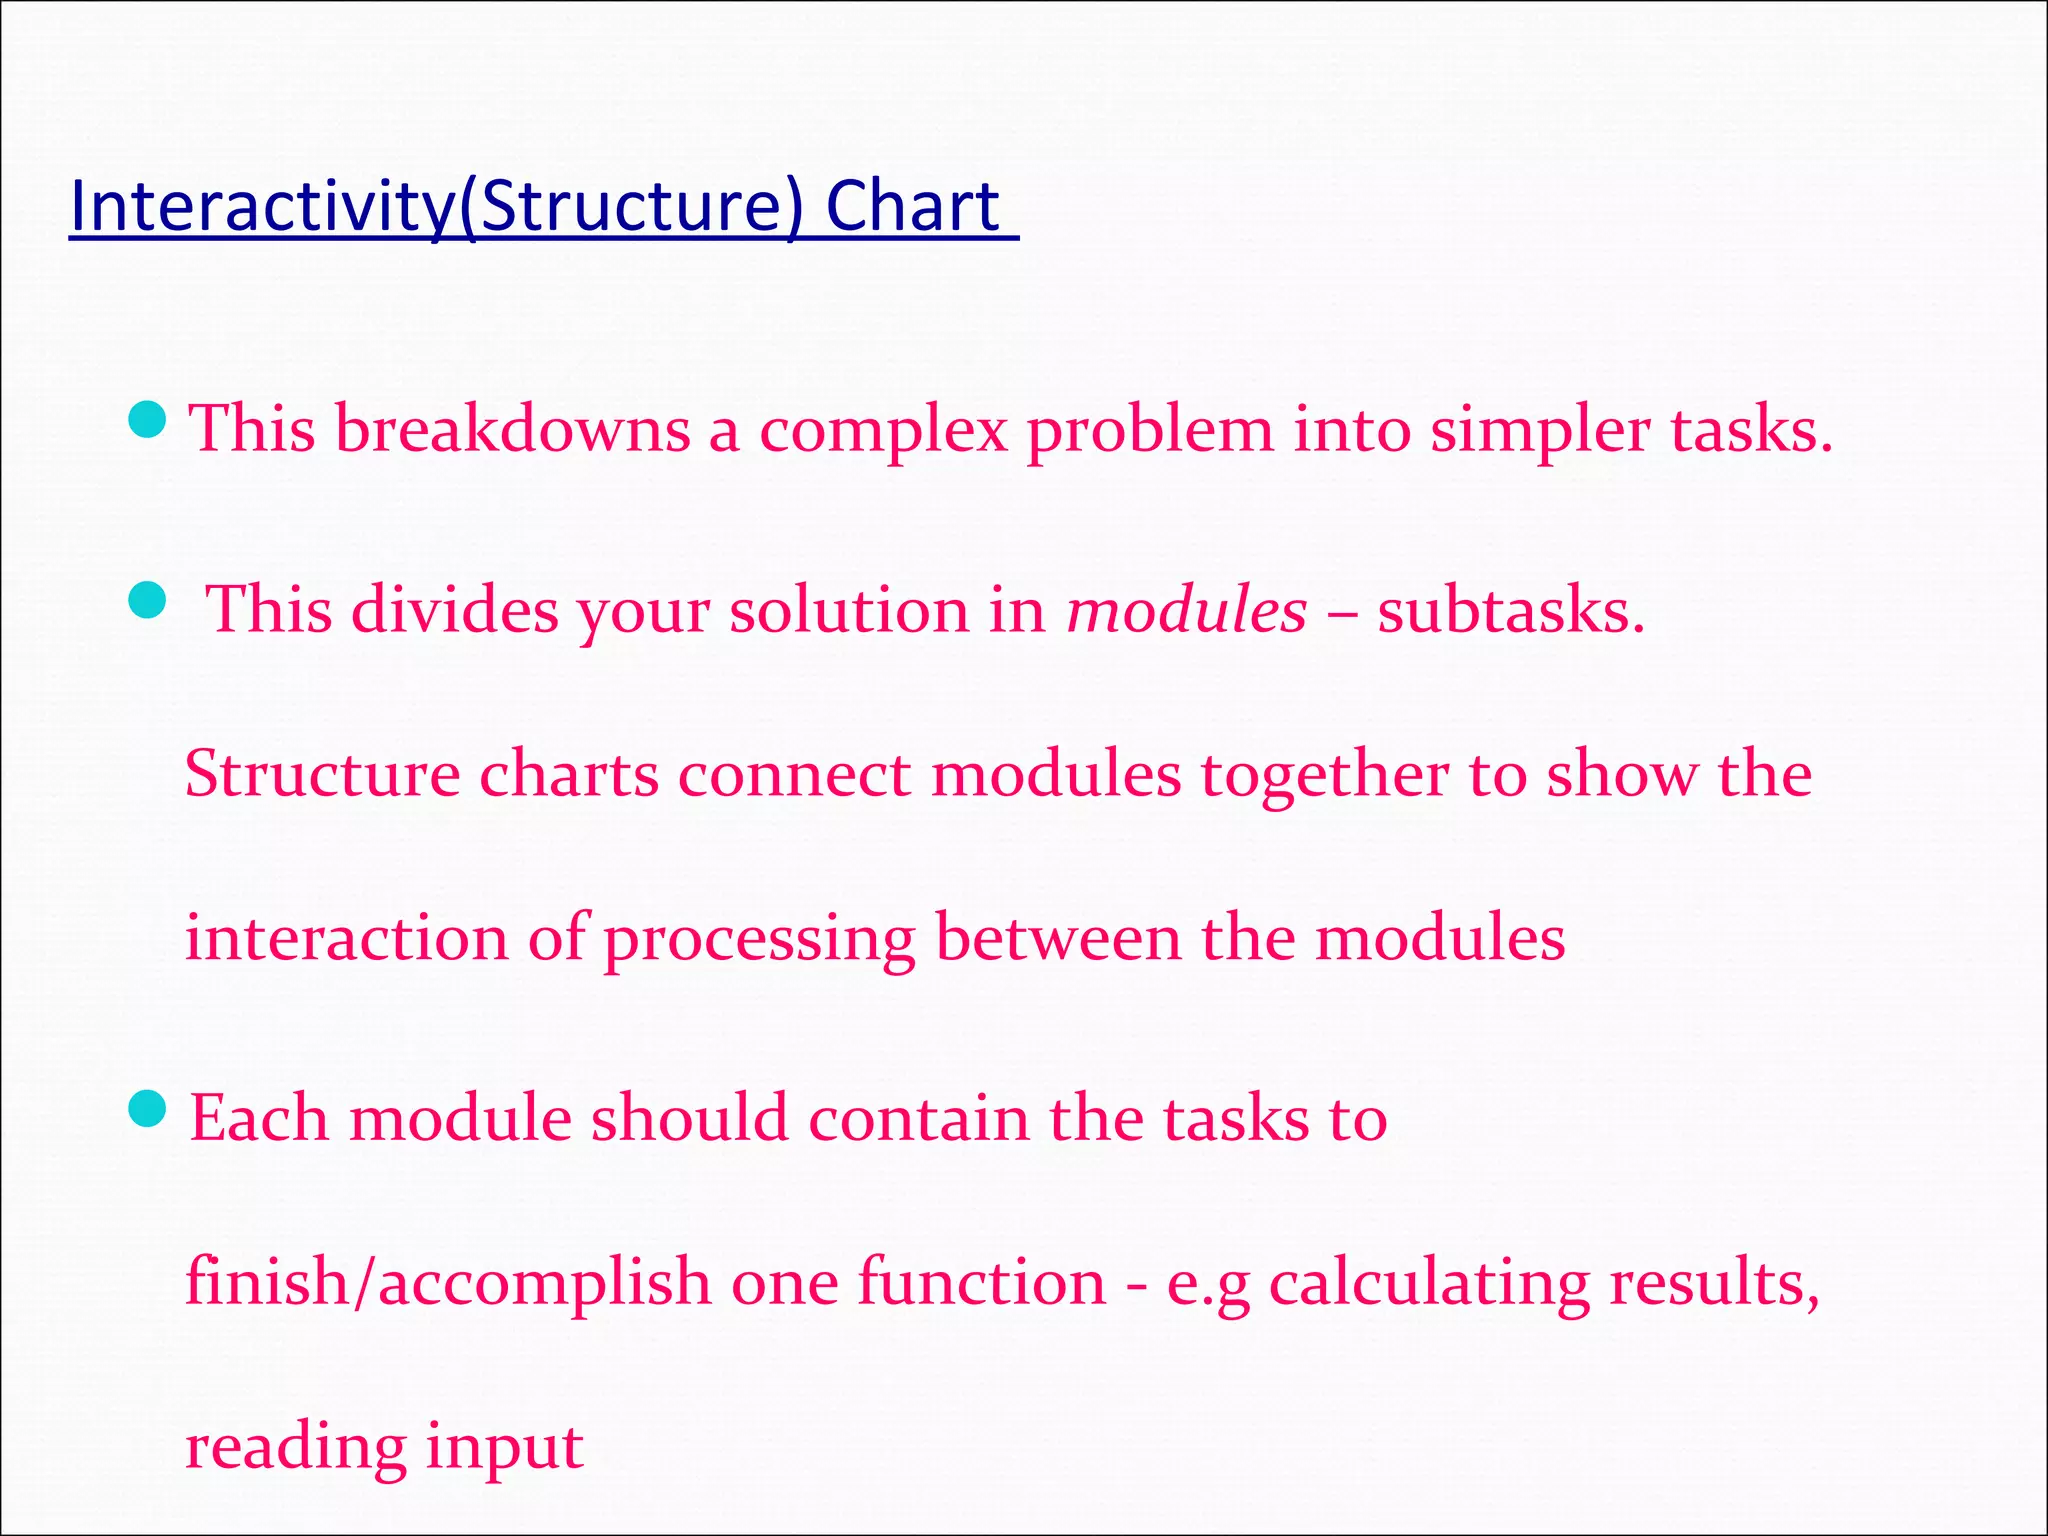
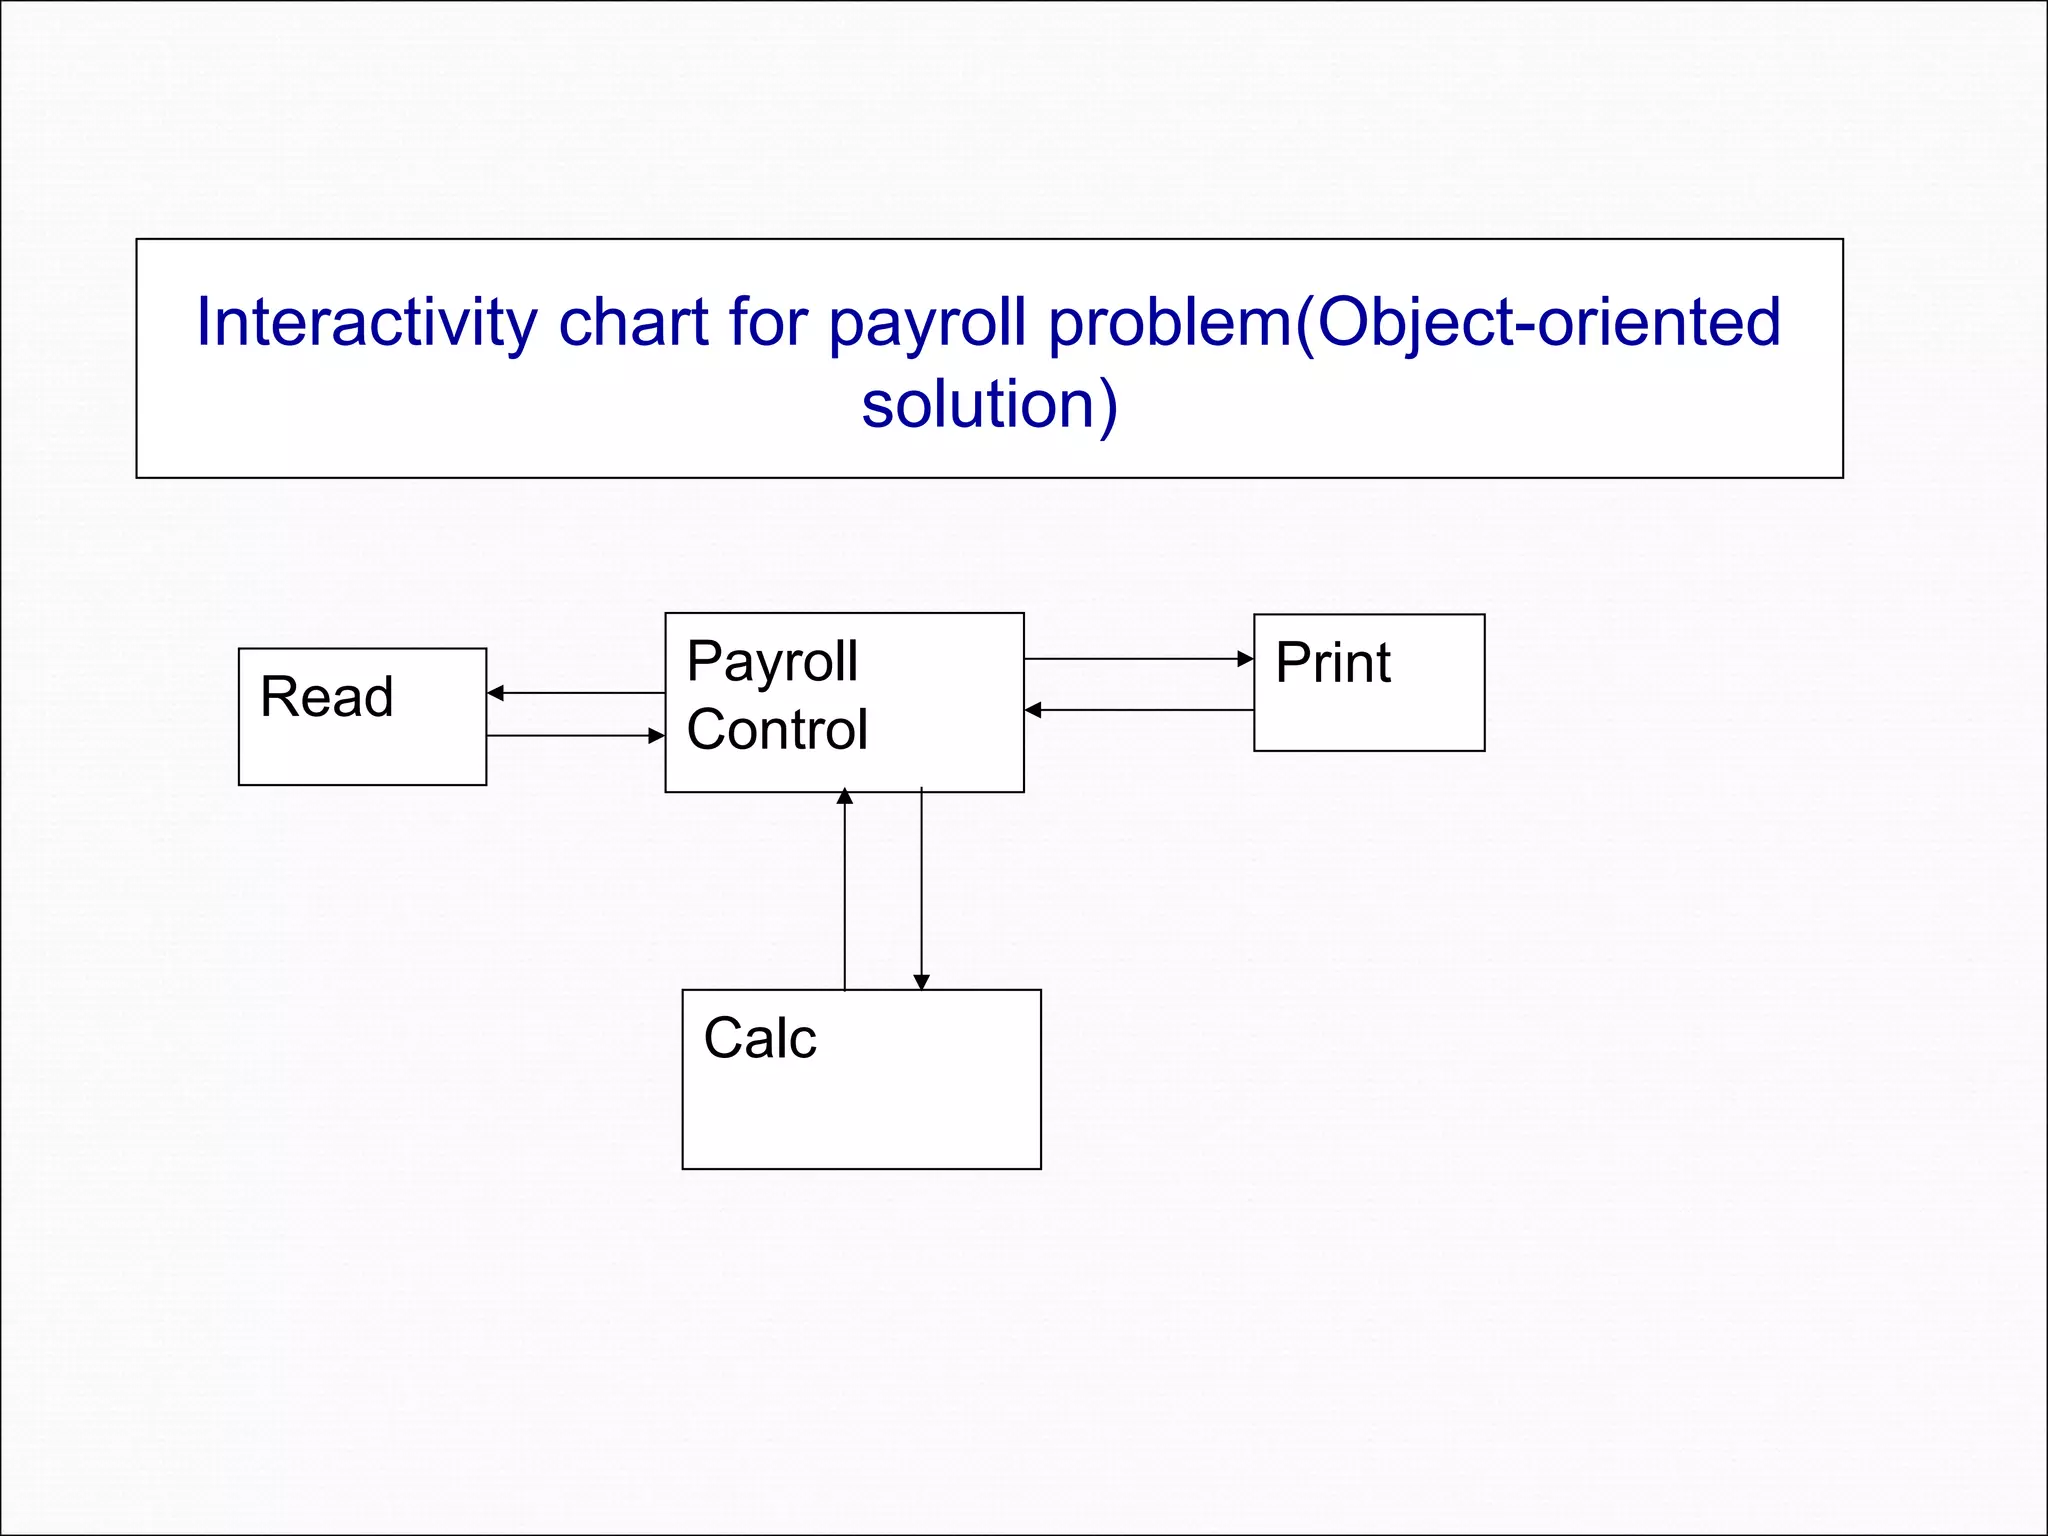
Interactivity(Structure) Chart This breakdownsa complex problem into simpler tasks. This divides your solution in modules – subtasks. Structure charts connect modules together to show the interaction of processing between the modules Each module should contain the tasks to finish/accomplish one function - e.g calculating results, reading input
37.
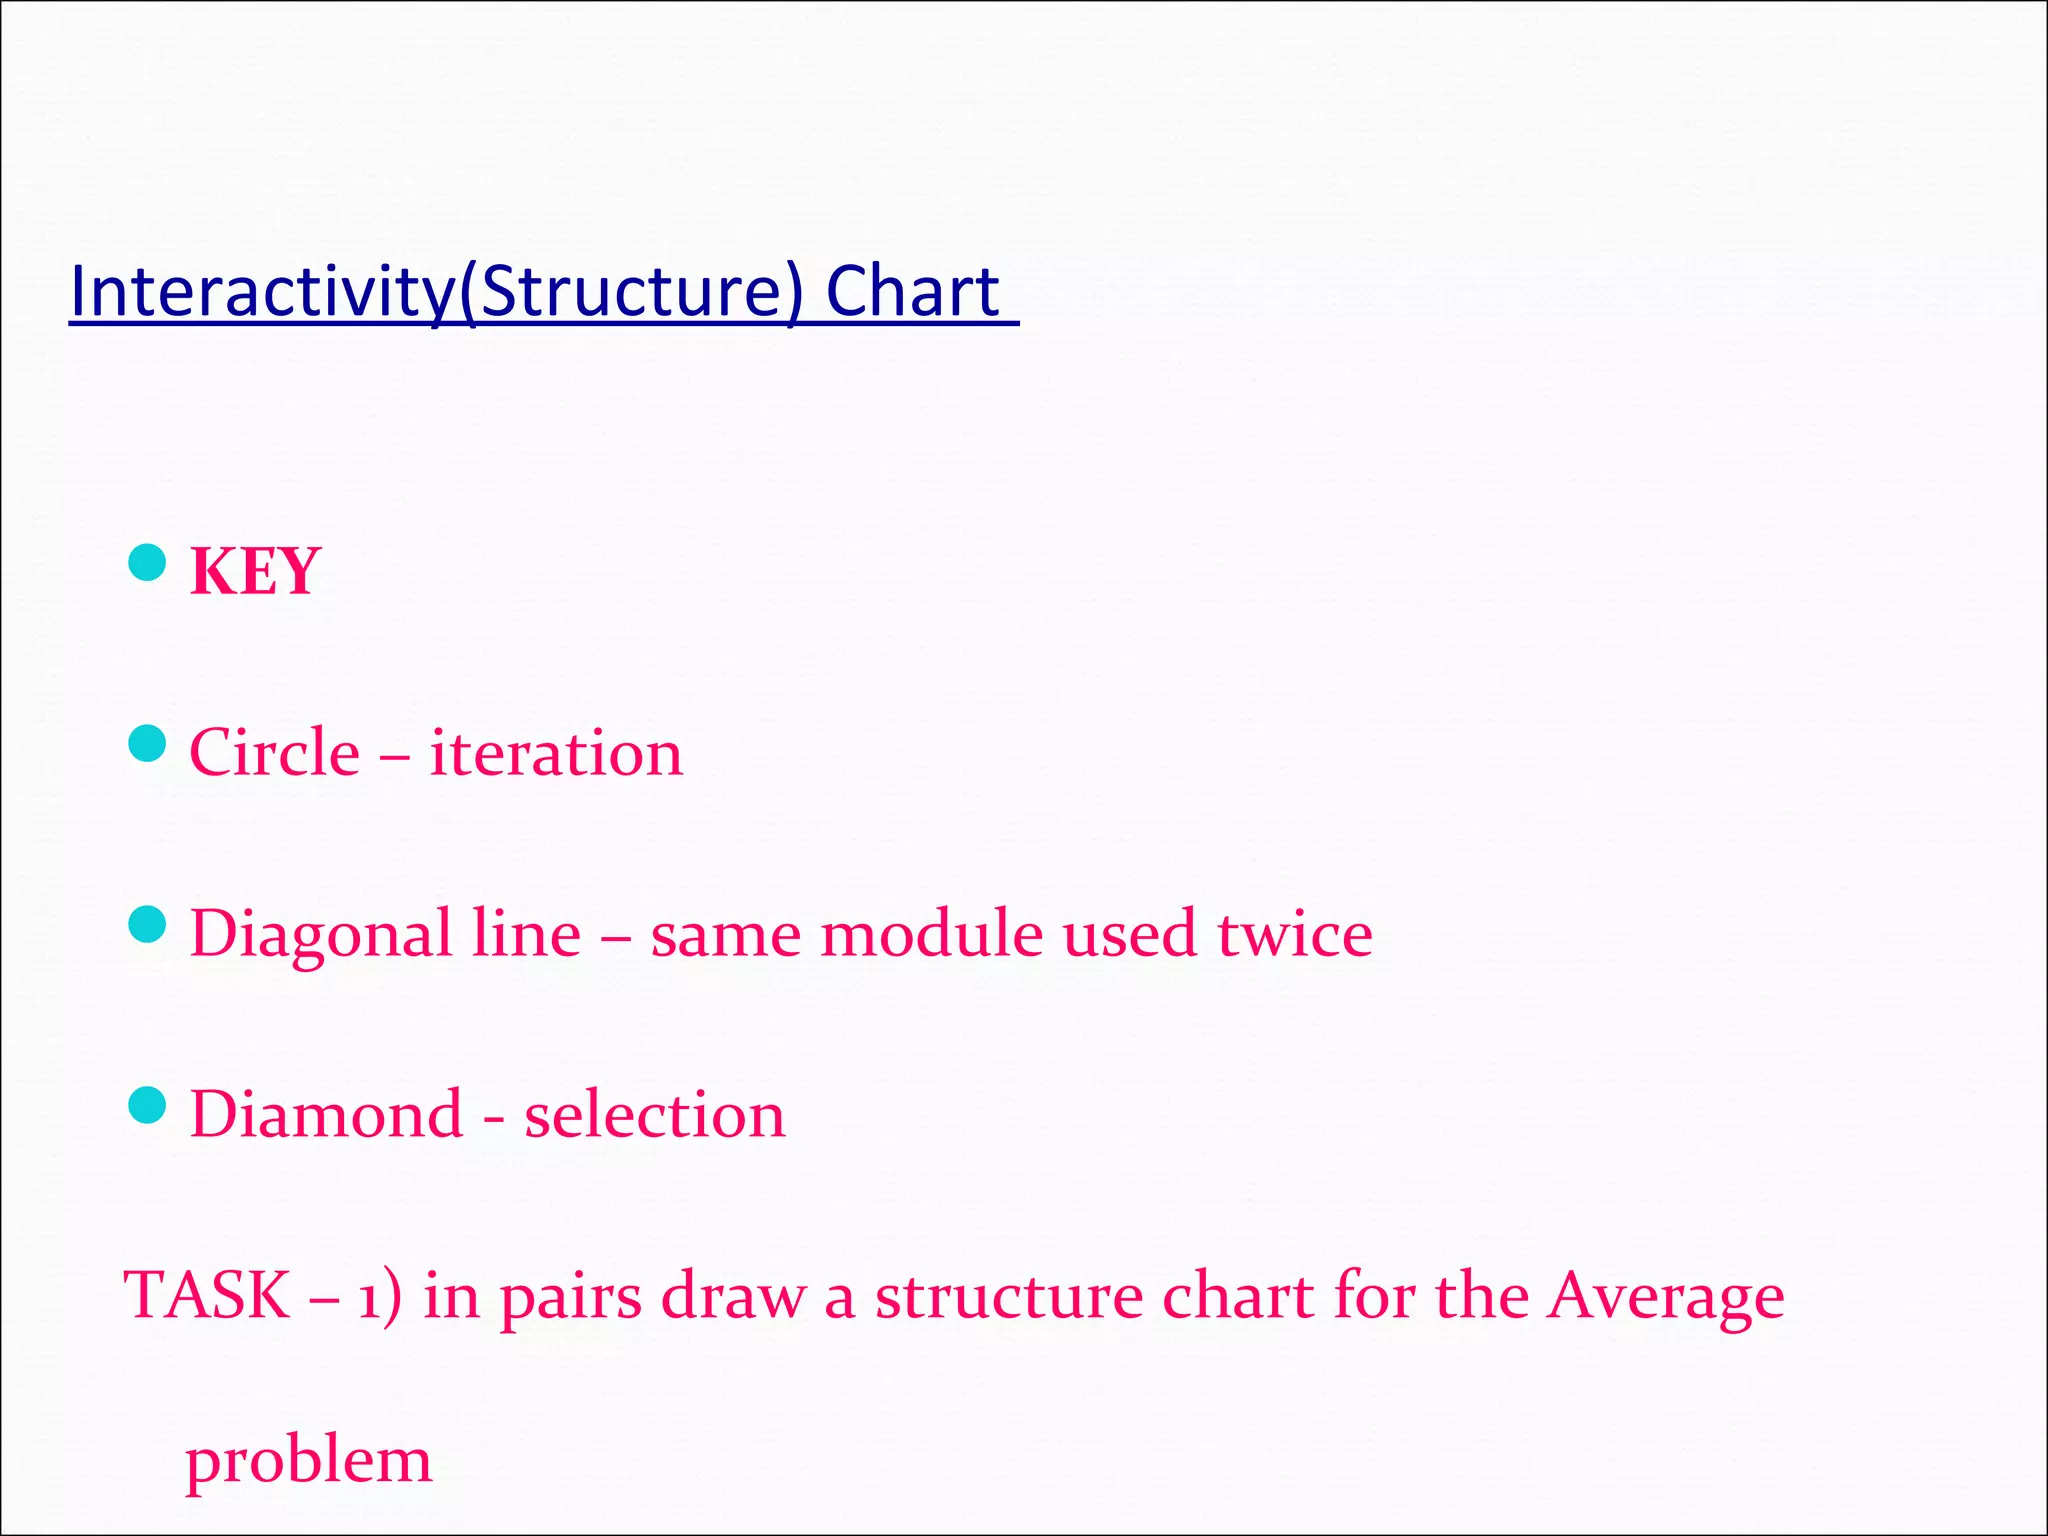
Interactivity(Structure) Chart KEY Circle –iteration Diagonal line – same module used twice Diamond - selection TASK – 1) in pairs draw a structure chart for the Average problem
38.
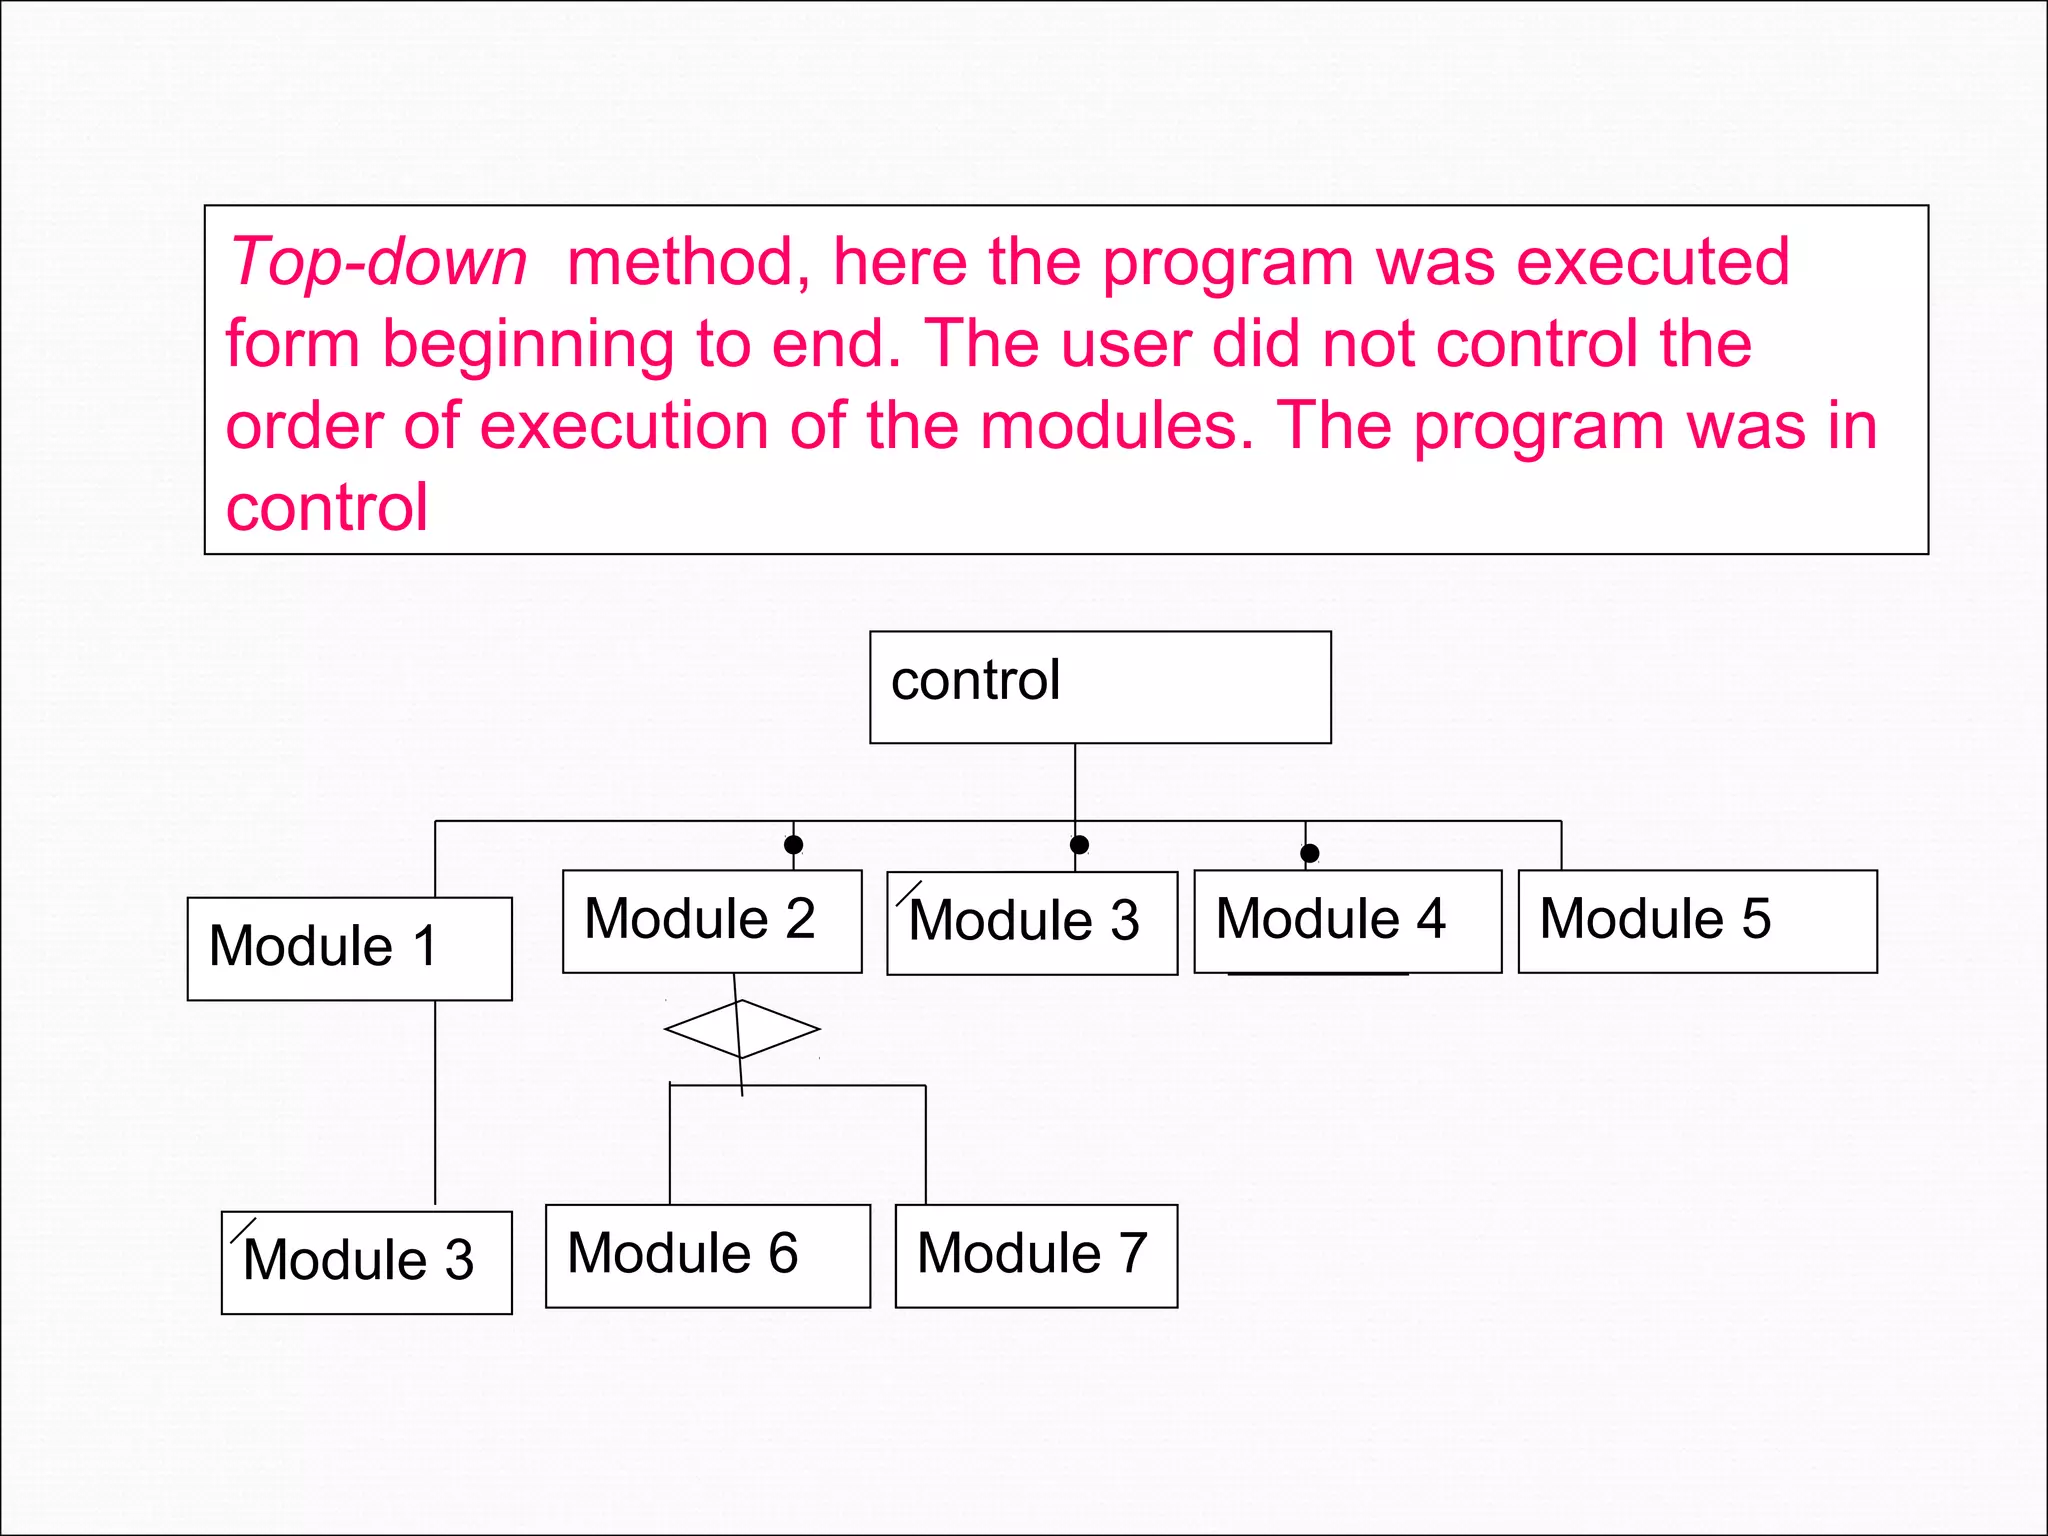
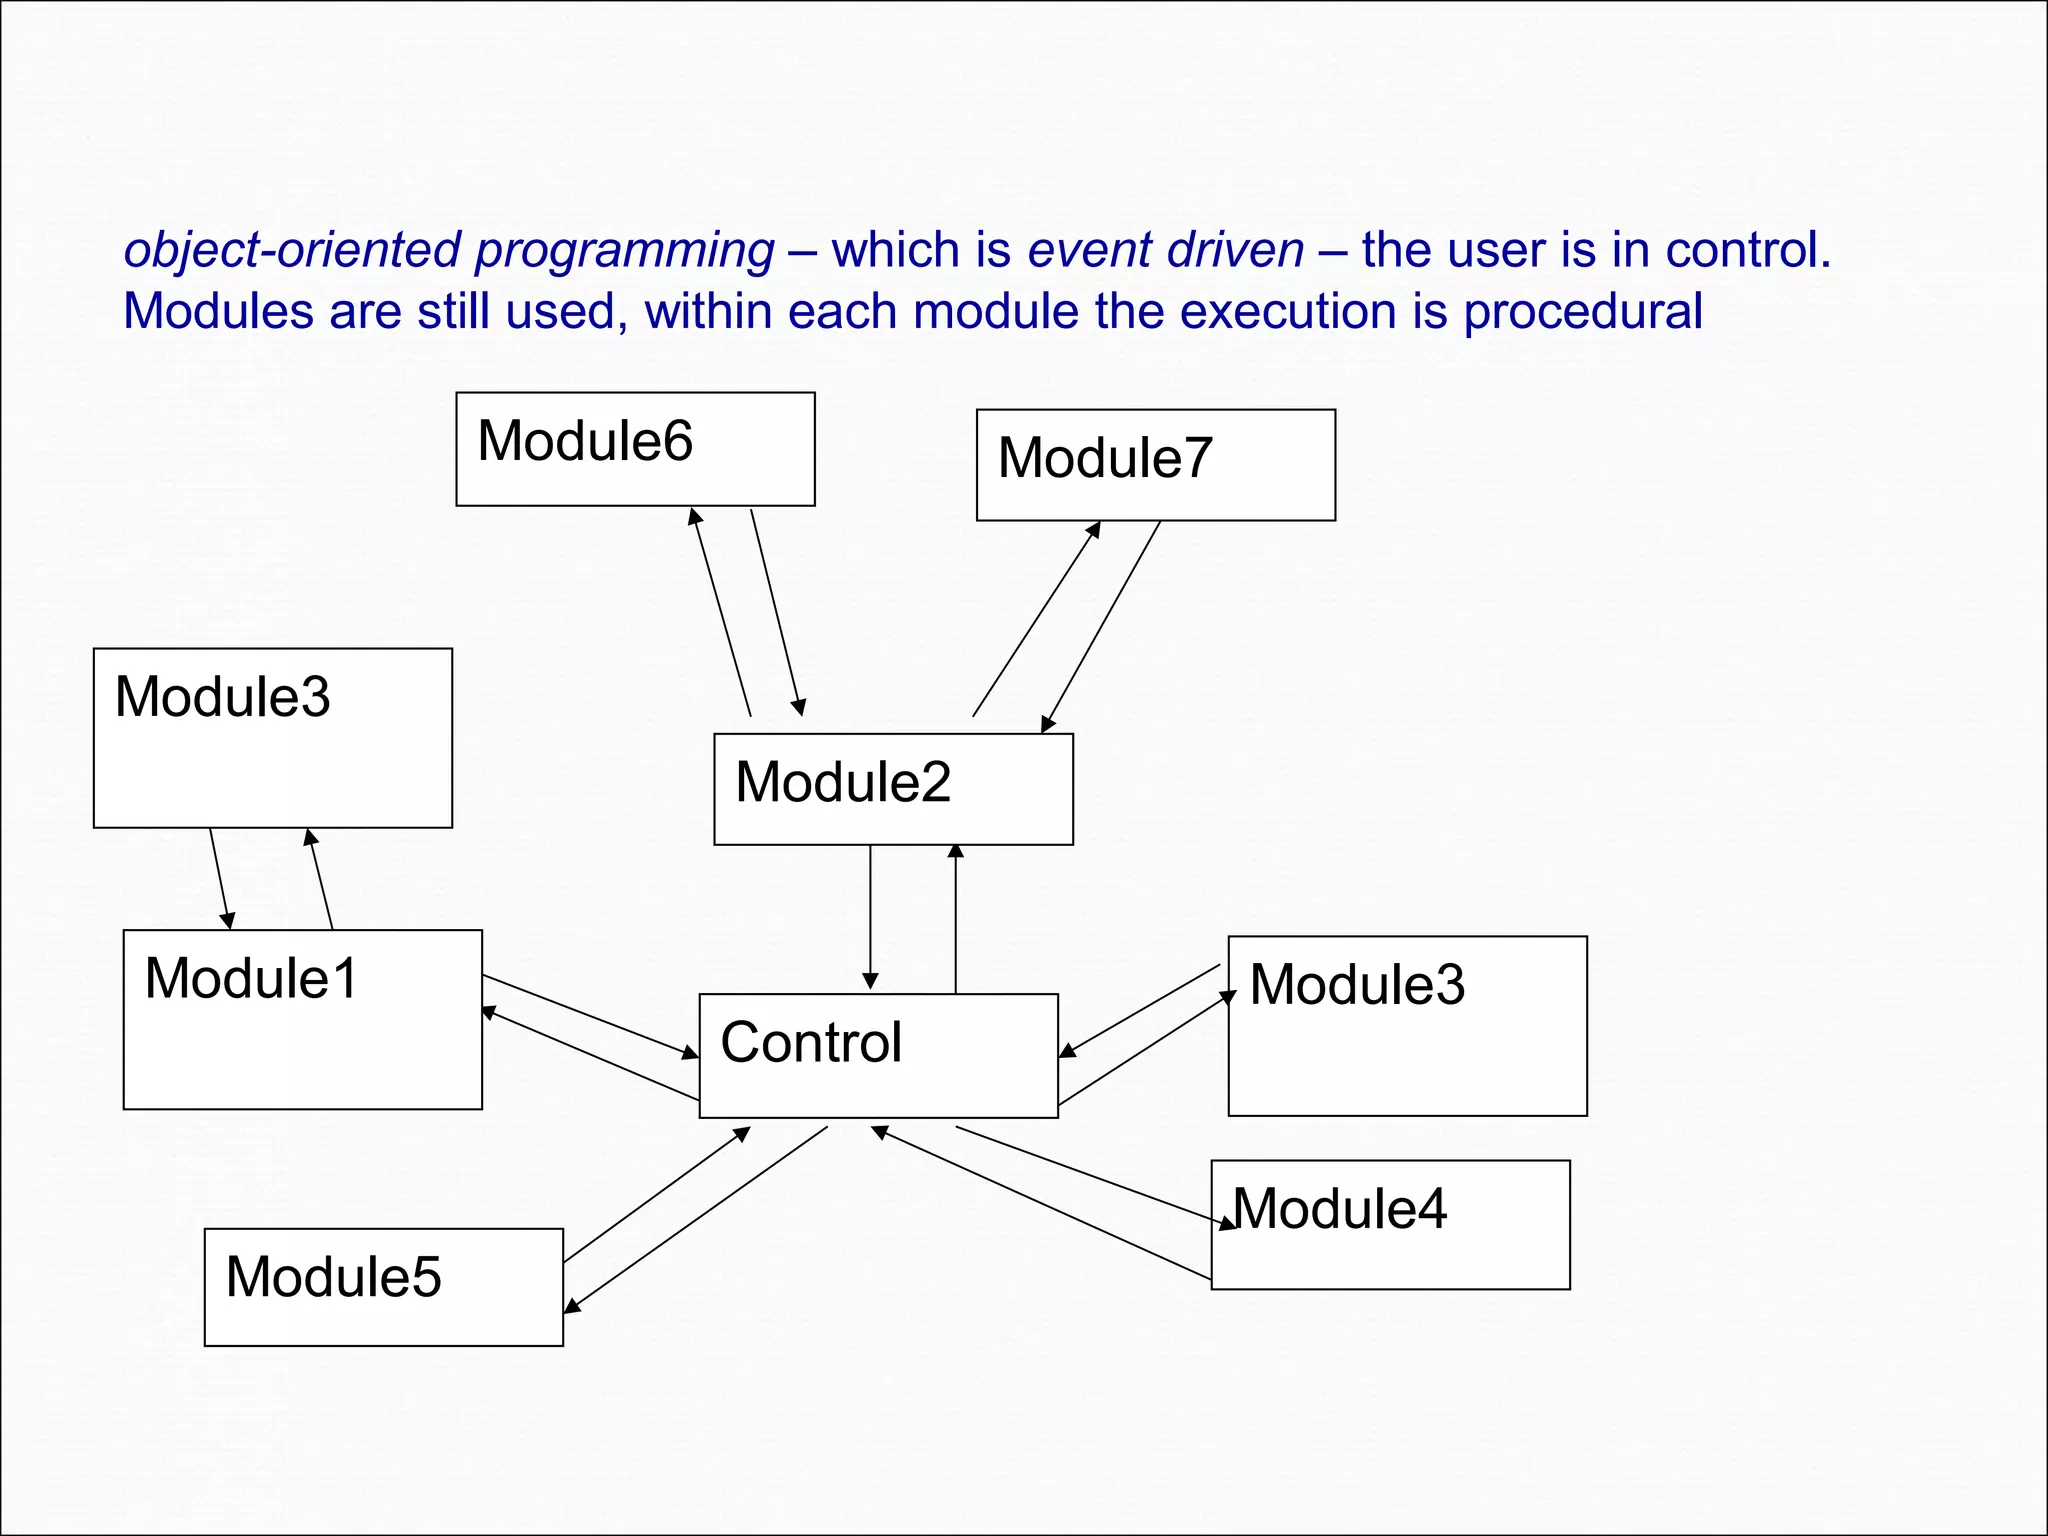
control Module 1 Module2 Module 3 Module 4 Module 5 Module 7Module 6Module 3 Top-down method, here the program was executed form beginning to end. The user did not control the order of execution of the modules. The program was in control
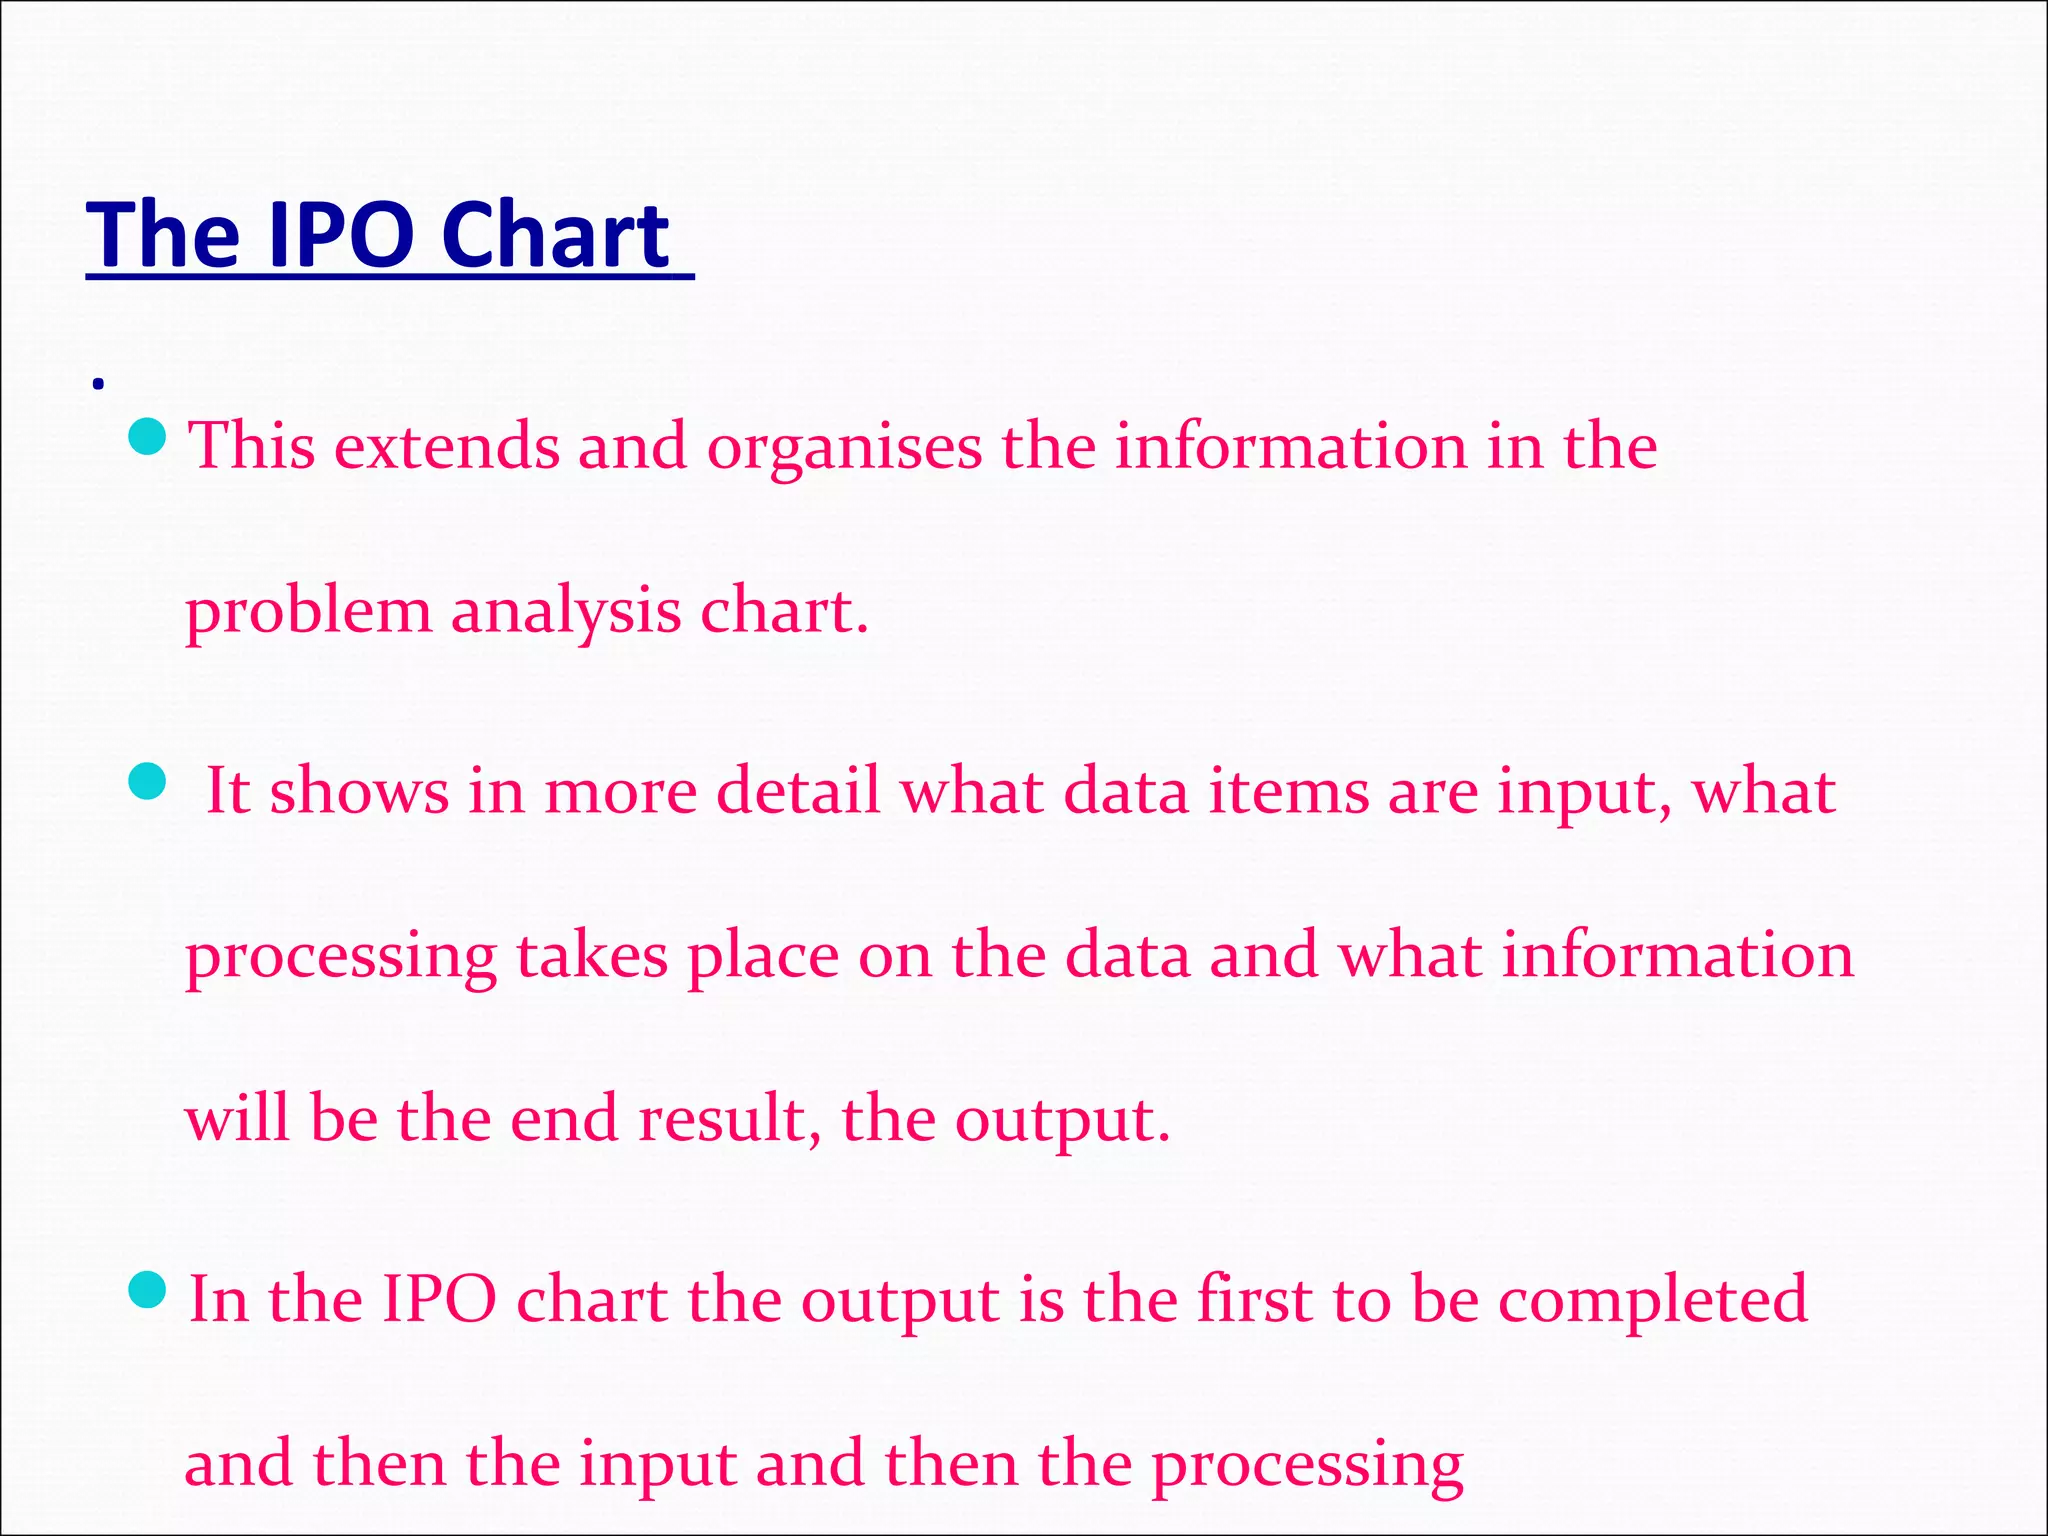
The IPO Chart . Thisextends and organises the information in the problem analysis chart. It shows in more detail what data items are input, what processing takes place on the data and what information will be the end result, the output. In the IPO chart the output is the first to be completed and then the input and then the processing
43.
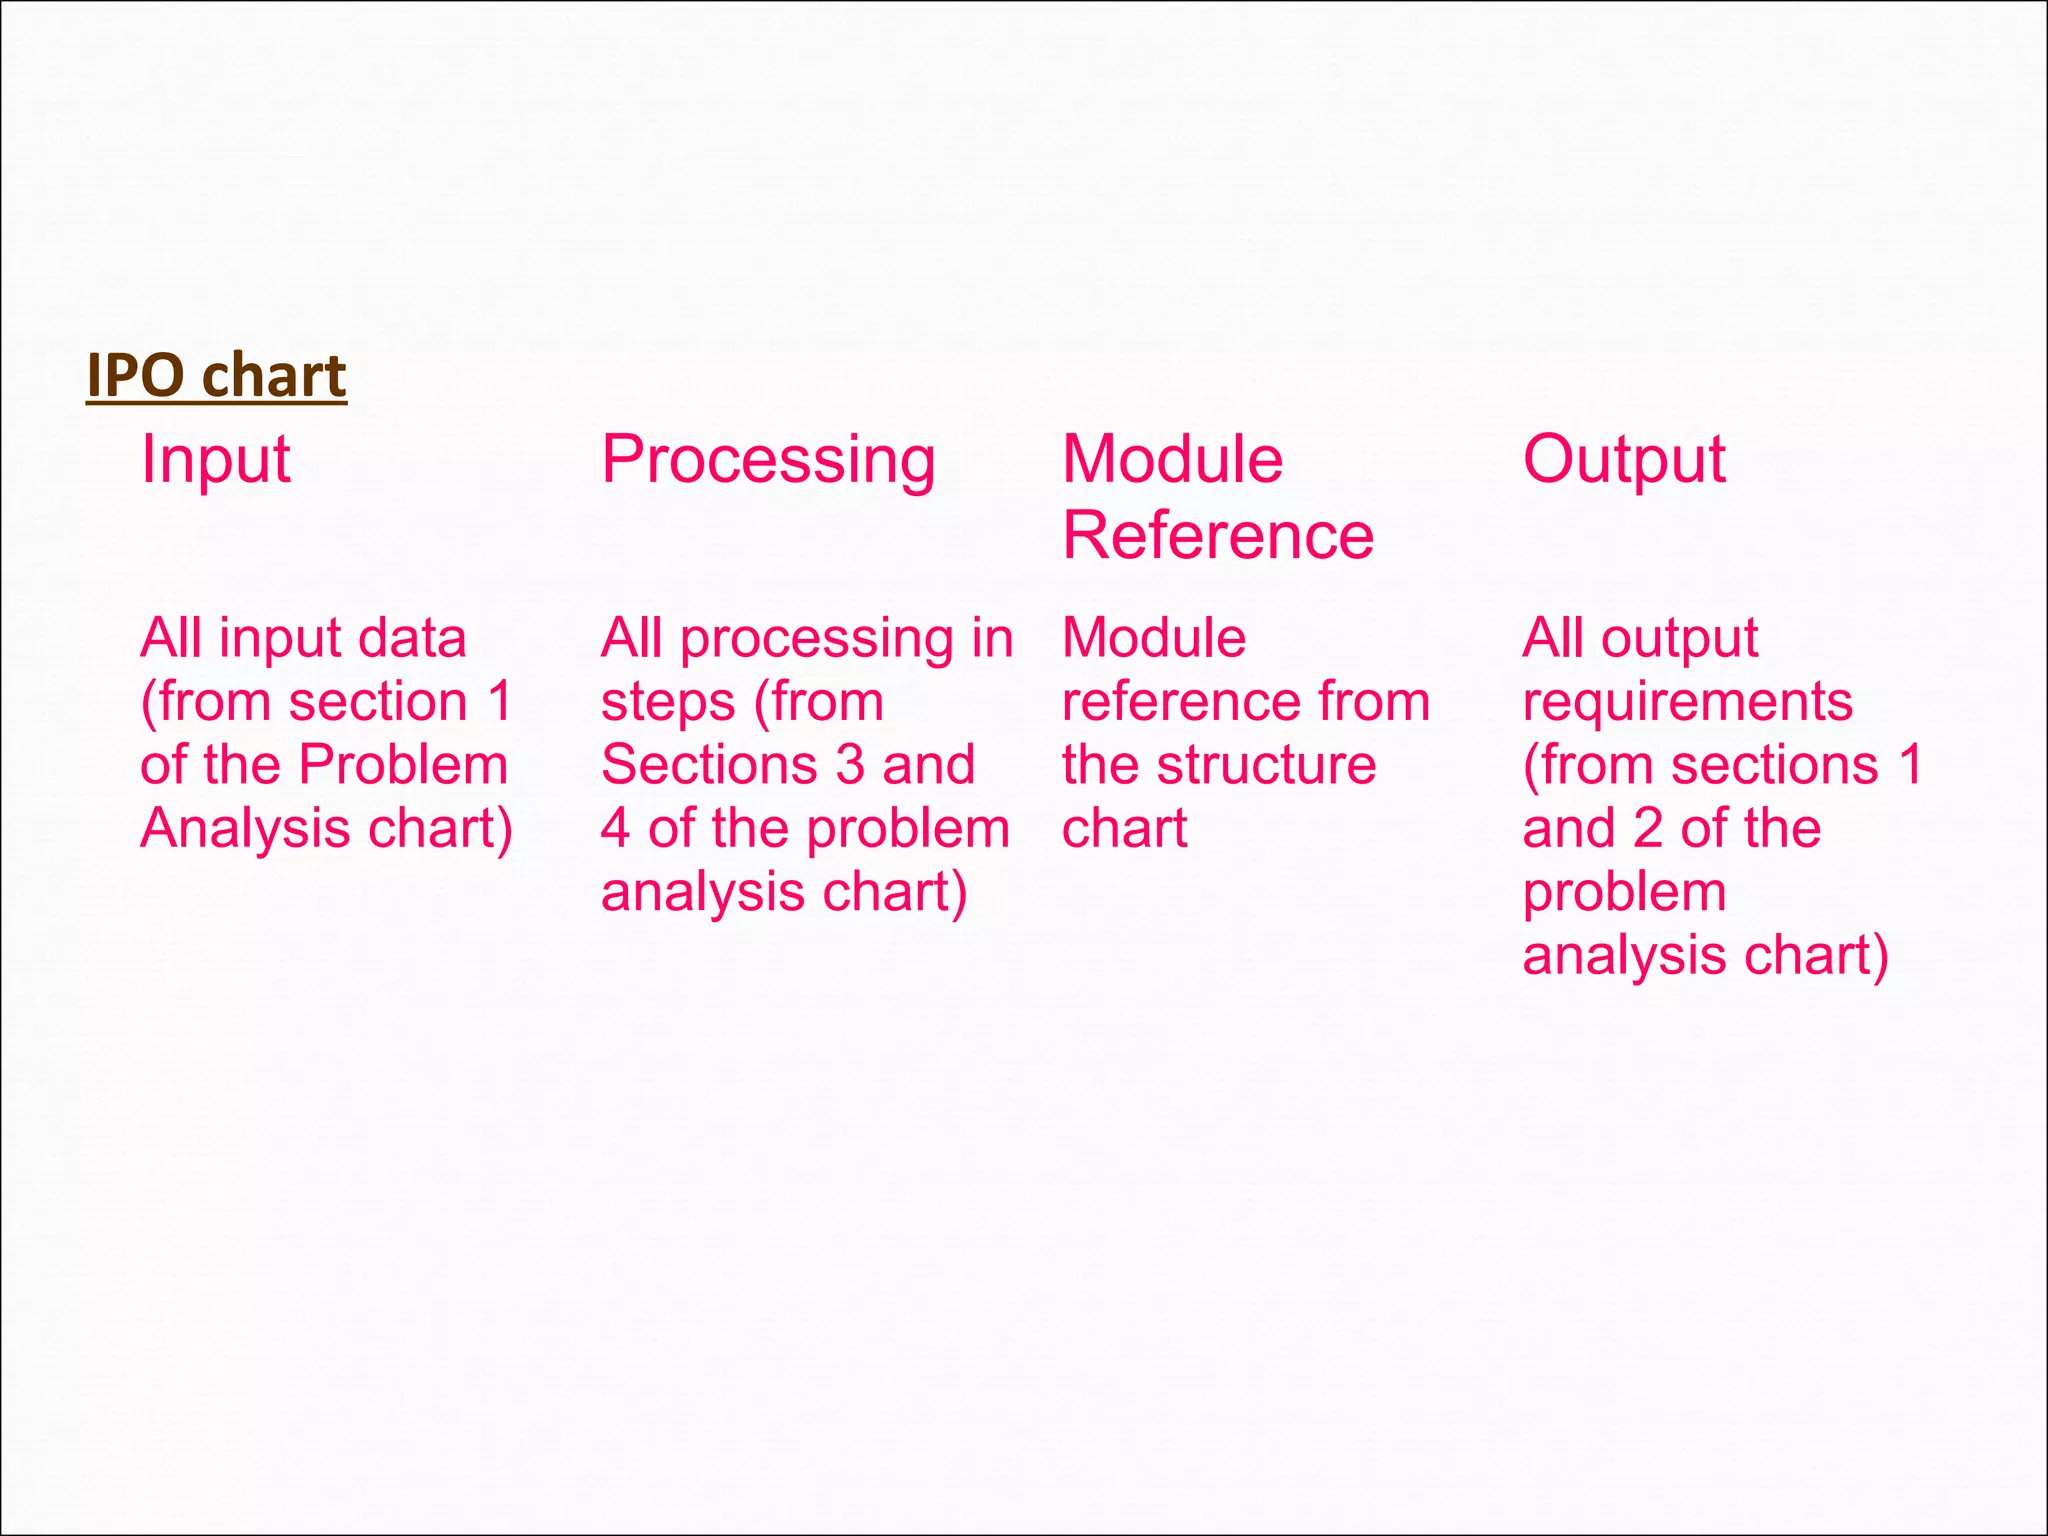
IPO chart Input ProcessingModule Reference Output All input data (from section 1 of the Problem Analysis chart) All processing in steps (from Sections 3 and 4 of the problem analysis chart) Module reference from the structure chart All output requirements (from sections 1 and 2 of the problem analysis chart)
44.
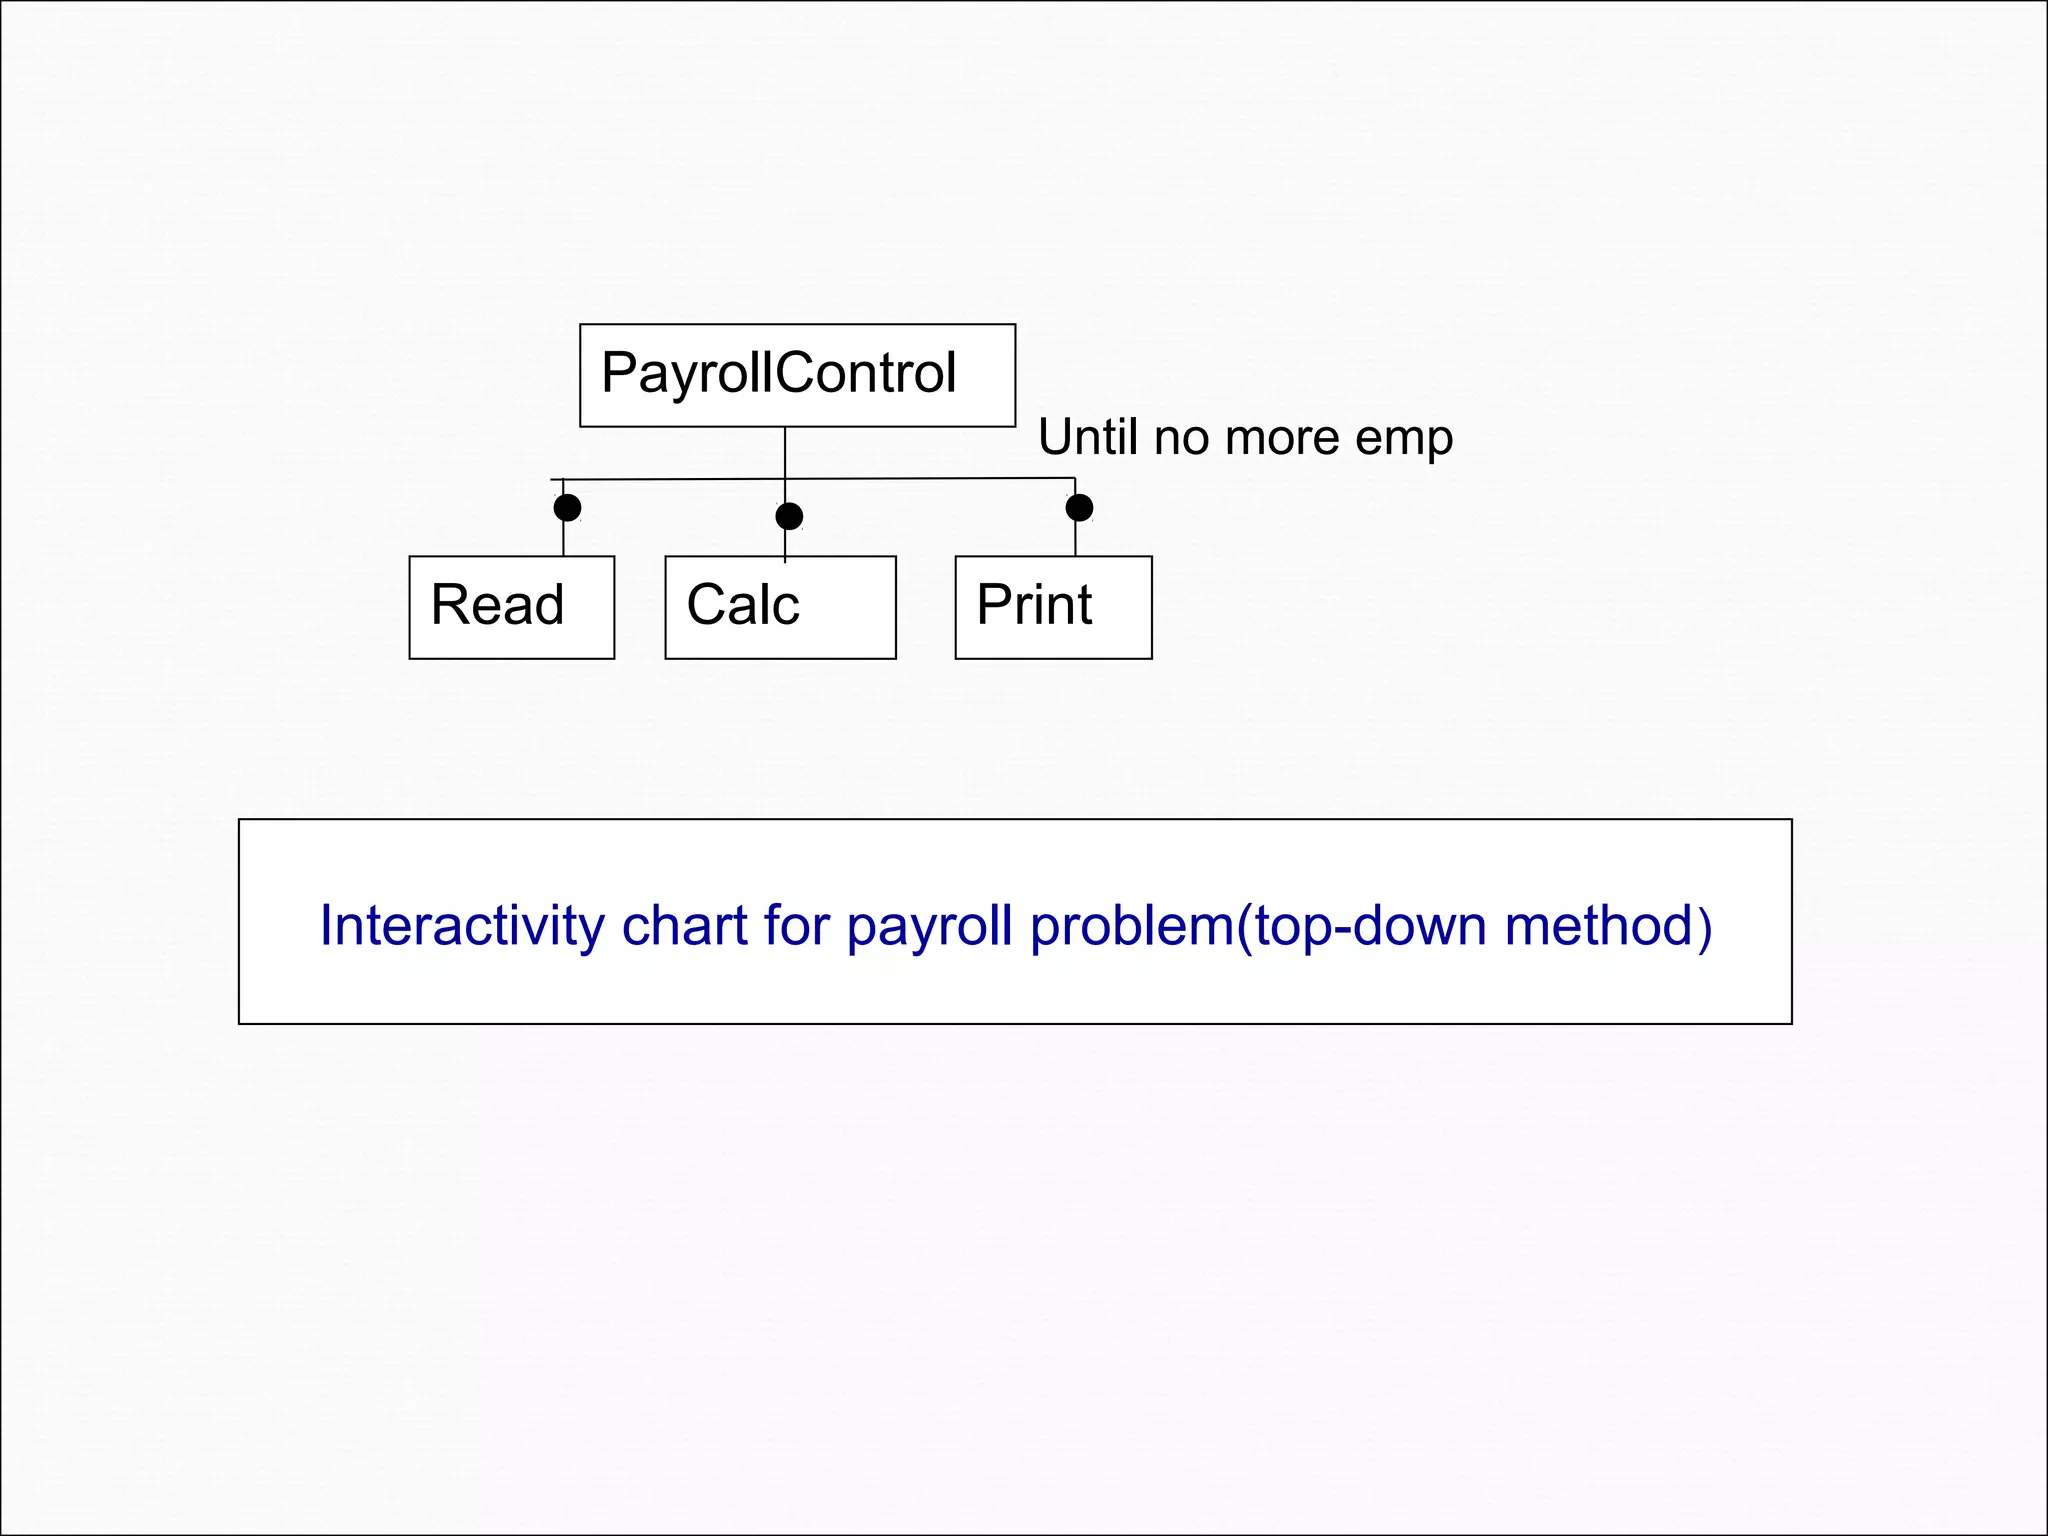
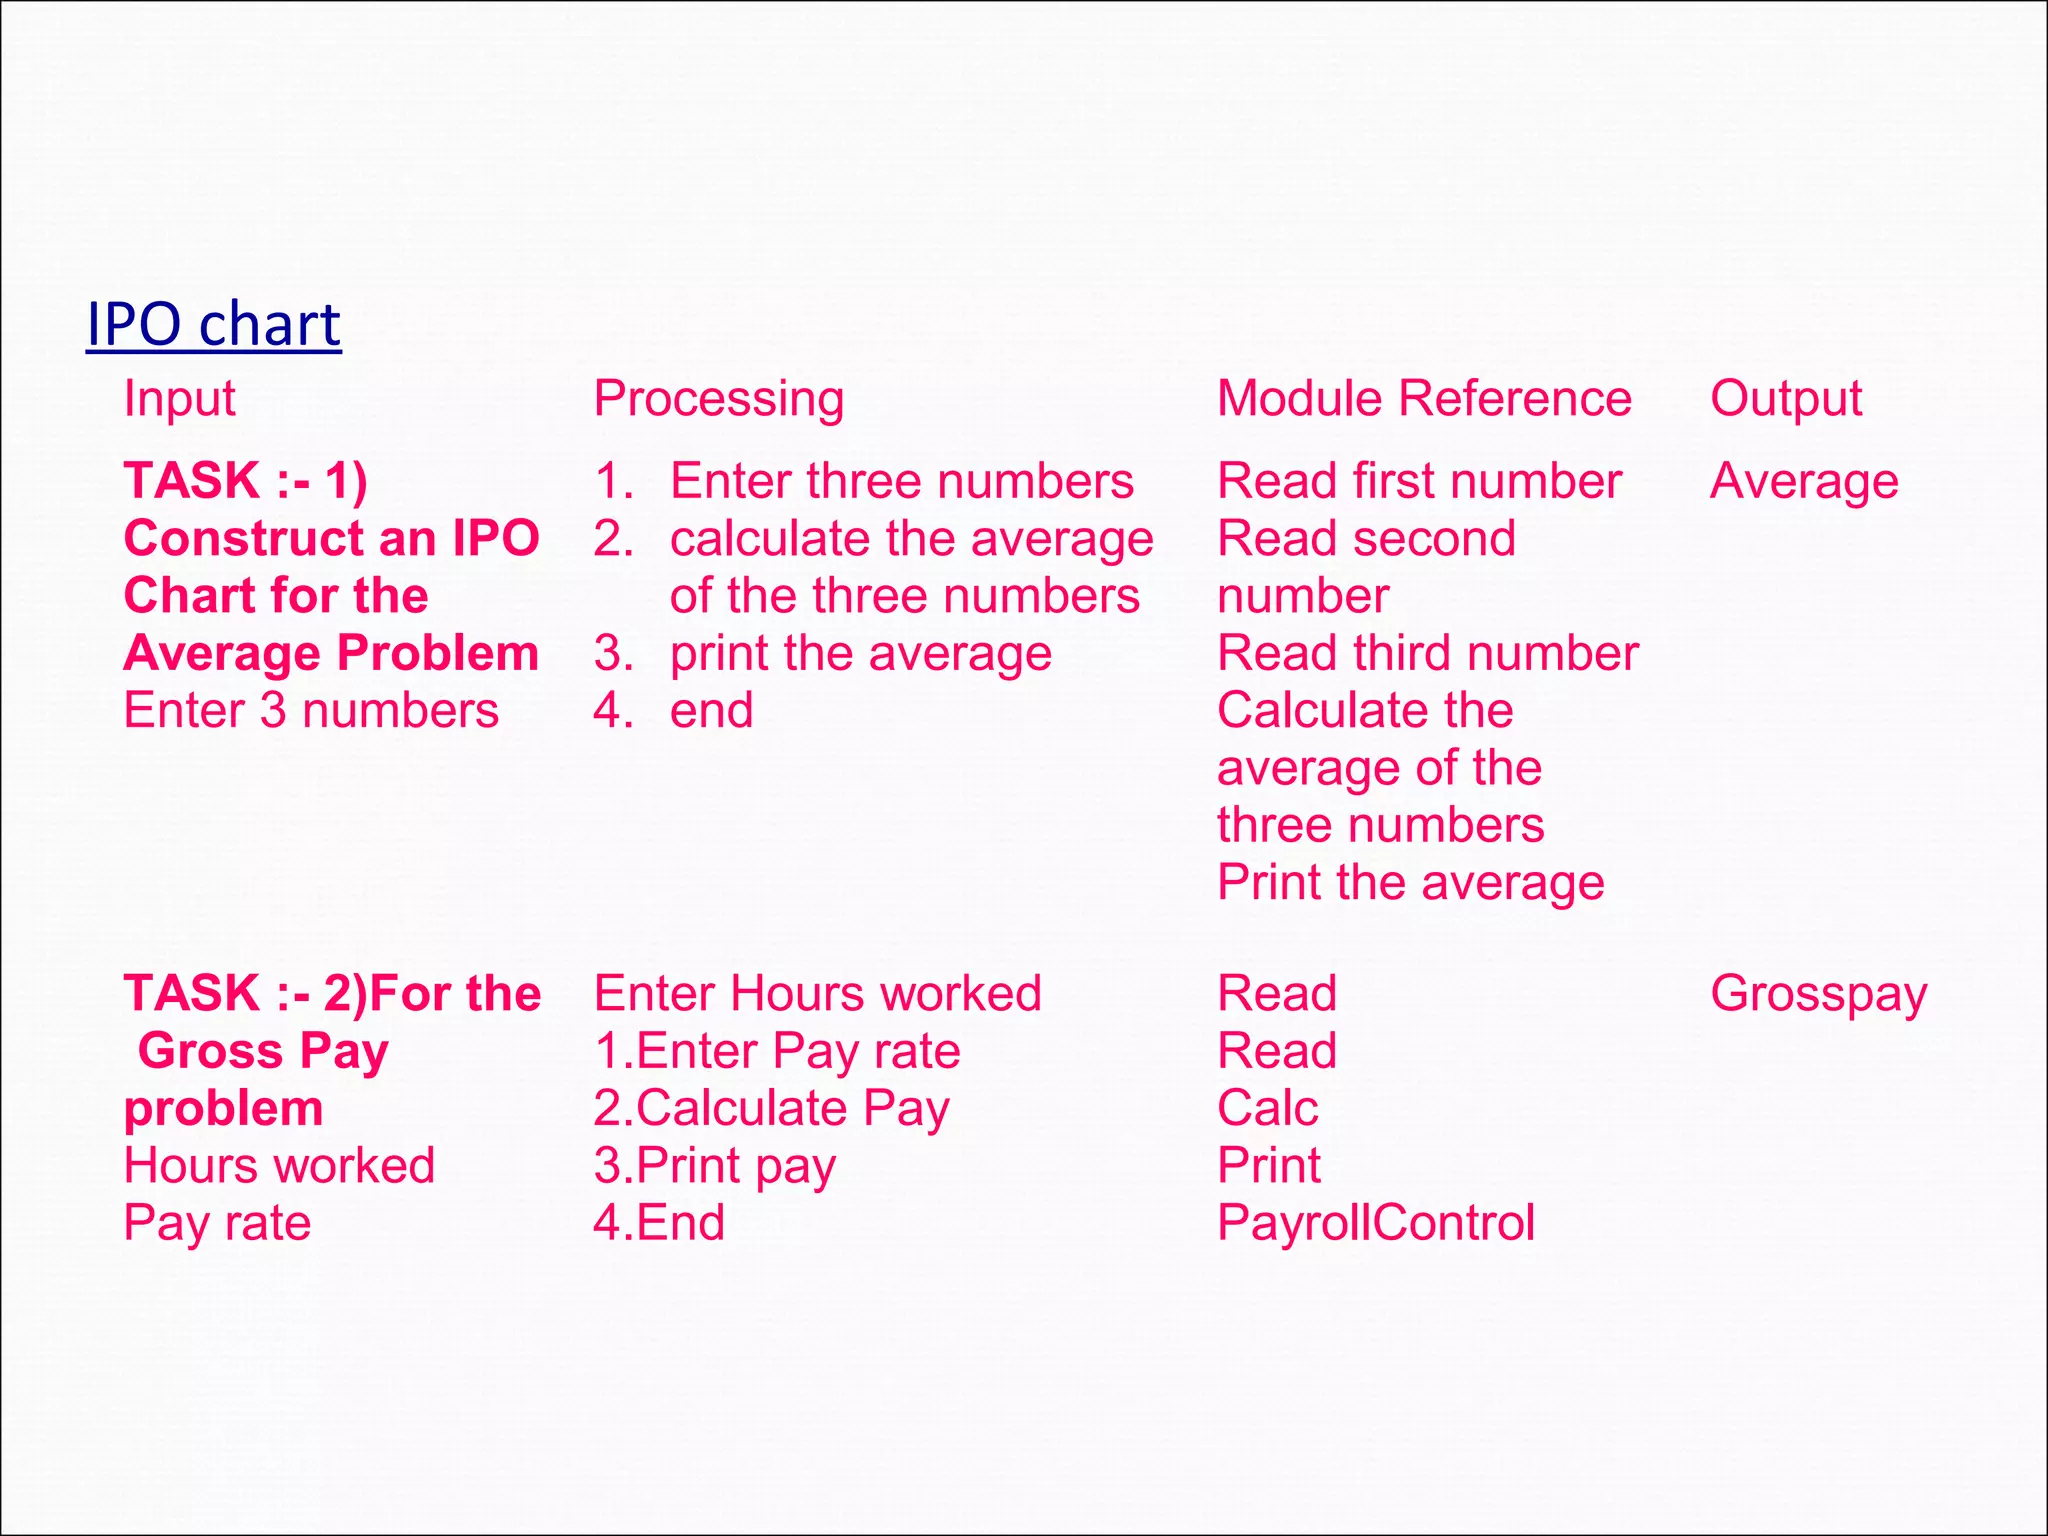
IPO chart Input ProcessingModule Reference Output TASK :- 1) Construct an IPO Chart for the Average Problem Enter 3 numbers 1. Enter three numbers 2. calculate the average of the three numbers 3. print the average 4. end Read first number Read second number Read third number Calculate the average of the three numbers Print the average Average TASK :- 2)For the Gross Pay problem Hours worked Pay rate Enter Hours worked 1.Enter Pay rate 2.Calculate Pay 3.Print pay 4.End Read Read Calc Print PayrollControl Grosspay
45.
Writing Algorithms After usingthe structure chart and the IPO chart the next step in organising the solution is to for the programmer to develop a set of instructions for the computer – called algorithms or Psuedocode. Algorithm: is a systematic procedure that produces - in a finite number of steps - the answer to a question or the solution of a problem. is a sequence of instructions which can be used to solve a given problem
46.
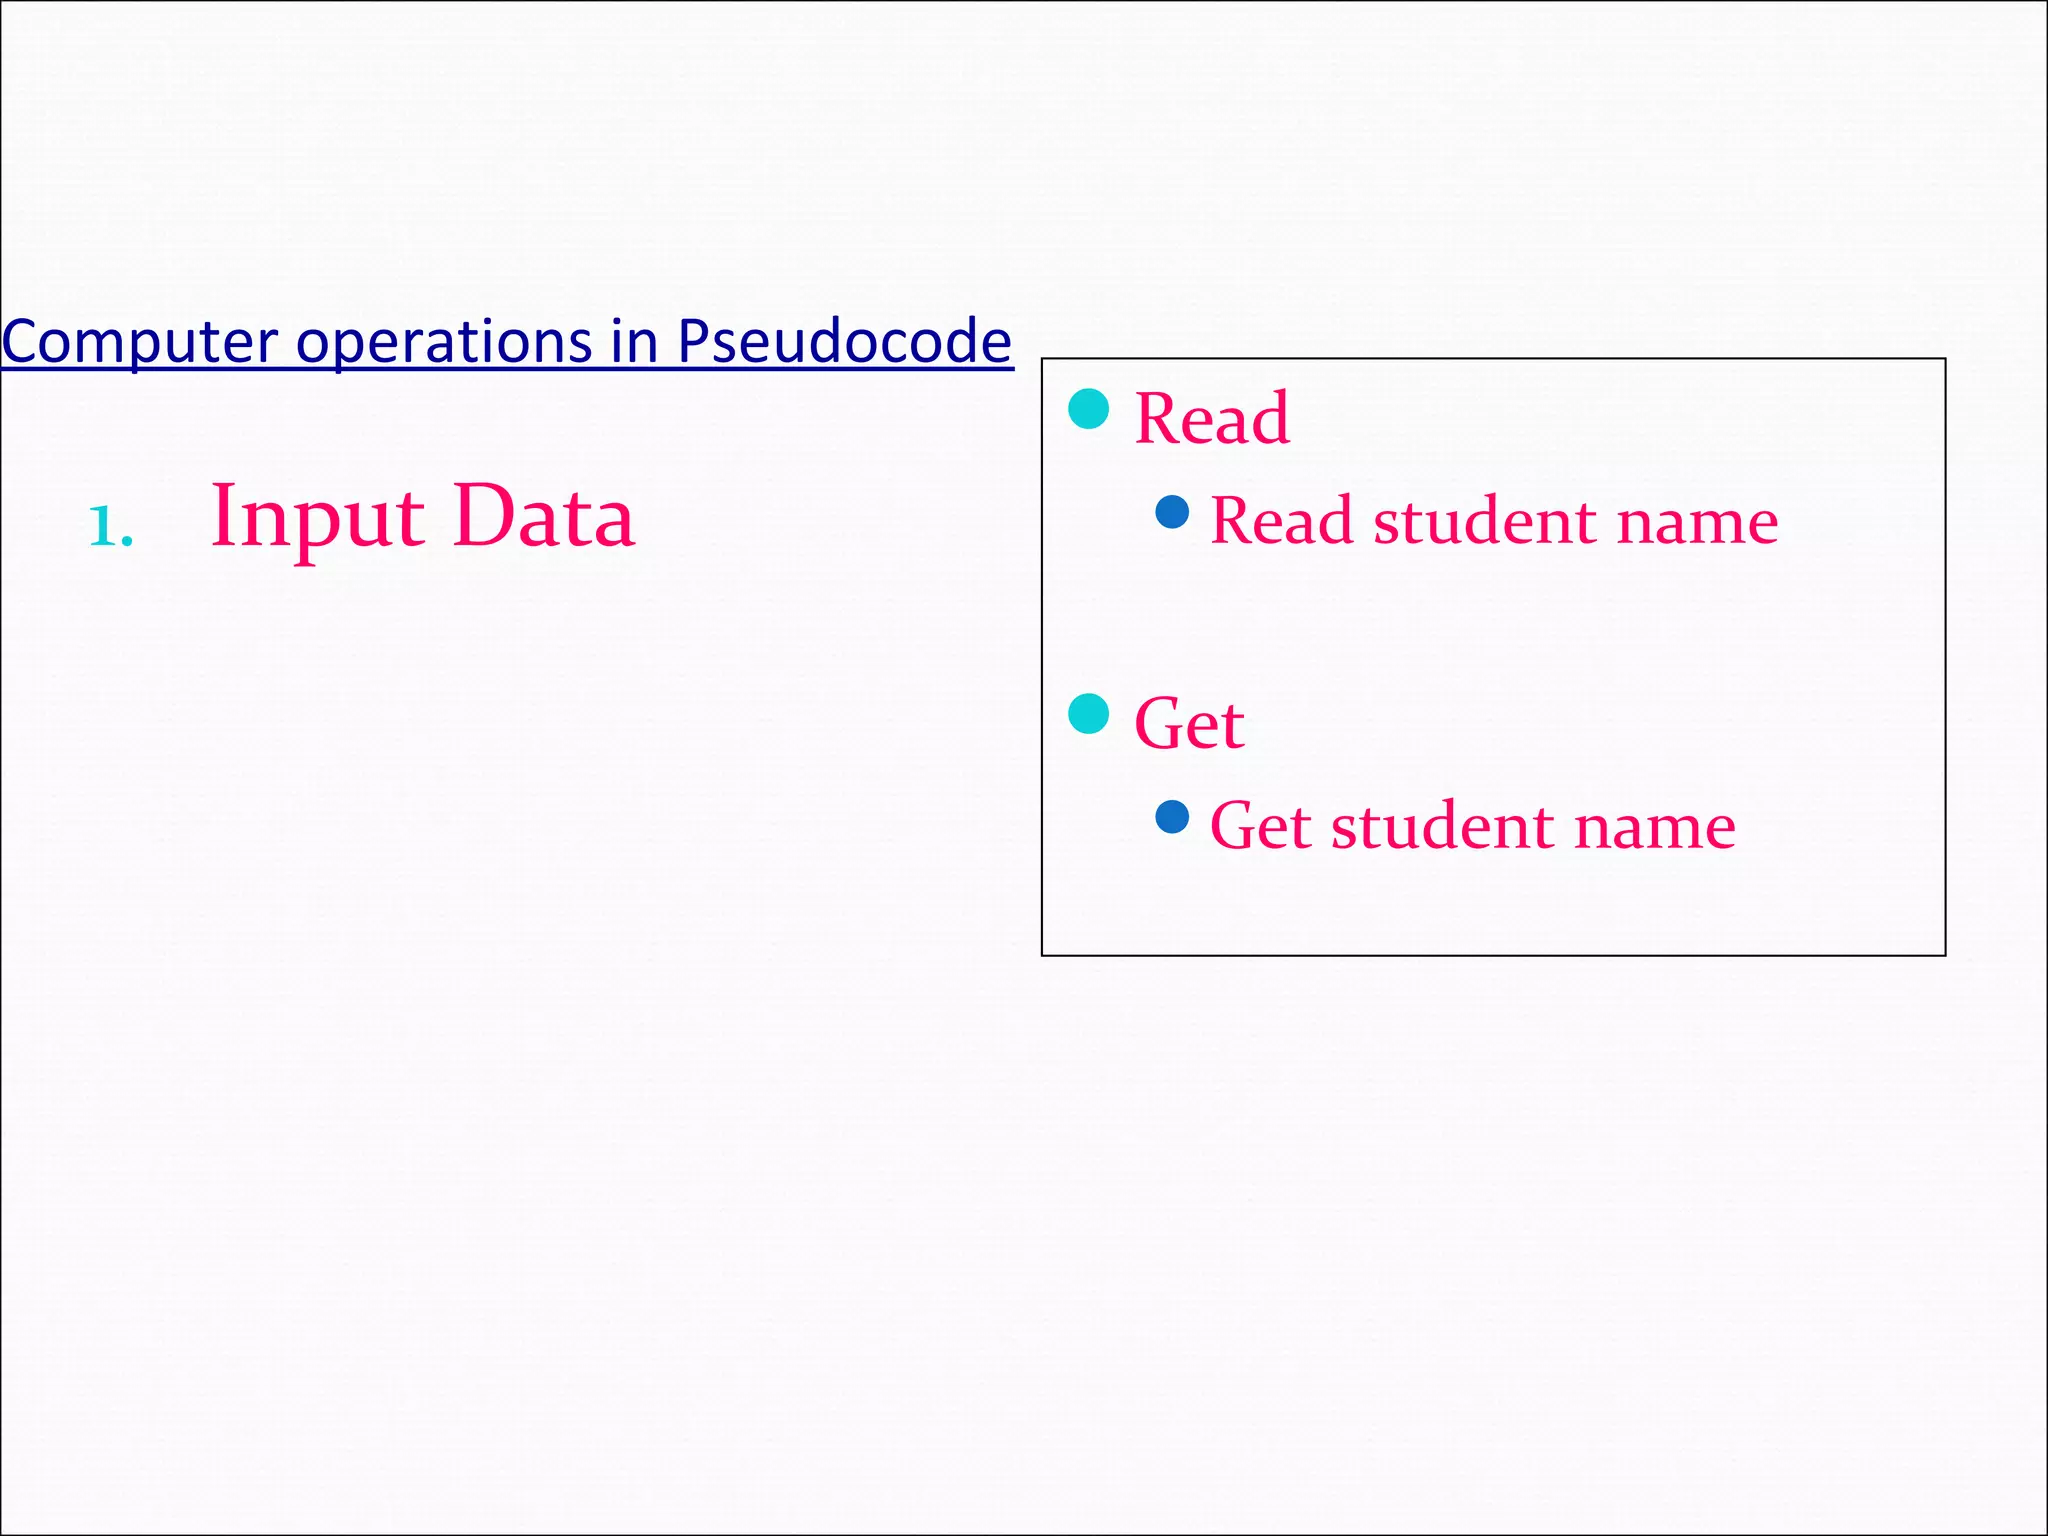
Computer operations inPseudocode 1. Input Data Read Read student name Get Get student name
47.
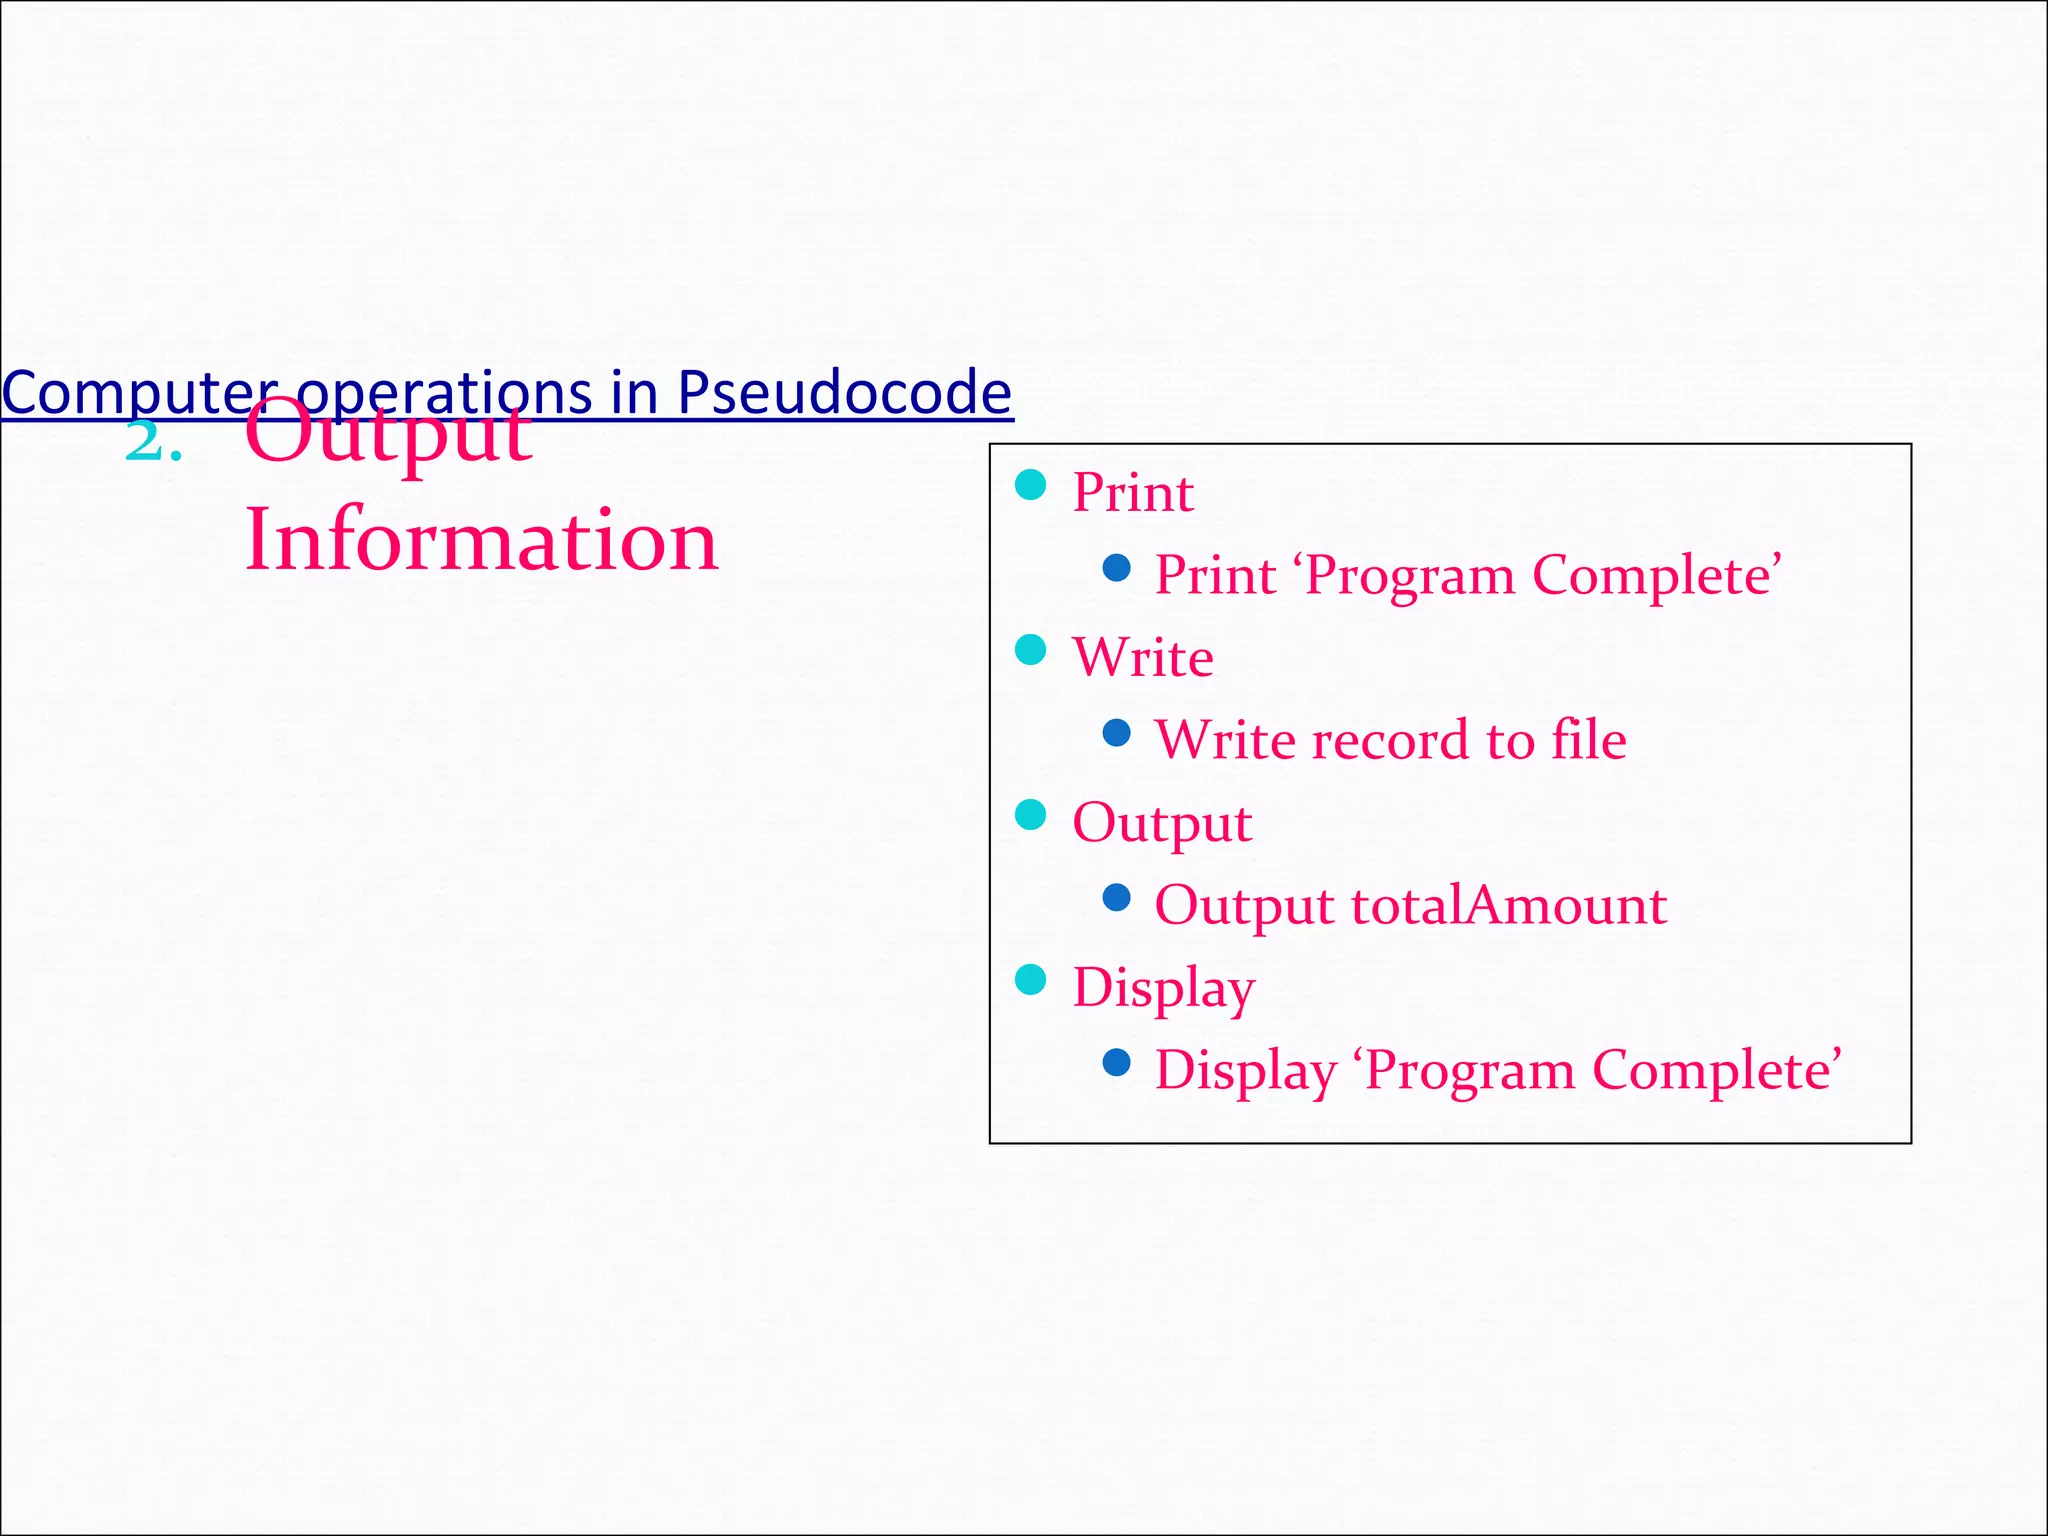
Computer operations inPseudocode 2. Output Information Print Print ‘Program Complete’ Write Write record to file Output Output totalAmount Display Display ‘Program Complete’
48.
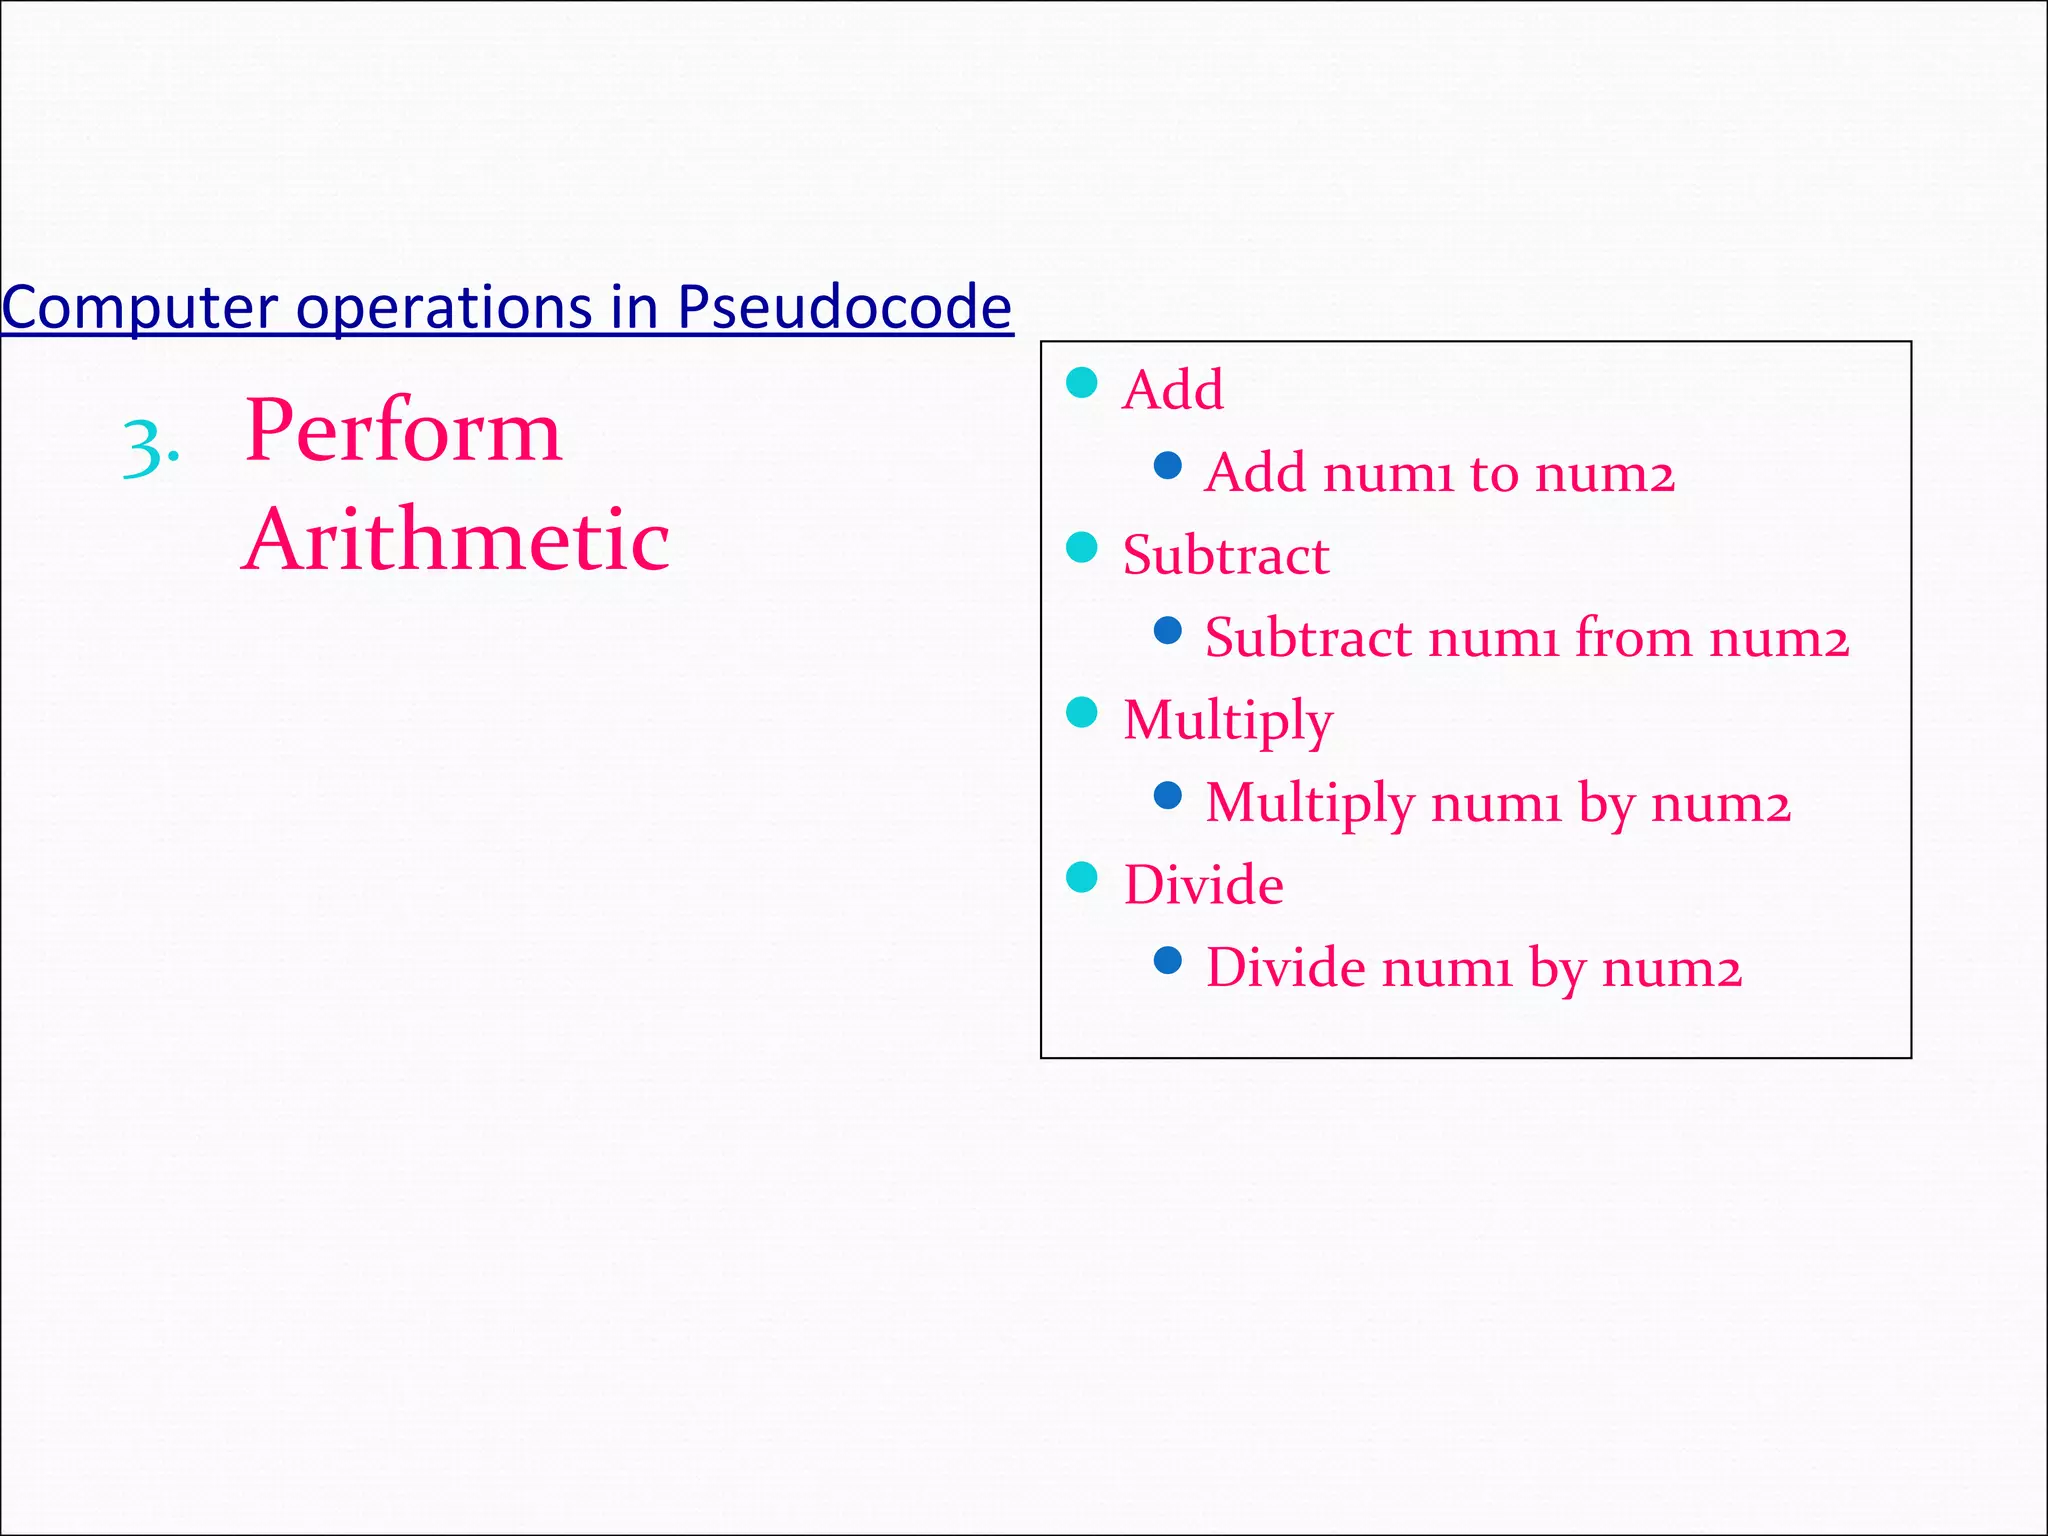
Computer operations inPseudocode 3. Perform Arithmetic Add Add num1 to num2 Subtract Subtract num1 from num2 Multiply Multiply num1 by num2 Divide Divide num1 by num2
49.
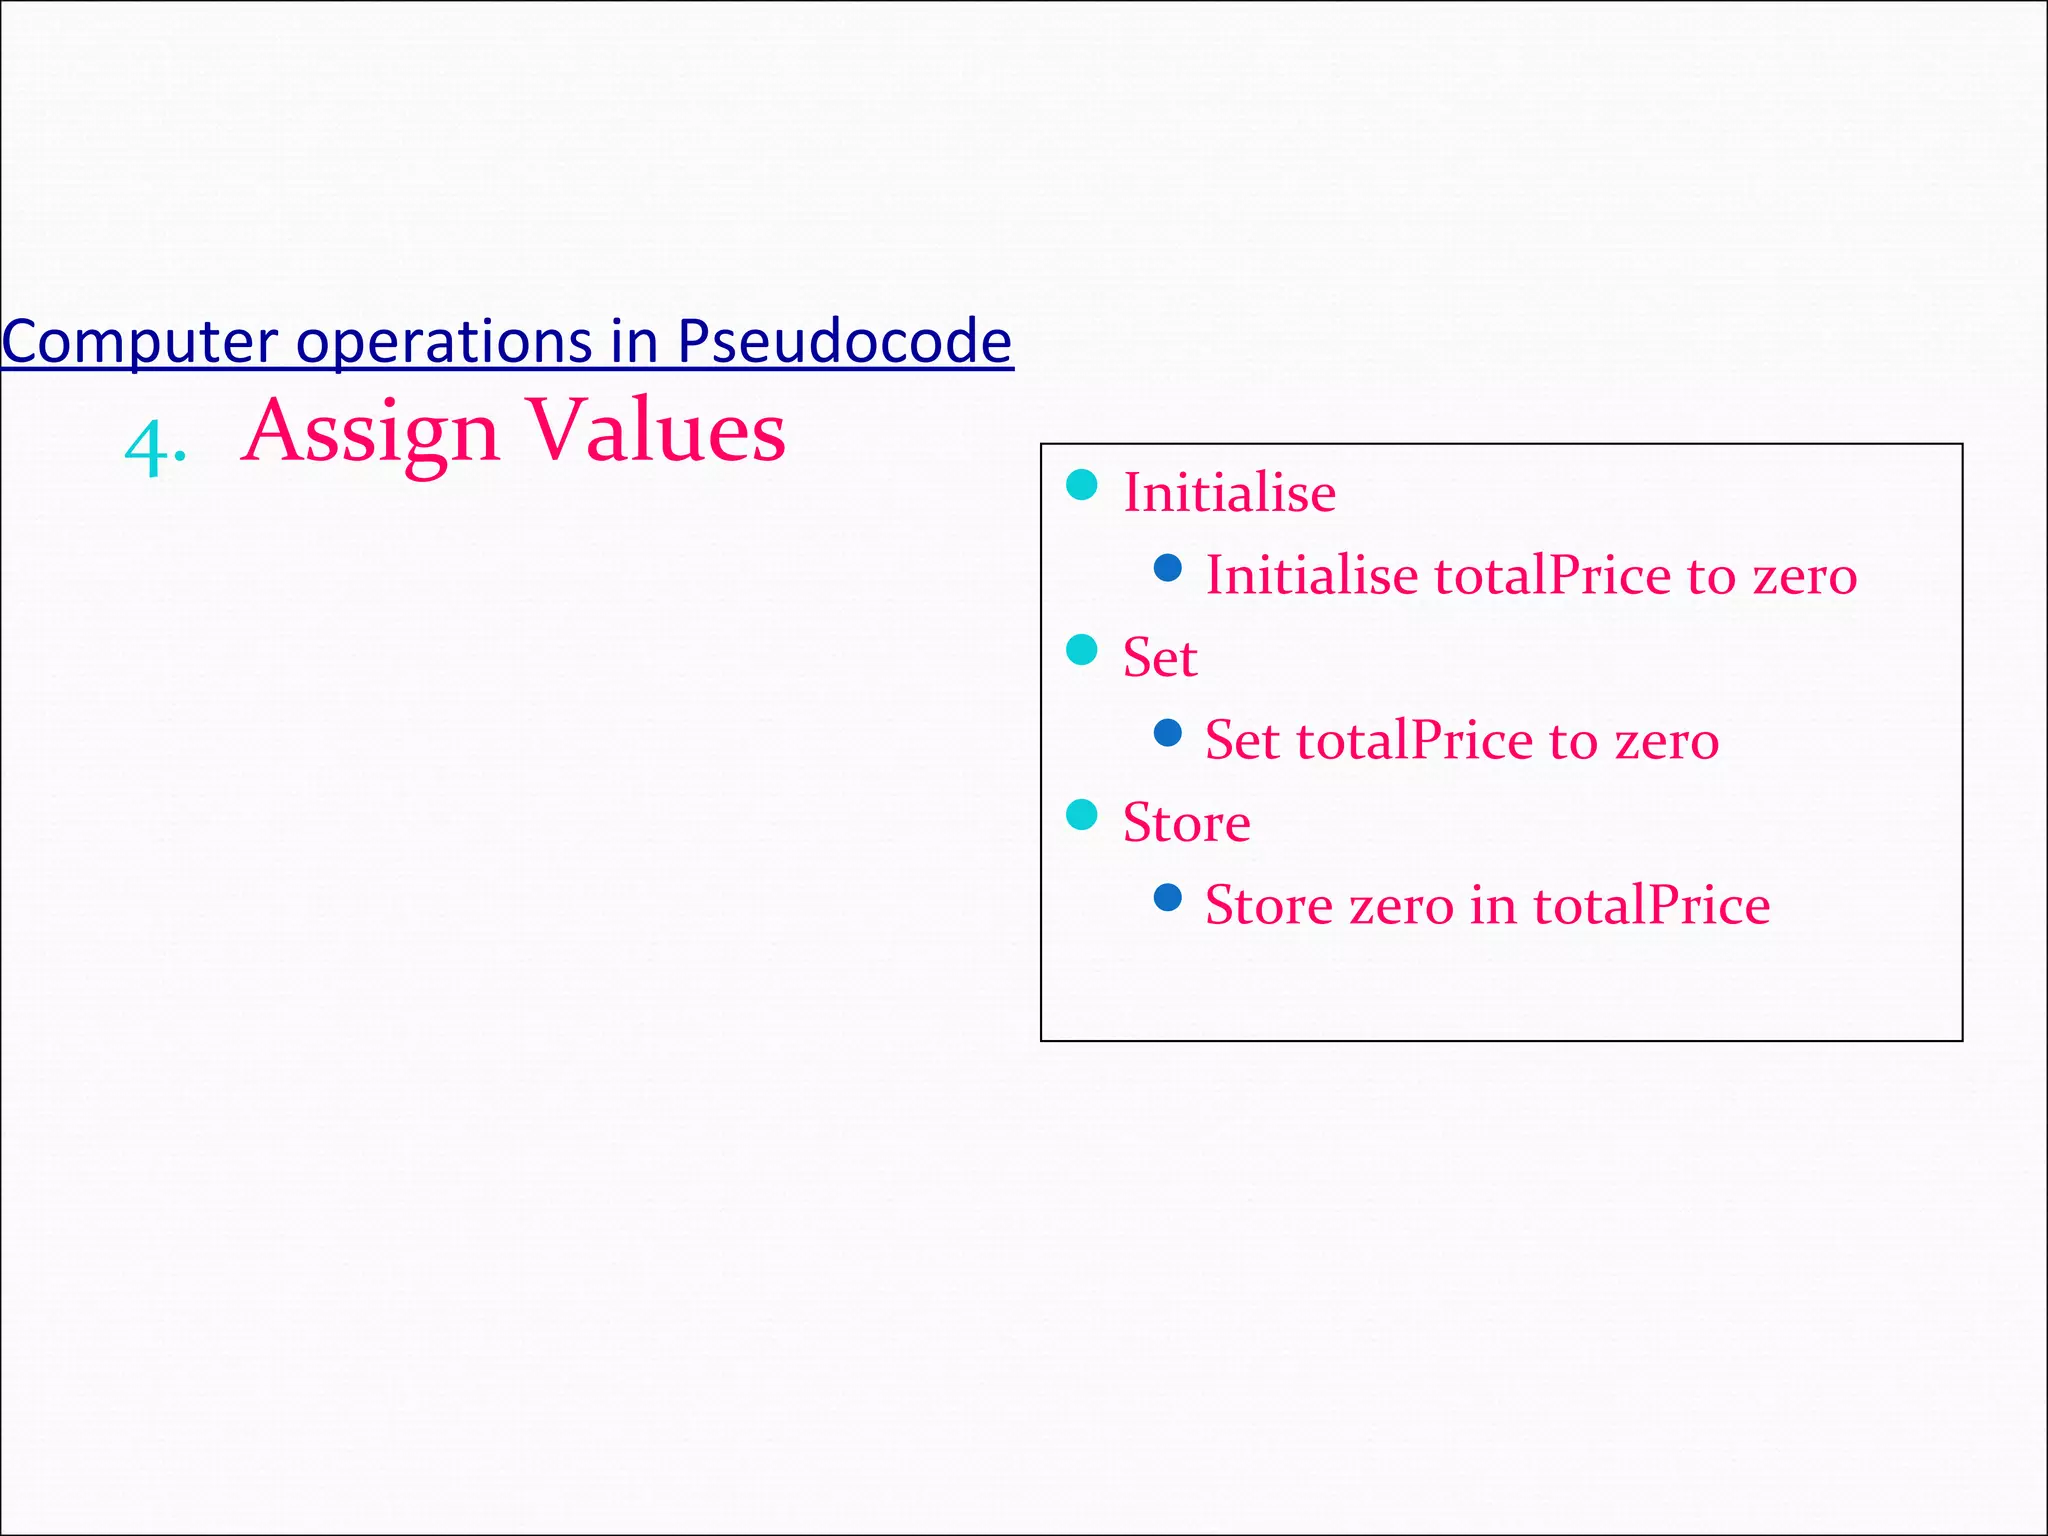
Computer operations inPseudocode 4. Assign Values Initialise Initialise totalPrice to zero Set Set totalPrice to zero Store Store zero in totalPrice
50.
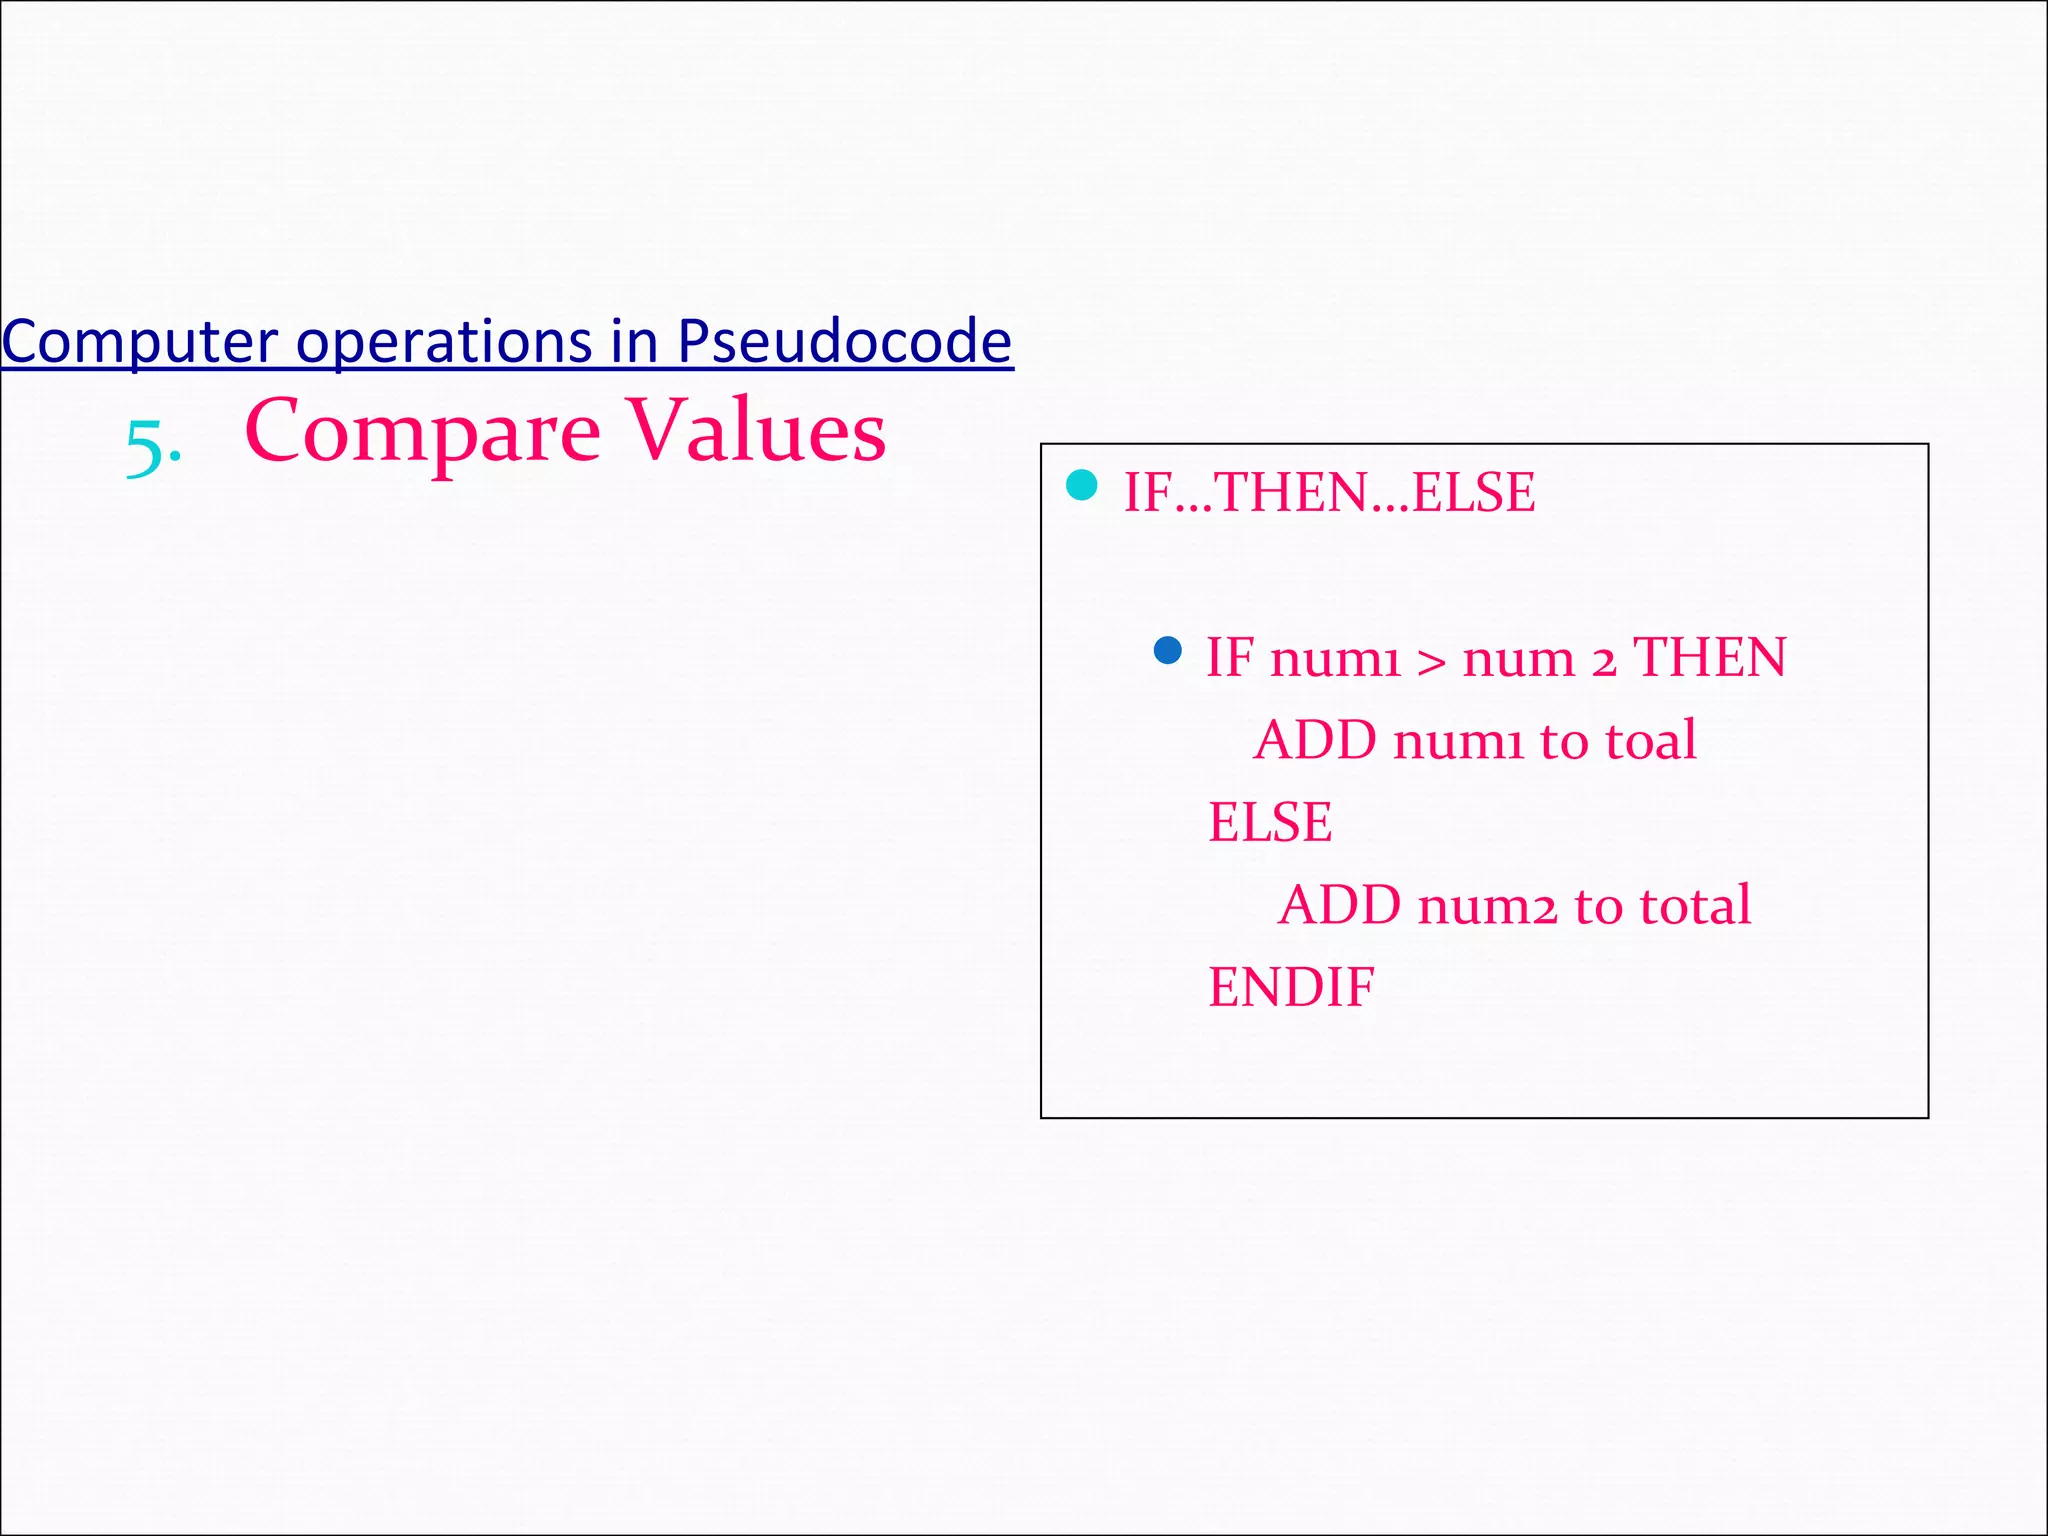
Computer operations inPseudocode 5. Compare Values IF…THEN…ELSE IF num1 > num 2 THEN ADD num1 to toal ELSE ADD num2 to total ENDIF
51.
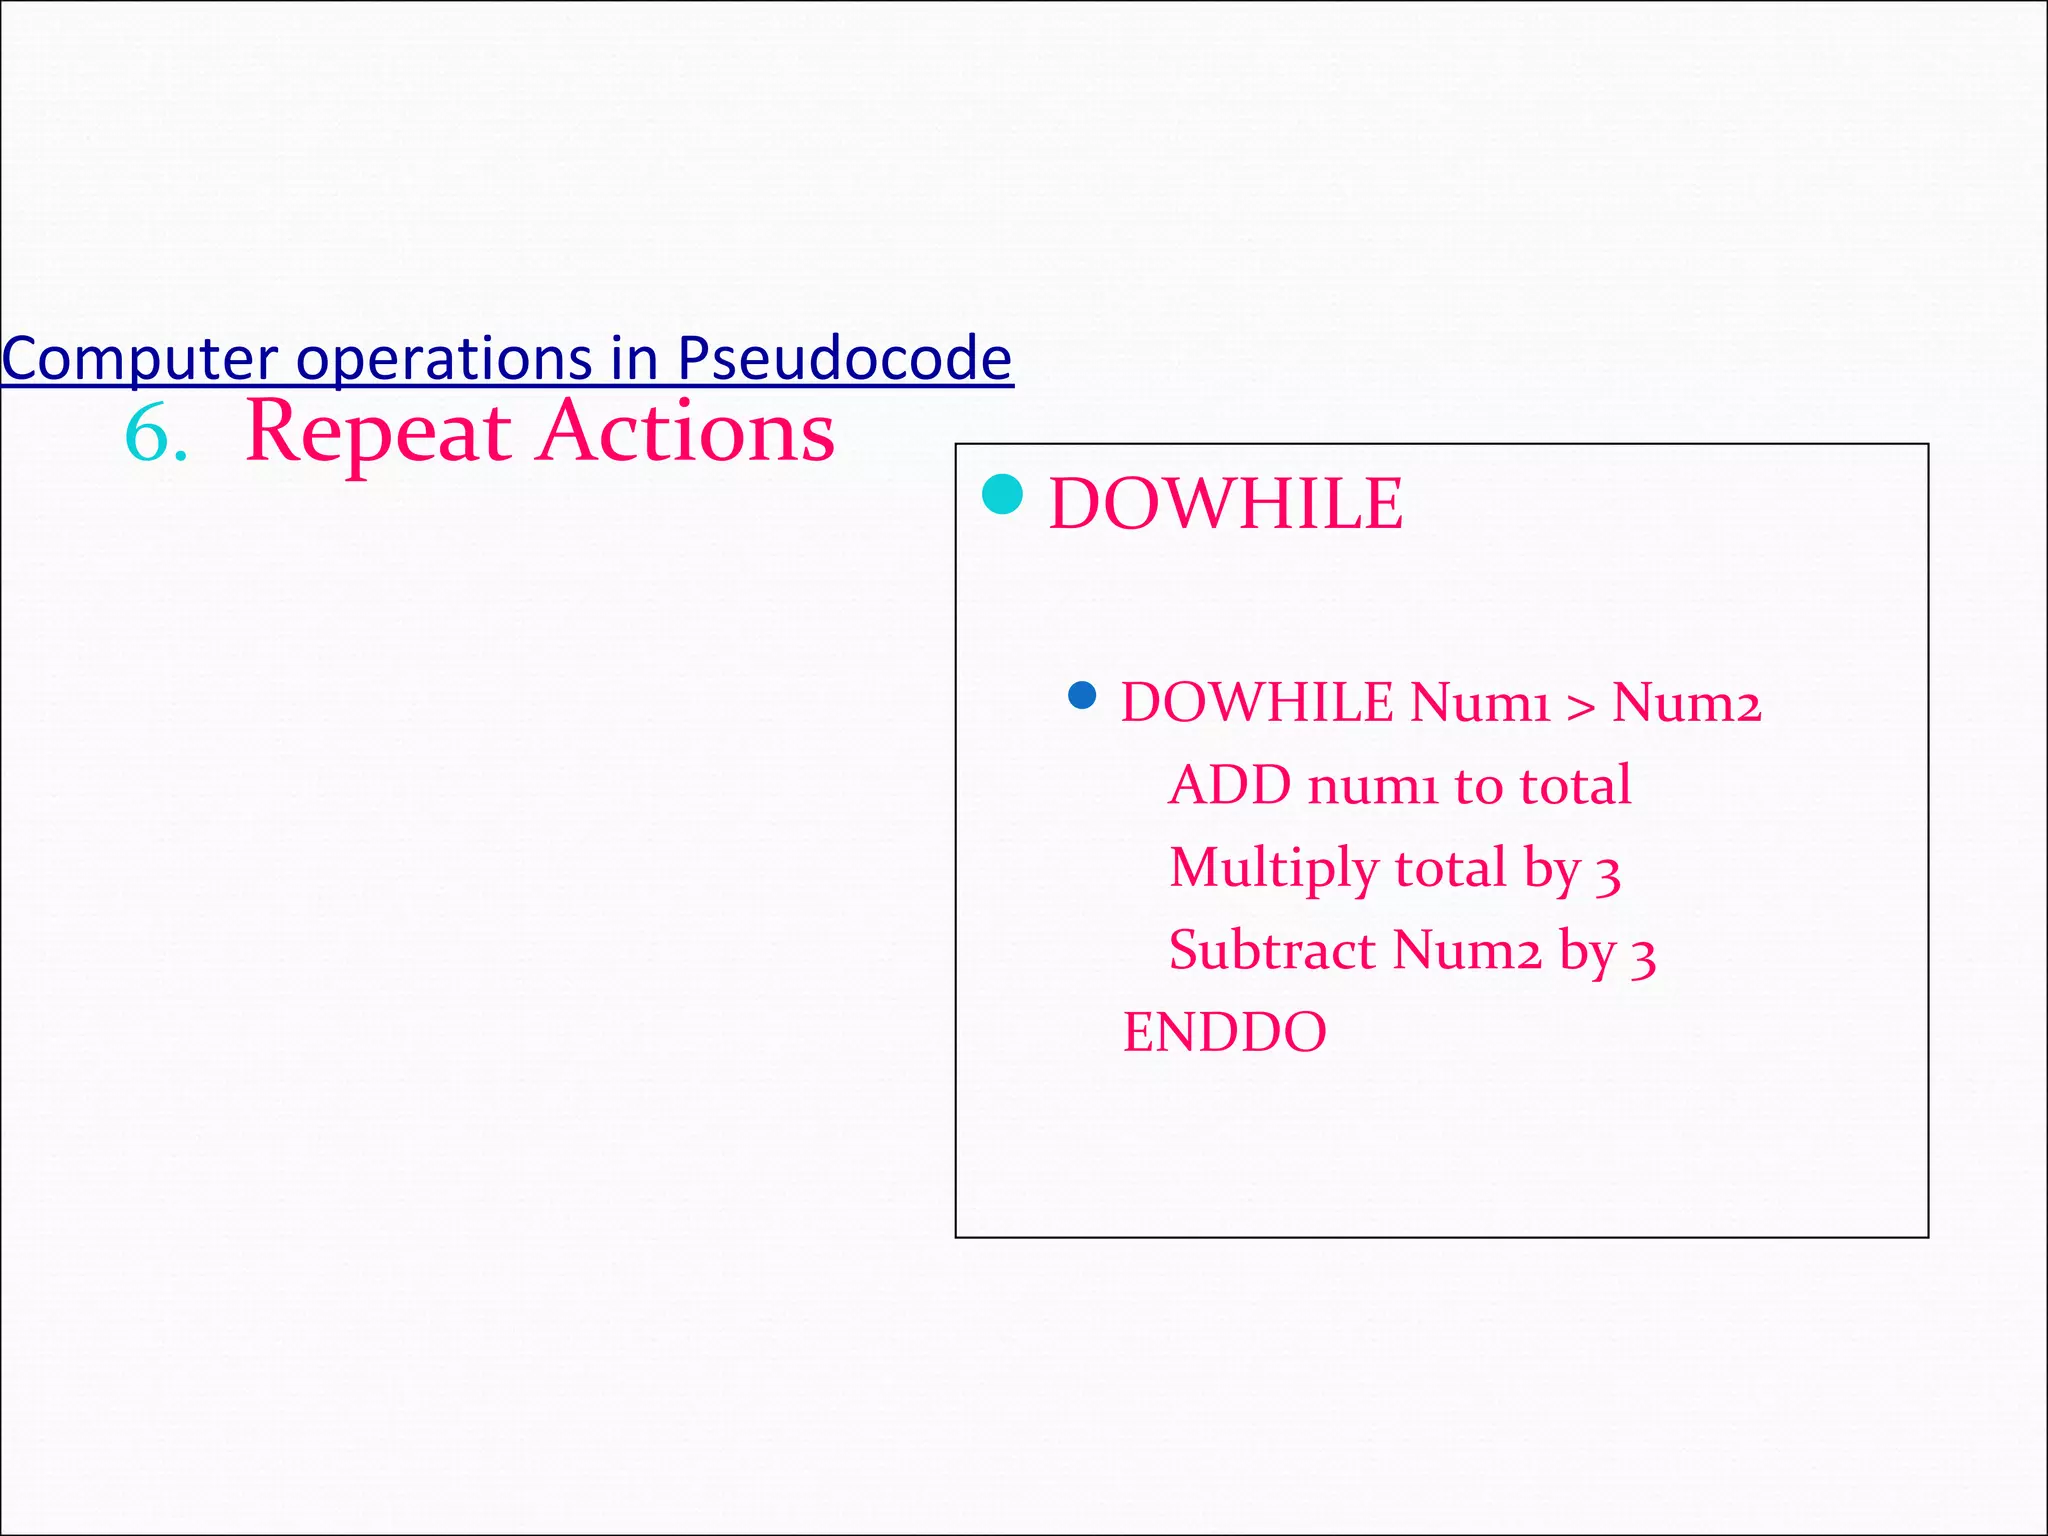
Computer operations inPseudocode 6. Repeat Actions DOWHILE DOWHILE Num1 > Num2 ADD num1 to total Multiply total by 3 Subtract Num2 by 3 ENDDO
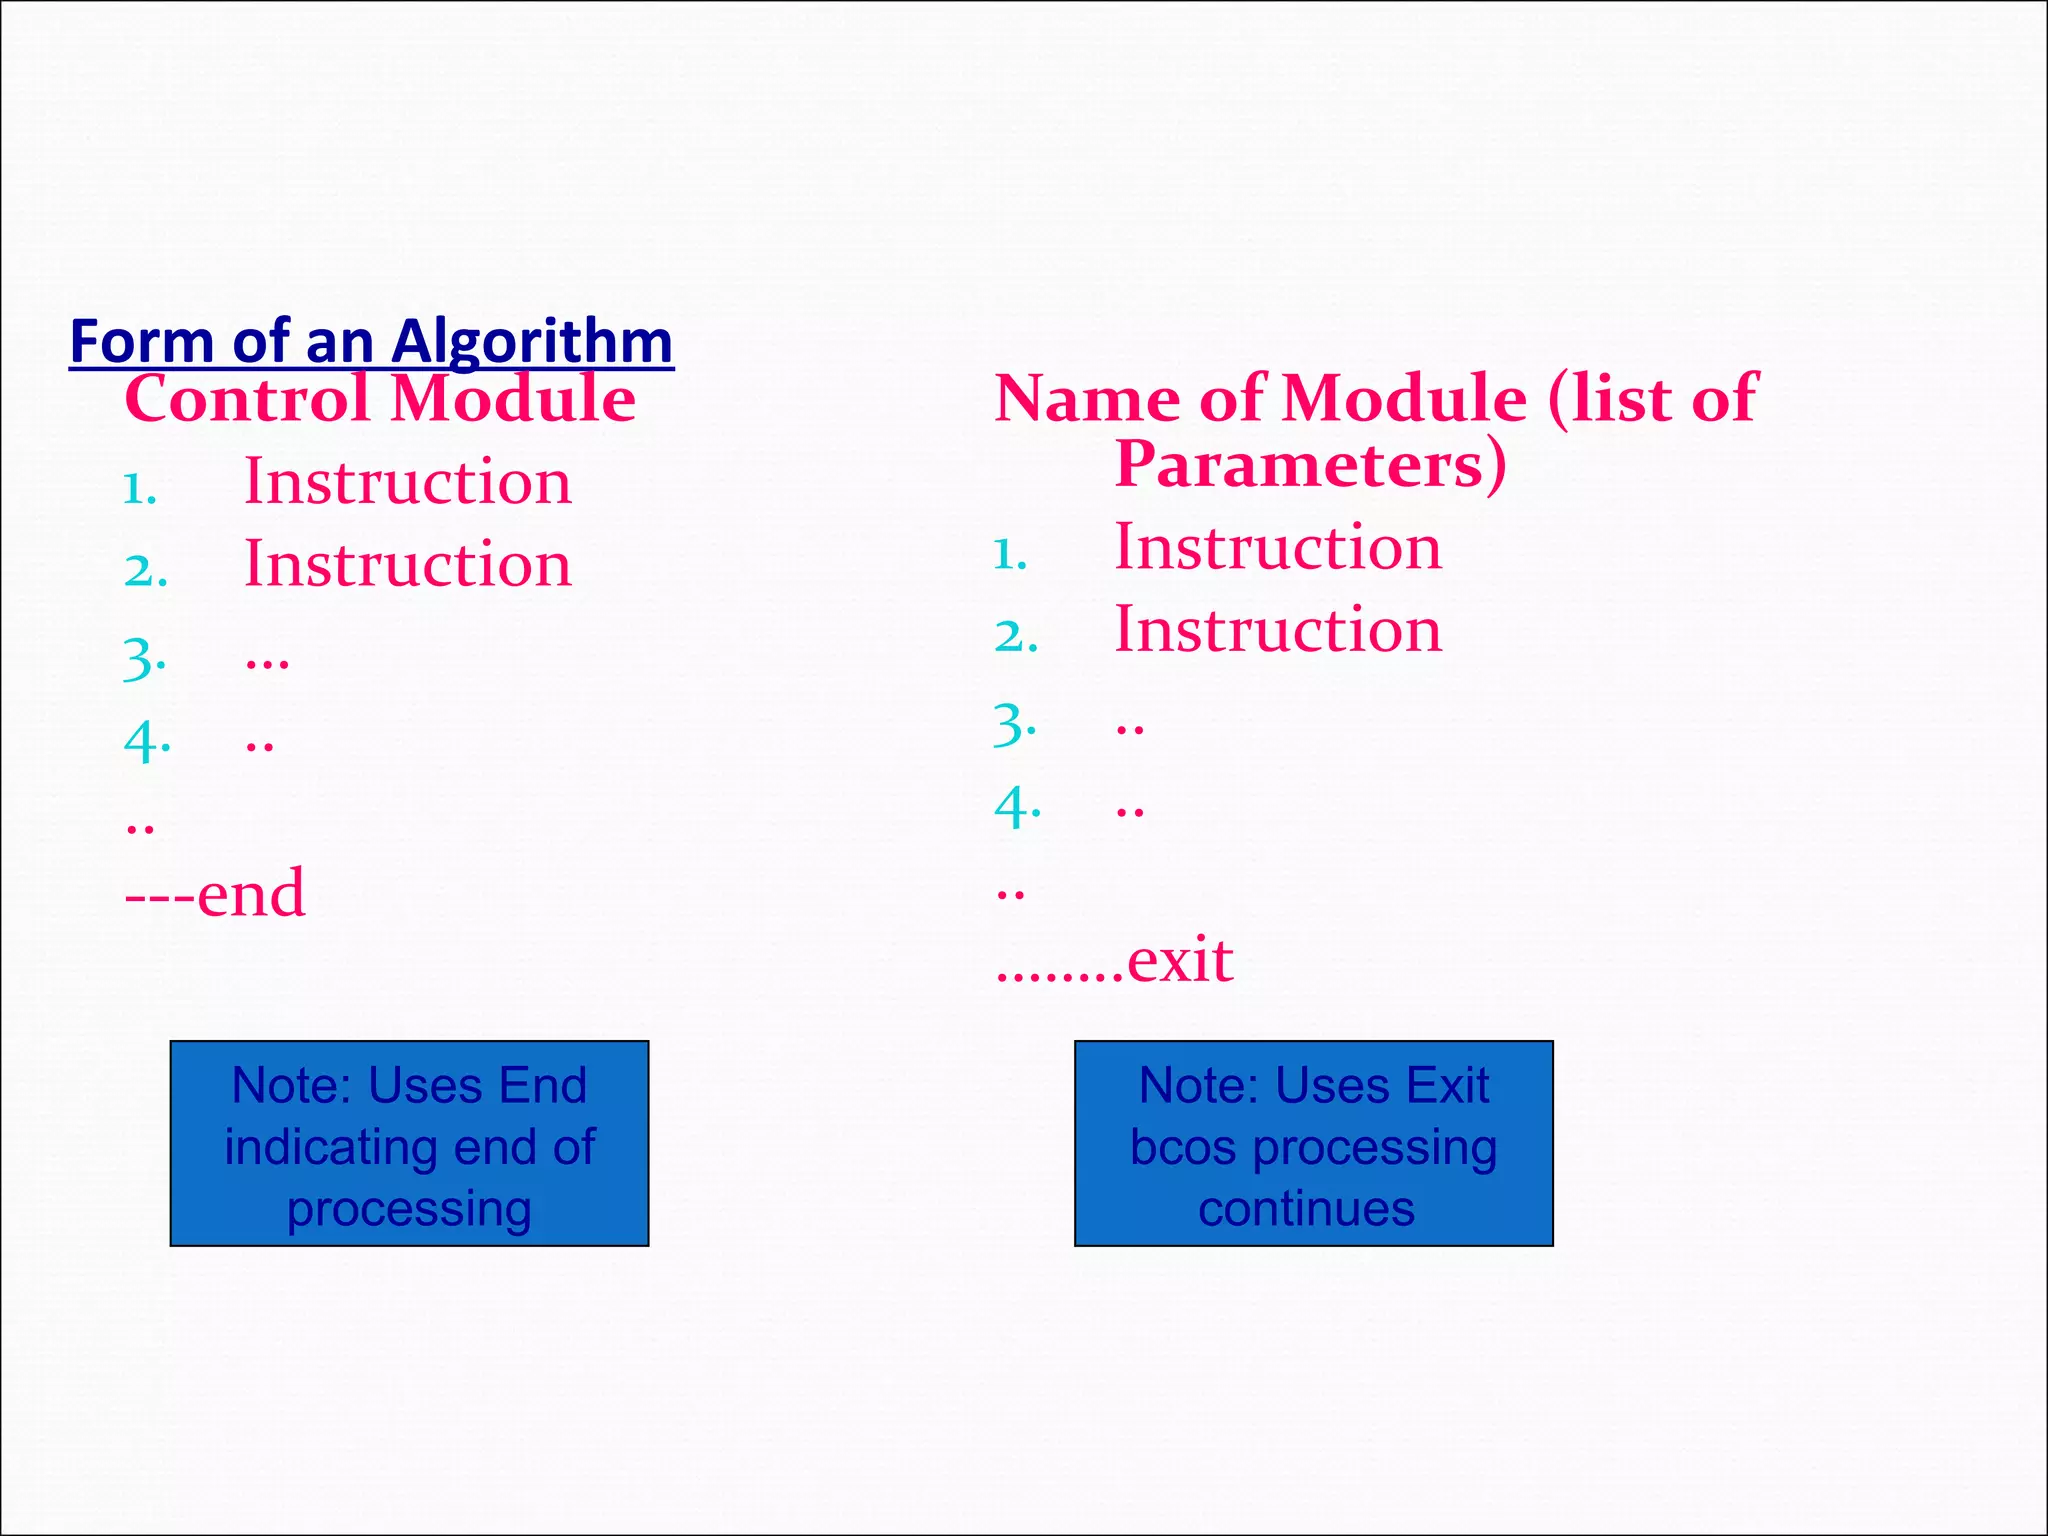
Form of anAlgorithm Control Module 1. Instruction 2. Instruction 3. … 4. .. .. ---end Name of Module (list of Parameters) 1. Instruction 2. Instruction 3. .. 4. .. .. ……..exit Note: Uses End indicating end of processing Note: Uses Exit bcos processing continues
54.
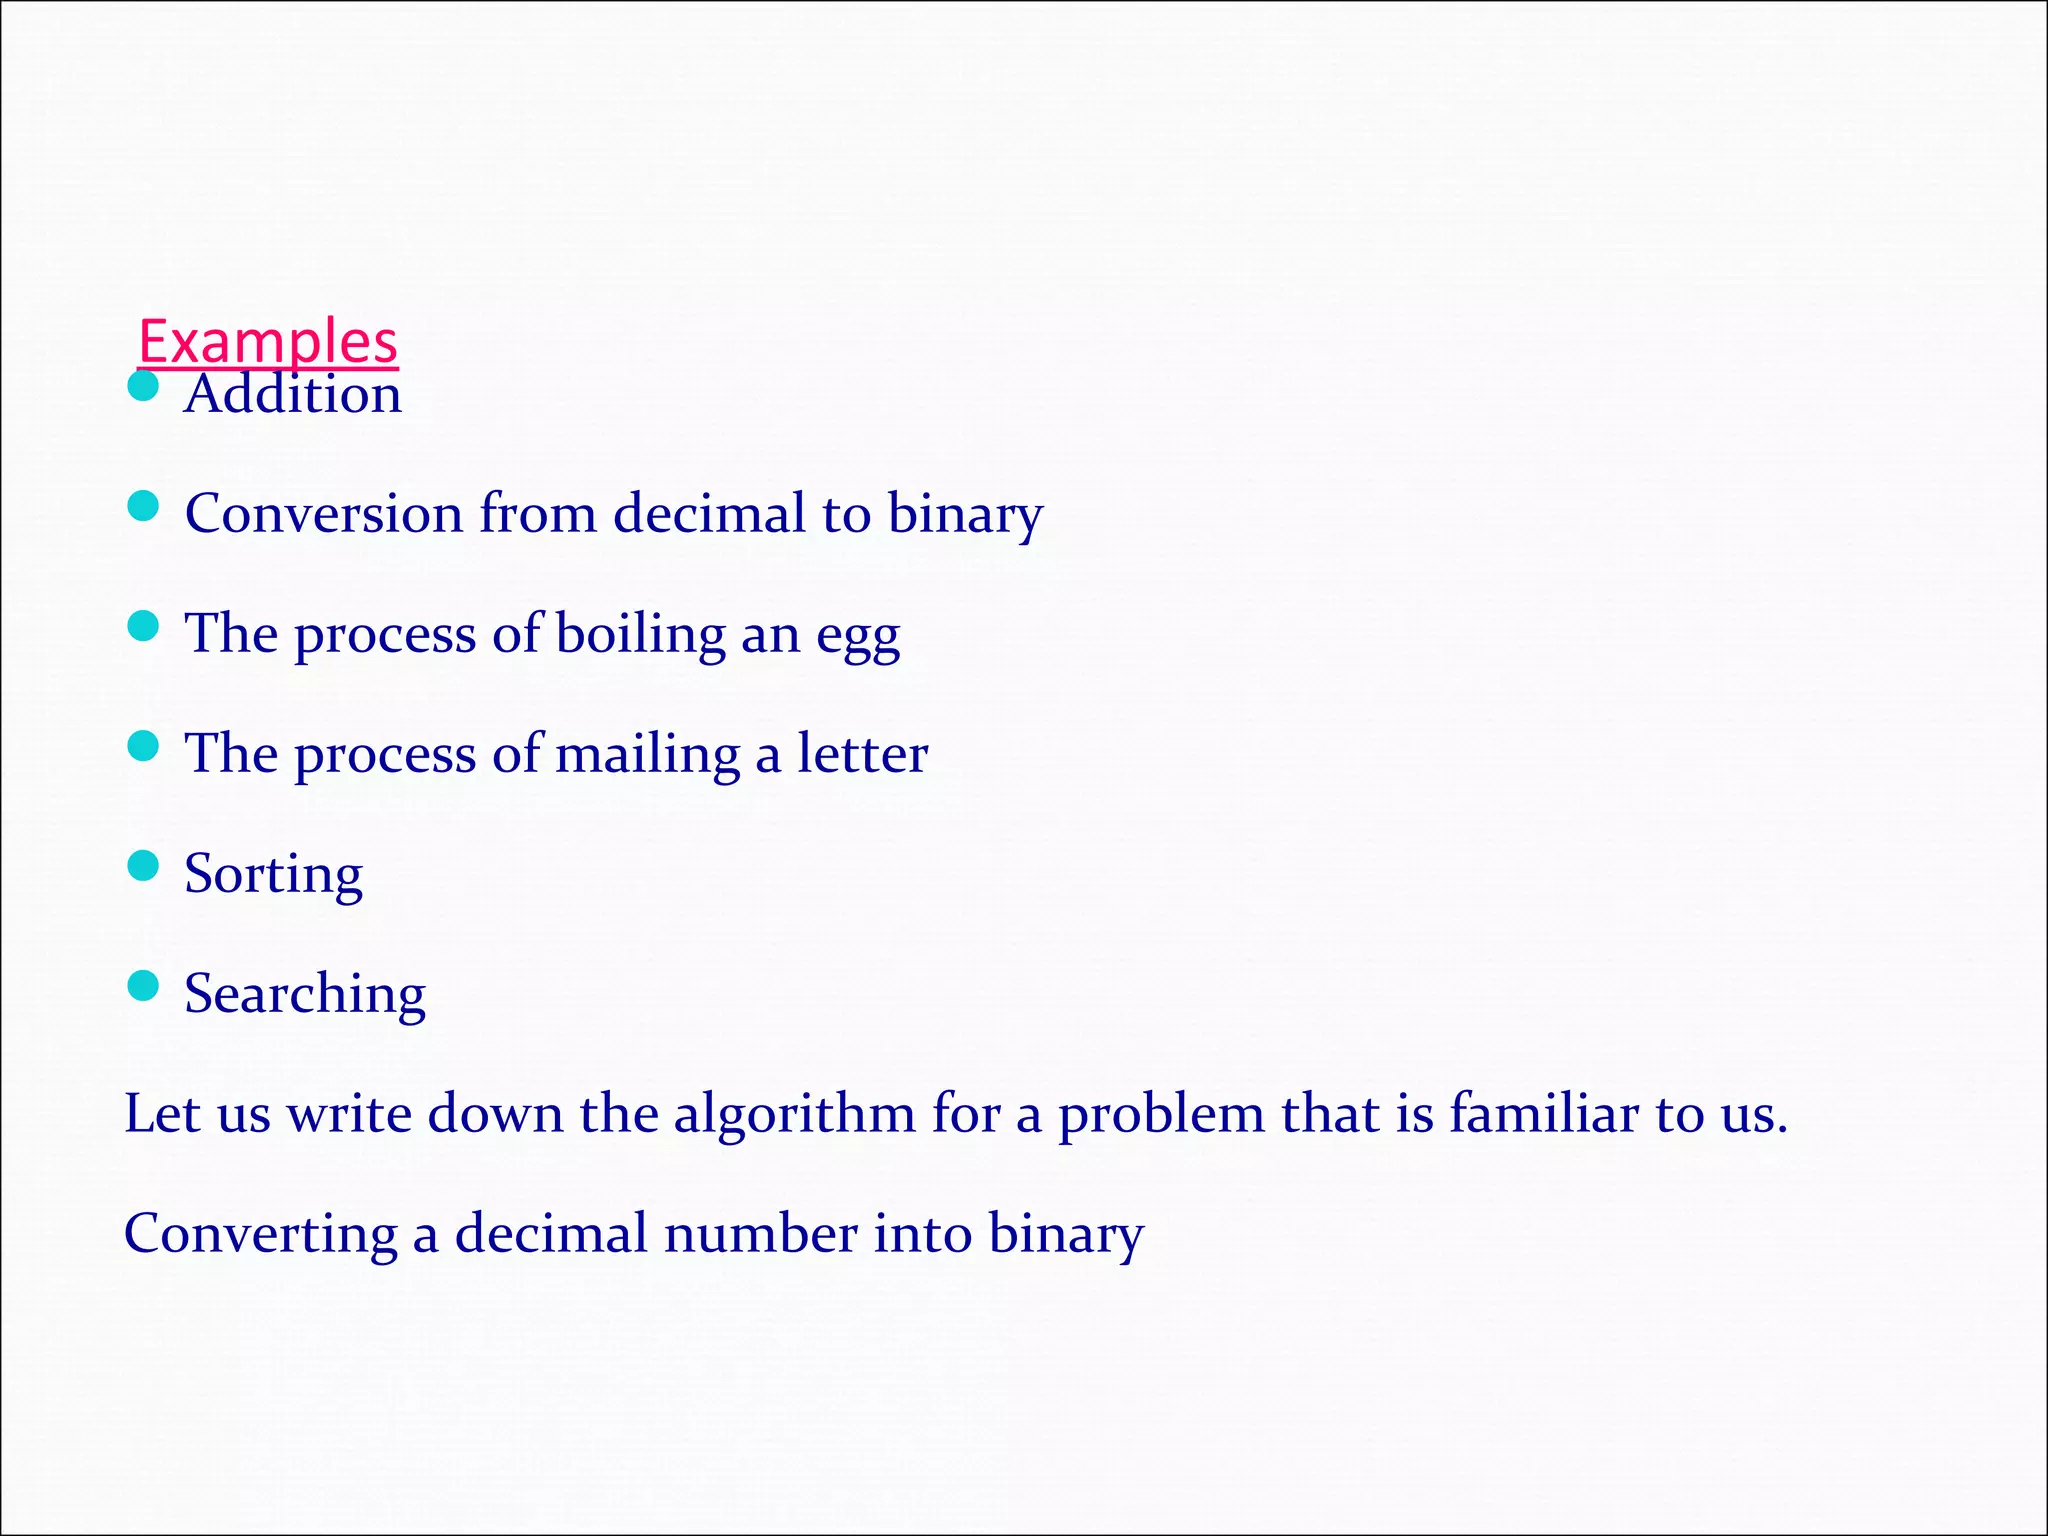
Examples Addition Conversion from decimalto binary The process of boiling an egg The process of mailing a letter Sorting Searching Let us write down the algorithm for a problem that is familiar to us. Converting a decimal number into binary
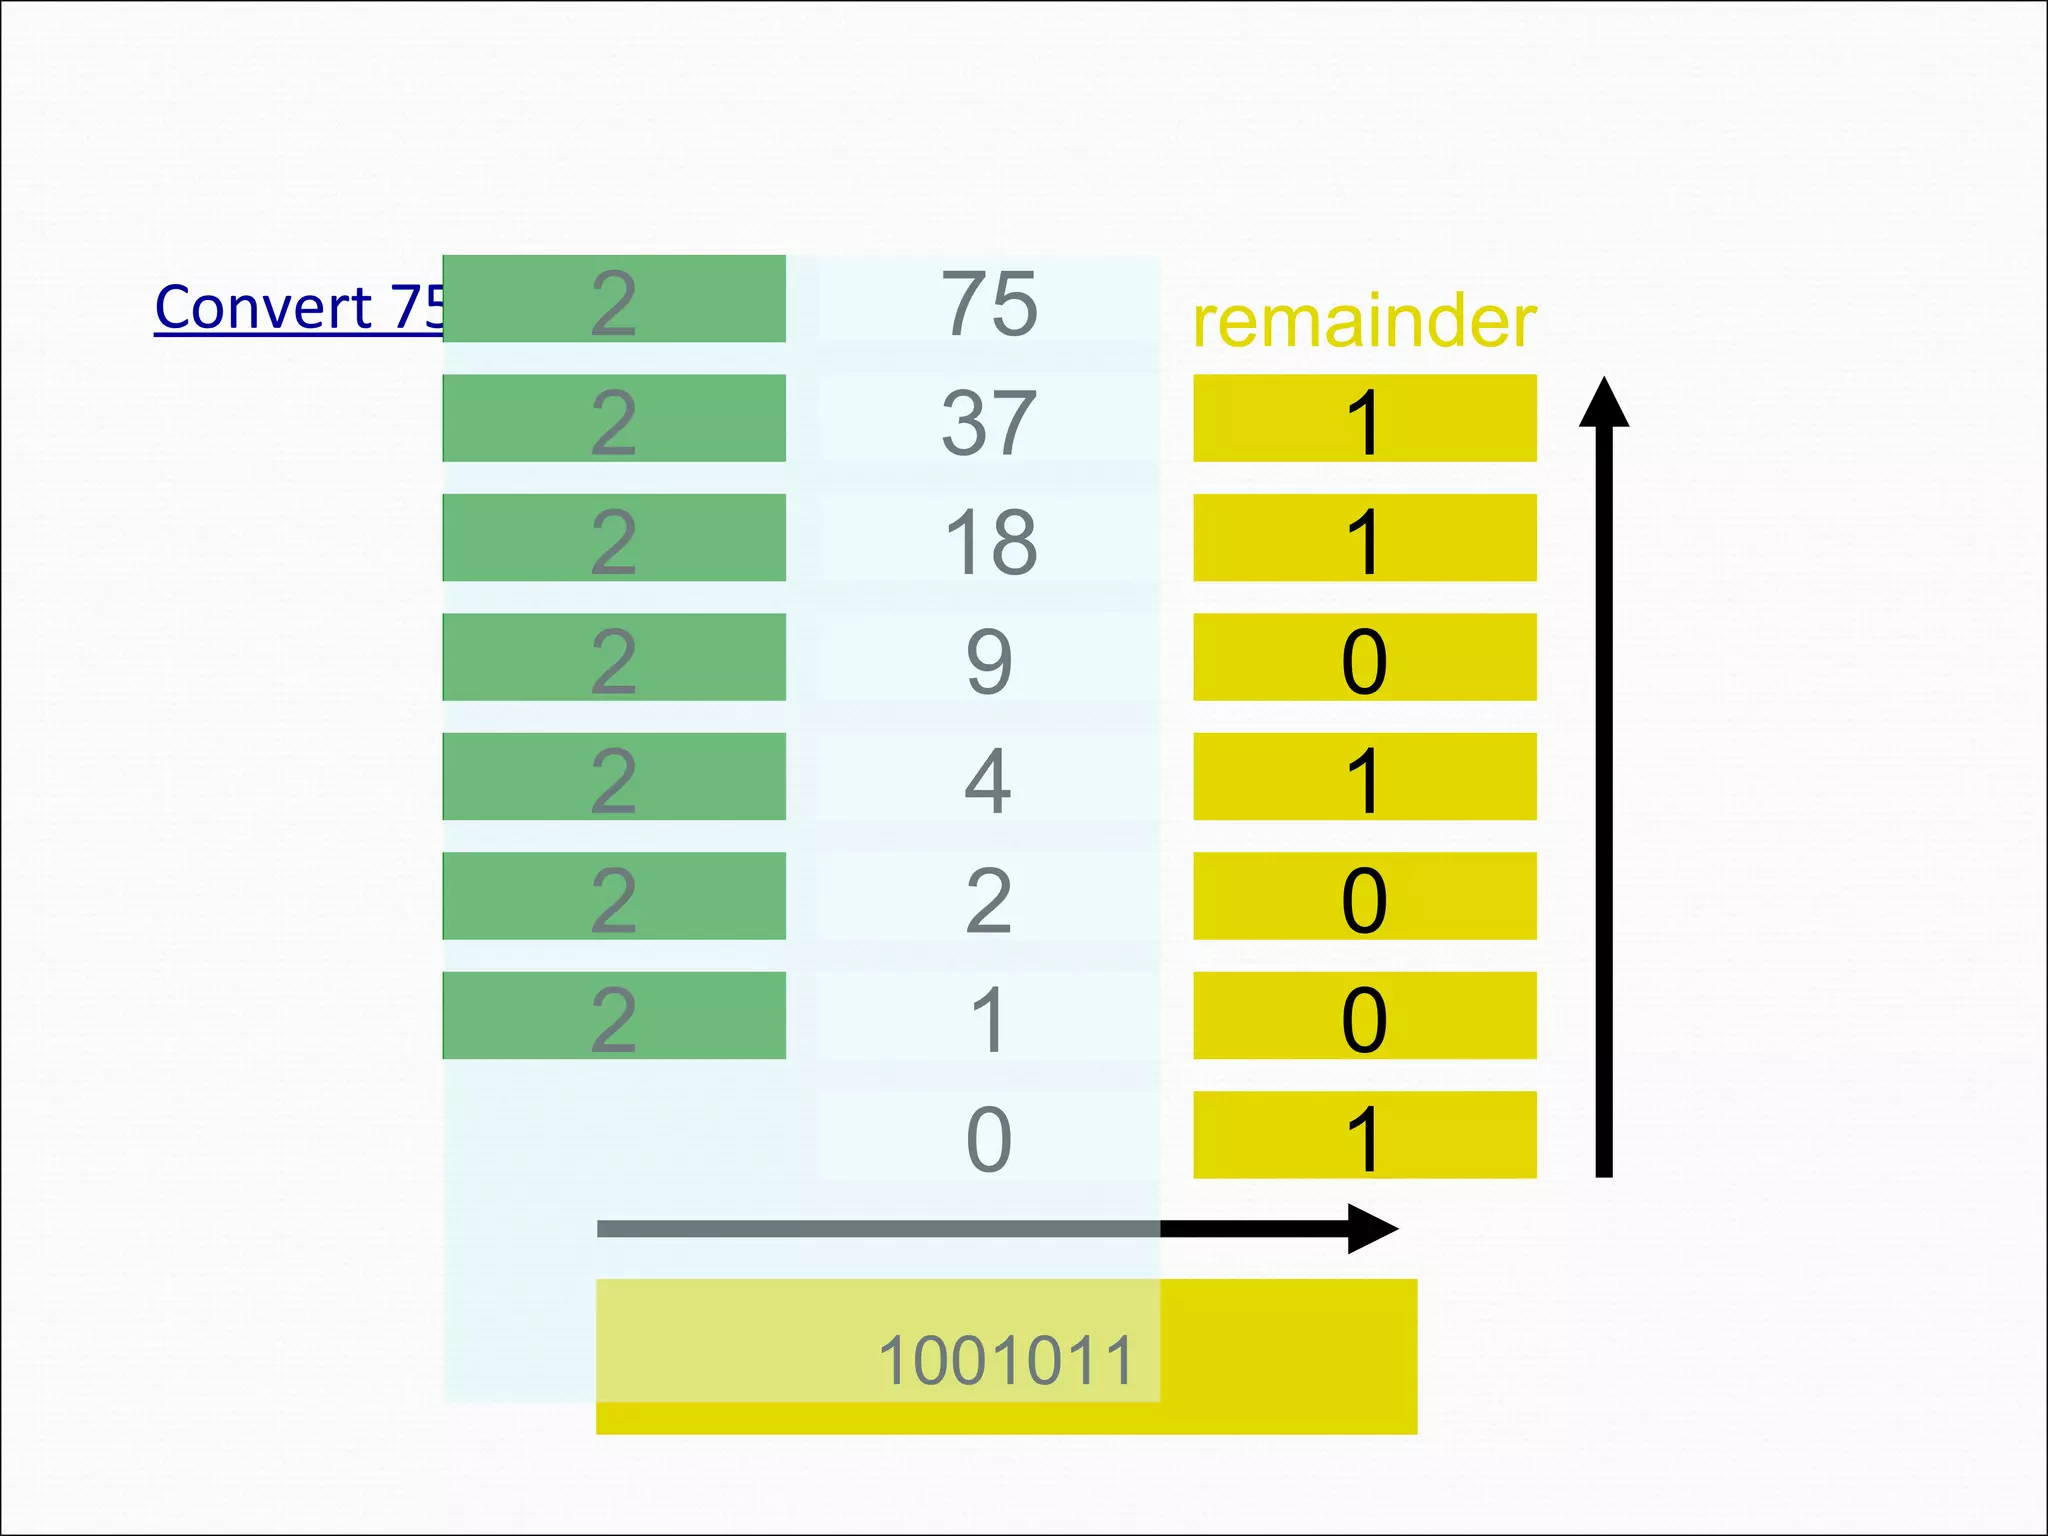
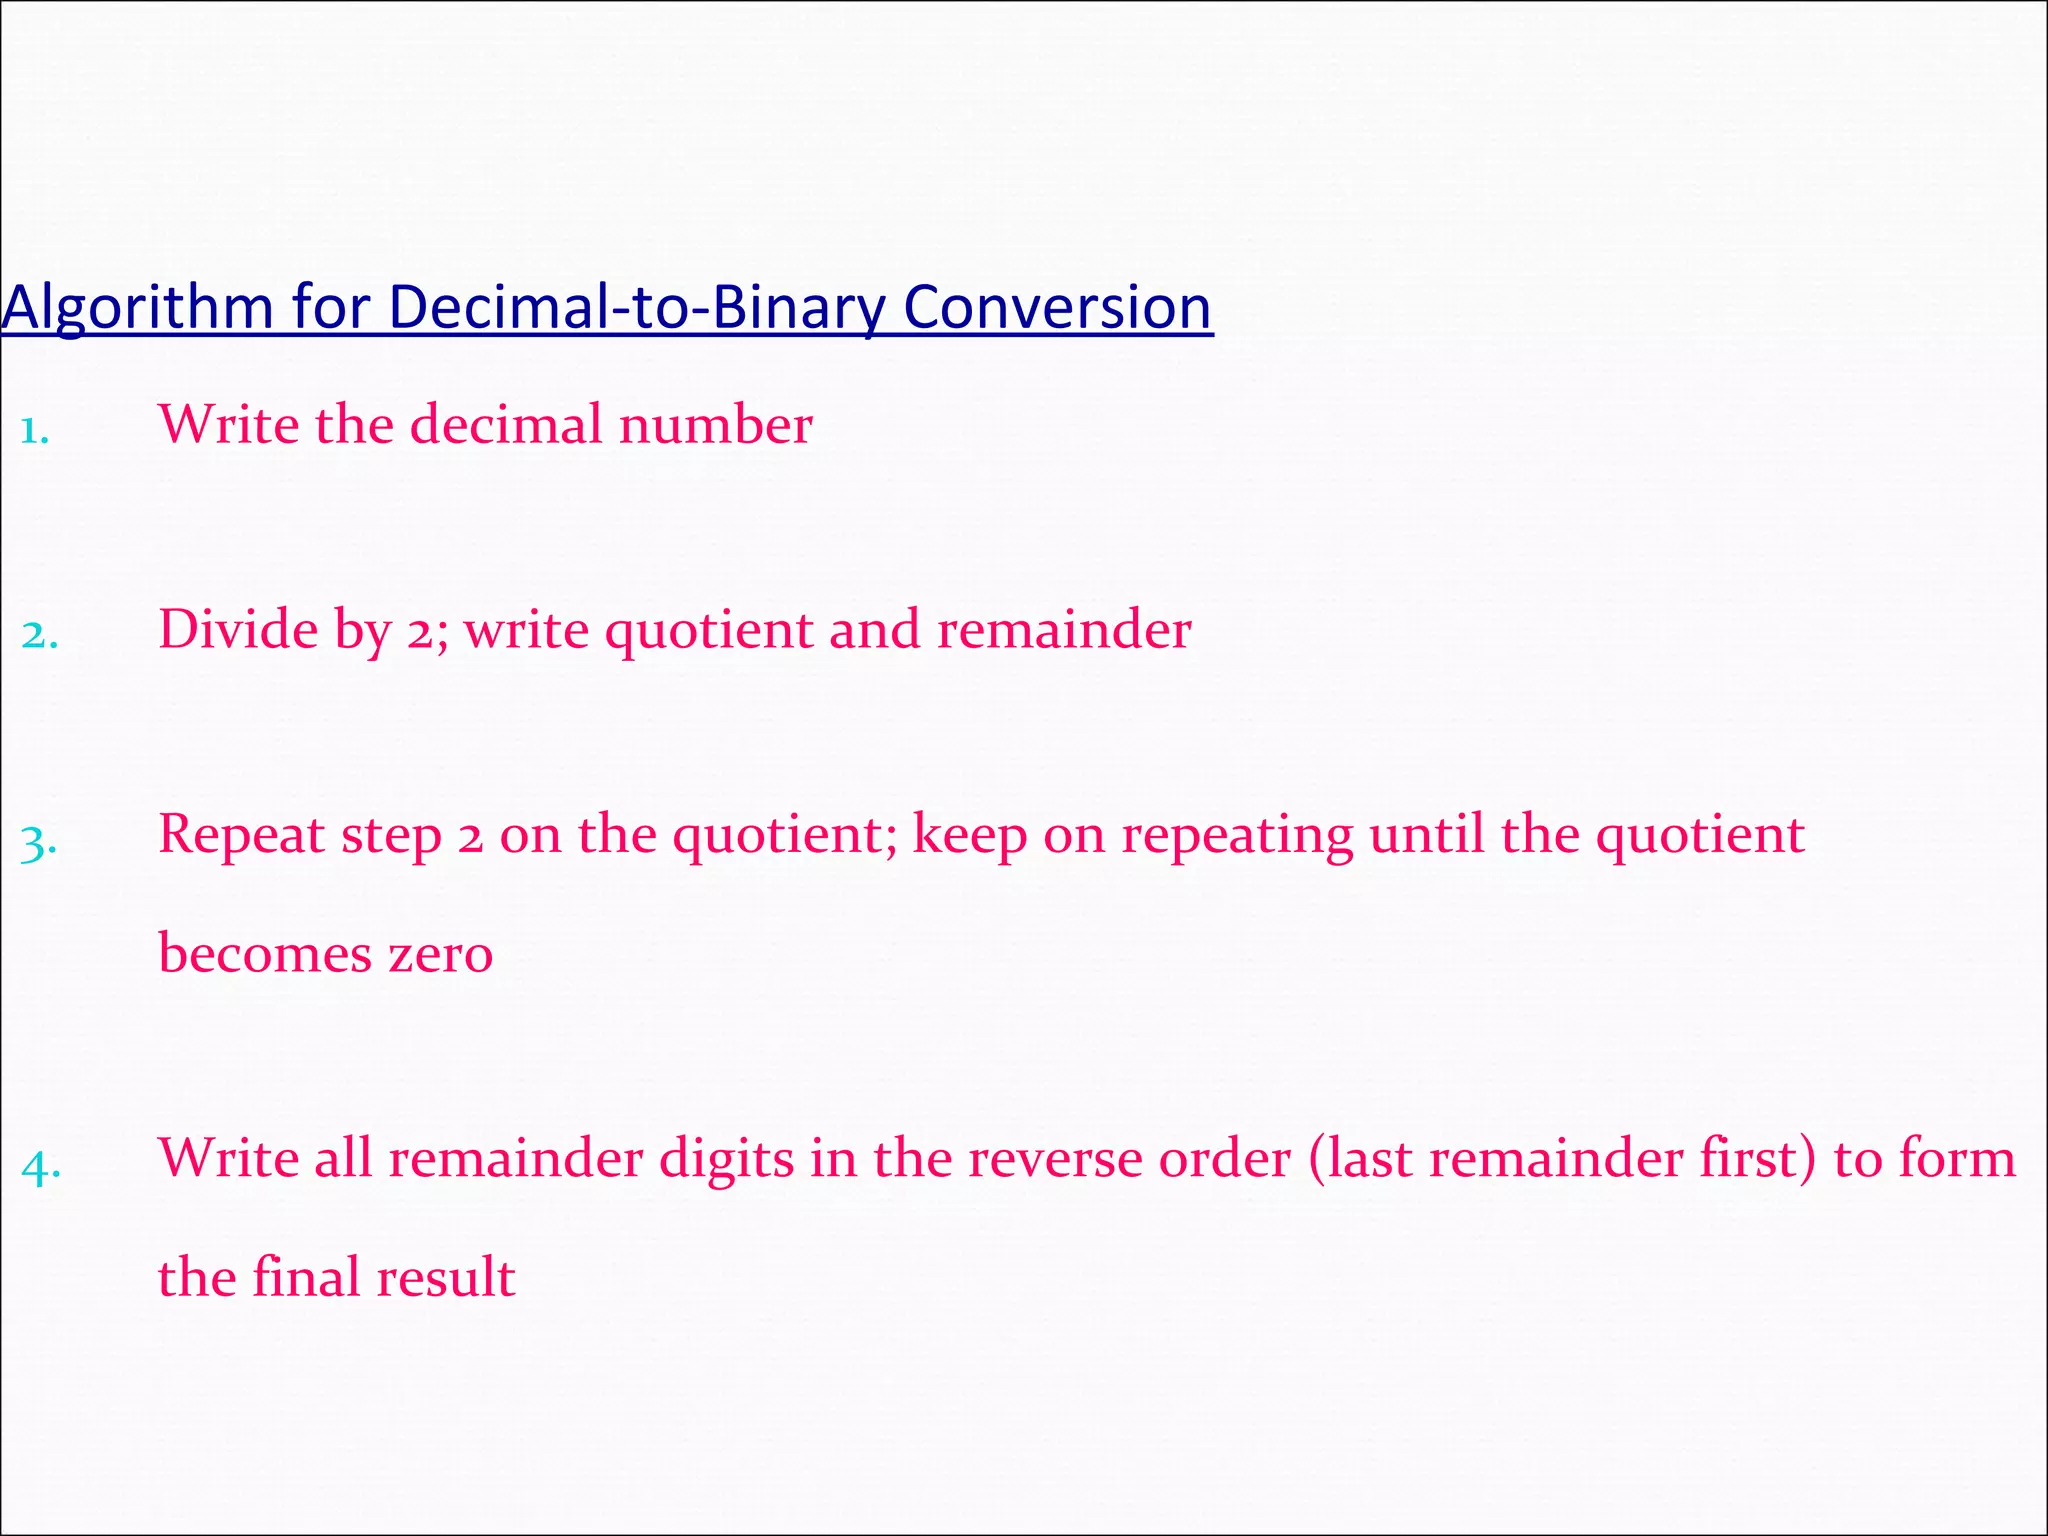
Algorithm for Decimal-to-BinaryConversion 1. Write the decimal number 2. Divide by 2; write quotient and remainder 3. Repeat step 2 on the quotient; keep on repeating until the quotient becomes zero 4. Write all remainder digits in the reverse order (last remainder first) to form the final result
57.
Points to Note 1.The process consists of repeated application of simple steps 2. All steps are unambiguous (clearly defined) 3. We are capable of doing all those steps 4. Only a limited no. of steps needs to be taken 5. Once all those steps are taken according to the prescribed sequence, the required result will be found 6. Moreover, the process will stop at that point
58.
Algorithm (Better Definition) 1st Definition: Sequenceof steps that can be taken to solve a problem Better Definition: A precise sequence of a limited number of unambiguous, executable steps that terminates in the form of a solution
59.
Three Requirements 1. Sequenceis: a. Precise b. Consists of a limited number of steps 2. Each step is: a. Unambiguous b. Executable 3. The sequence of steps terminates in the form of a solution
60.
Origin of theTerm “Algorithm” The name derives from the title of a Latin book: Algoritmi de numero Indorum That book was a translation of an Arabic book: Al-Khwarizmi Concerning the Hindu Art of Reckoning That book was written by the famous 9-th century Muslim mathematician, Muhammad ibn Musa al-Khwarizmi
61.
Pseudo Code Language thatis typically used for writing algorithms Similar to a programming language, but not as rigid The method of expression most suitable for a given situation is used: At times, plain English At others, a programming language like syntax
62.
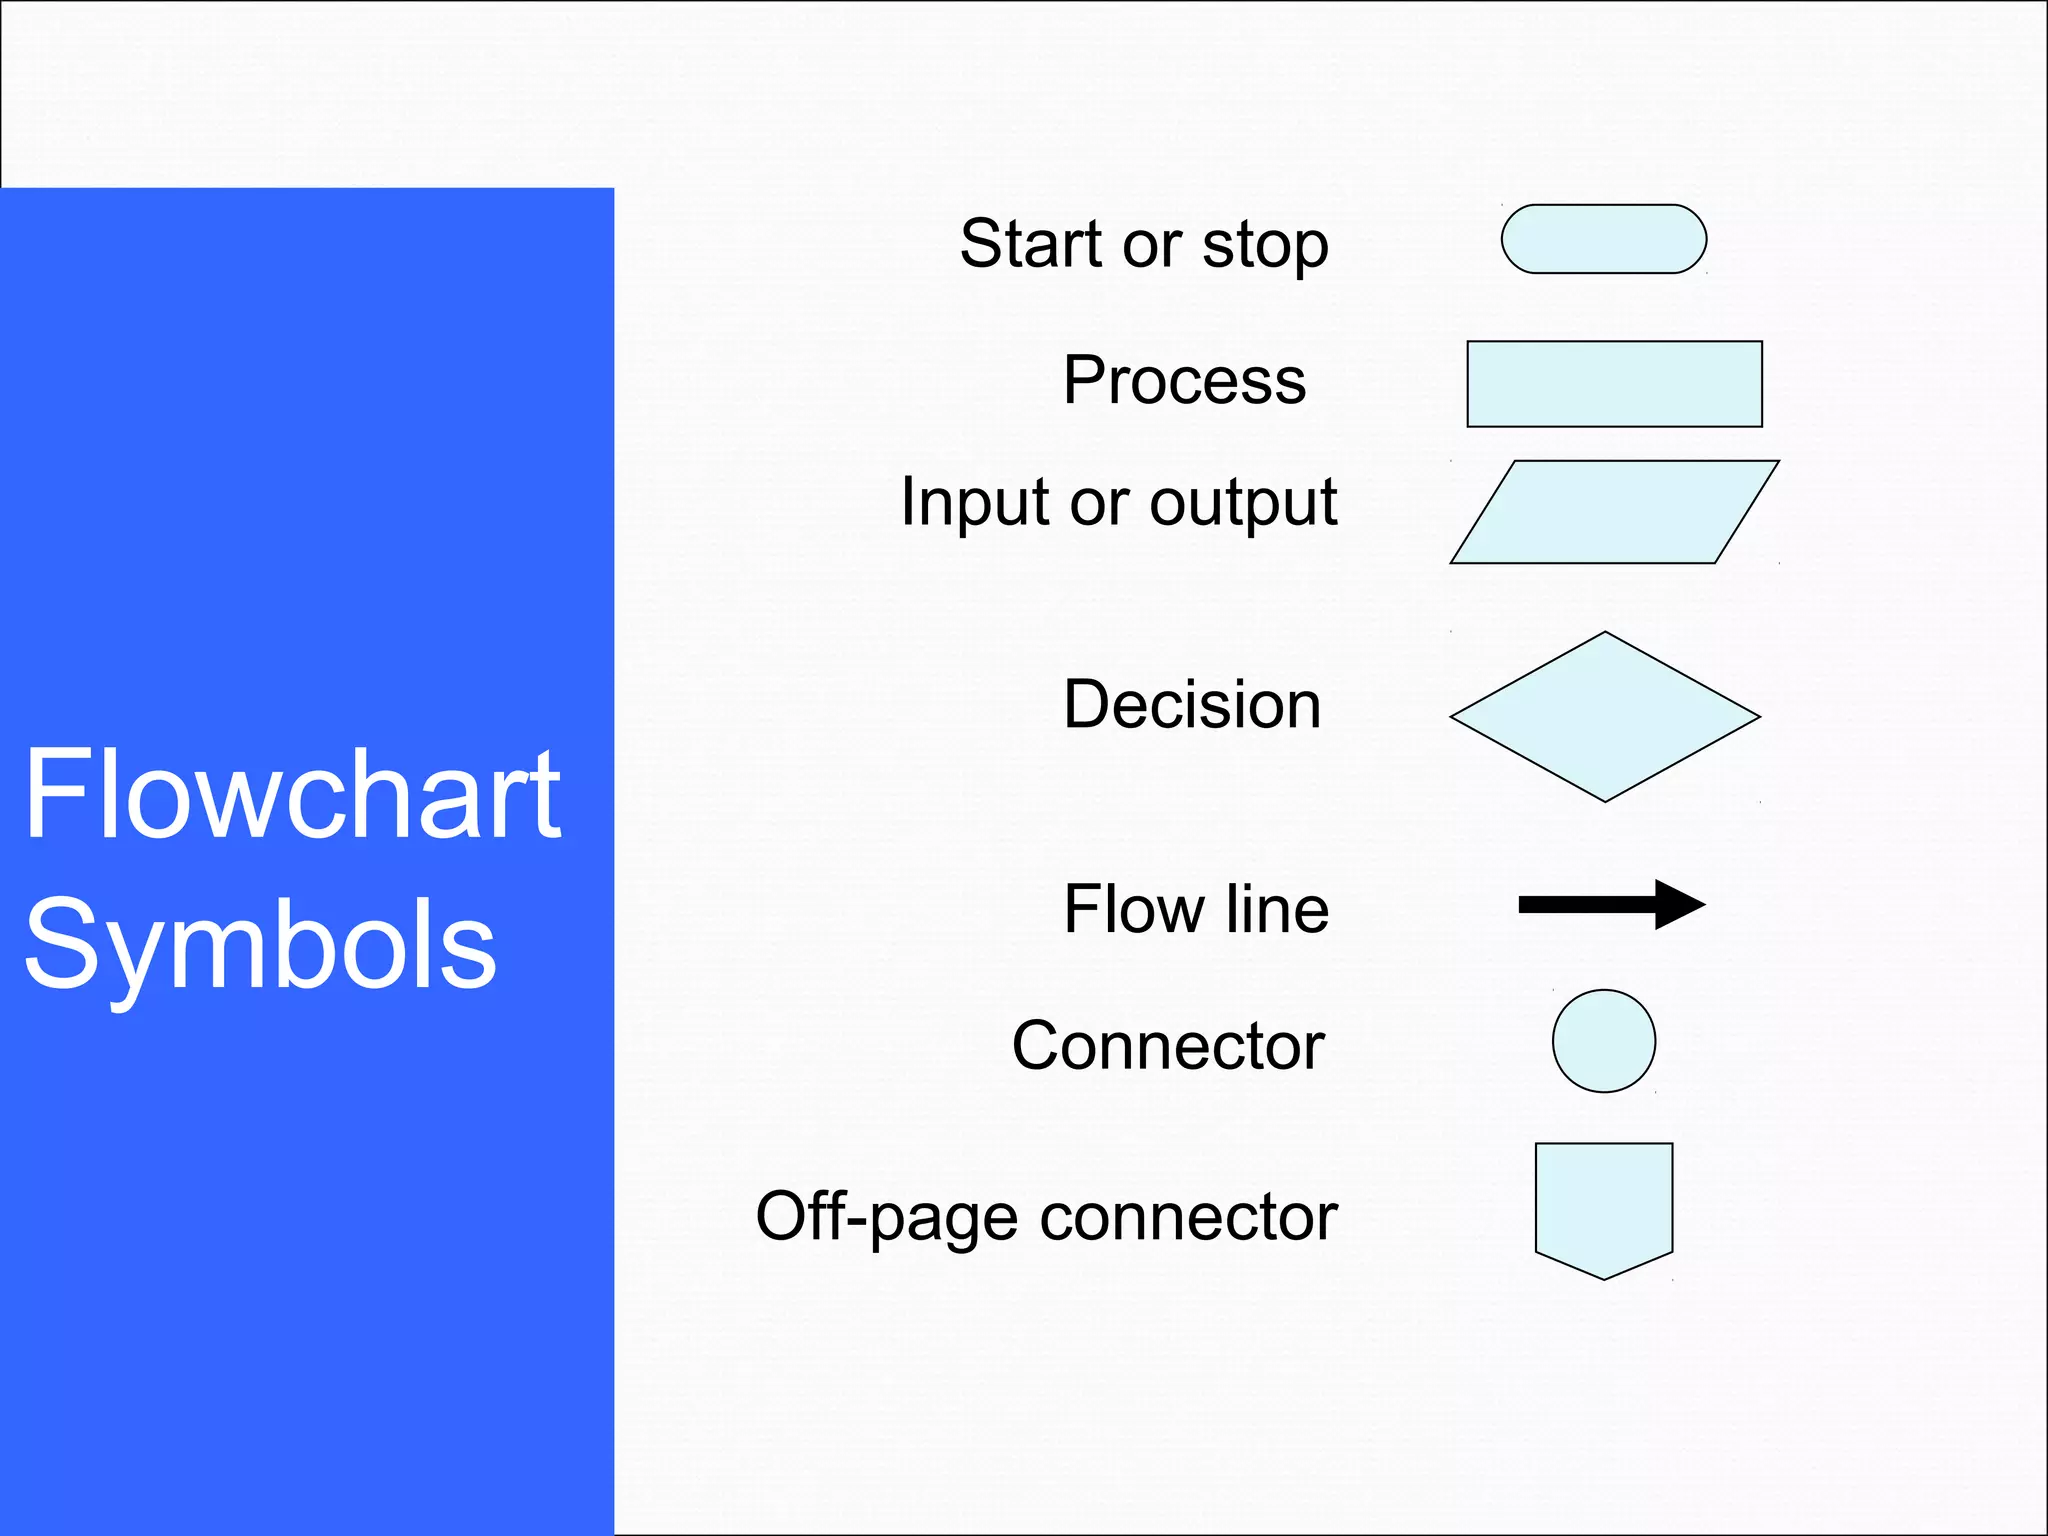
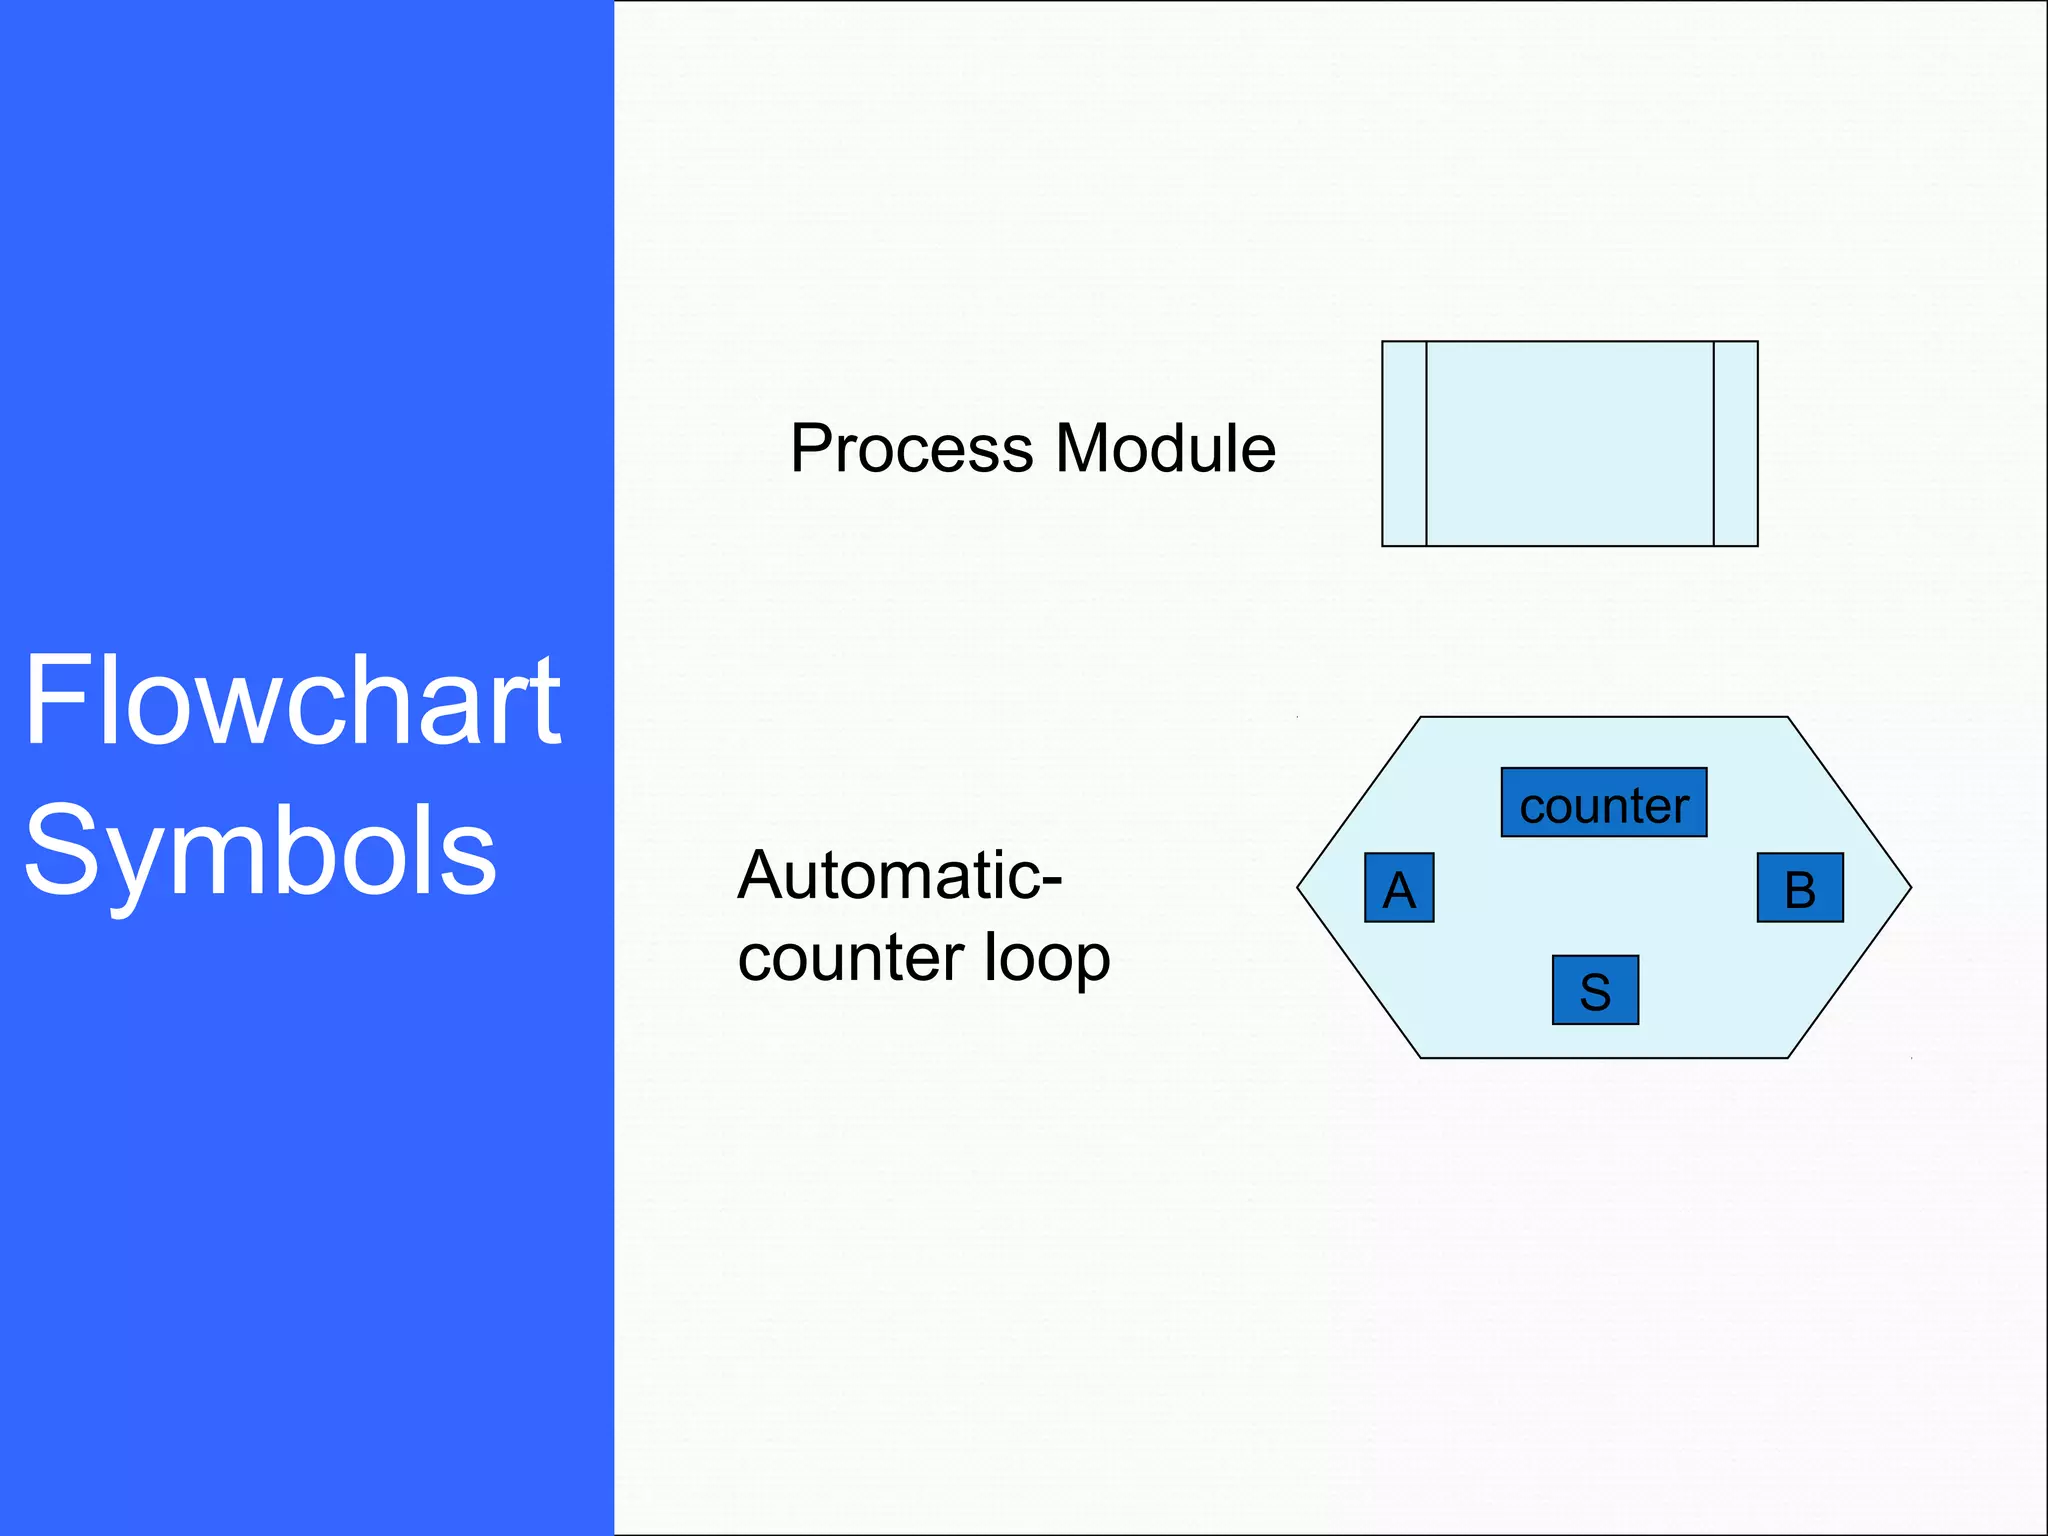
Flowchart A graphical representationof a process (e.g. an algorithm), in which graphic objects are used to indicate the steps & decisions that are taken as the process moves along from start to finish. Individual steps are represented by boxes and other shapes on the flowchart, with arrows between those shapes indicating the order in which the steps are taken.
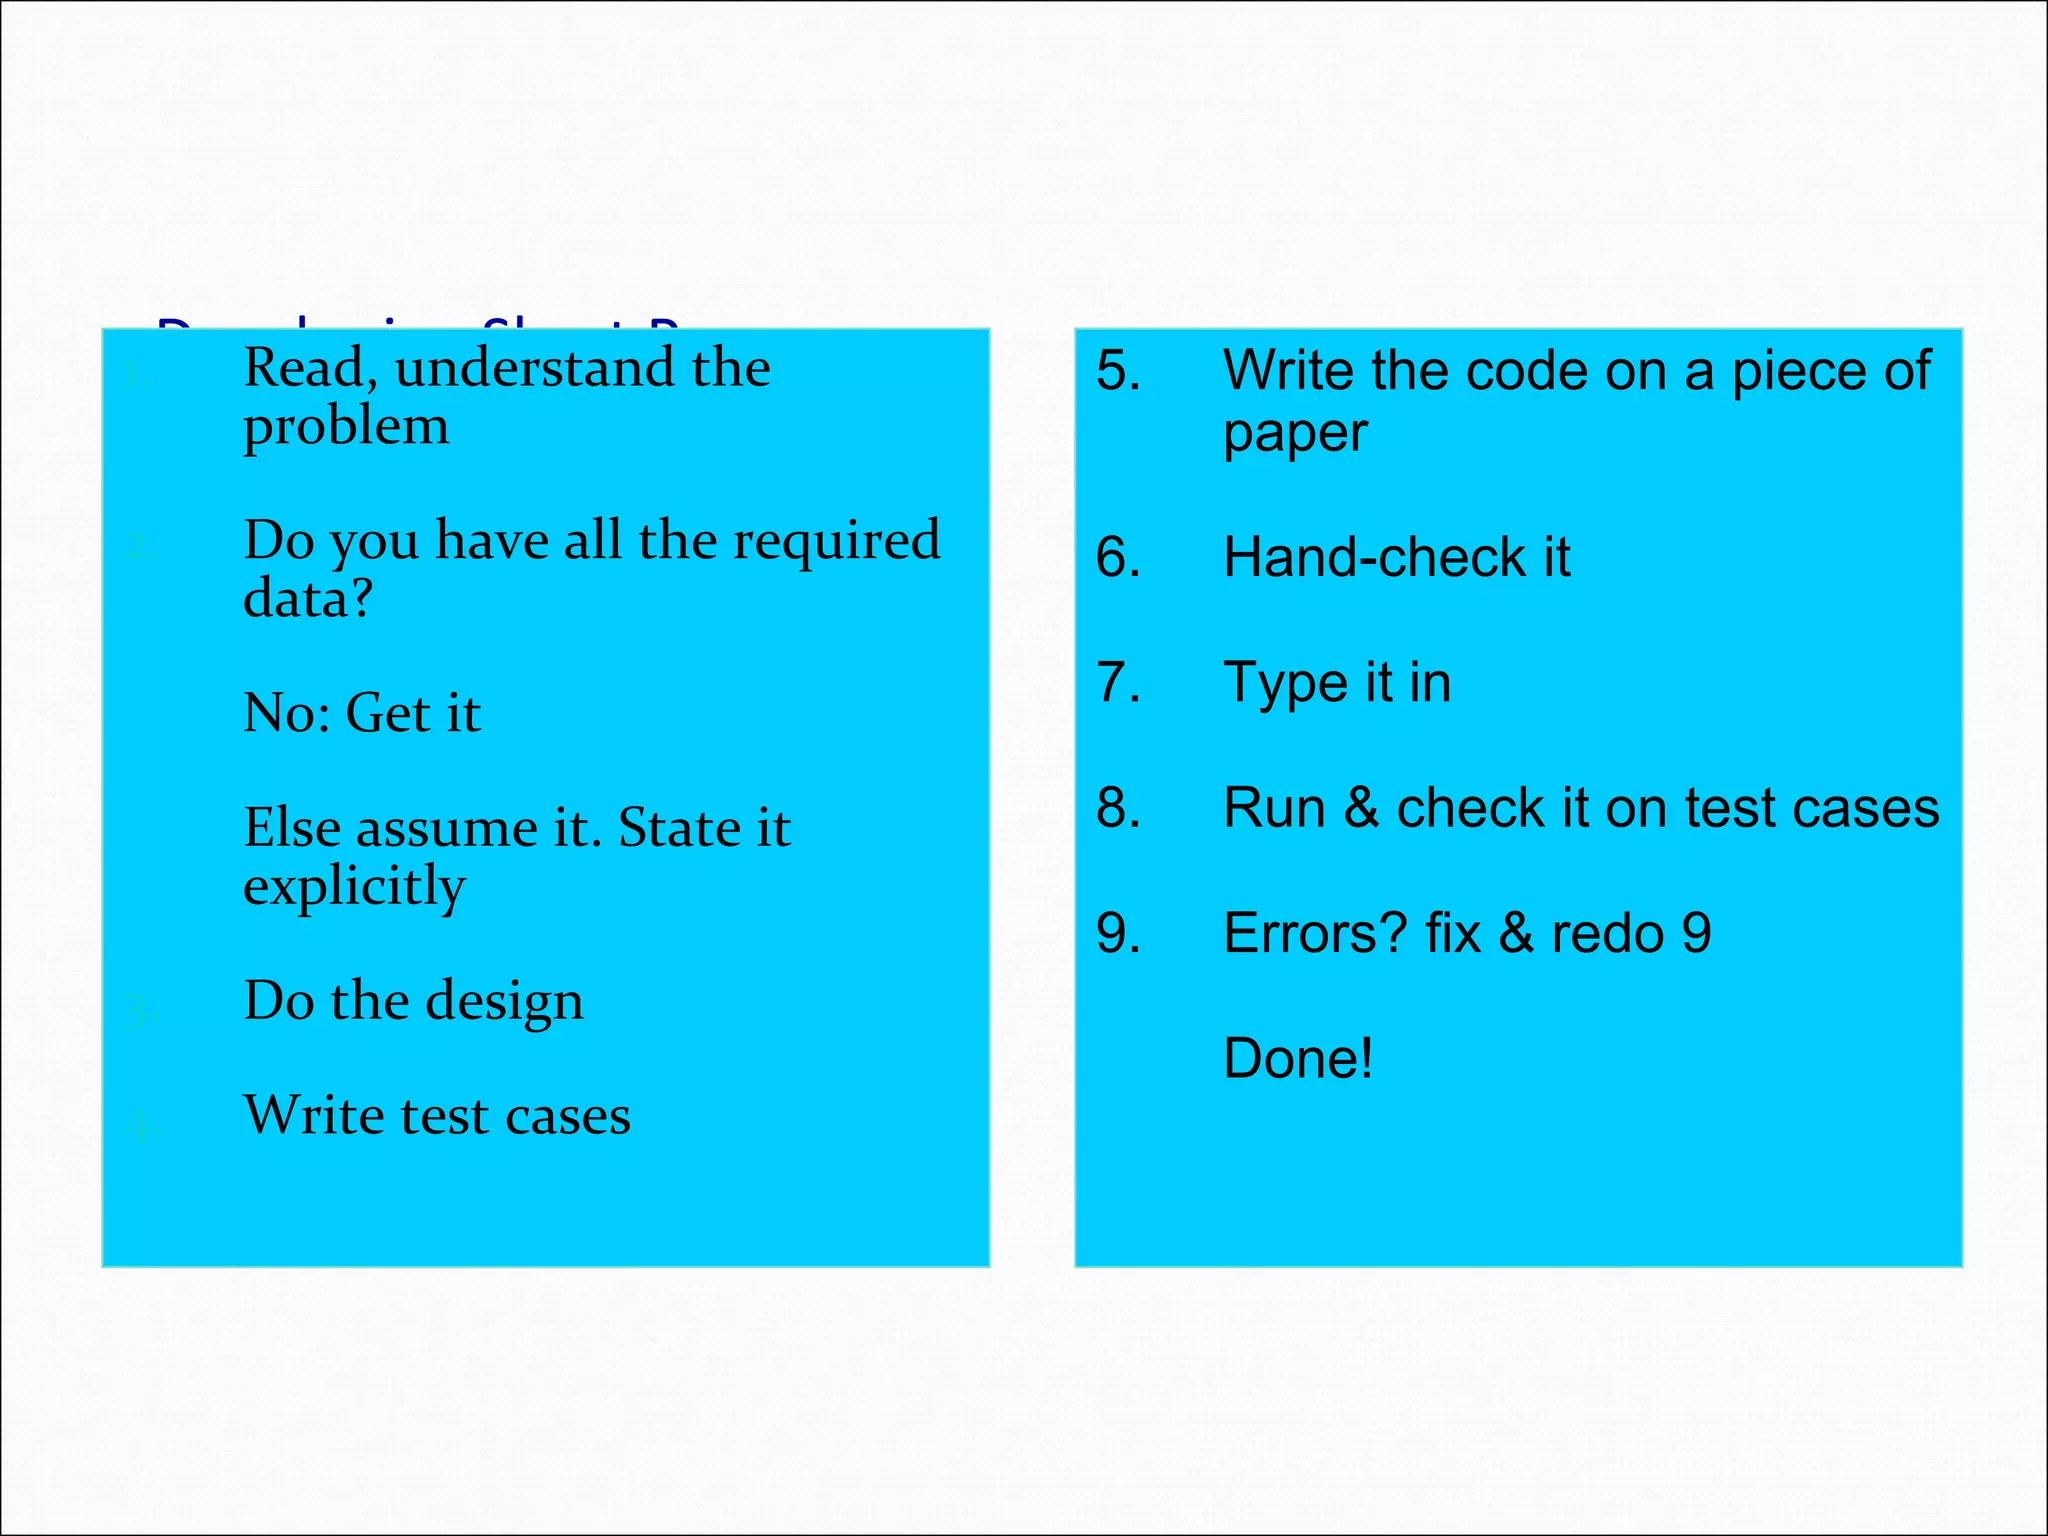
Developing Short Programs1.Read, understand the problem 2. Do you have all the required data? No: Get it Else assume it. State it explicitly 3. Do the design 4. Write test cases 5. Write the code on a piece of paper 6. Hand-check it 7. Type it in 8. Run & check it on test cases 9. Errors? fix & redo 9 Done!
68.
DOCUMENTATION Internal Documentation: Remarkswritten with the instructions to explain what is being done in the program External Documentation: Manuals/Help Menus written about the solution.
Editor's Notes
#2 In the First unit , we are going to discuss the problem solving ability , the steps to ensure that we have chosen the best solution alternative for solving the problem in hand, the tools to analyze the problem domain, the steps to develop a program and the basic programming concepts.