
 Data Structure
 Networking
 RDBMS
RDBMS Operating System
 Java
Java MS Excel
 iOS
iOS HTML
HTML CSS
CSS Android
 Python
 C Programming
 C++
C++ C#
C# MongoDB
 MySQL
MySQL Javascript
 PHP
PHP
- Selected Reading
- UPSC IAS Exams Notes
- Developer's Best Practices
- Questions and Answers
- Effective Resume Writing
- HR Interview Questions
- Computer Glossary
- Who is Who
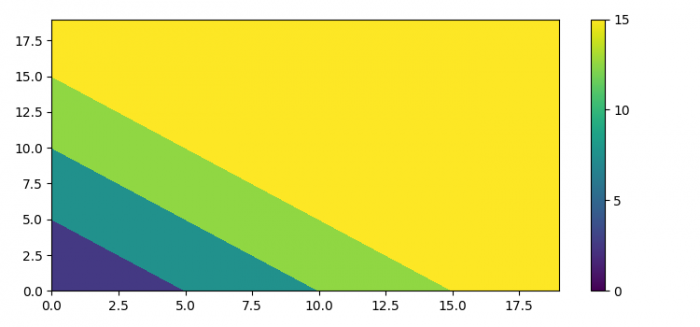
Setting the limits on a colorbar of a contour plot in Matplotlib
To set the limits on a colorbar of a countour plot in Matplotlib, we can take the following steps −
- Set the figure size and adjust the padding between and around the subplots.
- Create x and y data points using numpy.
- Get the data using x and y.
- Get the coordinate matrices from the coordinate vectors.
- Initialize vmin and vmax to set the limits on a colorbar of a contour plot in matplotlib.
- Plot contours using contourf() method.
- Make the colorbar using scalar mappable within the range of vmin and vmax.
- To display the figure, use show() method.
Example
from matplotlib import pyplot as plt import numpy as np from matplotlib.cm import ScalarMappable plt.rcParams["figure.figsize"] = [7.50, 3.50] plt.rcParams["figure.autolayout"] = True x = np.arange(20) y = np.arange(20) data = x[:, None] + y[None, :] X, Y = np.meshgrid(x, y) vmin = 0 vmax = 15 fig, ax = plt.subplots() qcs = ax.contourf( X, Y, data, vmin=vmin, vmax=vmax ) fig.colorbar( ScalarMappable(norm=qcs.norm, cmap=qcs.cmap), ticks=range(vmin, vmax+5, 5) ) plt.show()
Output

Updated on: 2021-06-09T11:43:15+05:30
12K+ Views

Advertisements