
 Data Structure
 Networking
 RDBMS
RDBMS Operating System
 Java
Java MS Excel
 iOS
iOS HTML
HTML CSS
CSS Android
 Python
 C Programming
 C++
C++ C#
C# MongoDB
 MySQL
MySQL Javascript
 PHP
PHP
- Selected Reading
- UPSC IAS Exams Notes
- Developer's Best Practices
- Questions and Answers
- Effective Resume Writing
- HR Interview Questions
- Computer Glossary
- Who is Who
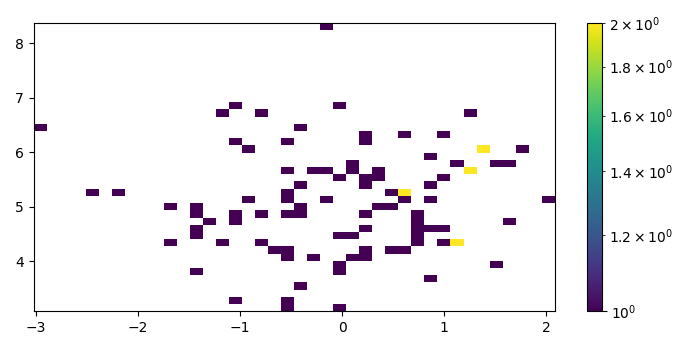
How to add a colorbar for a hist2d plot in Matplotlib?
To add a colorbar for hist2d plot, we can pass a scalar mappable object to colorbar() method's argument.
Steps
Create x and y data points using numpy.
Create a figure and a set of subplots using subplots() method.
Make a 2D histogram plot using hist2d() method.
Create a colorbar for a hist2d scalar mappable instance.
To display the figure, use show() method.
Example
import numpy as np from matplotlib import pyplot as plt, colors plt.rcParams["figure.figsize"] = [7.00, 3.50] plt.rcParams["figure.autolayout"] = True x = np.random.randn(100) y = np.random.randn(100) + 5 fig, ax = plt.subplots() hh = ax.hist2d(x, y, bins=40, norm=colors.LogNorm()) fig.colorbar(hh[3], ax=ax) plt.show()
Output

Updated on: 2021-05-11T13:01:58+05:30
4K+ Views

Advertisements