
 Data Structure
 Networking
 RDBMS
RDBMS Operating System
 Java
Java MS Excel
 iOS
iOS HTML
HTML CSS
CSS Android
 Python
 C Programming
 C++
C++ C#
C# MongoDB
 MySQL
MySQL Javascript
 PHP
PHP
- Selected Reading
- UPSC IAS Exams Notes
- Developer's Best Practices
- Questions and Answers
- Effective Resume Writing
- HR Interview Questions
- Computer Glossary
- Who is Who
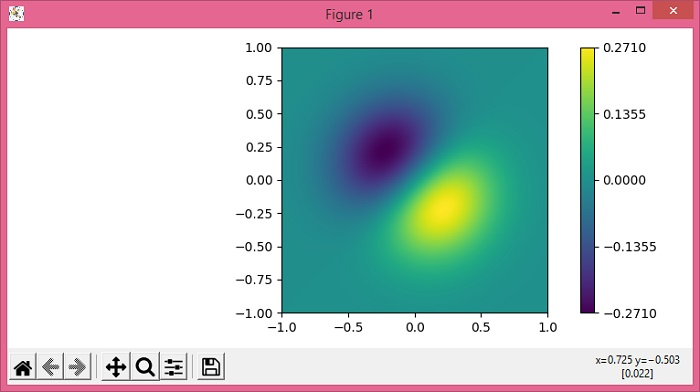
How to add Matplotlib Colorbar Ticks?
To add ticks to the colorbar, we can take the following steps −
Set the figure size and adjust the padding between and around the subplots.
Create x, y and z data points using numpy.
Use imshow() method to display the data as an image, i.e., on a 2D regular raster.
Create ticks using numpy in the range of min and max of z.
Create a colorbar for a ScalarMappable instance, *mappable*, with ticks=ticks.
To display the figure, use show() method.
Example
import numpy as np import matplotlib.pyplot as plt plt.rcParams["figure.figsize"] = [7.50, 3.50] plt.rcParams["figure.autolayout"] = True x, y = np.mgrid[-1:1:100j, -1:1:100j] z = (x + y) * np.exp(-5.0 * (x ** 2 + y ** 2)) plt.imshow(z, extent=[-1, 1, -1, 1]) ticks = np.linspace(z.min(), z.max(), 5, endpoint=True) cb = plt.colorbar(ticks=ticks) plt.show()
Output

Updated on: 2021-06-04T06:15:23+05:30
5K+ Views

Advertisements