
 Data Structure
 Networking
 RDBMS
RDBMS Operating System
 Java
Java MS Excel
 iOS
iOS HTML
HTML CSS
CSS Android
 Python
 C Programming
 C++
C++ C#
C# MongoDB
 MySQL
MySQL Javascript
 PHP
PHP
- Selected Reading
- UPSC IAS Exams Notes
- Developer's Best Practices
- Questions and Answers
- Effective Resume Writing
- HR Interview Questions
- Computer Glossary
- Who is Who
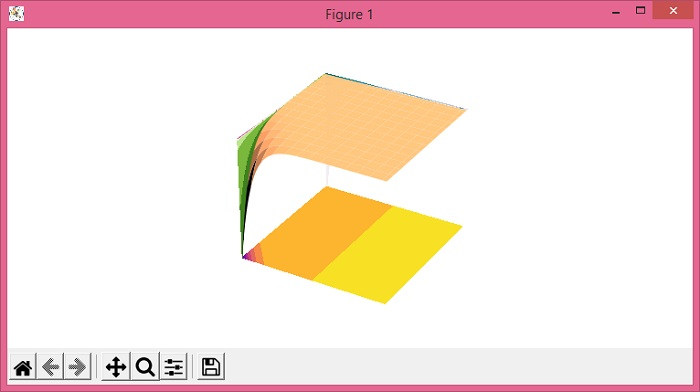
Plot Matplotlib 3D plot_surface with contour plot projection
To plot 3d plot_surface with contour plot projection, we can use plot_surface() and contourf() methods.
Steps
Set the figure size and adjust the padding between and around the subplots.
Create x, y, X, Y and Z data points using numpy.
Create a new figure or activate an existing figure using figure() method.
Add an '~.axes.Axes' to the figure as part of a subplot arrangement, with 3D projection.
Use plot_surface() method to create a surface plot.
Create a 3D filled contour plotm using contourf() method.
Trurn off the axes.
To display the figure, use show() method.
Example
import numpy as np from matplotlib import pyplot as plt plt.rcParams["figure.figsize"] = [7.50, 3.50] plt.rcParams["figure.autolayout"] = True x = np.arange(-5, 5, 0.1) y = np.arange(-5, 5, 0.1) X, Y = np.meshgrid(x, y) Z = X * np.exp(-X - Y) fig = plt.figure() ax = fig.add_subplot(111, projection='3d') surf = ax.plot_surface(X, Y, Z, rstride=8, cstride=8, alpha=1, cmap="copper") ax.contourf(X, Y, Z, zdir='z', offset=np.min(Z), cmap="plasma") ax.contourf(X, Y, Z, zdir='x', offset=-5, cmap="PiYG_r") ax.contourf(X, Y, Z, zdir='y', offset=5, cmap="PuBuGn") ax.axis('off') plt.show() Output

Updated on: 2021-06-04T06:16:49+05:30
763 Views

Advertisements