
 Data Structure
 Networking
 RDBMS
RDBMS Operating System
 Java
Java MS Excel
 iOS
iOS HTML
HTML CSS
CSS Android
 Python
 C Programming
 C++
C++ C#
C# MongoDB
 MySQL
MySQL Javascript
 PHP
PHP
- Selected Reading
- UPSC IAS Exams Notes
- Developer's Best Practices
- Questions and Answers
- Effective Resume Writing
- HR Interview Questions
- Computer Glossary
- Who is Who
Make 3D plot interactive in Jupyter Notebook (Python & Matplotlib)
In this article, we can take a program code to show how we can make a 3D plot interactive using Jupyter Notebook.
Steps
Create a new figure, or activate an existing figure.
Create fig and ax variables using subplots method, where default nrows and ncols are 1, projection=’3d”.
Get x, y and z using np.cos and np.sin function.
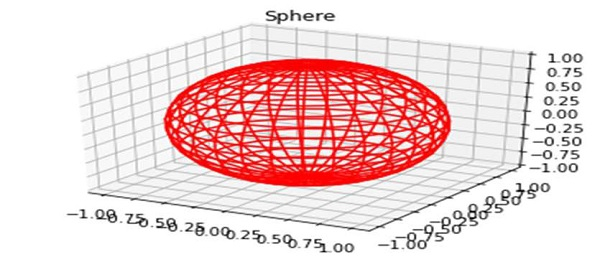
Plot the 3D wireframe, using x, y, z and color="red".
Set a title to the current axis.
To show the figure, use plt.show() method.
Example
import matplotlib.pyplot as plt import numpy as np fig = plt.figure() ax = fig.add_subplot(111, projection='3d') u, v = np.mgrid[0:2 * np.pi:30j, 0:np.pi:20j] x = np.cos(u) * np.sin(v) y = np.sin(u) * np.sin(v) z = np.cos(v) ax.plot_wireframe(x, y, z, color="red") ax.set_title("Sphere") plt.show() Output

Updated on: 2021-03-17T07:58:03+05:30
3K+ Views

Advertisements