- Matplotlib - Home
- Matplotlib - Introduction
- Matplotlib - Vs Seaborn
- Matplotlib - Environment Setup
- Matplotlib - Anaconda distribution
- Matplotlib - Jupyter Notebook
- Matplotlib - Pyplot API
- Matplotlib - Simple Plot
- Matplotlib - Saving Figures
- Matplotlib - Markers
- Matplotlib - Figures
- Matplotlib - Styles
- Matplotlib - Legends
- Matplotlib - Colors
- Matplotlib - Colormaps
- Matplotlib - Colormap Normalization
- Matplotlib - Choosing Colormaps
- Matplotlib - Colorbars
- Matplotlib - Working With Text
- Matplotlib - Text properties
- Matplotlib - Subplot Titles
- Matplotlib - Images
- Matplotlib - Image Masking
- Matplotlib - Annotations
- Matplotlib - Arrows
- Matplotlib - Fonts
- Matplotlib - Font Indexing
- Matplotlib - Font Properties
- Matplotlib - Scales
- Matplotlib - LaTeX
- Matplotlib - LaTeX Text Formatting in Annotations
- Matplotlib - PostScript
- Matplotlib - Mathematical Expressions
- Matplotlib - Animations
- Matplotlib - Celluloid Library
- Matplotlib - Blitting
- Matplotlib - Toolkits
- Matplotlib - Artists
- Matplotlib - Styling with Cycler
- Matplotlib - Paths
- Matplotlib - Path Effects
- Matplotlib - Transforms
- Matplotlib - Ticks and Tick Labels
- Matplotlib - Radian Ticks
- Matplotlib - Dateticks
- Matplotlib - Tick Formatters
- Matplotlib - Tick Locators
- Matplotlib - Basic Units
- Matplotlib - Autoscaling
- Matplotlib - Reverse Axes
- Matplotlib - Logarithmic Axes
- Matplotlib - Symlog
- Matplotlib - Unit Handling
- Matplotlib - Ellipse with Units
- Matplotlib - Spines
- Matplotlib - Axis Ranges
- Matplotlib - Axis Scales
- Matplotlib - Axis Ticks
- Matplotlib - Formatting Axes
- Matplotlib - Axes Class
- Matplotlib - Twin Axes
- Matplotlib - Figure Class
- Matplotlib - Multiplots
- Matplotlib - Grids
- Matplotlib - Object-oriented Interface
- Matplotlib - PyLab module
- Matplotlib - Subplots() Function
- Matplotlib - Subplot2grid() Function
- Matplotlib - Anchored Artists
- Matplotlib - Manual Contour
- Matplotlib - Coords Report
- Matplotlib - AGG filter
- Matplotlib - Ribbon Box
- Matplotlib - Fill Spiral
- Matplotlib - Findobj Demo
- Matplotlib - Hyperlinks
- Matplotlib - Image Thumbnail
- Matplotlib - Plotting with Keywords
- Matplotlib - Create Logo
- Matplotlib - Multipage PDF
- Matplotlib - Multiprocessing
- Matplotlib - Print Stdout
- Matplotlib - Compound Path
- Matplotlib - Sankey Class
- Matplotlib - MRI with EEG
- Matplotlib - Stylesheets
- Matplotlib - Background Colors
- Matplotlib - Basemap
- Matplotlib - Event Handling
- Matplotlib - Close Event
- Matplotlib - Mouse Move
- Matplotlib - Click Events
- Matplotlib - Scroll Event
- Matplotlib - Keypress Event
- Matplotlib - Pick Event
- Matplotlib - Looking Glass
- Matplotlib - Path Editor
- Matplotlib - Poly Editor
- Matplotlib - Timers
- Matplotlib - Viewlims
- Matplotlib - Zoom Window
- Matplotlib Widgets
- Matplotlib - Cursor Widget
- Matplotlib - Annotated Cursor
- Matplotlib - Buttons Widget
- Matplotlib - Check Buttons
- Matplotlib - Lasso Selector
- Matplotlib - Menu Widget
- Matplotlib - Mouse Cursor
- Matplotlib - Multicursor
- Matplotlib - Polygon Selector
- Matplotlib - Radio Buttons
- Matplotlib - RangeSlider
- Matplotlib - Rectangle Selector
- Matplotlib - Ellipse Selector
- Matplotlib - Slider Widget
- Matplotlib - Span Selector
- Matplotlib - Textbox
- Matplotlib Plotting
- Matplotlib - Line Plots
- Matplotlib - Area Plots
- Matplotlib - Bar Graphs
- Matplotlib - Histogram
- Matplotlib - Pie Chart
- Matplotlib - Scatter Plot
- Matplotlib - Box Plot
- Matplotlib - Arrow Demo
- Matplotlib - Fancy Boxes
- Matplotlib - Zorder Demo
- Matplotlib - Hatch Demo
- Matplotlib - Mmh Donuts
- Matplotlib - Ellipse Demo
- Matplotlib - Bezier Curve
- Matplotlib - Bubble Plots
- Matplotlib - Stacked Plots
- Matplotlib - Table Charts
- Matplotlib - Polar Charts
- Matplotlib - Hexagonal bin Plots
- Matplotlib - Violin Plot
- Matplotlib - Event Plot
- Matplotlib - Heatmap
- Matplotlib - Stairs Plots
- Matplotlib - Errorbar
- Matplotlib - Hinton Diagram
- Matplotlib - Contour Plot
- Matplotlib - Wireframe Plots
- Matplotlib - Surface Plots
- Matplotlib - Triangulations
- Matplotlib - Stream plot
- Matplotlib - Ishikawa Diagram
- Matplotlib - 3D Plotting
- Matplotlib - 3D Lines
- Matplotlib - 3D Scatter Plots
- Matplotlib - 3D Contour Plot
- Matplotlib - 3D Bar Plots
- Matplotlib - 3D Wireframe Plot
- Matplotlib - 3D Surface Plot
- Matplotlib - 3D Vignettes
- Matplotlib - 3D Volumes
- Matplotlib - 3D Voxels
- Matplotlib - Time Plots and Signals
- Matplotlib - Filled Plots
- Matplotlib - Step Plots
- Matplotlib - XKCD Style
- Matplotlib - Quiver Plot
- Matplotlib - Stem Plots
- Matplotlib - Visualizing Vectors
- Matplotlib - Audio Visualization
- Matplotlib - Audio Processing
- Matplotlib Useful Resources
- Matplotlib - Quick Guide
- Matplotlib - Cheatsheet
- Matplotlib - Useful Resources
- Matplotlib - Discussion
Matplotlib - Timers
In general computer programming, timers are refers to a mechanism that allows users to schedule the execution of a specific task or code snippet at predefined intervals. Timers are useful for various applications, enabling the automation of repetitive actions, periodic updates, or the triggering of events based on time-related conditions.
Timers in Matplotlib
Matplotlib timers are powerful features that enable you to integrate periodic events into the plots. And designed to work independently of specific graphical user interface (GUI) backends.
To utilize the Matplotlib timers feature, the figure.canvas.new_timer() function works as a key component to integrate timers with various GUI event loops. While its call signature may appear unconventional, due to this understanding the call signature is crucial (you need to explicitly specify the empty sequences and dictionaries if your call back function(s) don't take arguments or keyword arguments).
Here is the syntax −
Syntax
timer = figure.canvas.new_timer(interval=5000, callbacks=[(callback_function, [], {})]) timer.start() This syntax creates a timer with a 5-second interval, demonstrating the timer's integration into Matplotlib plots.
Example
Here is an example, That demonstrates a simple usage of timers in Matplotlib. It sets up a timer to print "Matplotlib Timer Event" to the console every 5 seconds. This showcases how timers can be employed for periodic tasks within plots.
import matplotlib.pyplot as plt # Function to handle the timer event def handle_timer_event(): print('Matplotlib Timer Event') # Create a new Matplotlib figure and axis custom_fig, custom_ax = plt.subplots(figsize=(7, 4)) # Create a timer with a 5000 milliseconds interval custom_timer = custom_fig.canvas.new_timer(interval=5000, callbacks=[(handle_timer_event, [], {})]) # Start the timer custom_timer.start() plt.show() Output
On executing the above program you will get the following output −
Matplotlib Timer Event Matplotlib Timer Event Matplotlib Timer Event Matplotlib Timer Event Matplotlib Timer Event Matplotlib Timer Event
Watch the video below to observe the works of this example.
Timer for Real-Time Updates
Timers can be used to achieve real-time updates within a plot, enhancing the dynamic nature of visualizations.
Example
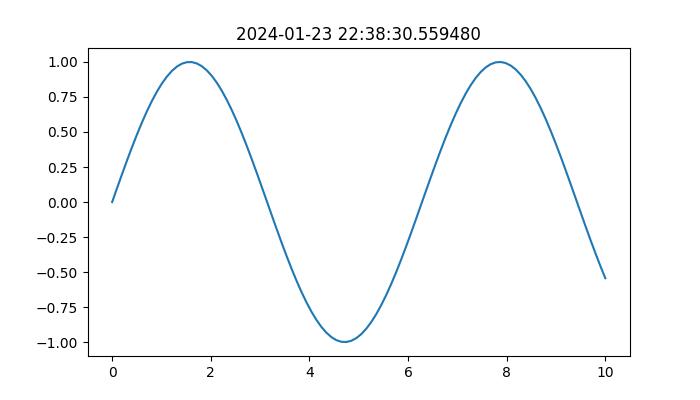
In the example, a timer is used to update the title of a figure with the current timestamp at intervals of 500 milliseconds. Which shows that, how timers can be used for dynamic, time-sensitive updates in visualizations.
from datetime import datetime import matplotlib.pyplot as plt import numpy as np # Function to update the title with the current timestamp def update_title(axes): axes.set_title(datetime.now()) axes.figure.canvas.draw() # Create a Matplotlib figure and axis fig, ax = plt.subplots(figsize=(7, 4)) # Generate sample data x = np.linspace(0, 10, 100) ax.plot(x, np.sin(x)) # Create a new timer with an interval of 500 milliseconds timer = fig.canvas.new_timer(interval=500) # Add the update_title function as a callback to the timer timer.add_callback(update_title, ax) # Start the timer timer.start() plt.show()
Output
On executing the above program you will get the following output −
Watch the video below to observe the works of this example.
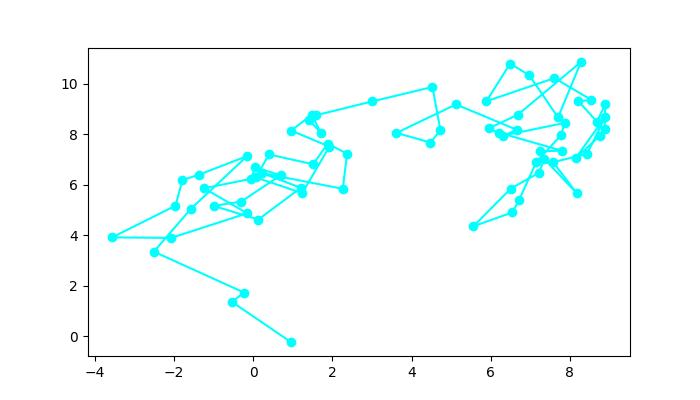
Animated Brownian Walk with Timer
In a more advanced scenario, we use the advantages of timers to animate a 2D Brownian walk, creating a visually dynamic plot that produces over time.
Example
This example demonstrates the application of timers in creating animated visualizations.
import numpy as np import matplotlib.pyplot as plt # Callback function for the timer to update line data def update_line_data(line, x_data, y_data): x_data.append(x_data[-1] + np.random.normal(0, 1)) y_data.append(y_data[-1] + np.random.normal(0, 1)) line.set_data(x_data, y_data) line.axes.relim() line.axes.autoscale_view() line.axes.figure.canvas.draw() # Initial data points x_coords, y_coords = [np.random.normal(0, 1)], [np.random.normal(0, 1)] # Create a Matplotlib figure and axis fig, ax = plt.subplots(figsize=(7, 4)) line, = ax.plot(x_coords, y_coords, color='aqua', marker='o') # Create a new timer with a 100-millisecond interval animation_timer = fig.canvas.new_timer(interval=1000, callbacks=[(update_line_data, [line, x_coords, y_coords], {})]) animation_timer.start() # Display the animated plot plt.show() Output
On executing the above program you will get a figure with animation −
Watch the video below to observe the works of this example.