
 Data Structure
 Networking
 RDBMS
RDBMS Operating System
 Java
Java MS Excel
 iOS
iOS HTML
HTML CSS
CSS Android
 Python
 C Programming
 C++
C++ C#
C# MongoDB
 MySQL
MySQL Javascript
 PHP
PHP
- Selected Reading
- UPSC IAS Exams Notes
- Developer's Best Practices
- Questions and Answers
- Effective Resume Writing
- HR Interview Questions
- Computer Glossary
- Who is Who
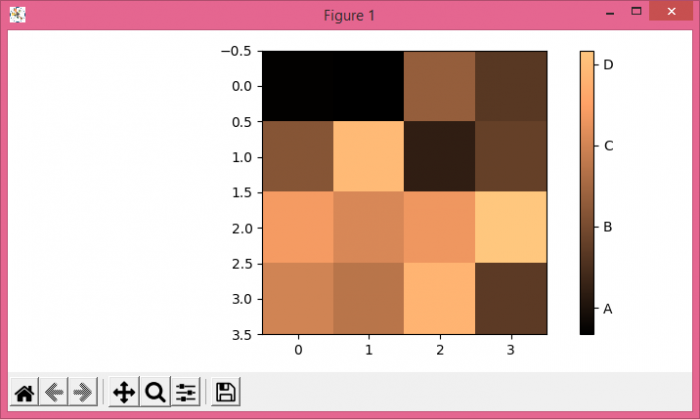
How to set the number of ticks in plt.colorbar in Matplotlib?
To set the number of ticks in a colorbar, we can take the following steps−
- Create random data using numpy
- Display the data as an image, i.e., on a 2D regular raster.
- Make a colorbar using colorbar() method with an image scalar mappable object.
- Set the ticks and tick labels of the colorbar using set_ticks() and set_ticklabels() methods.
- To display the figure, use show() method.
Example
import numpy as np from matplotlib import pyplot as plt plt.rcParams["figure.figsize"] = [7.00, 3.50] plt.rcParams["figure.autolayout"] = True data = np.random.rand(4, 4) im = plt.imshow(data, cmap="copper") cbar = plt.colorbar(im) cbar.set_ticks([0.2, 0.4, 0.6, 0.8]) cbar.set_ticklabels(["A", "B", "C", "D"]) plt.show()
Output

Updated on: 2021-05-15T12:30:17+05:30
5K+ Views

Advertisements