
 Data Structure
 Networking
 RDBMS
RDBMS Operating System
 Java
Java MS Excel
 iOS
iOS HTML
HTML CSS
CSS Android
 Python
 C Programming
 C++
C++ C#
C# MongoDB
 MySQL
MySQL Javascript
 PHP
PHP
- Selected Reading
- UPSC IAS Exams Notes
- Developer's Best Practices
- Questions and Answers
- Effective Resume Writing
- HR Interview Questions
- Computer Glossary
- Who is Who
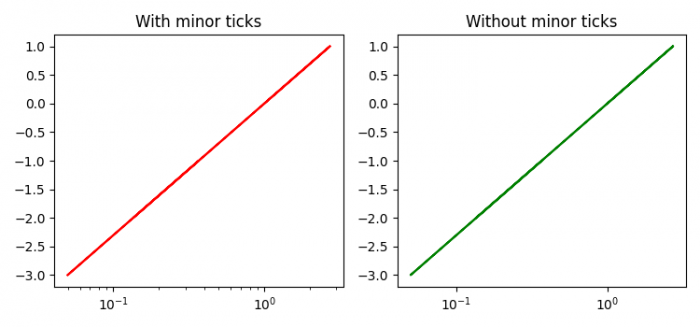
How to disable the minor ticks of a log-plot in Matplotlib?
To disable the minor ticks of a log plot in matplotlib, we can use minorticks_off() method.
Steps
- Set the figure size and adjust the padding between and around the subplots.
- Create x and y data points using numpy.
- Add a subplot to the current figure, at index 1.
- Plot x and y data points with color=red.
- Make x-scale as log class by name.
- Set the title of the current plot.
- Add a subplot to the current figure, at index 2.
- Plot x and y data points with color=green.
- Make x-scale as log class by name.
- Turn off the minor ticks of the plot.
- Set the title of the plot as index 2.
- To display the figure, use show() method.
Example
import numpy as np from matplotlib import pyplot as plt plt.rcParams["figure.figsize"] = [7.50, 3.50] plt.rcParams["figure.autolayout"] = True x = np.random.randint(-3, 3, 10) y = np.exp(x) plt.subplot(121) plt.plot(y, x, c='red') plt.xscale('log') plt.title("With minor ticks") plt.subplot(122) plt.plot(y, x, c='green') plt.xscale('log') plt.minorticks_off() plt.title("Without minor ticks") plt.show() Output

Updated on: 2021-06-01T11:46:16+05:30
3K+ Views

Advertisements