
 Data Structure
 Networking
 RDBMS
RDBMS Operating System
 Java
Java MS Excel
 iOS
iOS HTML
HTML CSS
CSS Android
 Python
 C Programming
 C++
C++ C#
C# MongoDB
 MySQL
MySQL Javascript
 PHP
PHP
- Selected Reading
- UPSC IAS Exams Notes
- Developer's Best Practices
- Questions and Answers
- Effective Resume Writing
- HR Interview Questions
- Computer Glossary
- Who is Who
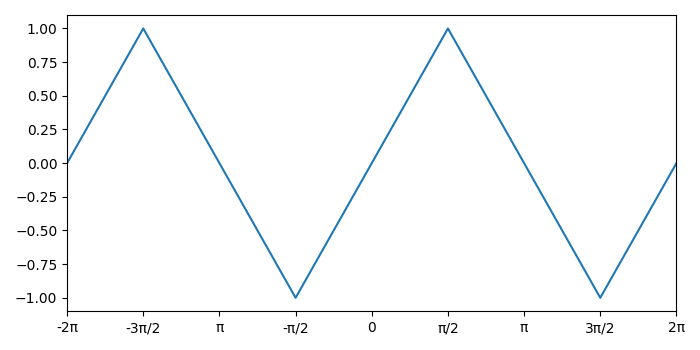
How to set axis ticks in multiples of pi in Python Matplotlib?
To set axis ticks in multiples of pi in Python, we take following steps −
Initialize a pi variable, create theta and y data points using numpy.
Plot theta and y using plot() method.
Get or set the current tick locations and labels of the X-axis using xticks() method.
Convenience method to set or retrieve autoscaling margins using margins() method.
To display the figure, use show() method.
Example
import numpy as np from matplotlib import pyplot as plt plt.rcParams["figure.figsize"] = [7.00, 3.50] plt.rcParams["figure.autolayout"] = True pi = np.pi theta = np.arange(-2 * pi, 2 * pi+pi/2, step=(pi / 2)) y = np.sin(theta) plt.plot(theta, y) plt.xticks(theta, ['-2π', '-3π/2', 'π', '-π/2', '0', 'π/2', 'π', '3π/2', '2π']) plt.margins(x=0) plt.show()
Output

Updated on: 2021-05-11T12:44:15+05:30
5K+ Views

Advertisements