
 Data Structure
 Networking
 RDBMS
RDBMS Operating System
 Java
Java MS Excel
 iOS
iOS HTML
HTML CSS
CSS Android
 Python
 C Programming
 C++
C++ C#
C# MongoDB
 MySQL
MySQL Javascript
 PHP
PHP
- Selected Reading
- UPSC IAS Exams Notes
- Developer's Best Practices
- Questions and Answers
- Effective Resume Writing
- HR Interview Questions
- Computer Glossary
- Who is Who
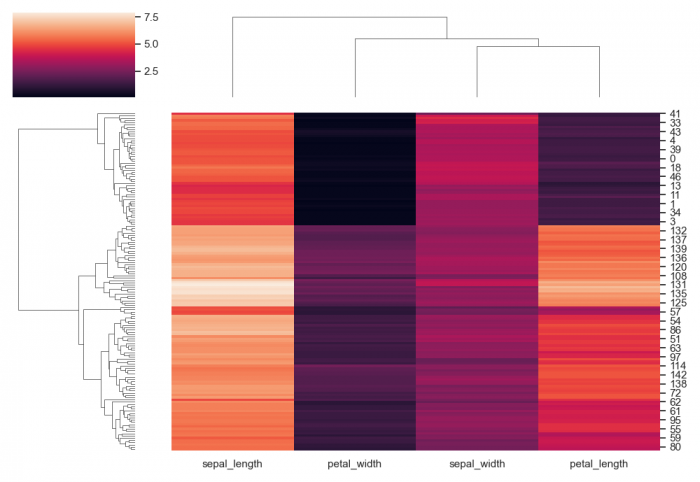
How to give sns.clustermap a precomputed distance matrix in Matplotlib?
To give sns.clustermap a dataset, we can take the following steps −
Set multiple theme parameters in one step.
Load an example dataset from the online repository (requires Internet).
Return item and drop from the frame. Raise KeyError if not found, using pop() method.
Plot a matrix dataset as a hierarchically-clustered heatmap using clustermap() method.
To display the figure, use show() method.
Example
from matplotlib import pyplot as plt import seaborn as sns plt.rcParams["figure.figsize"] = [7.00, 3.50] plt.rcParams["figure.autolayout"] = True sns.set_theme(color_codes=True) iris = sns.load_dataset("iris") species = iris.pop("species") g = sns.clustermap(iris) plt.show() Output

Updated on: 2021-05-12T12:19:02+05:30
306 Views

Advertisements