
 Data Structure
 Networking
 RDBMS
RDBMS Operating System
 Java
Java MS Excel
 iOS
iOS HTML
HTML CSS
CSS Android
 Python
 C Programming
 C++
C++ C#
C# MongoDB
 MySQL
MySQL Javascript
 PHP
PHP
- Selected Reading
- UPSC IAS Exams Notes
- Developer's Best Practices
- Questions and Answers
- Effective Resume Writing
- HR Interview Questions
- Computer Glossary
- Who is Who
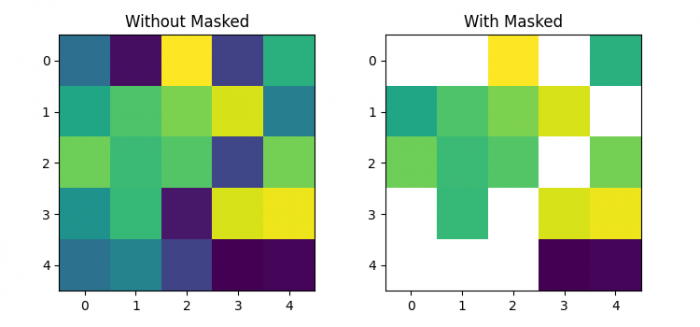
How to apply a mask on the matrix in Matplotlib imshow?
To apply a mask on the matrix in matplotlib imshow(), we can use np.ma.masked_where() method with lower and upper limit.
Steps
- Initialize two variables, l and u, to mask the input matrix.
- Create random data of 5×5 dimension.
- Mask the input matrix, lower of l value, and above of u.
- Create a figure and a set of subplots with nrows=1 and ncols=
- Display the data as an image, i.e., on a 2D regular raster, at axes 0 and
- Set the title of the axes, 0 and
- To display the figure, use show() method.
Example
import numpy as np import matplotlib.pyplot as plt plt.rcParams["figure.figsize"] = [7.50, 3.50] plt.rcParams["figure.autolayout"] = True l = 0.125 u = 0.575 data = np.random.rand(5, 5) data = np.ma.masked_where((l < data) & (data < u), data) fig, axs = plt.subplots(1, 2) axs[0].imshow(data.data) axs[0].set_title("Without Masked") axs[1].imshow(data) axs[1].set_title("With Masked") plt.show() Output


Updated on: 2021-08-03T13:26:27+05:30
3K+ Views

Advertisements