
 Data Structure
 Networking
 RDBMS
RDBMS Operating System
 Java
Java MS Excel
 iOS
iOS HTML
HTML CSS
CSS Android
 Python
 C Programming
 C++
C++ C#
C# MongoDB
 MySQL
MySQL Javascript
 PHP
PHP
- Selected Reading
- UPSC IAS Exams Notes
- Developer's Best Practices
- Questions and Answers
- Effective Resume Writing
- HR Interview Questions
- Computer Glossary
- Who is Who
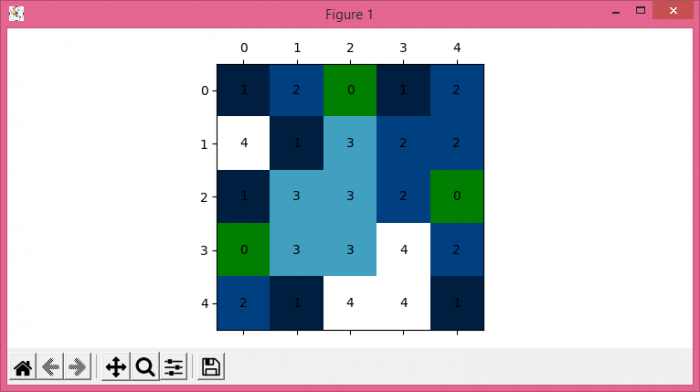
How to display the matrix value and colormap in Matplotlib?
To display the matrix value and colormap in Matplotlib, we can take the following steps −
- Set the figure size and adjust the padding between and around the subplots.
- Create a figure and a set of subplots.
- Initialize max and min values for matrix.
- Plot the values of a 2D matrix or array as color-coded image.
- Iterate each cell of the color-code image and place value at the center.
- To display the figure, use show() method.
Example
import numpy as np import matplotlib.pyplot as plt plt.rcParams["figure.figsize"] = [7.50, 3.50] plt.rcParams["figure.autolayout"] = True fig, ax = plt.subplots() min_val, max_val = 0, 5 matrix = np.random.randint(0, 5, size=(max_val, max_val)) ax.matshow(matrix, cmap='ocean') for i in range(max_val): for j in range(max_val): c = matrix[j, i] ax.text(i, j, str(c), va='center', ha='center') plt.show()
Output


Updated on: 2021-08-04T12:55:08+05:30
4K+ Views

Advertisements