
 Data Structure
 Networking
 RDBMS
RDBMS Operating System
 Java
Java MS Excel
 iOS
iOS HTML
HTML CSS
CSS Android
 Python
 C Programming
 C++
C++ C#
C# MongoDB
 MySQL
MySQL Javascript
 PHP
PHP
- Selected Reading
- UPSC IAS Exams Notes
- Developer's Best Practices
- Questions and Answers
- Effective Resume Writing
- HR Interview Questions
- Computer Glossary
- Who is Who
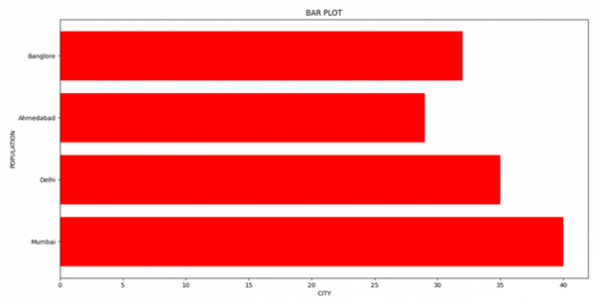
Displaying horizontal bar graphs using Matplotlib
In this program, we will plot a bar graph using the matplotlib library. The most important Step in solving matplotlib related problems using the matplotlib library is importing the matplotlib library. The syntax is:
import matplotlib.pyplot as plt
Pyplot is a collection of command style functions that make Matplotlib work like MATLAB. We will use the function barh() for plotting the horizontal bar charts
Algorithm
Step 1: Define a list of values. Step 2: Use the barh() function in the matplotlib.pyplot library and define different parameters like height width, etc. Step 3: Label the axes using xlabel() and ylabel(). Step 3: Plot the graph using show().
Example Code
import matplotlib.pyplot as plt data_x = ['Mumbai', 'Delhi', 'Ahmedabad', 'Banglore'] data_y = [40, 35, 29, 32] plt.xlabel("CITY") plt.ylabel("POPULATION") plt.title("BAR PLOT") plt.barh(data_x, data_y, color='red') plt.show() Output

Updated on: 2021-03-16T11:06:31+05:30
917 Views

Advertisements