
 Data Structure
 Networking
 RDBMS
RDBMS Operating System
 Java
Java MS Excel
 iOS
iOS HTML
HTML CSS
CSS Android
 Python
 C Programming
 C++
C++ C#
C# MongoDB
 MySQL
MySQL Javascript
 PHP
PHP
- Selected Reading
- UPSC IAS Exams Notes
- Developer's Best Practices
- Questions and Answers
- Effective Resume Writing
- HR Interview Questions
- Computer Glossary
- Who is Who
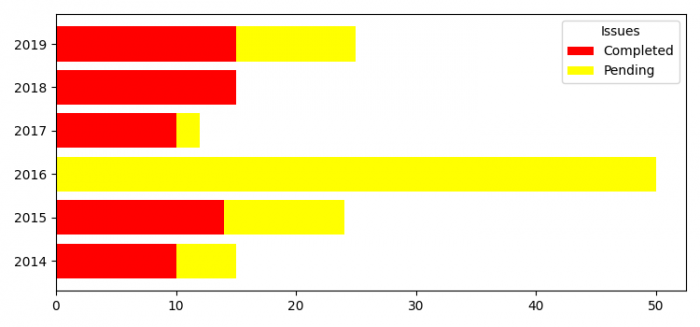
Horizontal stacked bar chart in Matplotlib
To plot stacked bar chart in Matplotlib, we can use barh() methods
Steps
- Set the figure size and adjust the padding between and around the subplots.
- Create a list of years, issues_addressed and issues_pending, in accordance with years.
- Plot horizontal bars with years and issues_addressed data.
- To make stacked horizontal bars, use barh() method with years, issues_pending and issues_addressed data
- Place the legend on the plot.
- To display the figure, use show() method.
Example
from matplotlib import pyplot as plt plt.rcParams["figure.figsize"] = [7.50, 3.50] plt.rcParams["figure.autolayout"] = True year = [2014, 2015, 2016, 2017, 2018, 2019] issues_addressed = [10, 14, 0, 10, 15, 15] issues_pending = [5, 10, 50, 2, 0, 10] b1 = plt.barh(year, issues_addressed, color="red") b2 = plt.barh(year, issues_pending, left=issues_addressed, color="yellow") plt.legend([b1, b2], ["Completed", "Pending"], title="Issues", loc="upper right") plt.show()
Output

Updated on: 2021-06-15T12:25:28+05:30
11K+ Views

Advertisements