
 Data Structure
 Networking
 RDBMS
RDBMS Operating System
 Java
Java MS Excel
 iOS
iOS HTML
HTML CSS
CSS Android
 Python
 C Programming
 C++
C++ C#
C# MongoDB
 MySQL
MySQL Javascript
 PHP
PHP
- Selected Reading
- UPSC IAS Exams Notes
- Developer's Best Practices
- Questions and Answers
- Effective Resume Writing
- HR Interview Questions
- Computer Glossary
- Who is Who
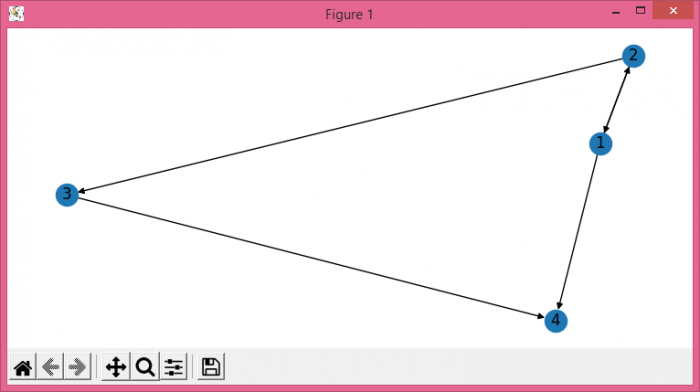
How to show node name in Matplotlib graphs using networkx?
To show node name in graphs using networkx, we can take the following steps −
- Set the figure size and adjust the padding between and around the subplots.
- Initialize a graph with edges, name, or graph attributes.
- Add multiple nodes using add_nodes_from() method.
- Add all the edges using add_edge_from() method.
- Draw the graph G with Matplotlib using draw() method. Set with_labels to True.
- To display the graph, we can use show() method.
Example
import matplotlib.pylab as plt import networkx as nx plt.rcParams["figure.figsize"] = [7.50, 3.50] plt.rcParams["figure.autolayout"] = True G = nx.DiGraph() G.add_nodes_from([1, 2, 3, 4]) G.add_edges_from([(1, 2), (2, 1), (2, 3), (1,4), (3,4)]) nx.draw(G, with_labels=True) plt.show()
Output

Updated on: 2021-06-09T11:40:50+05:30
1K+ Views

Advertisements