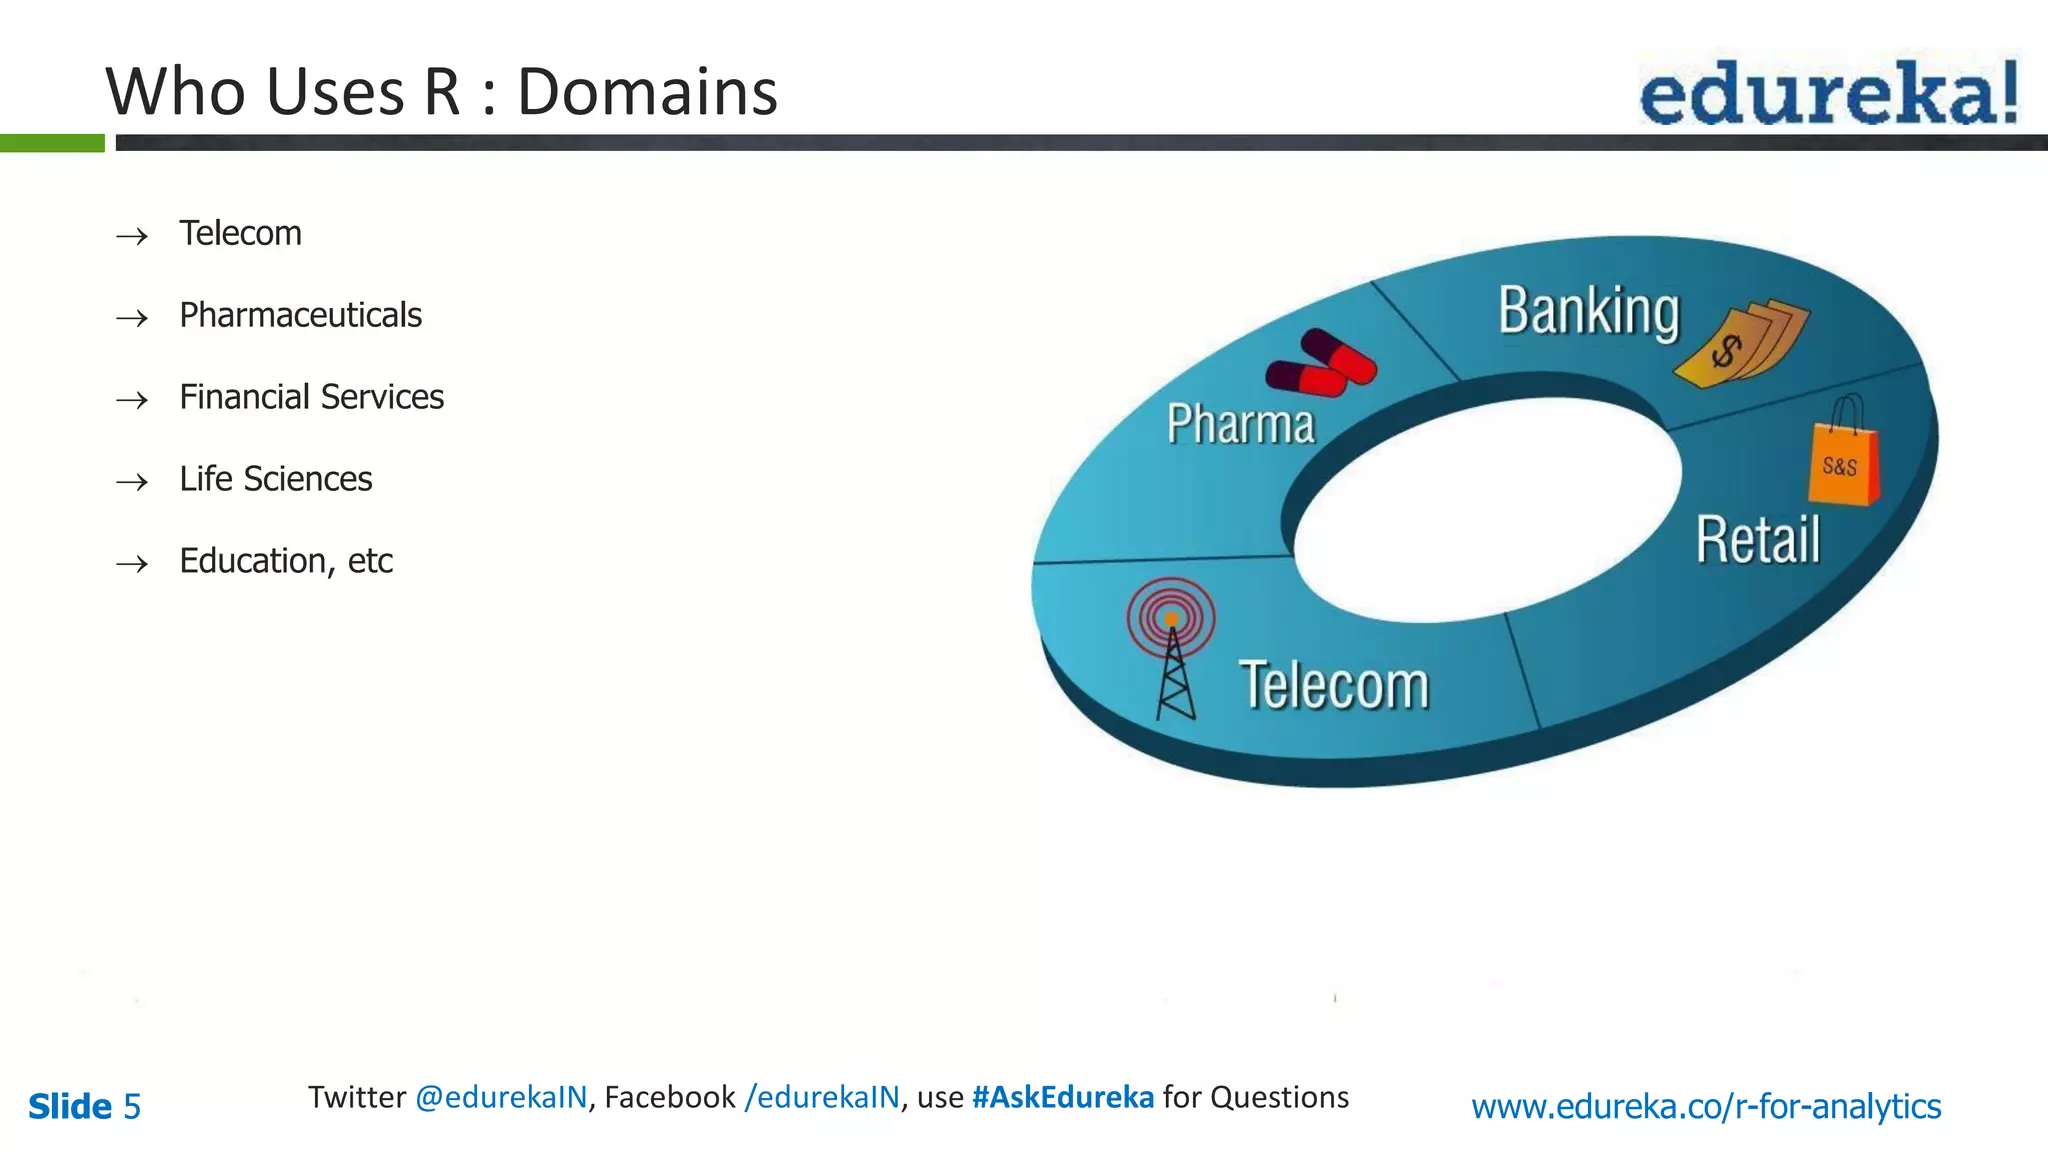
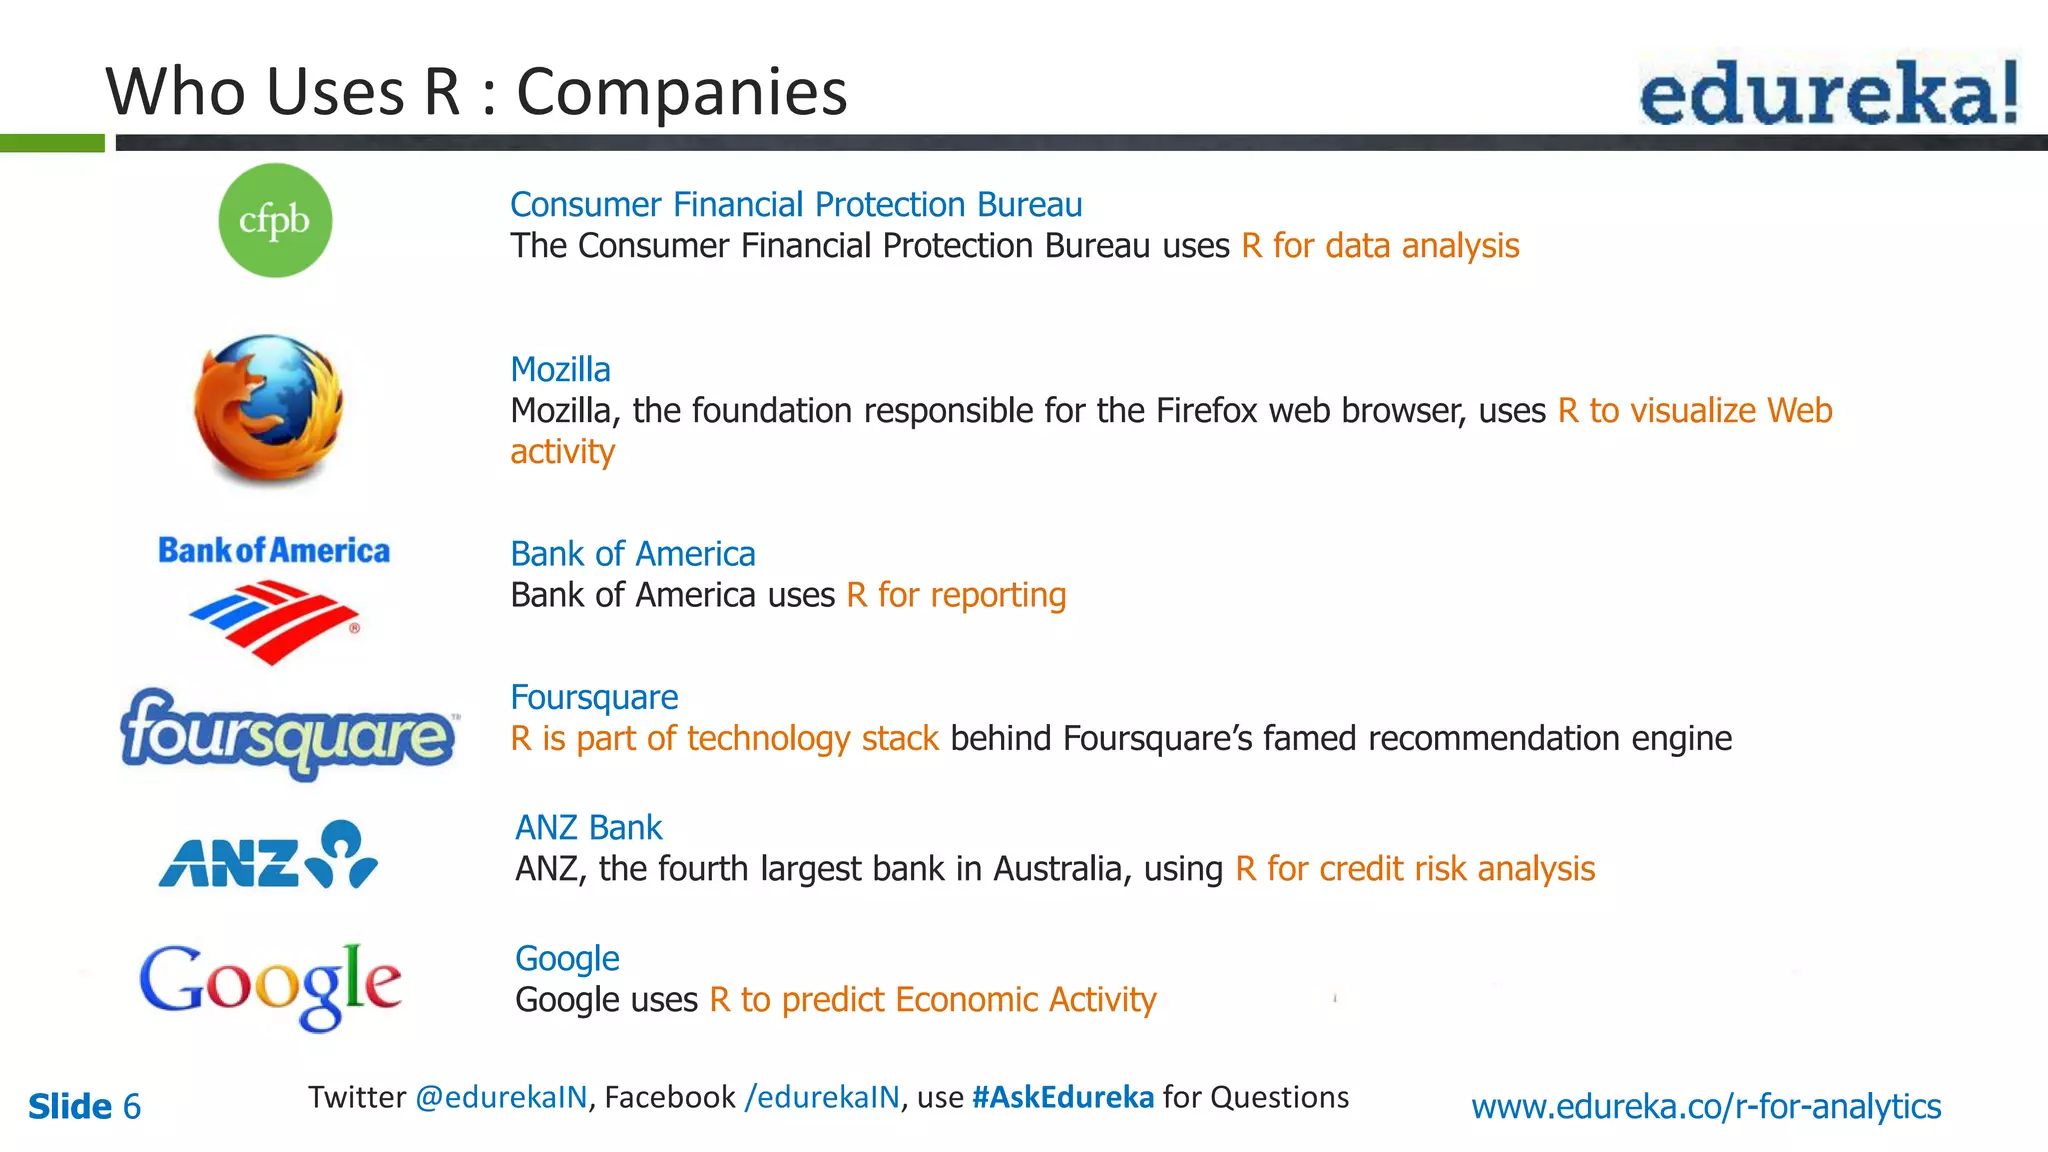
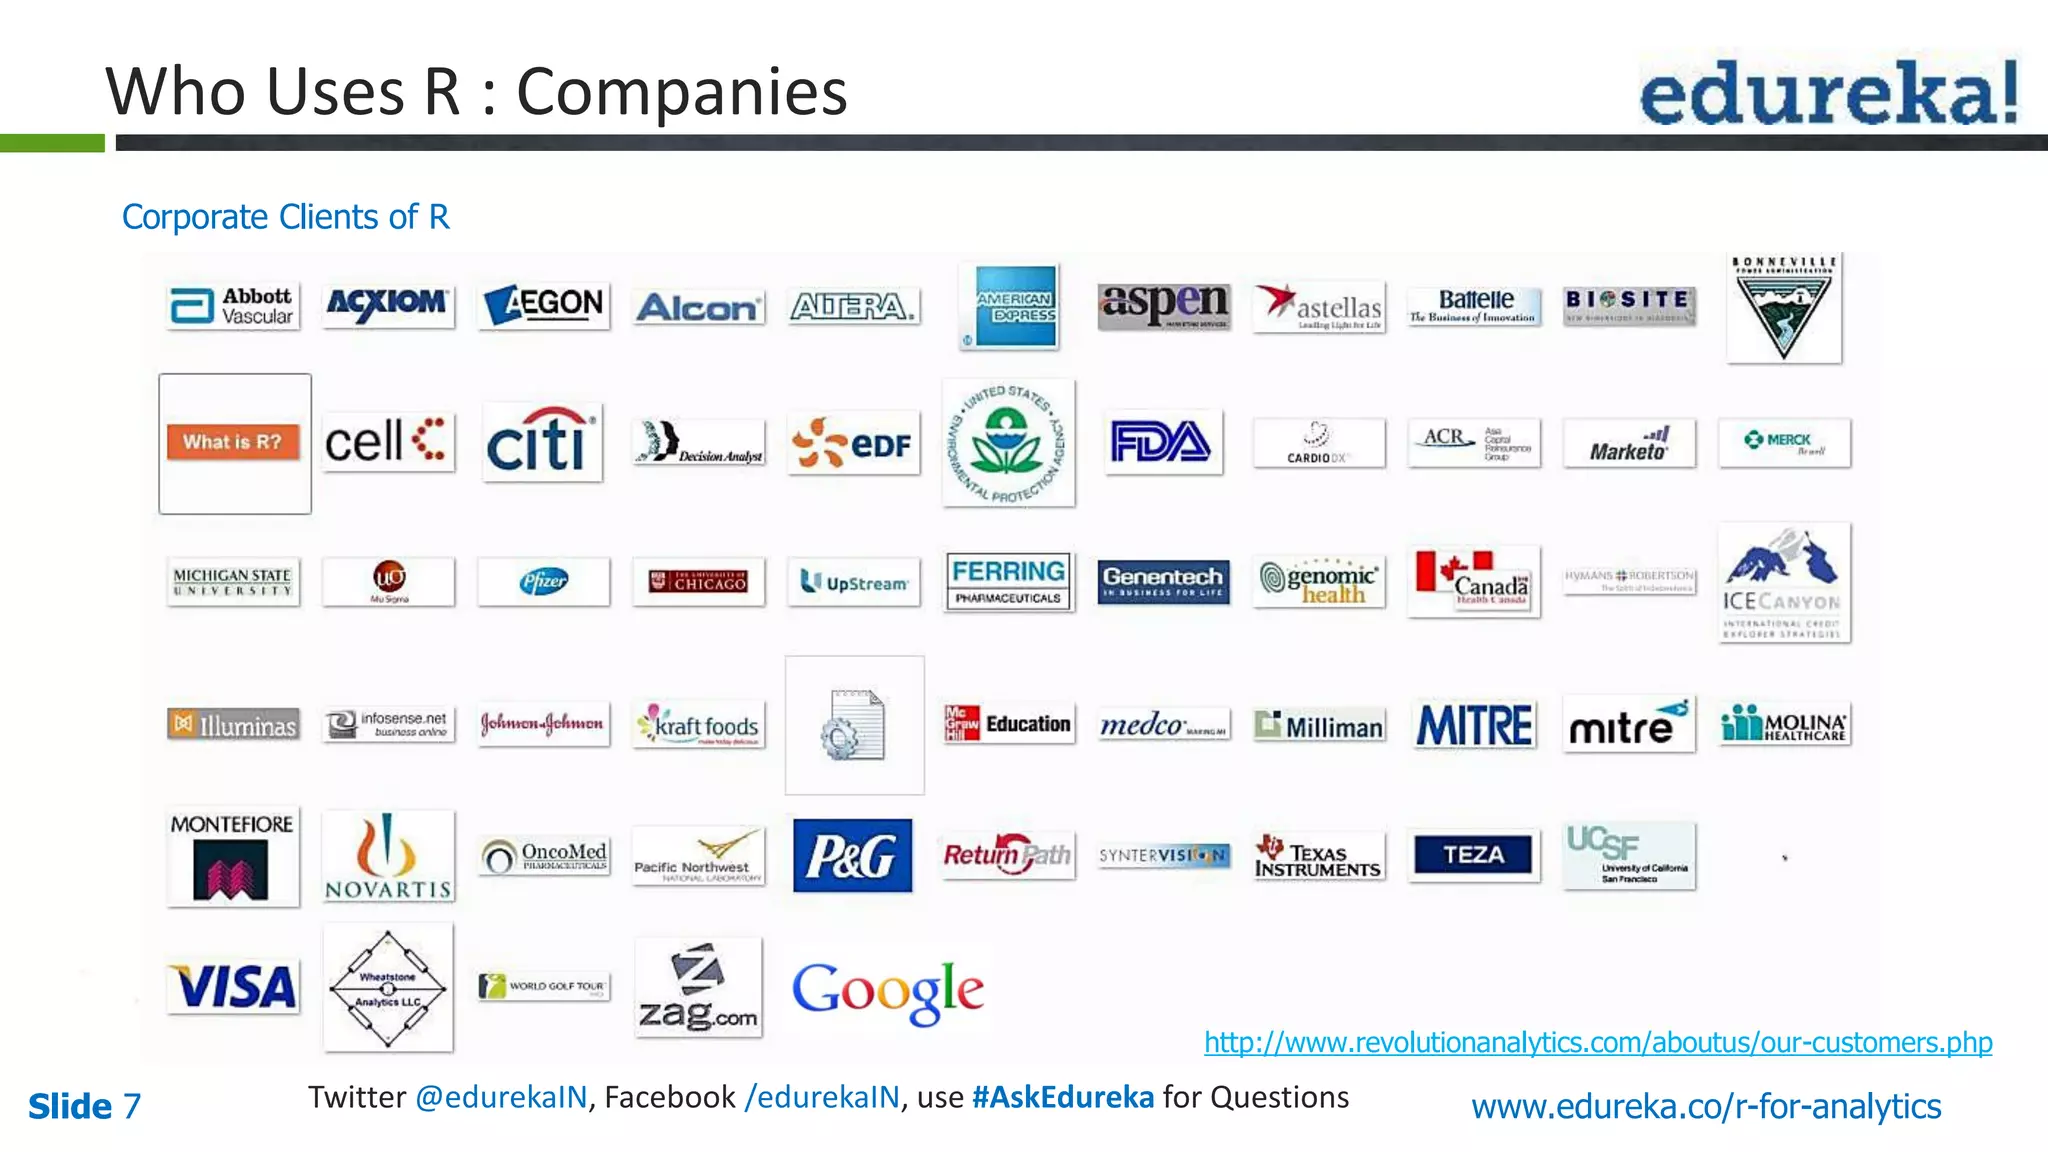
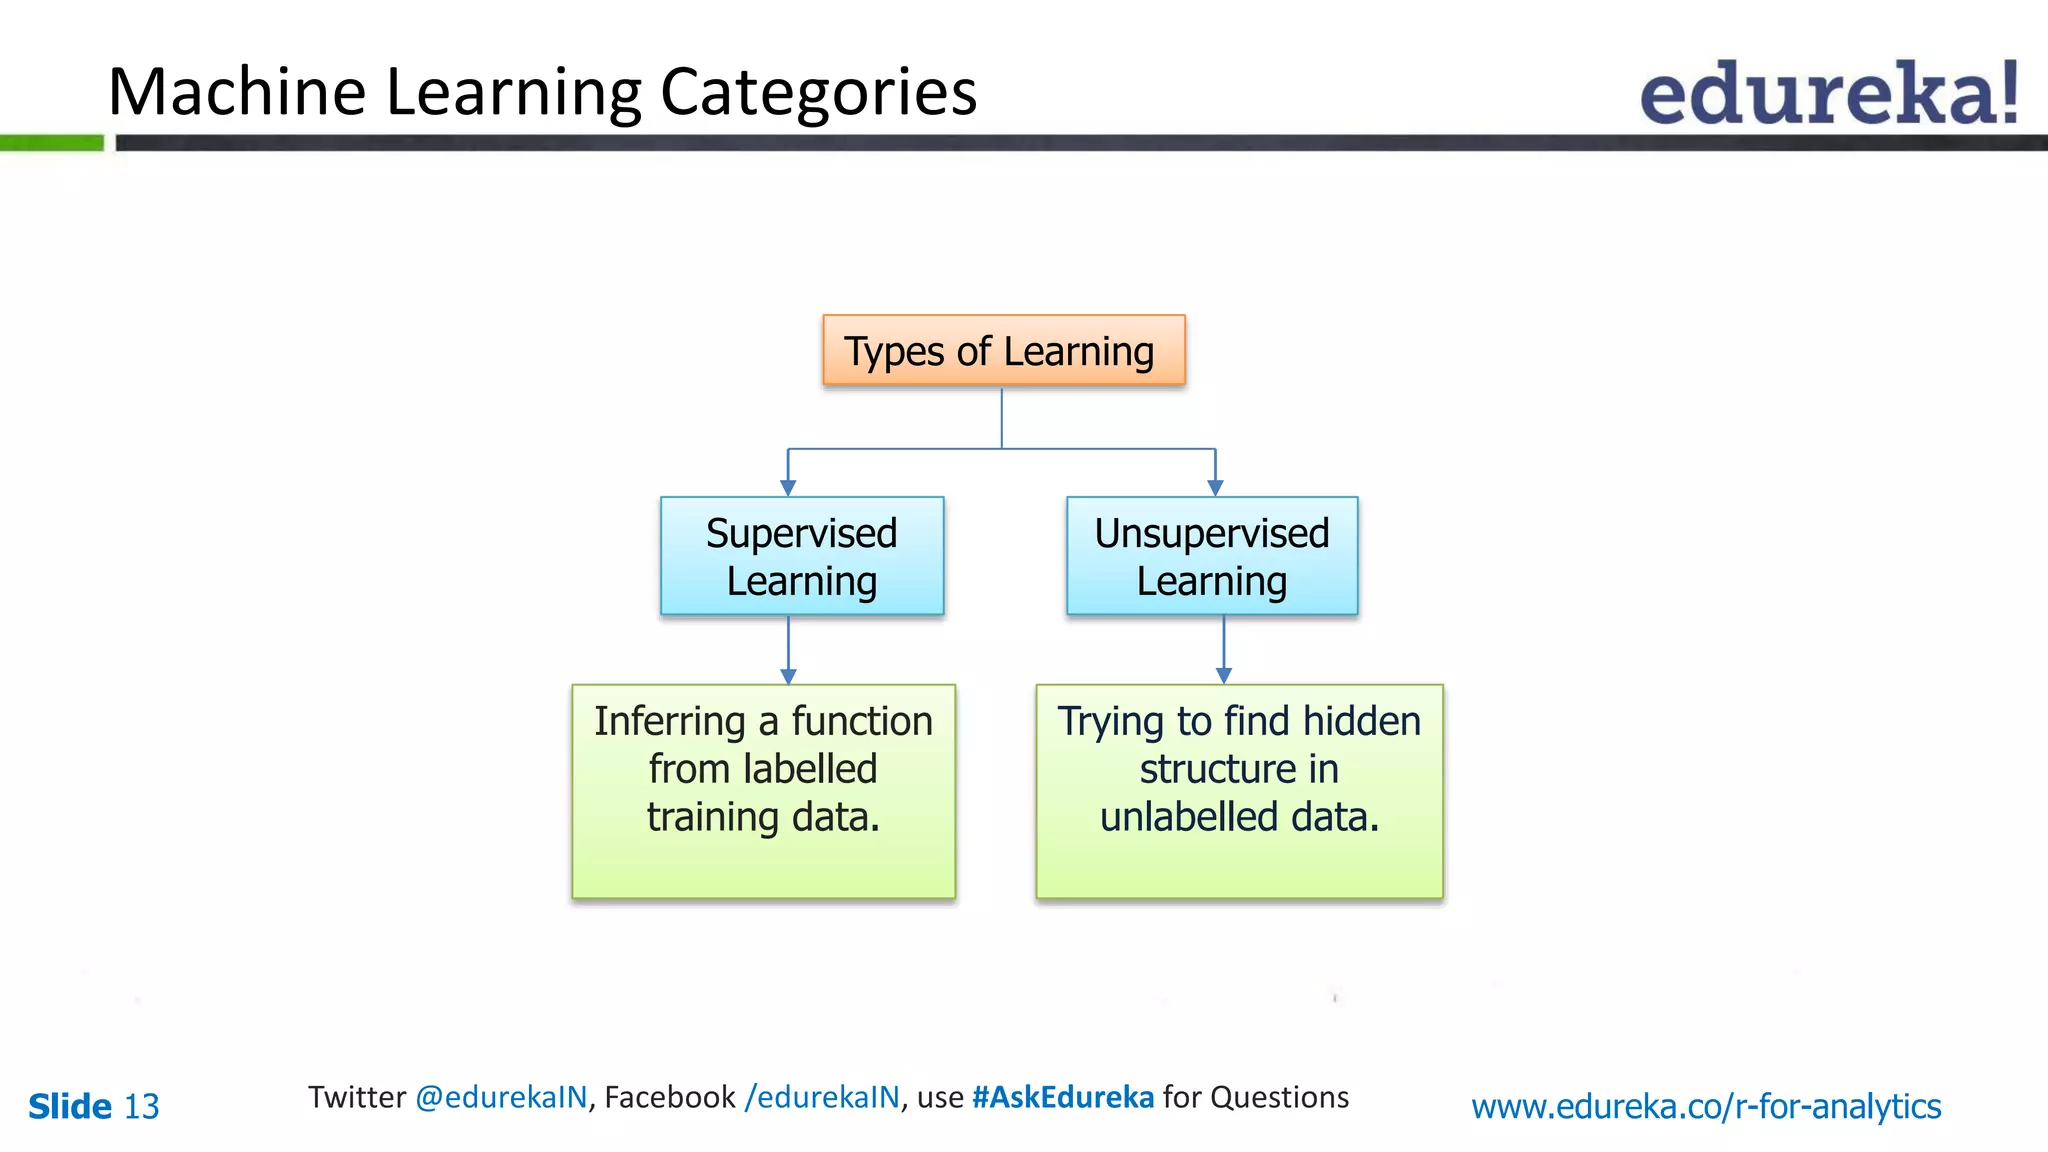
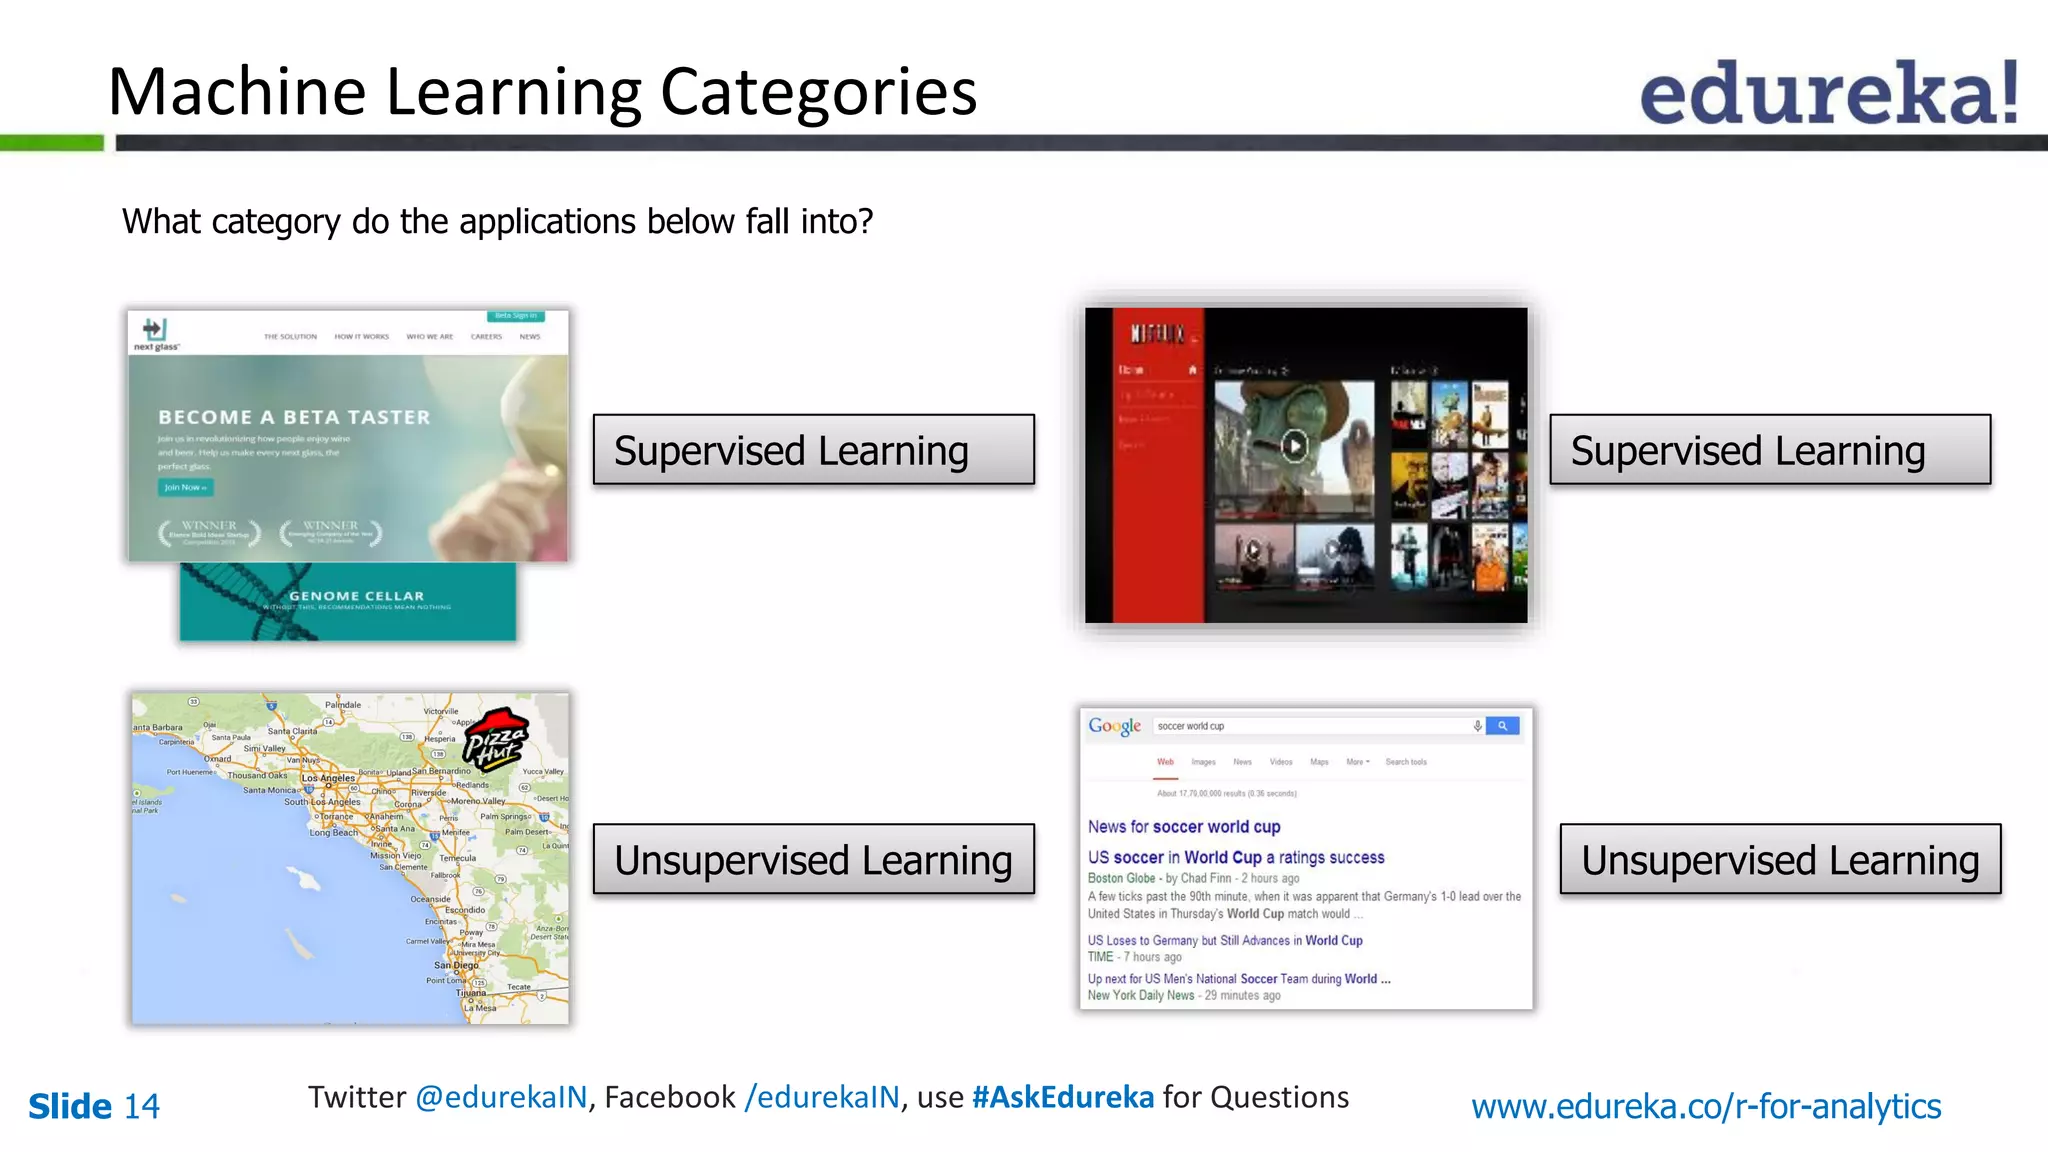
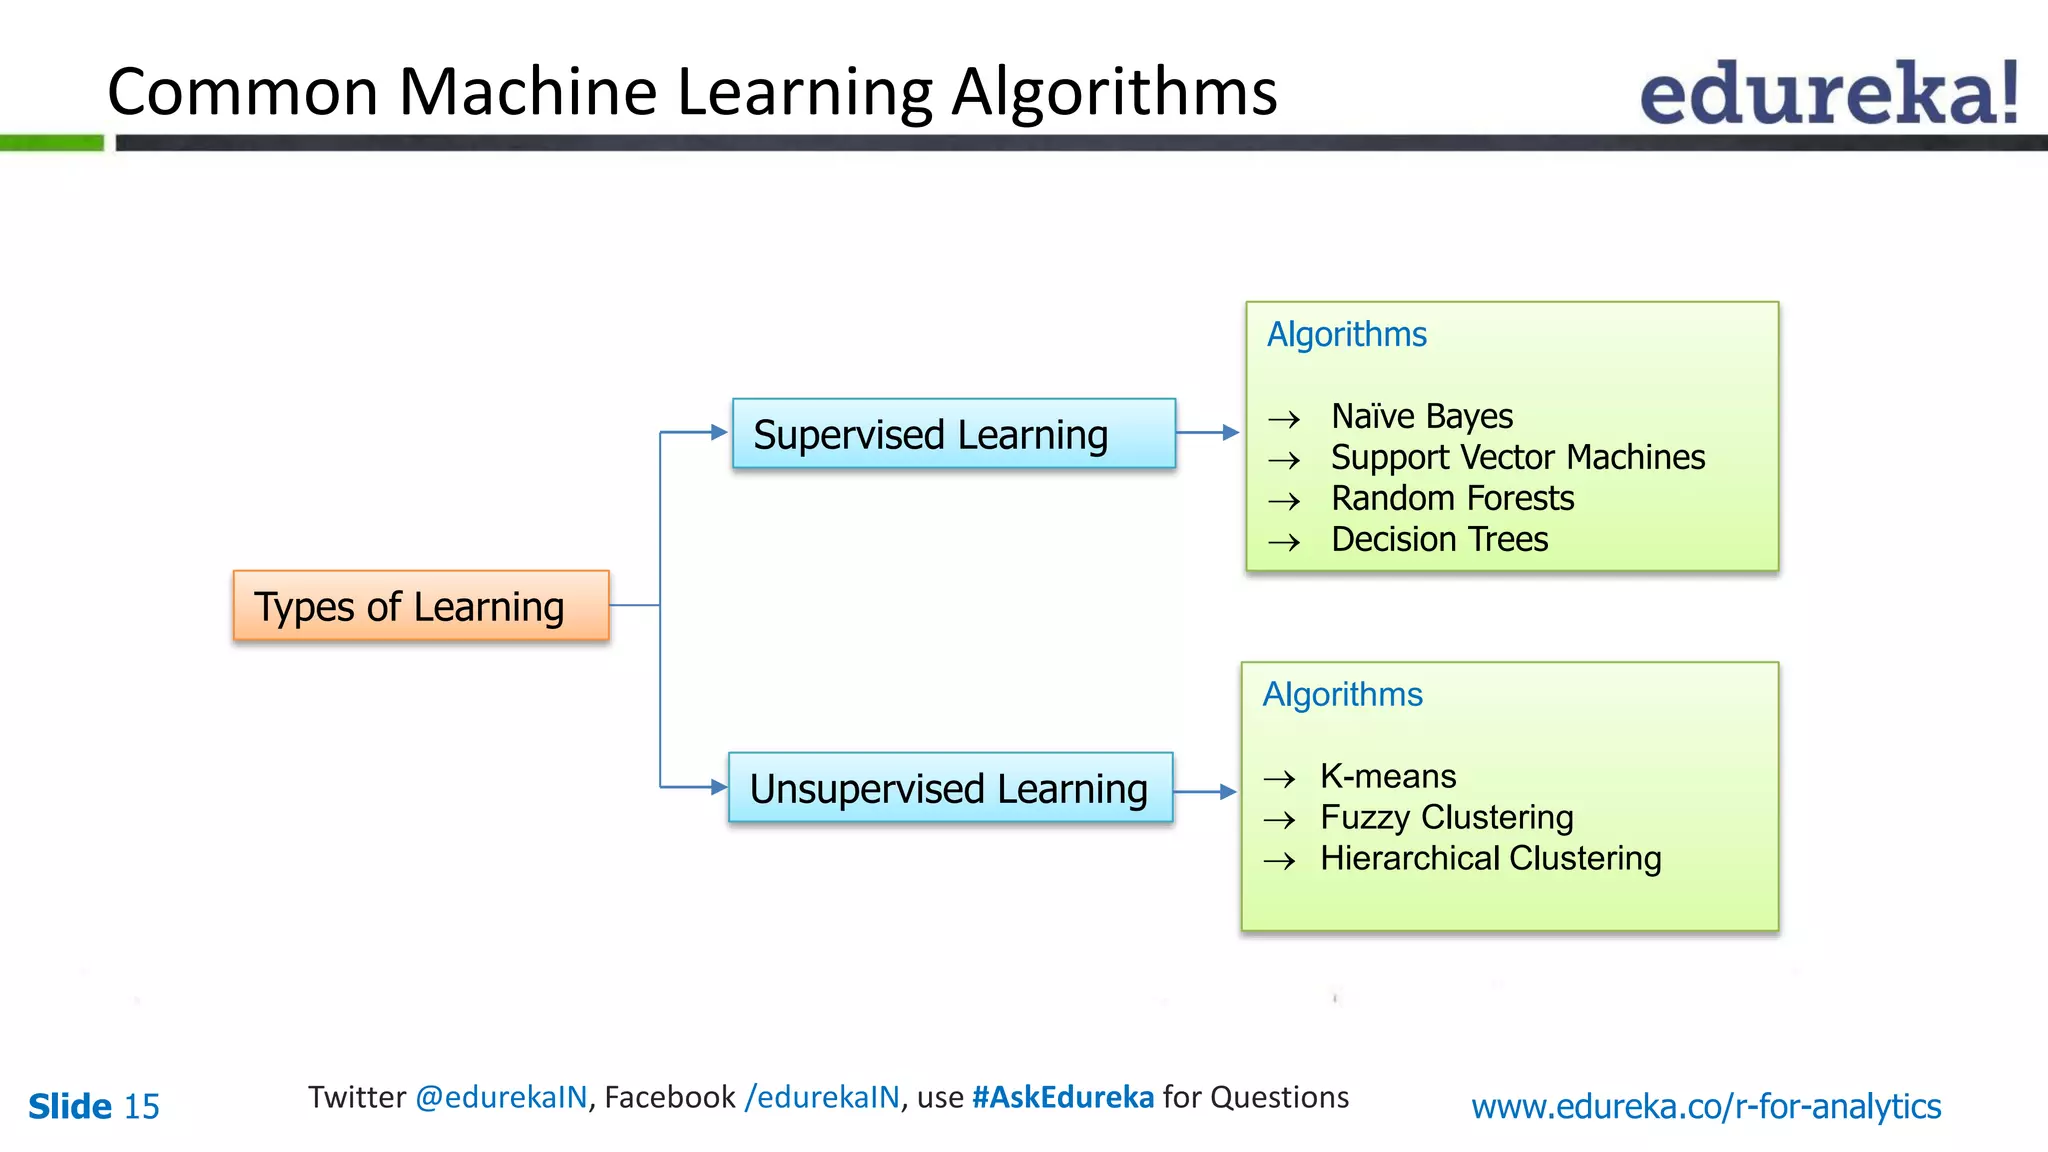
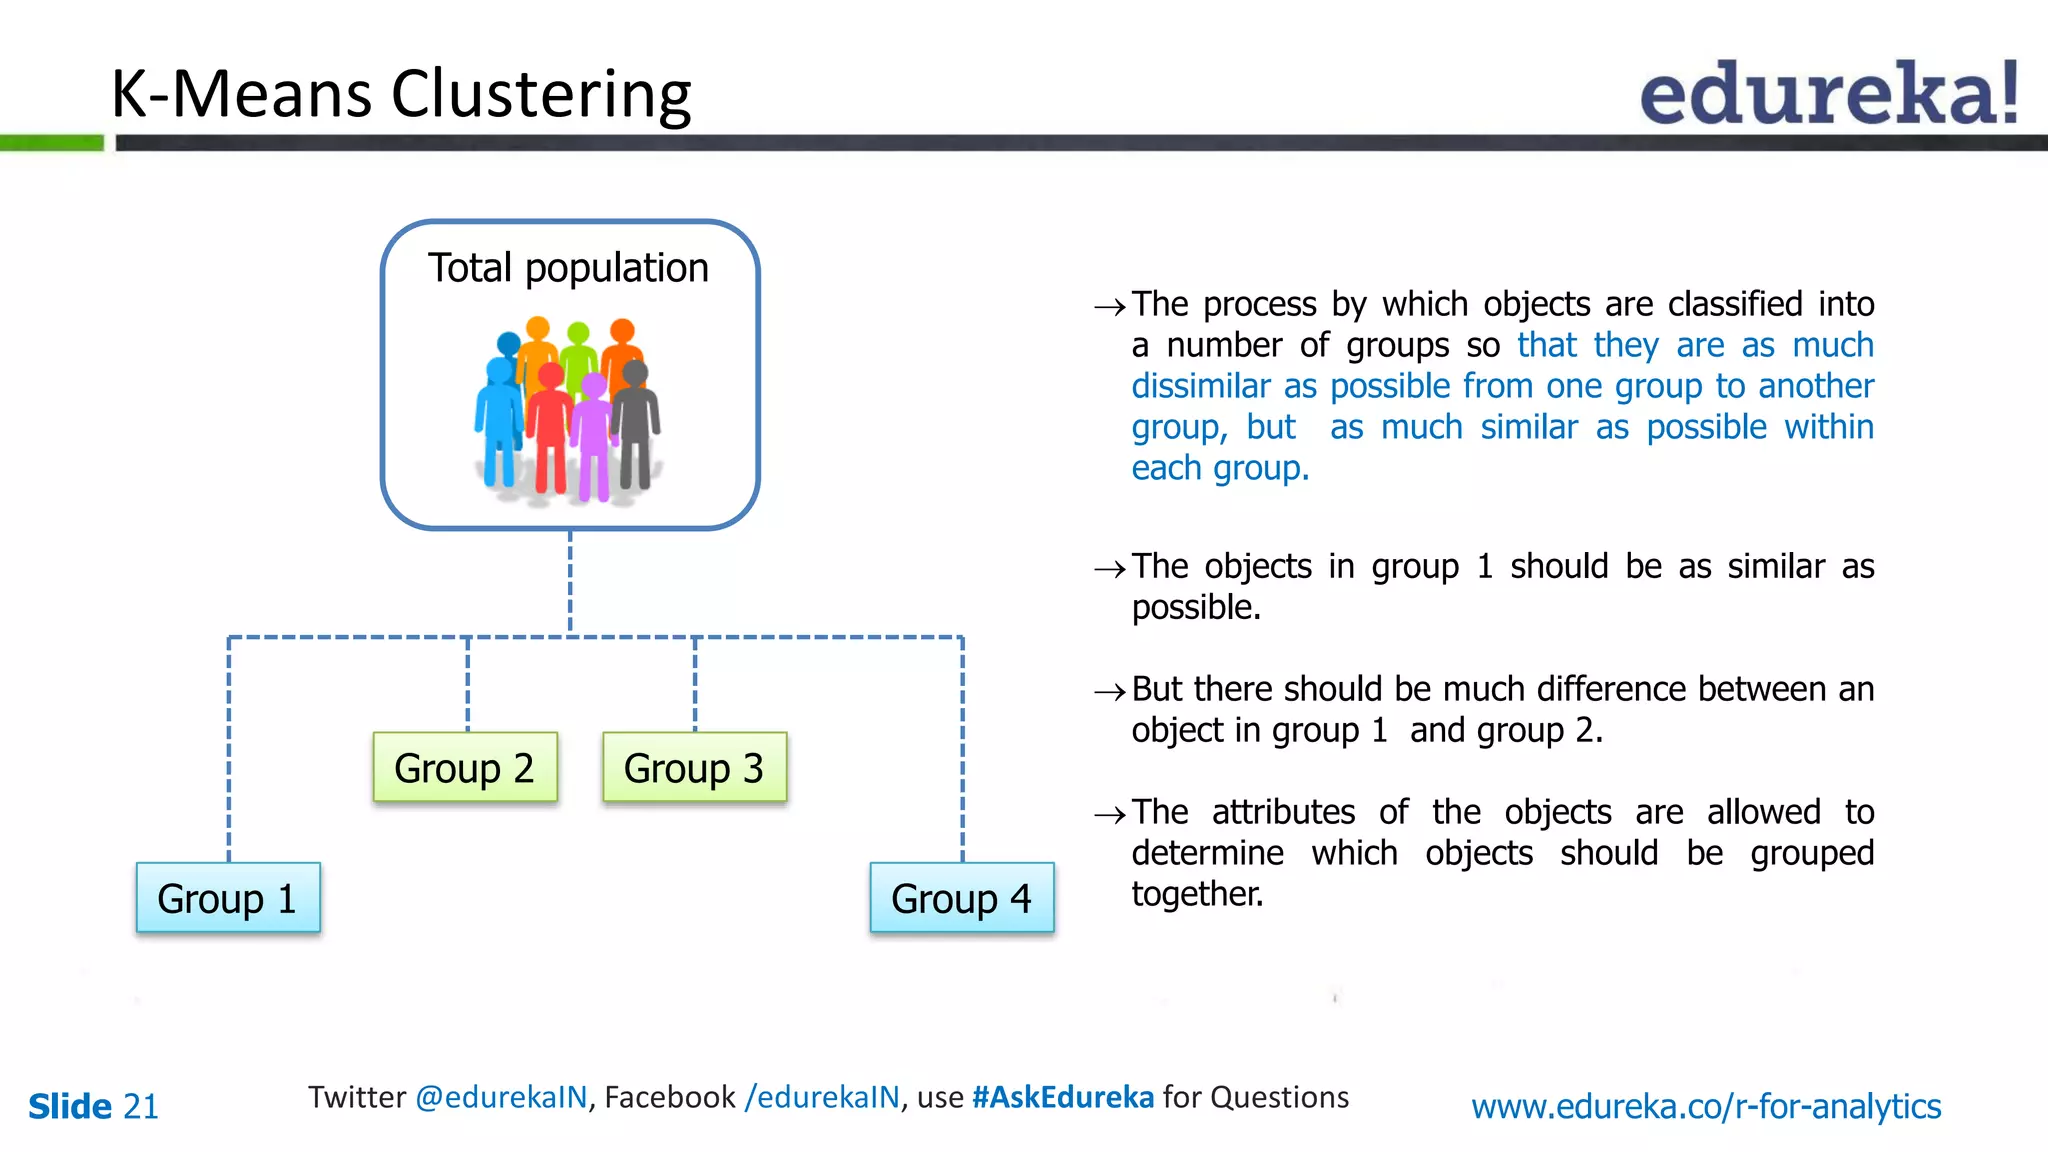
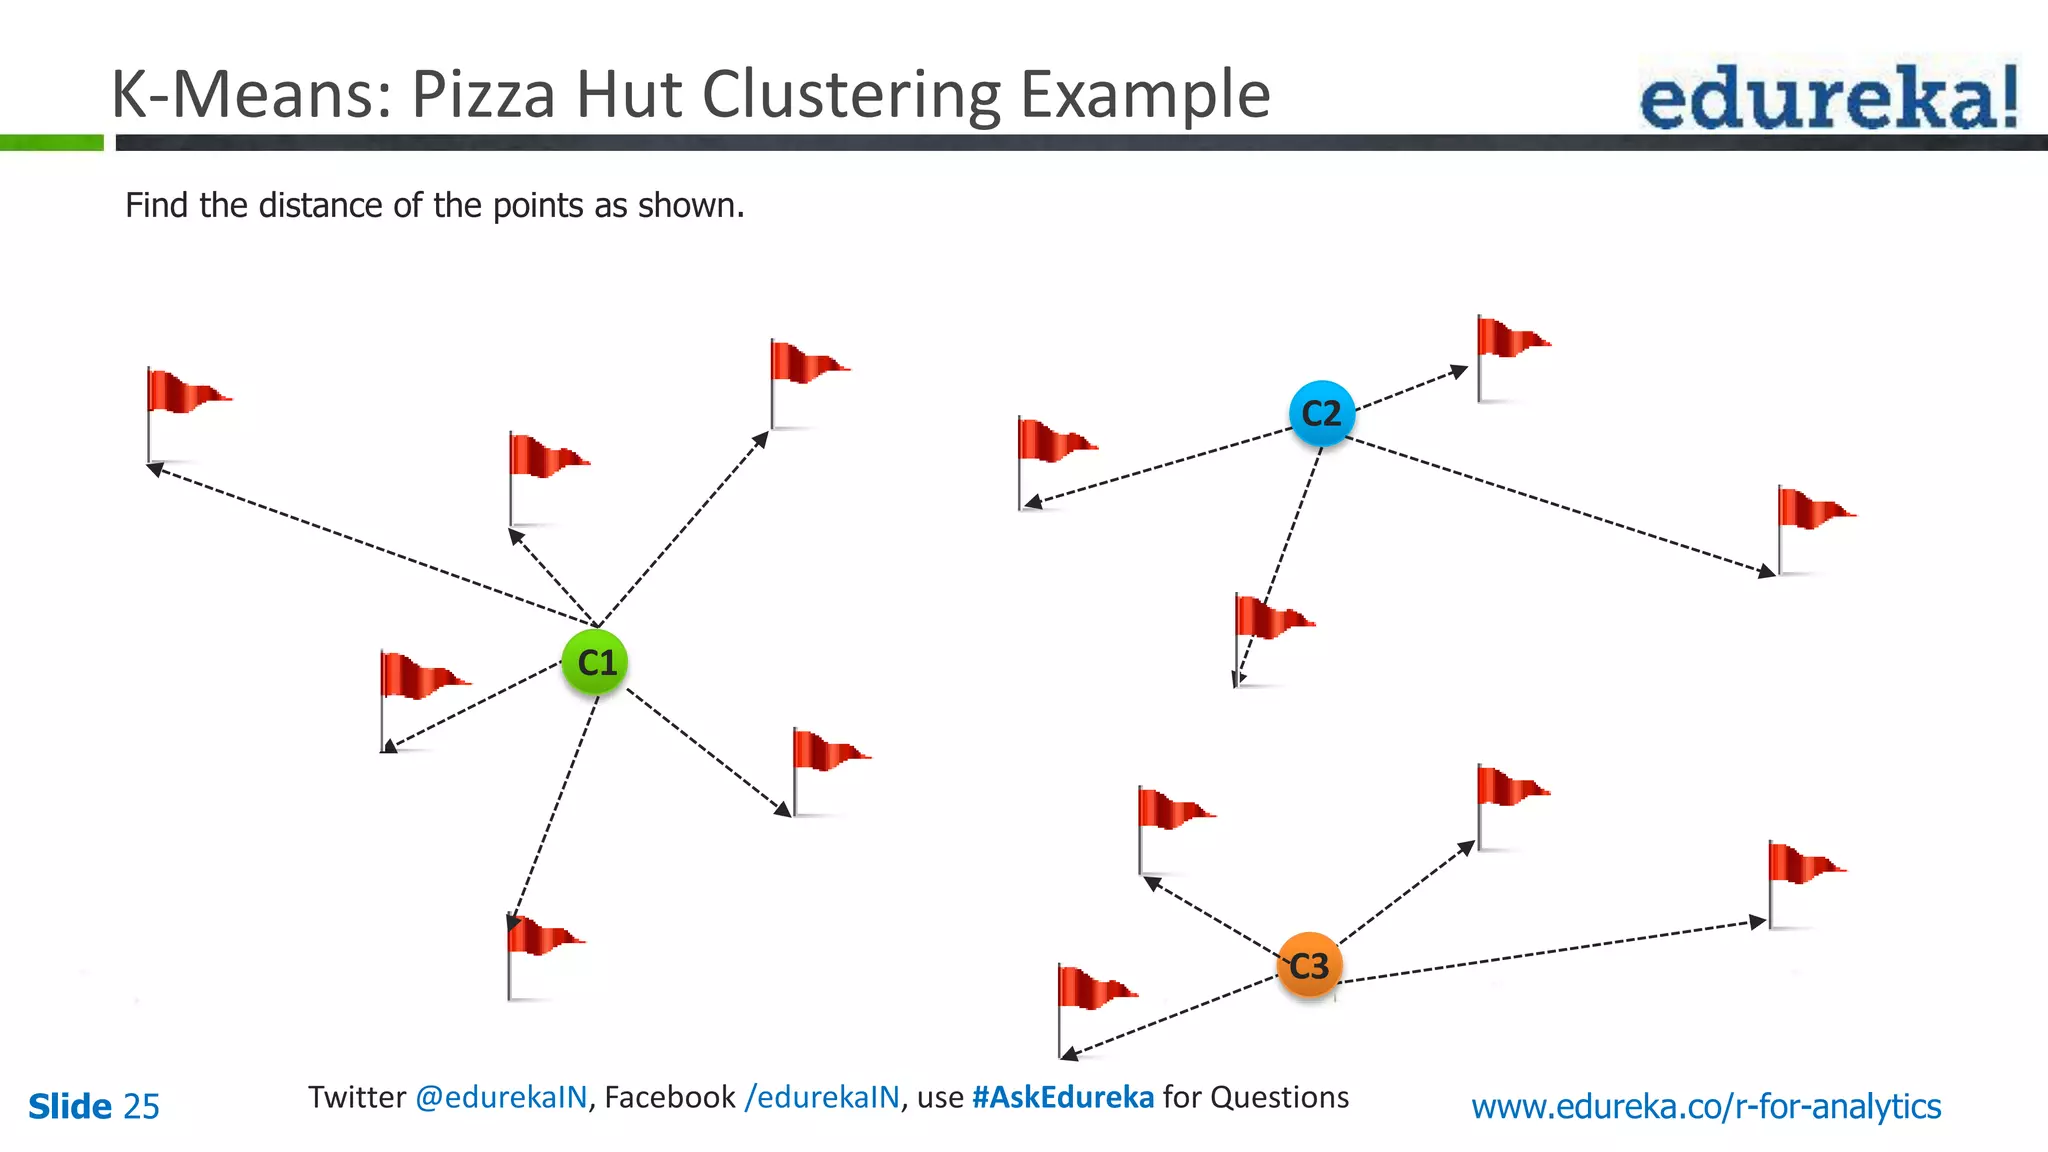
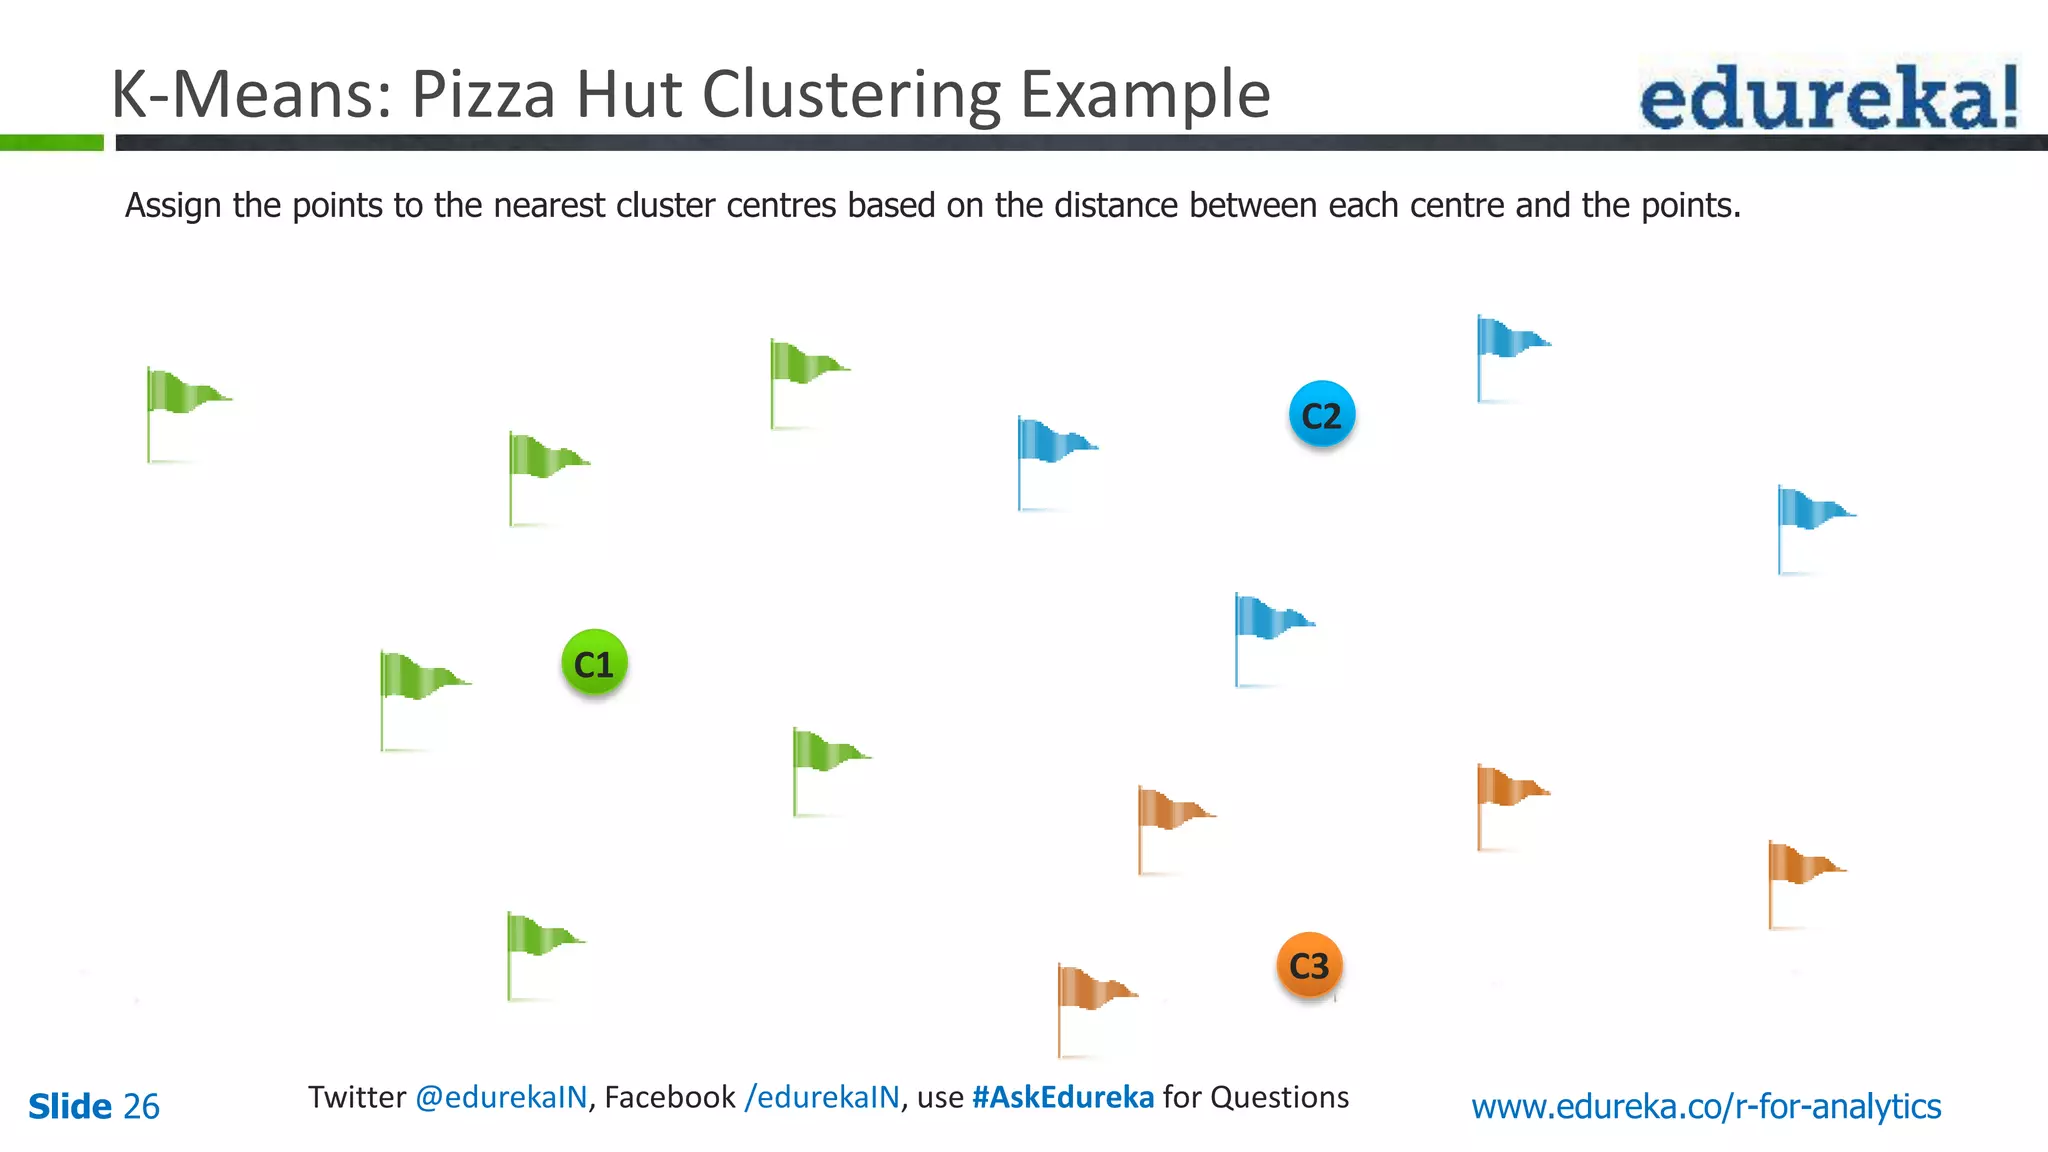
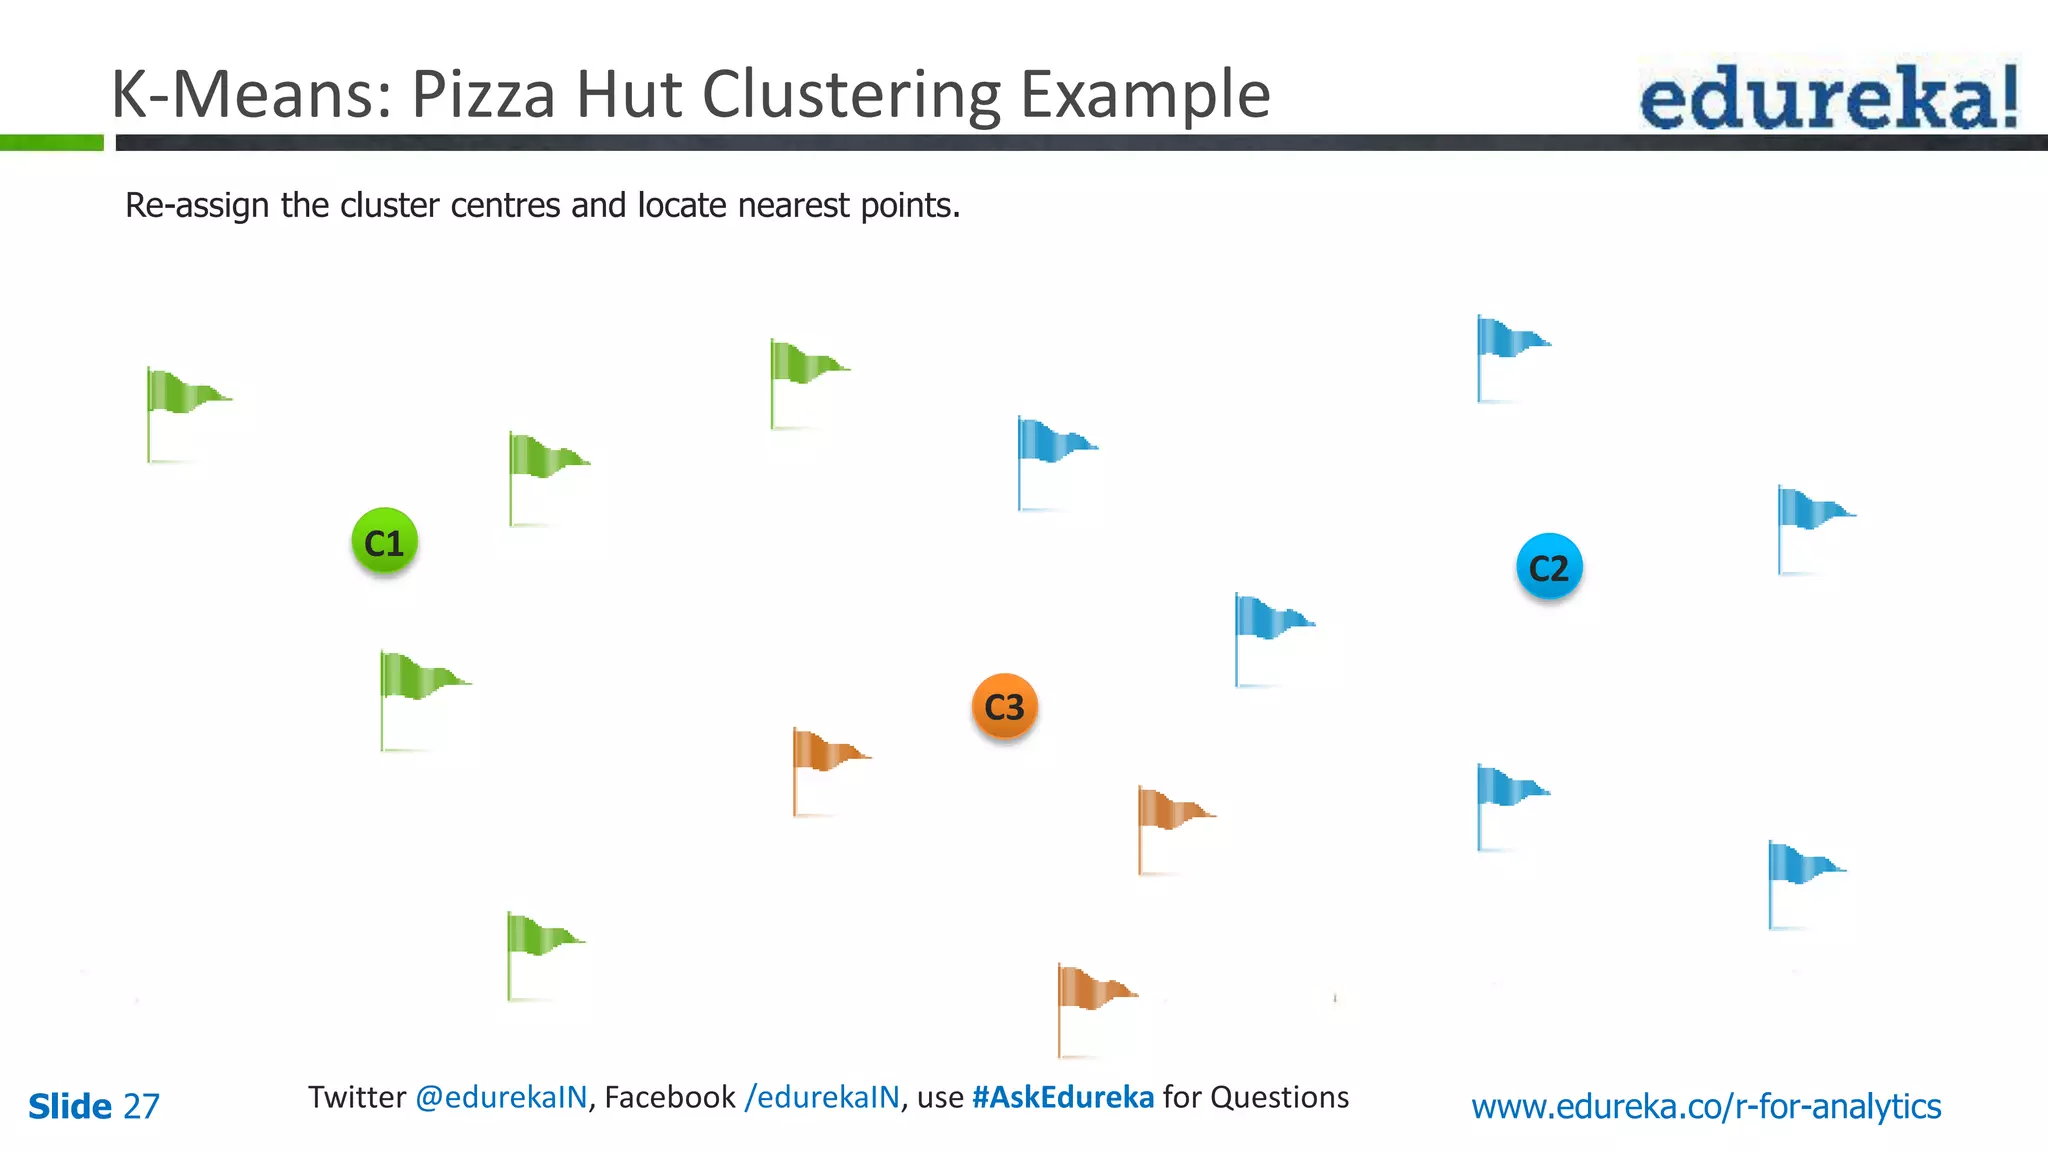
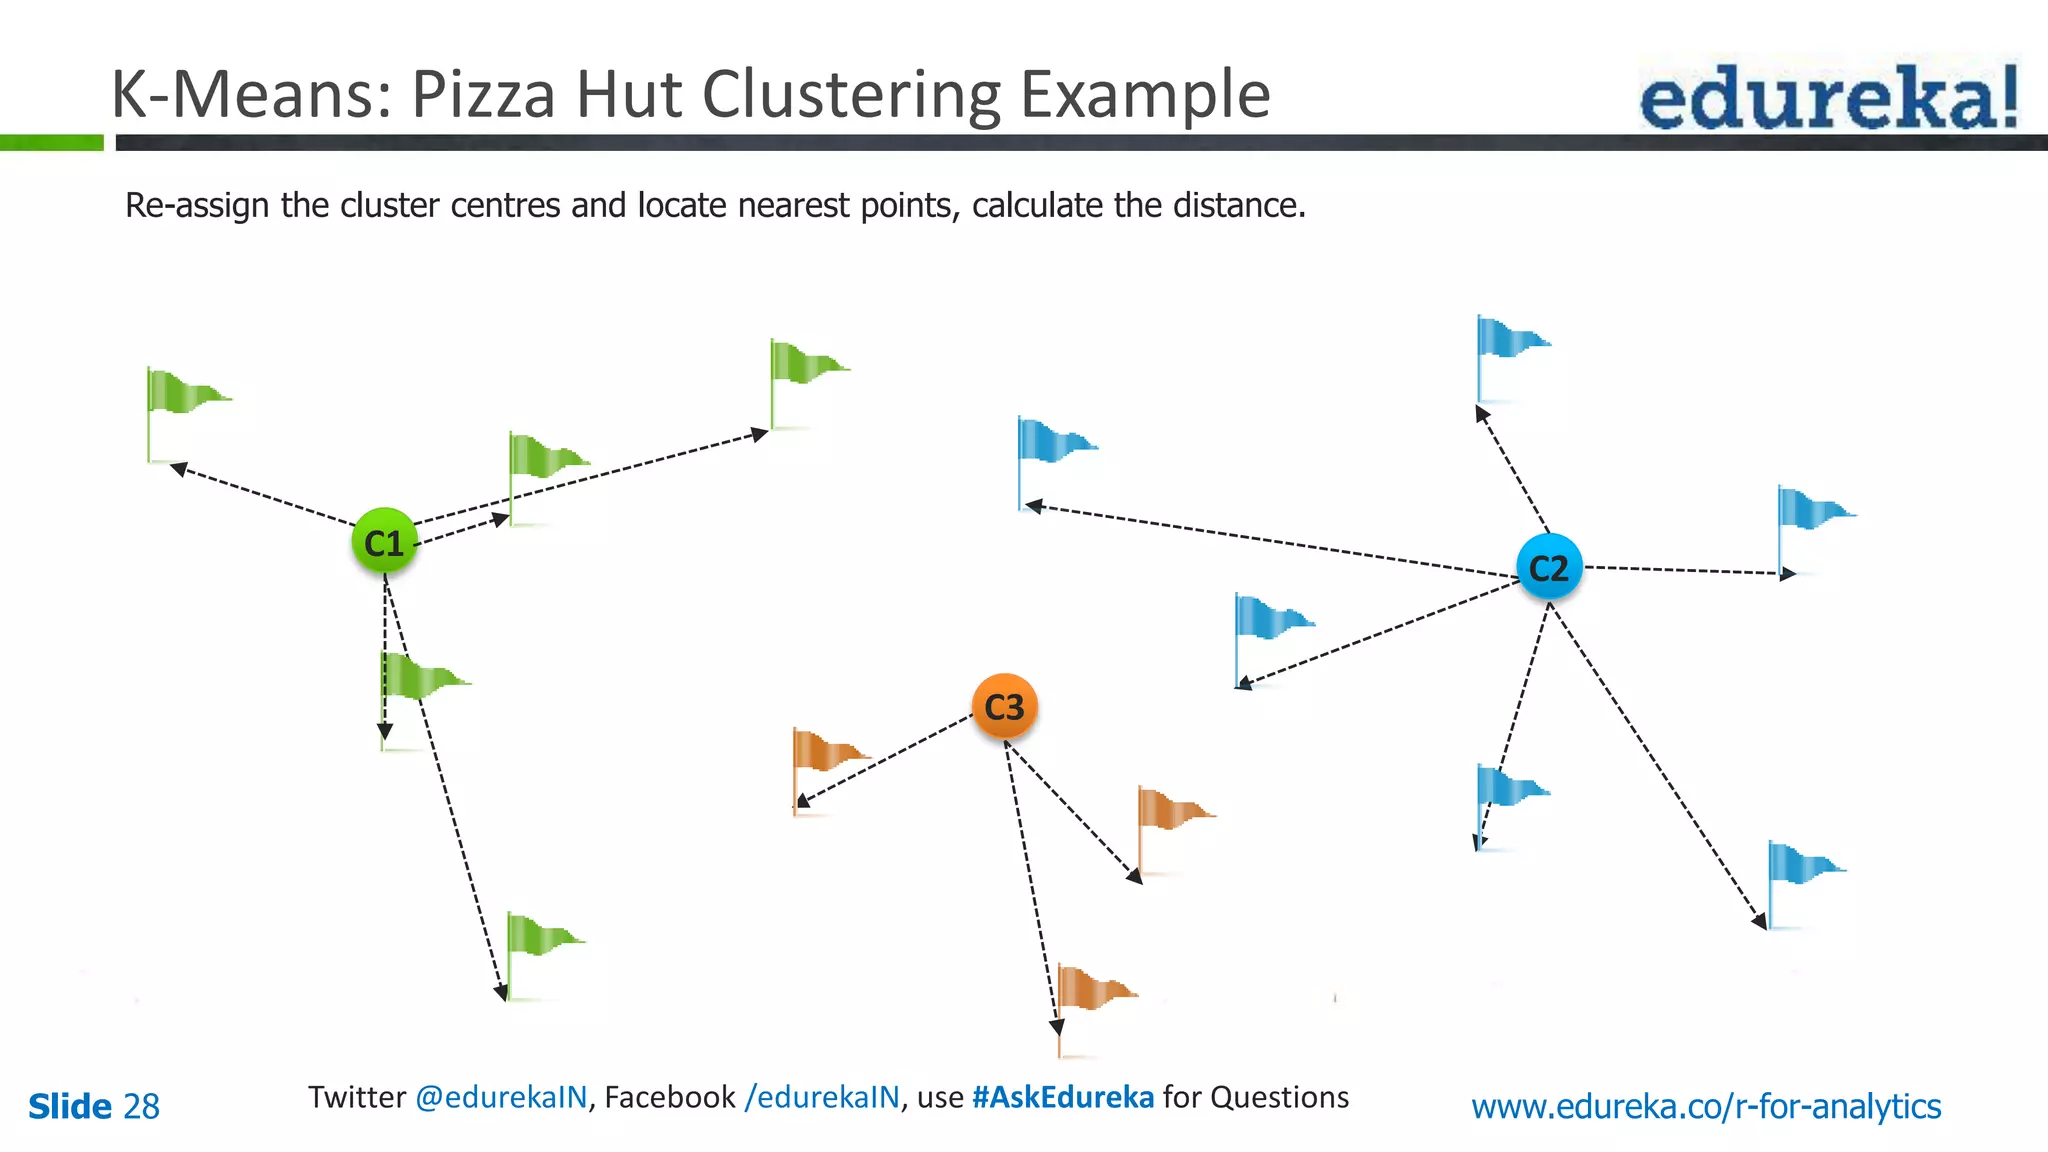
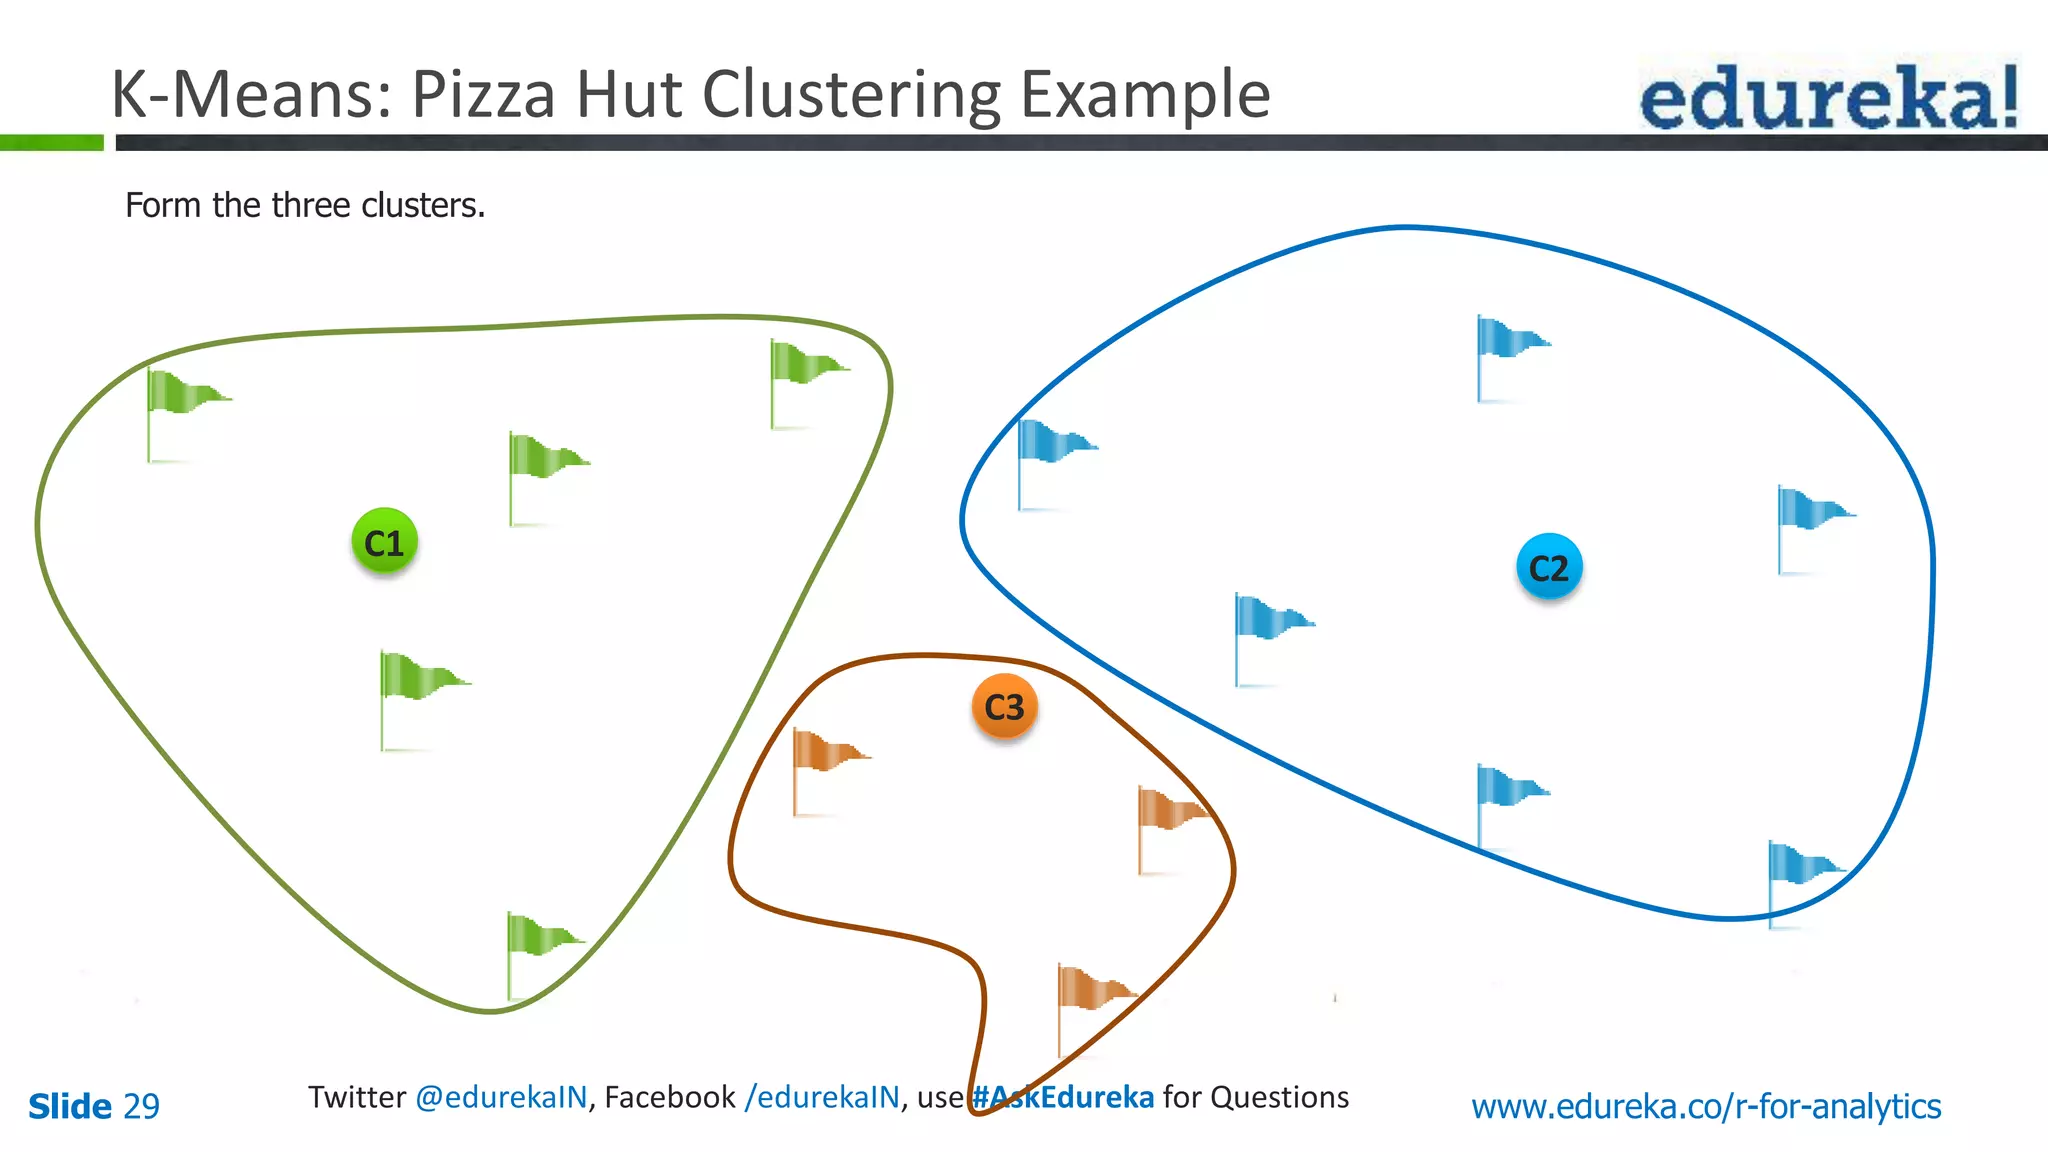
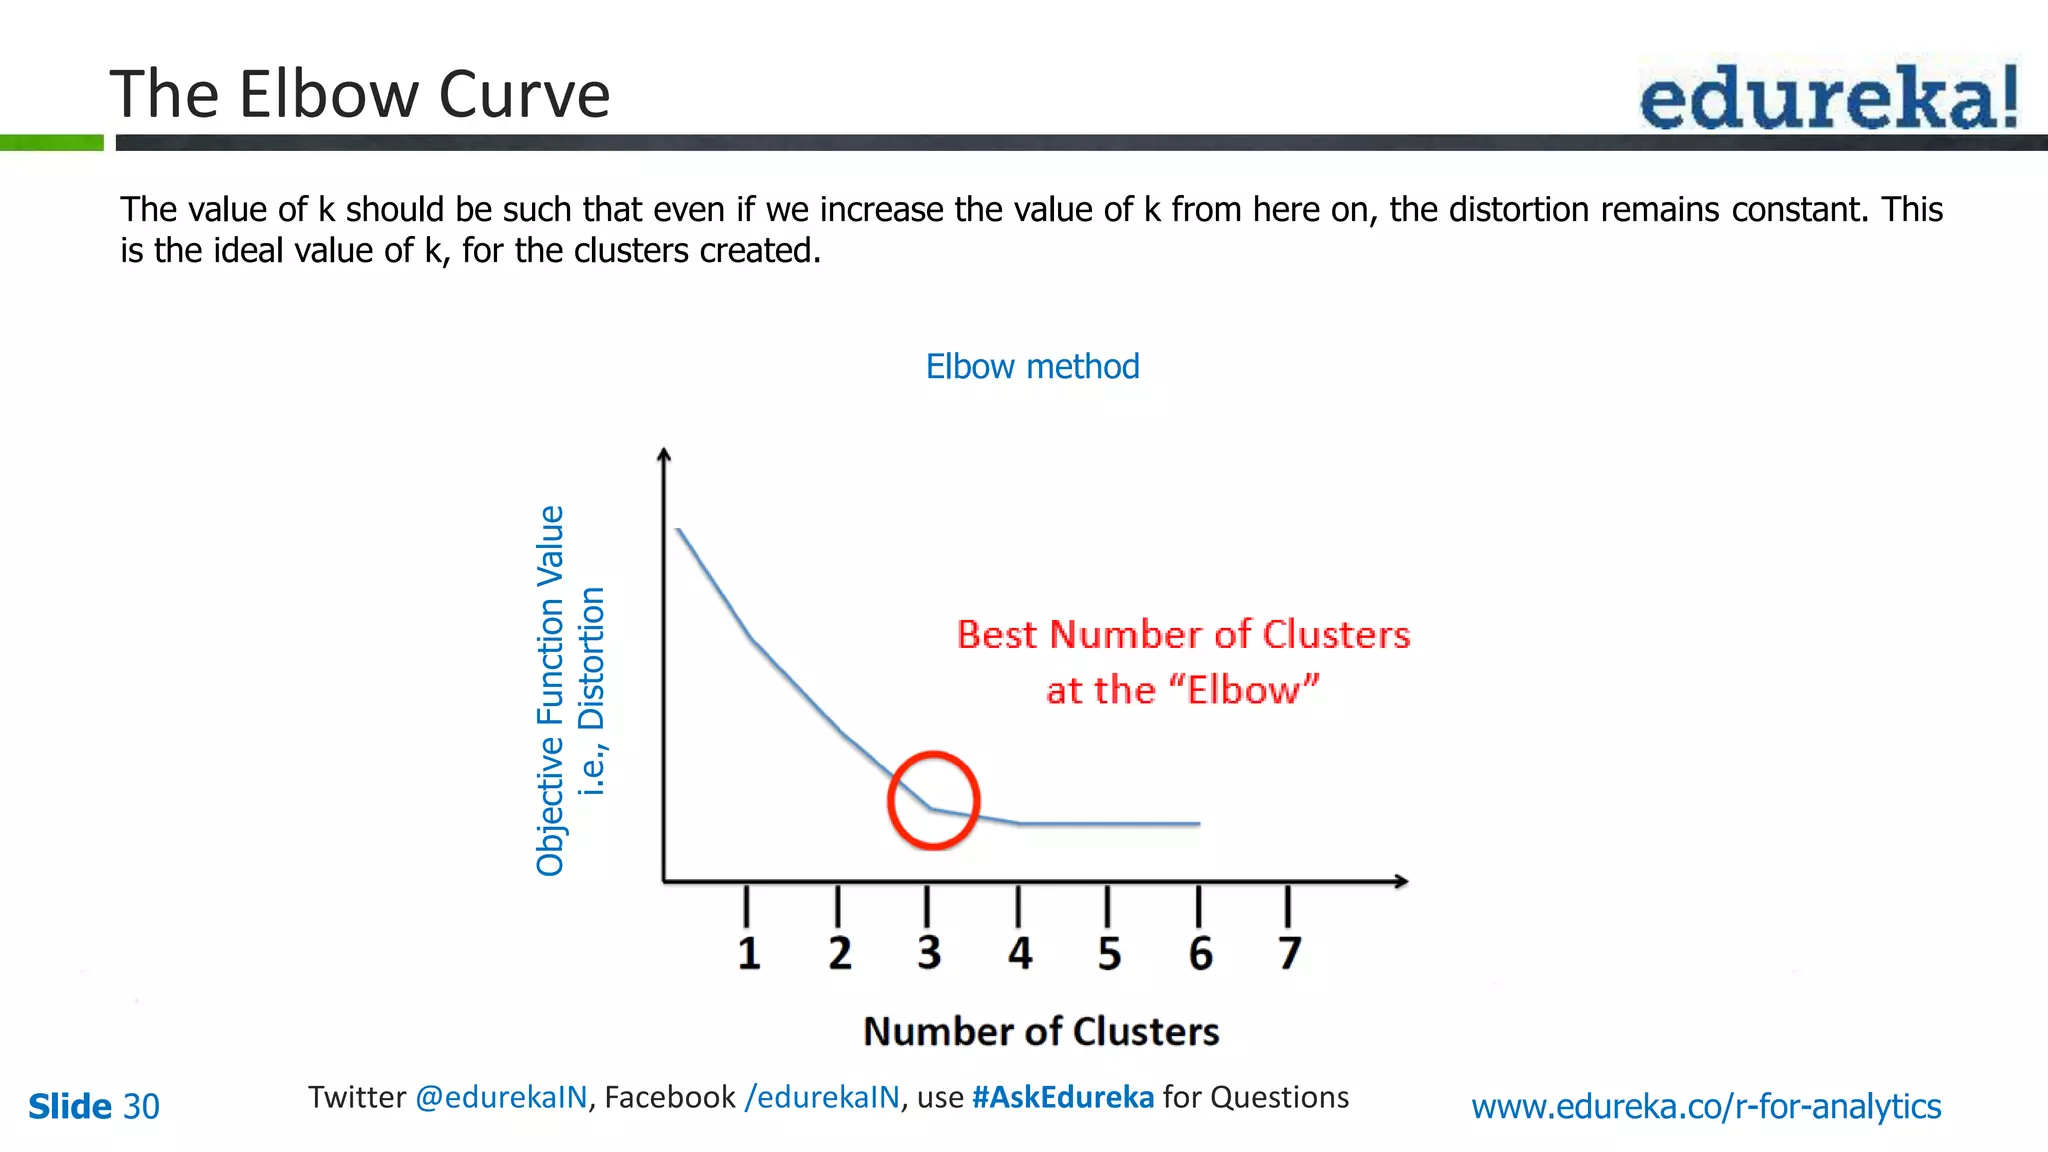
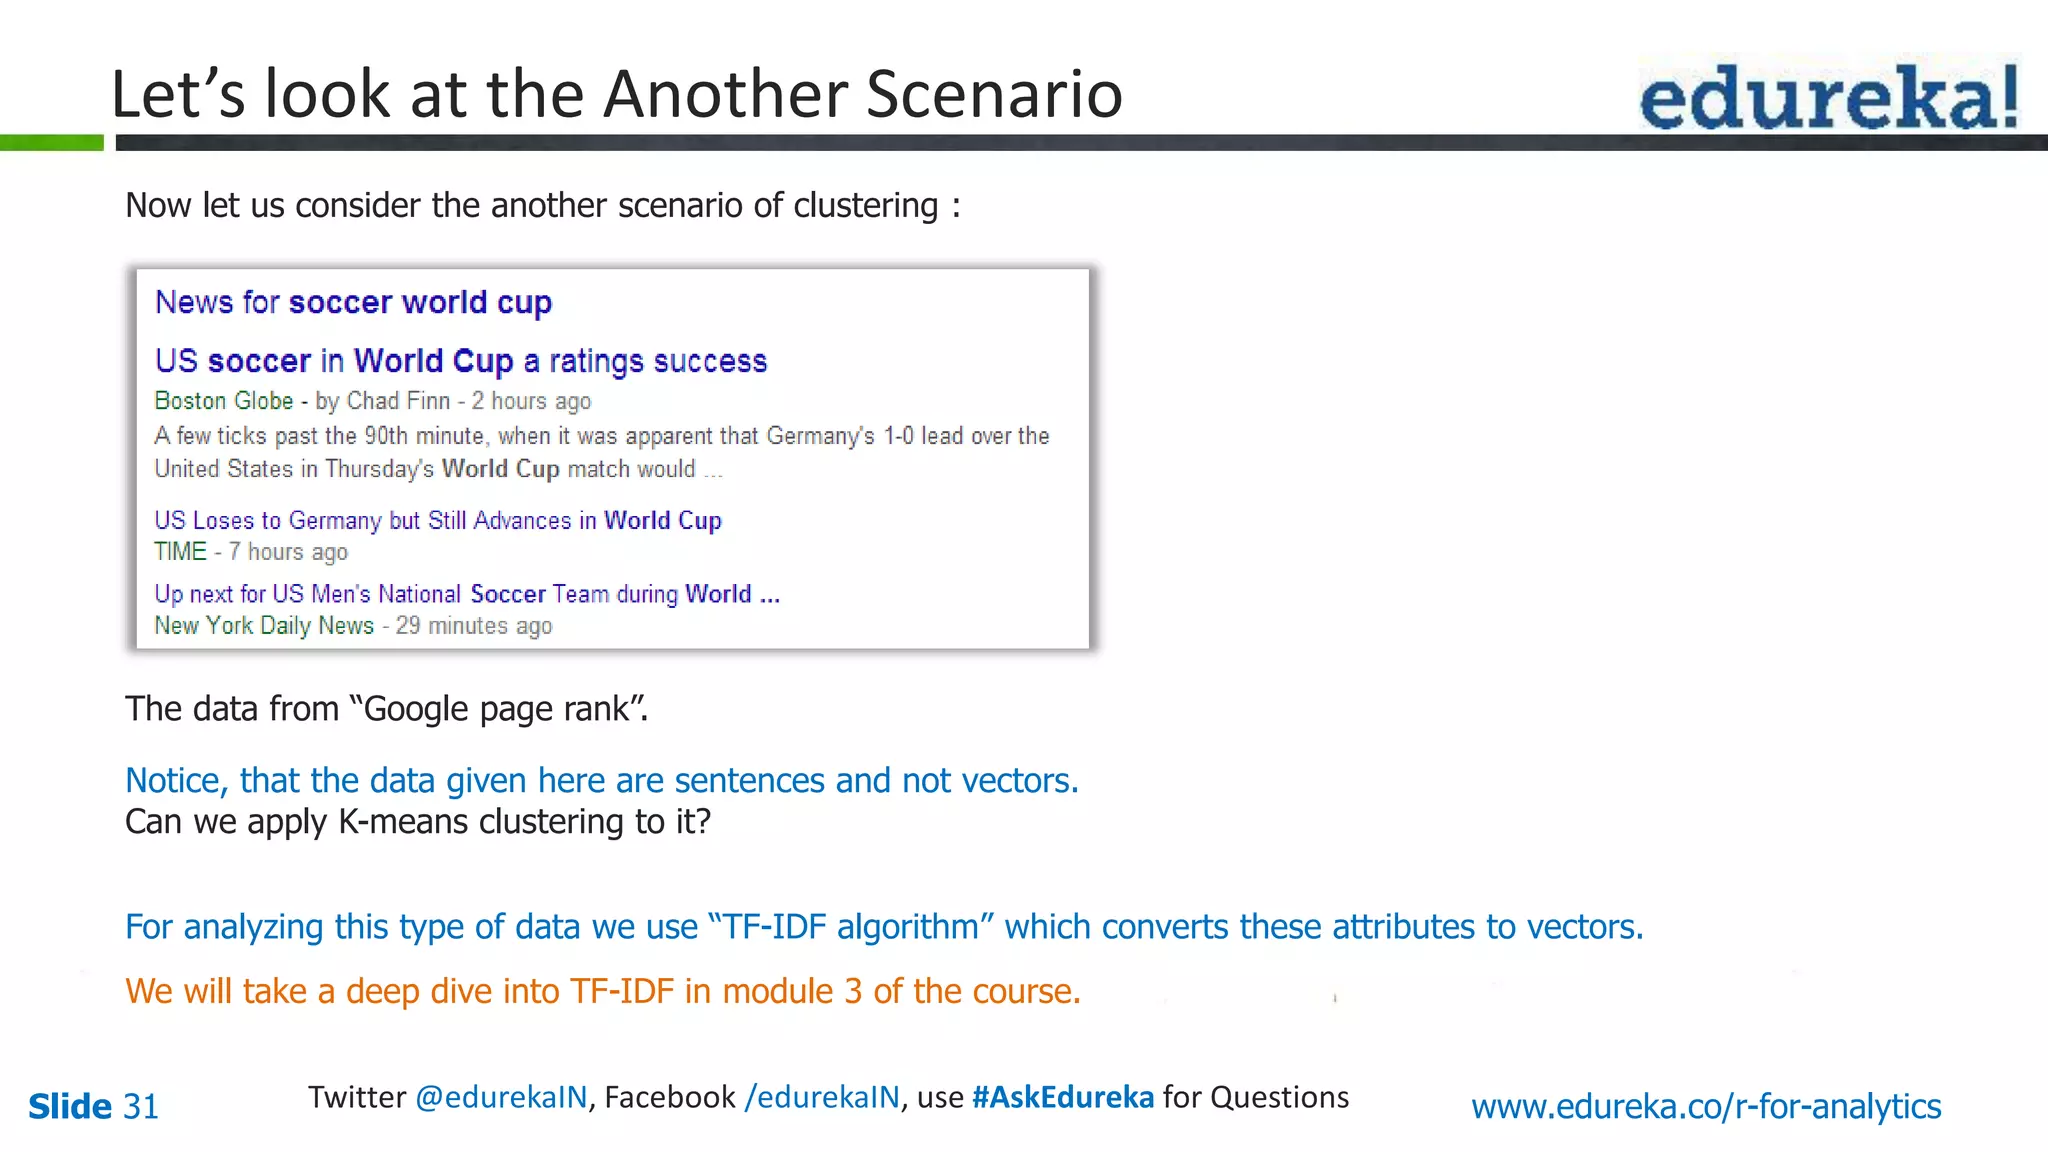
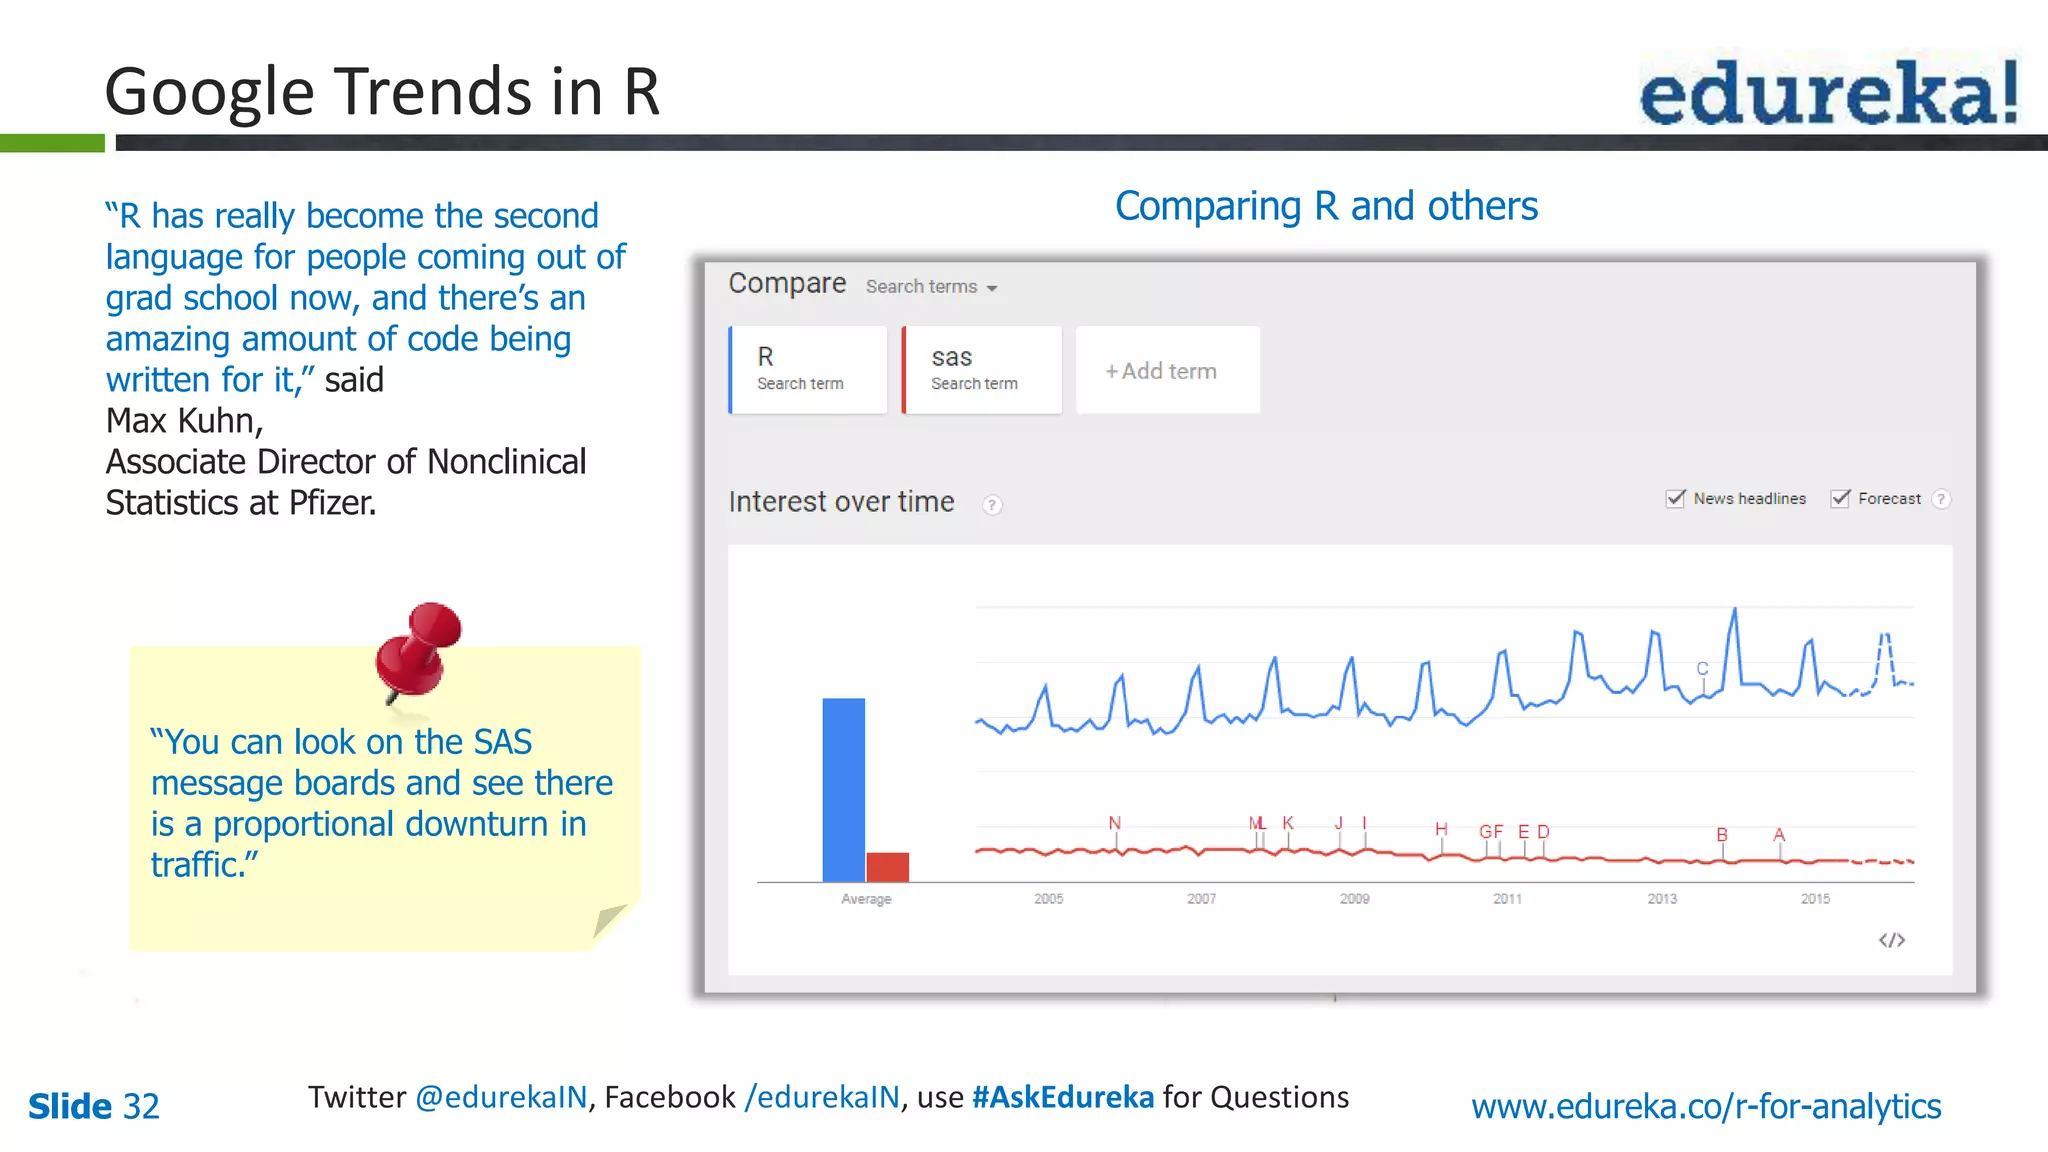
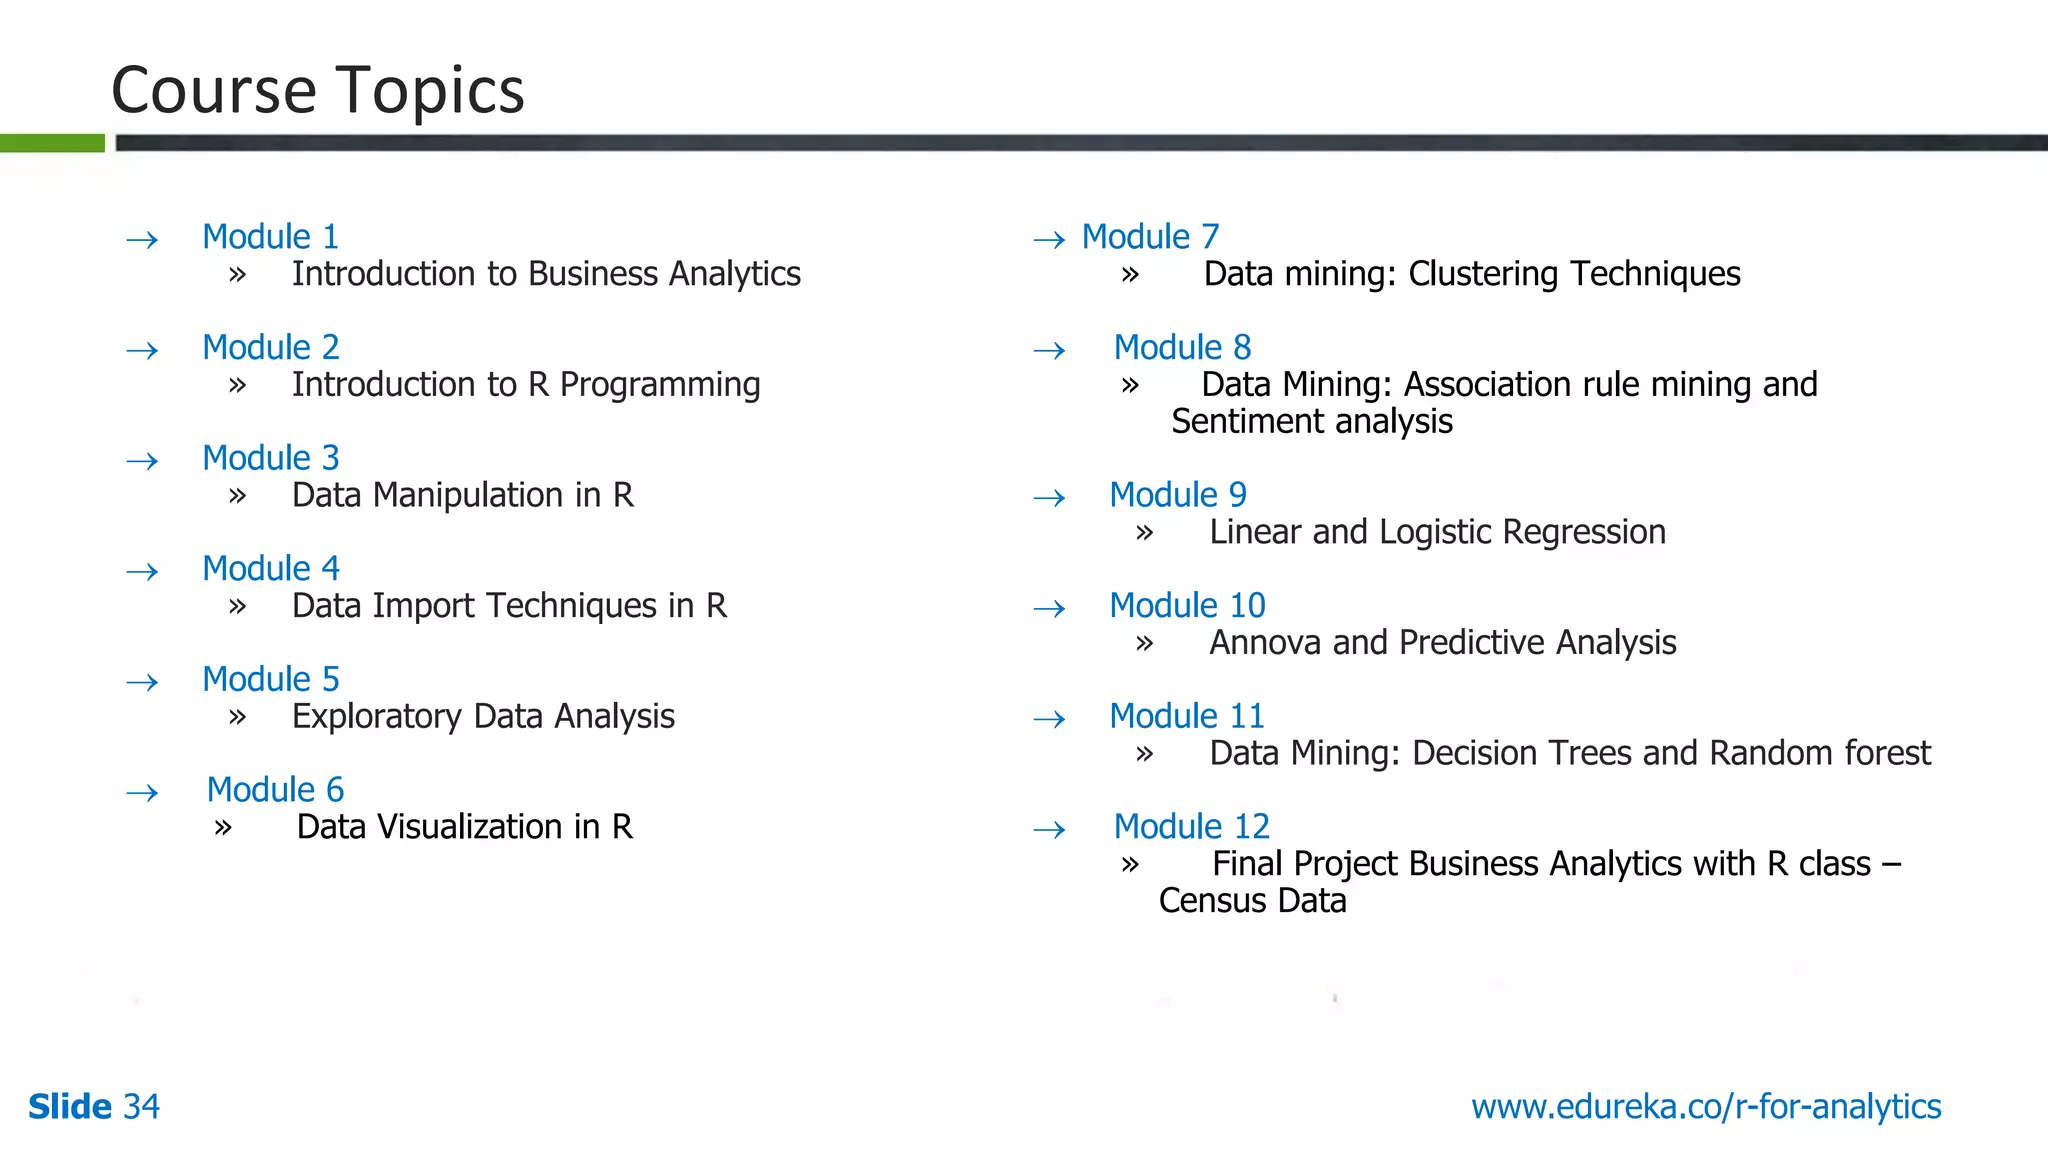
www.edureka.co/r-for-analytics View Business Analytics with R course details at www.edureka.co/r-for-analytics Business Analytics with R Introduction to R Programming and Machine Learning For Queries: Post on Twitter @edurekaIN: #askEdureka Post on Facebook /edurekaIN For more details please contact us: US : 1800 275 9730 (toll free) INDIA : +91 88808 62004 Email Us : sales@edureka.co
www.edureka.co/r-for-analyticsSlide 2 Twitter @edurekaIN, Facebook /edurekaIN, use #AskEdureka for Questions Objectives  What is R  Domains and companies in which R is used  Characteristics of R  Get an overview of Machine Learning  Understand the difference between Supervised and Unsupervised Learning  Learn Clustering and K-means Clustering  Implement K-means clustering in R  Google Trends for R At the end of this session, you will be able to
Slide 3Slide 3 www.edureka.co/r-for-analyticsTwitter @edurekaIN, Facebook /edurekaIN, use #AskEdureka for Questions Business Analytics Why Business Analytics is getting popular these days ? Cost of storing data Cost of processing data
Slide 4Slide 4 www.edureka.co/r-for-analyticsTwitter @edurekaIN, Facebook /edurekaIN, use #AskEdureka for Questions Business Analytics “Study of business data using statistical techniques and programming for creating decision support and insights for achieving business goals”. Business analytics is used to evaluate organization-wide operations, and can be implemented in any department from sales to product development to customer service. Business analytics solutions typically use statistical and quantitative analysis and fact-based data to measure past performance to guide an organization's business planning. Definition Who creates it? How? Who uses it? How?
Slide 5Slide 5 www.edureka.co/r-for-analyticsTwitter @edurekaIN, Facebook /edurekaIN, use #AskEdureka for Questions Who Uses R : Domains  Telecom  Pharmaceuticals  Financial Services  Life Sciences  Education, etc
Slide 6Slide 6 www.edureka.co/r-for-analyticsTwitter @edurekaIN, Facebook /edurekaIN, use #AskEdureka for Questions Who Uses R : Companies Consumer Financial Protection Bureau The Consumer Financial Protection Bureau uses R for data analysis Mozilla Mozilla, the foundation responsible for the Firefox web browser, uses R to visualize Web activity Bank of America Bank of America uses R for reporting Foursquare R is part of technology stack behind Foursquare’s famed recommendation engine ANZ Bank ANZ, the fourth largest bank in Australia, using R for credit risk analysis Google Google uses R to predict Economic Activity
Slide 7Slide 7 www.edureka.co/r-for-analyticsTwitter @edurekaIN, Facebook /edurekaIN, use #AskEdureka for Questions Who Uses R : Companies Corporate Clients of R http://www.revolutionanalytics.com/aboutus/our-customers.php
Slide 8Slide 8 www.edureka.co/r-for-analyticsTwitter @edurekaIN, Facebook /edurekaIN, use #AskEdureka for Questions R : Characteristics  R is open source and free.  R has lots of packages and multiple ways of doing the same thing.  By default stores memory in RAM.  R has the most advanced graphics. You need much better programming skills.  R has GUI to help make learning easier.  Customization needs command line.  R can connect to many database and data types. “The great beauty of R is that you can modify it to do all sorts of things,” said Hal Varian, chief economist at Google. “And you have a lot of pre-packaged stuff that’s already available, so you’re standing on the shoulders of giants.”
Slide 9Slide 9 www.edureka.co/r-for-analyticsTwitter @edurekaIN, Facebook /edurekaIN, use #AskEdureka for Questions What is R : Data Analysis Software  Data Scientists, Statisticians, Analysts, Quants, and others who need to make sense of data use R for statistical analysis, data visualization, and predictive modelling.  Rexer Analytics’s Annual Data Miner Survey is the largest survey of data mining, data science, and analytics professionals in the industry.  It has concluded that R's popularity has increased substantially in recent years. R is Data Analysis Software
Slide 10Slide 10 www.edureka.co/r-for-analyticsTwitter @edurekaIN, Facebook /edurekaIN, use #AskEdureka for Questions What is R : Programming Language  You do data analysis in R by writing scripts and functions in the R programming language.  R has also quickly found the following because statisticians, engineers and scientists without computer programming skills find it easy to use. Do not get intimated by the term ‘Programming Language’, the concepts from the very basic will be taught during the course. R is Programming Language
Slide 11Slide 11 www.edureka.co/r-for-analyticsTwitter @edurekaIN, Facebook /edurekaIN, use #AskEdureka for Questions What is R : Environment for Statistical Analysis  R language consists of functions for almost every data manipulation, statistical model, or chart that a data analyst could ever need.  For statisticians, however, R is particularly useful because it contains a number of built-in mechanisms for organizing data, running calculations on the information and creating graphical representations of data sets. R is Environment for Statistical Analysis
Slide 12Slide 12 www.edureka.co/r-for-analyticsTwitter @edurekaIN, Facebook /edurekaIN, use #AskEdureka for Questions Basics Of R - Command Line Basics of R - Command Line
www.edureka.co/r-for-analyticsSlide 13 Twitter @edurekaIN, Facebook /edurekaIN, use #AskEdureka for Questions Machine Learning Categories Types of Learning Supervised Learning Unsupervised Learning Inferring a function from labelled training data. Trying to find hidden structure in unlabelled data.
www.edureka.co/r-for-analyticsSlide 14 Twitter @edurekaIN, Facebook /edurekaIN, use #AskEdureka for Questions Machine Learning Categories What category do the applications below fall into? Supervised Learning Supervised Learning Unsupervised Learning Unsupervised Learning
www.edureka.co/r-for-analyticsSlide 15 Twitter @edurekaIN, Facebook /edurekaIN, use #AskEdureka for Questions Common Machine Learning Algorithms Types of Learning Supervised Learning Unsupervised Learning Algorithms  Naïve Bayes  Support Vector Machines  Random Forests  Decision Trees Algorithms  K-means  Fuzzy Clustering  Hierarchical Clustering
www.edureka.co/r-for-analyticsSlide 16 Twitter @edurekaIN, Facebook /edurekaIN, use #AskEdureka for Questions Clustering
www.edureka.co/r-for-analyticsSlide 17 Twitter @edurekaIN, Facebook /edurekaIN, use #AskEdureka for Questions Clustering: Scenarios The following scenarios implement Clustering:  A telephone company needs to establish its network by putting its towers in a particular region it has acquired. The location of putting these towers can be found by clustering algorithm so that all its users receive optimum signal strength.  The Miami DEA wants to make its law enforcement more stringent and hence have decided to make their patrol vans stationed across the area so that the areas of high crime rates are in vicinity to the patrol vans.  A Hospital Care chain wants to open a series of Emergency-Care wards, keeping in mind the factor of maximum accident prone areas in a region.
www.edureka.co/r-for-analyticsSlide 18 Twitter @edurekaIN, Facebook /edurekaIN, use #AskEdureka for Questions Some More Use-Cases of Clustering  Organizing data into clusters shows internal structure of the data Ex. Clusty and clustering genes  Sometimes the partitioning is the goal Ex. Market segmentation  Prepare for other AI techniques Ex. Summarize news (cluster and then find centroid)  Discovery in data Ex. Underlying rules, reoccurring patterns, topics, etc.
www.edureka.co/r-for-analyticsSlide 19 Twitter @edurekaIN, Facebook /edurekaIN, use #AskEdureka for Questions What is Clustering? Organizing data into clusters such that there is:  High intra-cluster similarity  Low inter-cluster similarity  Informally, finding natural groupings among objects http://en.wikipedia.org/wiki/Cluster_analysis
www.edureka.co/r-for-analyticsSlide 20 Twitter @edurekaIN, Facebook /edurekaIN, use #AskEdureka for Questions K-Means Clustering
www.edureka.co/r-for-analyticsSlide 21 Twitter @edurekaIN, Facebook /edurekaIN, use #AskEdureka for Questions K-Means Clustering The process by which objects are classified into a number of groups so that they are as much dissimilar as possible from one group to another group, but as much similar as possible within each group. The objects in group 1 should be as similar as possible. But there should be much difference between an object in group 1 and group 2. The attributes of the objects are allowed to determine which objects should be grouped together. Total population Group 1 Group 2 Group 3 Group 4
www.edureka.co/r-for-analyticsSlide 22 Twitter @edurekaIN, Facebook /edurekaIN, use #AskEdureka for Questions K-Means: Pizza Hut Clustering Example
www.edureka.co/r-for-analyticsSlide 23 Twitter @edurekaIN, Facebook /edurekaIN, use #AskEdureka for Questions Let us suppose the following points are the delivery locations for Pizza. K-Means: Pizza Hut Clustering Example
www.edureka.co/r-for-analyticsSlide 24 Twitter @edurekaIN, Facebook /edurekaIN, use #AskEdureka for Questions Lets locate three cluster centres randomly C1 C3 C2 K-Means: Pizza Hut Clustering Example
www.edureka.co/r-for-analyticsSlide 25 Twitter @edurekaIN, Facebook /edurekaIN, use #AskEdureka for Questions Find the distance of the points as shown. C1 C3 C2 K-Means: Pizza Hut Clustering Example
www.edureka.co/r-for-analyticsSlide 26 Twitter @edurekaIN, Facebook /edurekaIN, use #AskEdureka for Questions Assign the points to the nearest cluster centres based on the distance between each centre and the points. C1 C2 C3 K-Means: Pizza Hut Clustering Example
www.edureka.co/r-for-analyticsSlide 27 Twitter @edurekaIN, Facebook /edurekaIN, use #AskEdureka for Questions Re-assign the cluster centres and locate nearest points. C1 C2 C3 K-Means: Pizza Hut Clustering Example
www.edureka.co/r-for-analyticsSlide 28 Twitter @edurekaIN, Facebook /edurekaIN, use #AskEdureka for Questions Re-assign the cluster centres and locate nearest points, calculate the distance. C1 C2 C3 K-Means: Pizza Hut Clustering Example
www.edureka.co/r-for-analyticsSlide 29 Twitter @edurekaIN, Facebook /edurekaIN, use #AskEdureka for Questions Form the three clusters. C1 C2 C3 K-Means: Pizza Hut Clustering Example
www.edureka.co/r-for-analyticsSlide 30 Twitter @edurekaIN, Facebook /edurekaIN, use #AskEdureka for Questions ObjectiveFunctionValue i.e.,Distortion Elbow method The value of k should be such that even if we increase the value of k from here on, the distortion remains constant. This is the ideal value of k, for the clusters created. The Elbow Curve
www.edureka.co/r-for-analyticsSlide 31 Twitter @edurekaIN, Facebook /edurekaIN, use #AskEdureka for Questions Now let us consider the another scenario of clustering : The data from “Google page rank”. Notice, that the data given here are sentences and not vectors. Can we apply K-means clustering to it? We will take a deep dive into TF-IDF in module 3 of the course. Let’s look at the Another Scenario For analyzing this type of data we use “TF-IDF algorithm” which converts these attributes to vectors.
Slide 32Slide 32 www.edureka.co/r-for-analyticsTwitter @edurekaIN, Facebook /edurekaIN, use #AskEdureka for Questions “R has really become the second language for people coming out of grad school now, and there’s an amazing amount of code being written for it,” said Max Kuhn, Associate Director of Nonclinical Statistics at Pfizer. Comparing R and others “You can look on the SAS message boards and see there is a proportional downturn in traffic.” Google Trends in R
Slide 33 www.edureka.co/r-for-analyticsTwitter @edurekaIN, Facebook /edurekaIN, use #AskEdureka for Questions R: Demand Supply Gap
Slide 34 www.edureka.co/r-for-analytics  Module 1 » Introduction to Business Analytics  Module 2 » Introduction to R Programming  Module 3 » Data Manipulation in R  Module 4 » Data Import Techniques in R  Module 5 » Exploratory Data Analysis  Module 6 » Data Visualization in R Course Topics  Module 7 » Data mining: Clustering Techniques  Module 8 » Data Mining: Association rule mining and Sentiment analysis  Module 9 » Linear and Logistic Regression  Module 10 » Annova and Predictive Analysis  Module 11 » Data Mining: Decision Trees and Random forest  Module 12 » Final Project Business Analytics with R class – Census Data
Slide 35 www.edureka.co/r-for-analytics LIVE Online Class Class Recording in LMS 24/7 Post Class Support Module Wise Quiz Project Work Verifiable Certificate How it Works
Slide 36 www.edureka.co/r-for-analytics

Webinar : Introduction to R Programming and Machine Learning

  • 1.
    www.edureka.co/r-for-analytics View Business Analyticswith R course details at www.edureka.co/r-for-analytics Business Analytics with R Introduction to R Programming and Machine Learning For Queries: Post on Twitter @edurekaIN: #askEdureka Post on Facebook /edurekaIN For more details please contact us: US : 1800 275 9730 (toll free) INDIA : +91 88808 62004 Email Us : sales@edureka.co
  • 2.
    www.edureka.co/r-for-analyticsSlide 2 Twitter@edurekaIN, Facebook /edurekaIN, use #AskEdureka for Questions Objectives  What is R  Domains and companies in which R is used  Characteristics of R  Get an overview of Machine Learning  Understand the difference between Supervised and Unsupervised Learning  Learn Clustering and K-means Clustering  Implement K-means clustering in R  Google Trends for R At the end of this session, you will be able to
  • 3.
    Slide 3Slide 3www.edureka.co/r-for-analyticsTwitter @edurekaIN, Facebook /edurekaIN, use #AskEdureka for Questions Business Analytics Why Business Analytics is getting popular these days ? Cost of storing data Cost of processing data
  • 4.
    Slide 4Slide 4www.edureka.co/r-for-analyticsTwitter @edurekaIN, Facebook /edurekaIN, use #AskEdureka for Questions Business Analytics “Study of business data using statistical techniques and programming for creating decision support and insights for achieving business goals”. Business analytics is used to evaluate organization-wide operations, and can be implemented in any department from sales to product development to customer service. Business analytics solutions typically use statistical and quantitative analysis and fact-based data to measure past performance to guide an organization's business planning. Definition Who creates it? How? Who uses it? How?
  • 5.
    Slide 5Slide 5www.edureka.co/r-for-analyticsTwitter @edurekaIN, Facebook /edurekaIN, use #AskEdureka for Questions Who Uses R : Domains  Telecom  Pharmaceuticals  Financial Services  Life Sciences  Education, etc
  • 6.
    Slide 6Slide 6www.edureka.co/r-for-analyticsTwitter @edurekaIN, Facebook /edurekaIN, use #AskEdureka for Questions Who Uses R : Companies Consumer Financial Protection Bureau The Consumer Financial Protection Bureau uses R for data analysis Mozilla Mozilla, the foundation responsible for the Firefox web browser, uses R to visualize Web activity Bank of America Bank of America uses R for reporting Foursquare R is part of technology stack behind Foursquare’s famed recommendation engine ANZ Bank ANZ, the fourth largest bank in Australia, using R for credit risk analysis Google Google uses R to predict Economic Activity
  • 7.
    Slide 7Slide 7www.edureka.co/r-for-analyticsTwitter @edurekaIN, Facebook /edurekaIN, use #AskEdureka for Questions Who Uses R : Companies Corporate Clients of R http://www.revolutionanalytics.com/aboutus/our-customers.php
  • 8.
    Slide 8Slide 8www.edureka.co/r-for-analyticsTwitter @edurekaIN, Facebook /edurekaIN, use #AskEdureka for Questions R : Characteristics  R is open source and free.  R has lots of packages and multiple ways of doing the same thing.  By default stores memory in RAM.  R has the most advanced graphics. You need much better programming skills.  R has GUI to help make learning easier.  Customization needs command line.  R can connect to many database and data types. “The great beauty of R is that you can modify it to do all sorts of things,” said Hal Varian, chief economist at Google. “And you have a lot of pre-packaged stuff that’s already available, so you’re standing on the shoulders of giants.”
  • 9.
    Slide 9Slide 9www.edureka.co/r-for-analyticsTwitter @edurekaIN, Facebook /edurekaIN, use #AskEdureka for Questions What is R : Data Analysis Software  Data Scientists, Statisticians, Analysts, Quants, and others who need to make sense of data use R for statistical analysis, data visualization, and predictive modelling.  Rexer Analytics’s Annual Data Miner Survey is the largest survey of data mining, data science, and analytics professionals in the industry.  It has concluded that R's popularity has increased substantially in recent years. R is Data Analysis Software
  • 10.
    Slide 10Slide 10www.edureka.co/r-for-analyticsTwitter @edurekaIN, Facebook /edurekaIN, use #AskEdureka for Questions What is R : Programming Language  You do data analysis in R by writing scripts and functions in the R programming language.  R has also quickly found the following because statisticians, engineers and scientists without computer programming skills find it easy to use. Do not get intimated by the term ‘Programming Language’, the concepts from the very basic will be taught during the course. R is Programming Language
  • 11.
    Slide 11Slide 11www.edureka.co/r-for-analyticsTwitter @edurekaIN, Facebook /edurekaIN, use #AskEdureka for Questions What is R : Environment for Statistical Analysis  R language consists of functions for almost every data manipulation, statistical model, or chart that a data analyst could ever need.  For statisticians, however, R is particularly useful because it contains a number of built-in mechanisms for organizing data, running calculations on the information and creating graphical representations of data sets. R is Environment for Statistical Analysis
  • 12.
    Slide 12Slide 12www.edureka.co/r-for-analyticsTwitter @edurekaIN, Facebook /edurekaIN, use #AskEdureka for Questions Basics Of R - Command Line Basics of R - Command Line
  • 13.
    www.edureka.co/r-for-analyticsSlide 13 Twitter@edurekaIN, Facebook /edurekaIN, use #AskEdureka for Questions Machine Learning Categories Types of Learning Supervised Learning Unsupervised Learning Inferring a function from labelled training data. Trying to find hidden structure in unlabelled data.
  • 14.
    www.edureka.co/r-for-analyticsSlide 14 Twitter@edurekaIN, Facebook /edurekaIN, use #AskEdureka for Questions Machine Learning Categories What category do the applications below fall into? Supervised Learning Supervised Learning Unsupervised Learning Unsupervised Learning
  • 15.
    www.edureka.co/r-for-analyticsSlide 15 Twitter@edurekaIN, Facebook /edurekaIN, use #AskEdureka for Questions Common Machine Learning Algorithms Types of Learning Supervised Learning Unsupervised Learning Algorithms  Naïve Bayes  Support Vector Machines  Random Forests  Decision Trees Algorithms  K-means  Fuzzy Clustering  Hierarchical Clustering
  • 16.
    www.edureka.co/r-for-analyticsSlide 16 Twitter@edurekaIN, Facebook /edurekaIN, use #AskEdureka for Questions Clustering
  • 17.
    www.edureka.co/r-for-analyticsSlide 17 Twitter@edurekaIN, Facebook /edurekaIN, use #AskEdureka for Questions Clustering: Scenarios The following scenarios implement Clustering:  A telephone company needs to establish its network by putting its towers in a particular region it has acquired. The location of putting these towers can be found by clustering algorithm so that all its users receive optimum signal strength.  The Miami DEA wants to make its law enforcement more stringent and hence have decided to make their patrol vans stationed across the area so that the areas of high crime rates are in vicinity to the patrol vans.  A Hospital Care chain wants to open a series of Emergency-Care wards, keeping in mind the factor of maximum accident prone areas in a region.
  • 18.
    www.edureka.co/r-for-analyticsSlide 18 Twitter@edurekaIN, Facebook /edurekaIN, use #AskEdureka for Questions Some More Use-Cases of Clustering  Organizing data into clusters shows internal structure of the data Ex. Clusty and clustering genes  Sometimes the partitioning is the goal Ex. Market segmentation  Prepare for other AI techniques Ex. Summarize news (cluster and then find centroid)  Discovery in data Ex. Underlying rules, reoccurring patterns, topics, etc.
  • 19.
    www.edureka.co/r-for-analyticsSlide 19 Twitter@edurekaIN, Facebook /edurekaIN, use #AskEdureka for Questions What is Clustering? Organizing data into clusters such that there is:  High intra-cluster similarity  Low inter-cluster similarity  Informally, finding natural groupings among objects http://en.wikipedia.org/wiki/Cluster_analysis
  • 20.
    www.edureka.co/r-for-analyticsSlide 20 Twitter@edurekaIN, Facebook /edurekaIN, use #AskEdureka for Questions K-Means Clustering
  • 21.
    www.edureka.co/r-for-analyticsSlide 21 Twitter@edurekaIN, Facebook /edurekaIN, use #AskEdureka for Questions K-Means Clustering The process by which objects are classified into a number of groups so that they are as much dissimilar as possible from one group to another group, but as much similar as possible within each group. The objects in group 1 should be as similar as possible. But there should be much difference between an object in group 1 and group 2. The attributes of the objects are allowed to determine which objects should be grouped together. Total population Group 1 Group 2 Group 3 Group 4
  • 22.
    www.edureka.co/r-for-analyticsSlide 22 Twitter@edurekaIN, Facebook /edurekaIN, use #AskEdureka for Questions K-Means: Pizza Hut Clustering Example
  • 23.
    www.edureka.co/r-for-analyticsSlide 23 Twitter@edurekaIN, Facebook /edurekaIN, use #AskEdureka for Questions Let us suppose the following points are the delivery locations for Pizza. K-Means: Pizza Hut Clustering Example
  • 24.
    www.edureka.co/r-for-analyticsSlide 24 Twitter@edurekaIN, Facebook /edurekaIN, use #AskEdureka for Questions Lets locate three cluster centres randomly C1 C3 C2 K-Means: Pizza Hut Clustering Example
  • 25.
    www.edureka.co/r-for-analyticsSlide 25 Twitter@edurekaIN, Facebook /edurekaIN, use #AskEdureka for Questions Find the distance of the points as shown. C1 C3 C2 K-Means: Pizza Hut Clustering Example
  • 26.
    www.edureka.co/r-for-analyticsSlide 26 Twitter@edurekaIN, Facebook /edurekaIN, use #AskEdureka for Questions Assign the points to the nearest cluster centres based on the distance between each centre and the points. C1 C2 C3 K-Means: Pizza Hut Clustering Example
  • 27.
    www.edureka.co/r-for-analyticsSlide 27 Twitter@edurekaIN, Facebook /edurekaIN, use #AskEdureka for Questions Re-assign the cluster centres and locate nearest points. C1 C2 C3 K-Means: Pizza Hut Clustering Example
  • 28.
    www.edureka.co/r-for-analyticsSlide 28 Twitter@edurekaIN, Facebook /edurekaIN, use #AskEdureka for Questions Re-assign the cluster centres and locate nearest points, calculate the distance. C1 C2 C3 K-Means: Pizza Hut Clustering Example
  • 29.
    www.edureka.co/r-for-analyticsSlide 29 Twitter@edurekaIN, Facebook /edurekaIN, use #AskEdureka for Questions Form the three clusters. C1 C2 C3 K-Means: Pizza Hut Clustering Example
  • 30.
    www.edureka.co/r-for-analyticsSlide 30 Twitter@edurekaIN, Facebook /edurekaIN, use #AskEdureka for Questions ObjectiveFunctionValue i.e.,Distortion Elbow method The value of k should be such that even if we increase the value of k from here on, the distortion remains constant. This is the ideal value of k, for the clusters created. The Elbow Curve
  • 31.
    www.edureka.co/r-for-analyticsSlide 31 Twitter@edurekaIN, Facebook /edurekaIN, use #AskEdureka for Questions Now let us consider the another scenario of clustering : The data from “Google page rank”. Notice, that the data given here are sentences and not vectors. Can we apply K-means clustering to it? We will take a deep dive into TF-IDF in module 3 of the course. Let’s look at the Another Scenario For analyzing this type of data we use “TF-IDF algorithm” which converts these attributes to vectors.
  • 32.
    Slide 32Slide 32www.edureka.co/r-for-analyticsTwitter @edurekaIN, Facebook /edurekaIN, use #AskEdureka for Questions “R has really become the second language for people coming out of grad school now, and there’s an amazing amount of code being written for it,” said Max Kuhn, Associate Director of Nonclinical Statistics at Pfizer. Comparing R and others “You can look on the SAS message boards and see there is a proportional downturn in traffic.” Google Trends in R
  • 33.
    Slide 33 www.edureka.co/r-for-analyticsTwitter@edurekaIN, Facebook /edurekaIN, use #AskEdureka for Questions R: Demand Supply Gap
  • 34.
    Slide 34 www.edureka.co/r-for-analytics Module 1 » Introduction to Business Analytics  Module 2 » Introduction to R Programming  Module 3 » Data Manipulation in R  Module 4 » Data Import Techniques in R  Module 5 » Exploratory Data Analysis  Module 6 » Data Visualization in R Course Topics  Module 7 » Data mining: Clustering Techniques  Module 8 » Data Mining: Association rule mining and Sentiment analysis  Module 9 » Linear and Logistic Regression  Module 10 » Annova and Predictive Analysis  Module 11 » Data Mining: Decision Trees and Random forest  Module 12 » Final Project Business Analytics with R class – Census Data
  • 35.
    Slide 35 www.edureka.co/r-for-analytics LIVEOnline Class Class Recording in LMS 24/7 Post Class Support Module Wise Quiz Project Work Verifiable Certificate How it Works
  • 36.