Download as PDF, PPTX
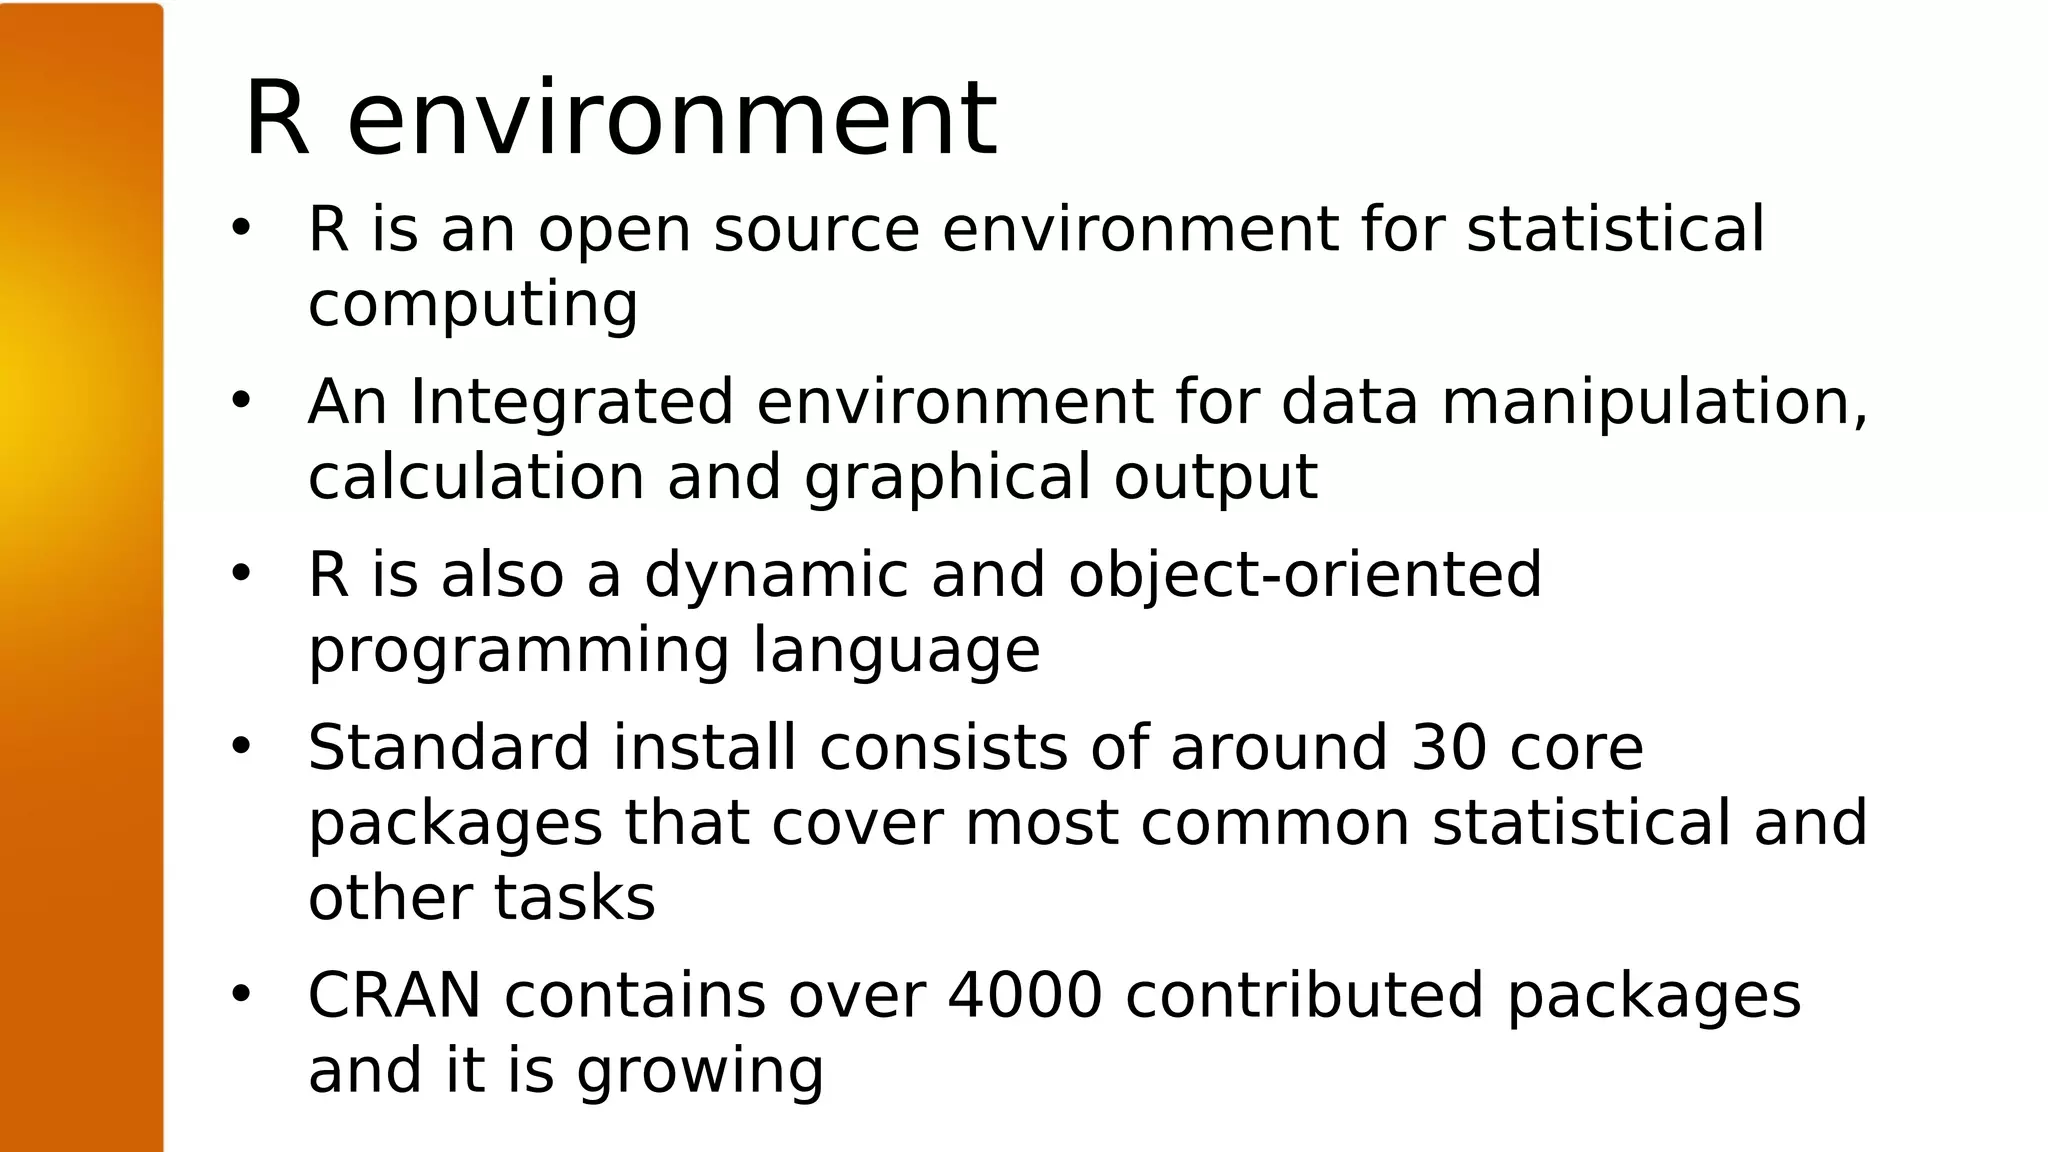
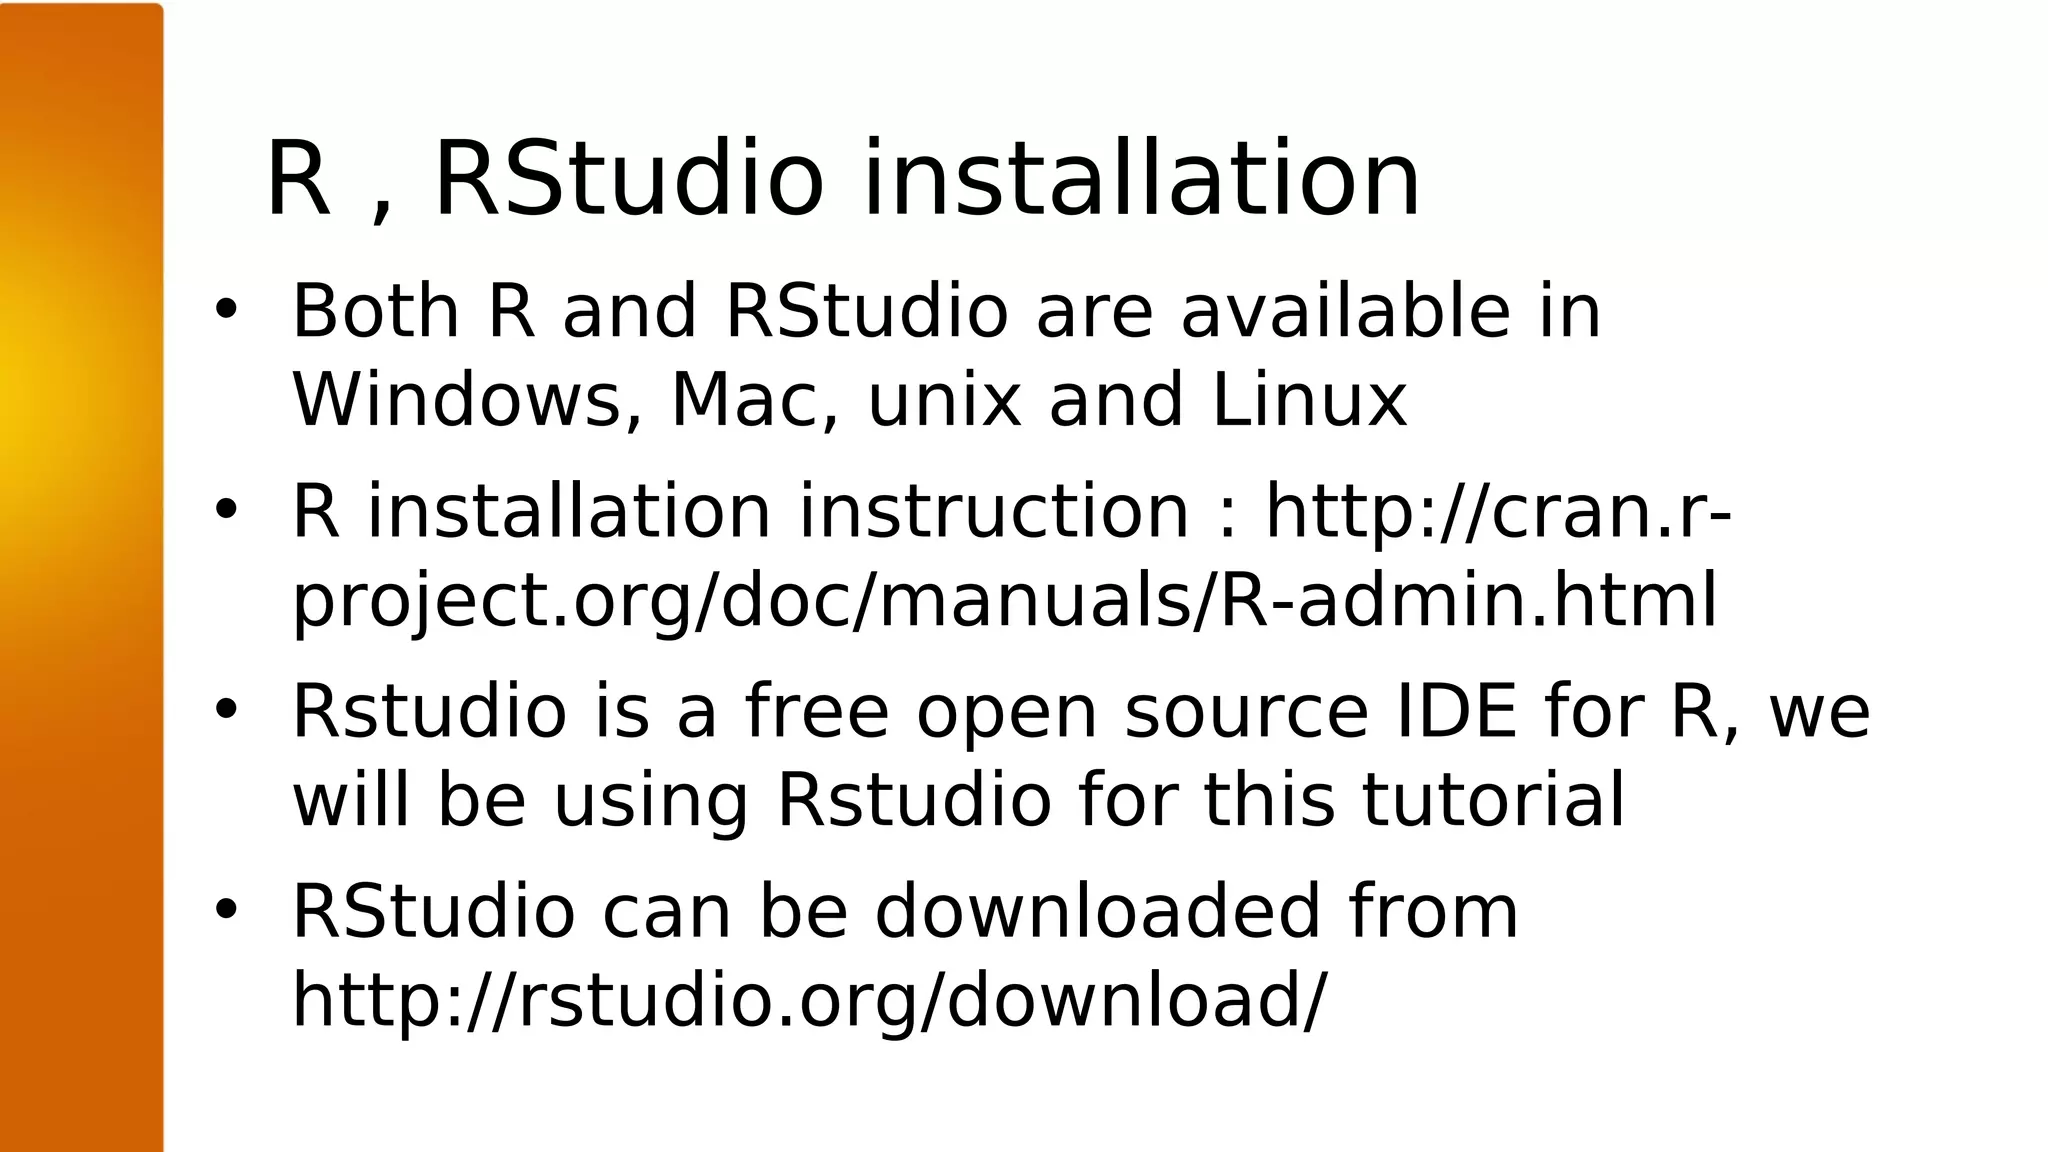
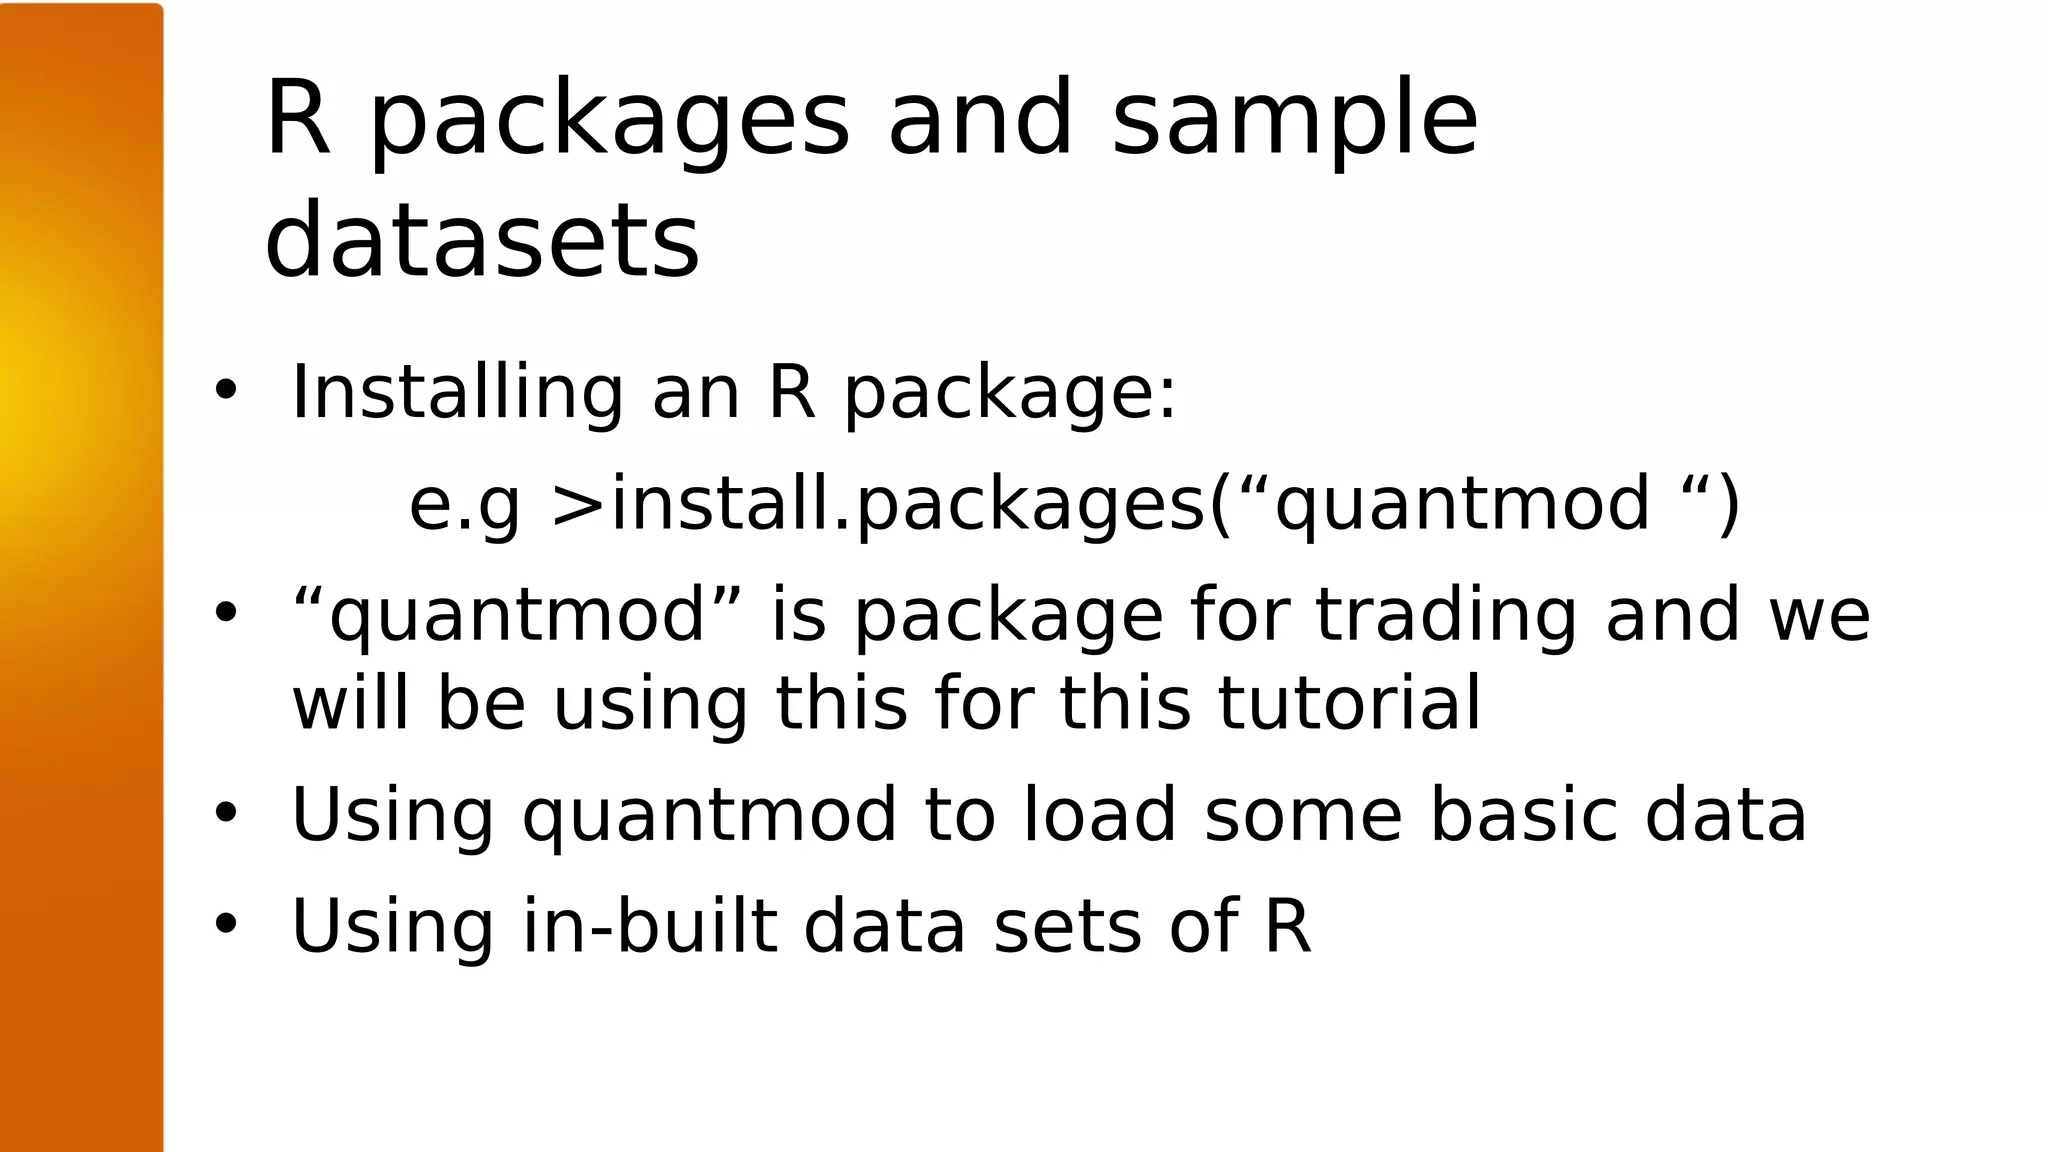
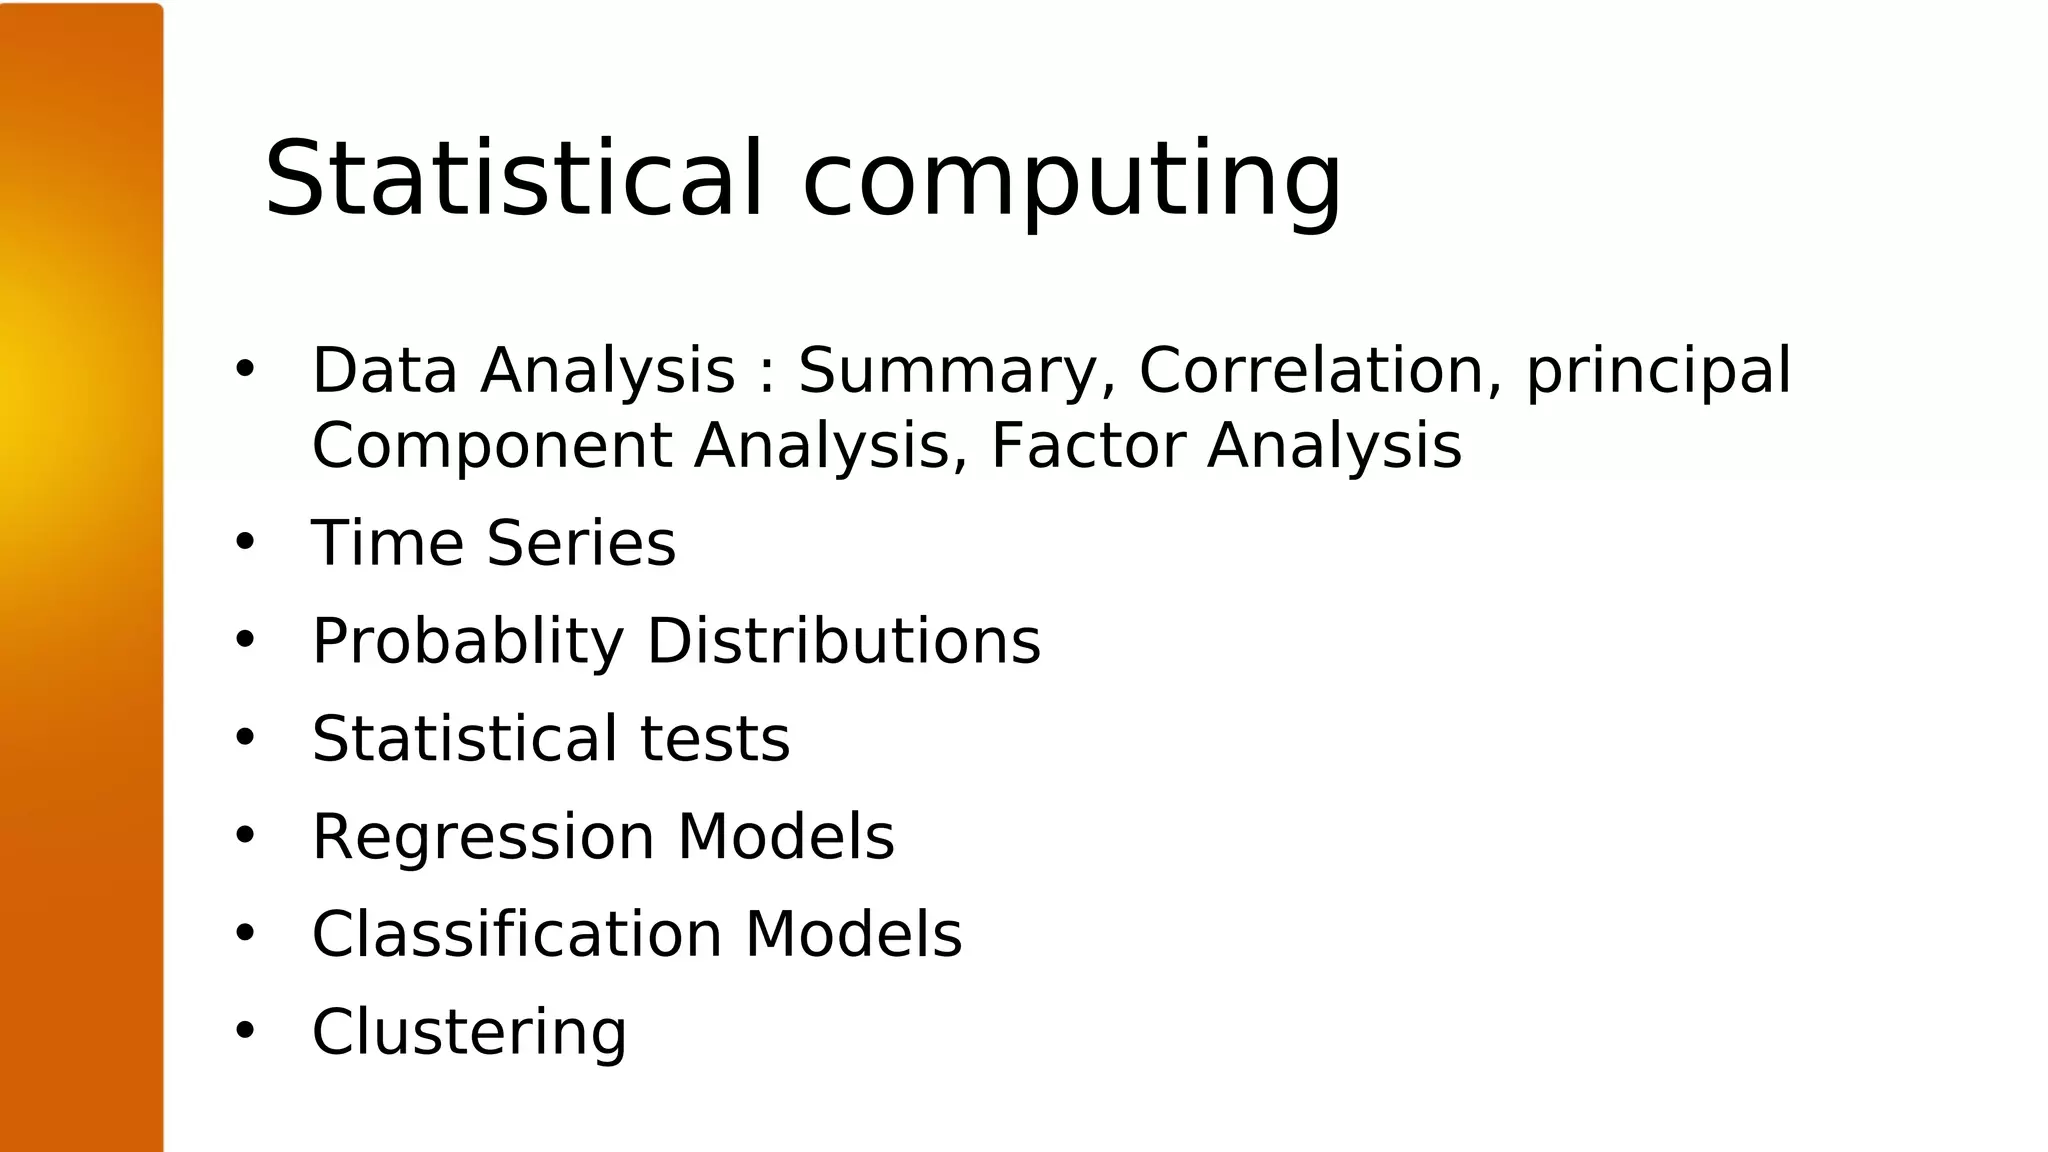
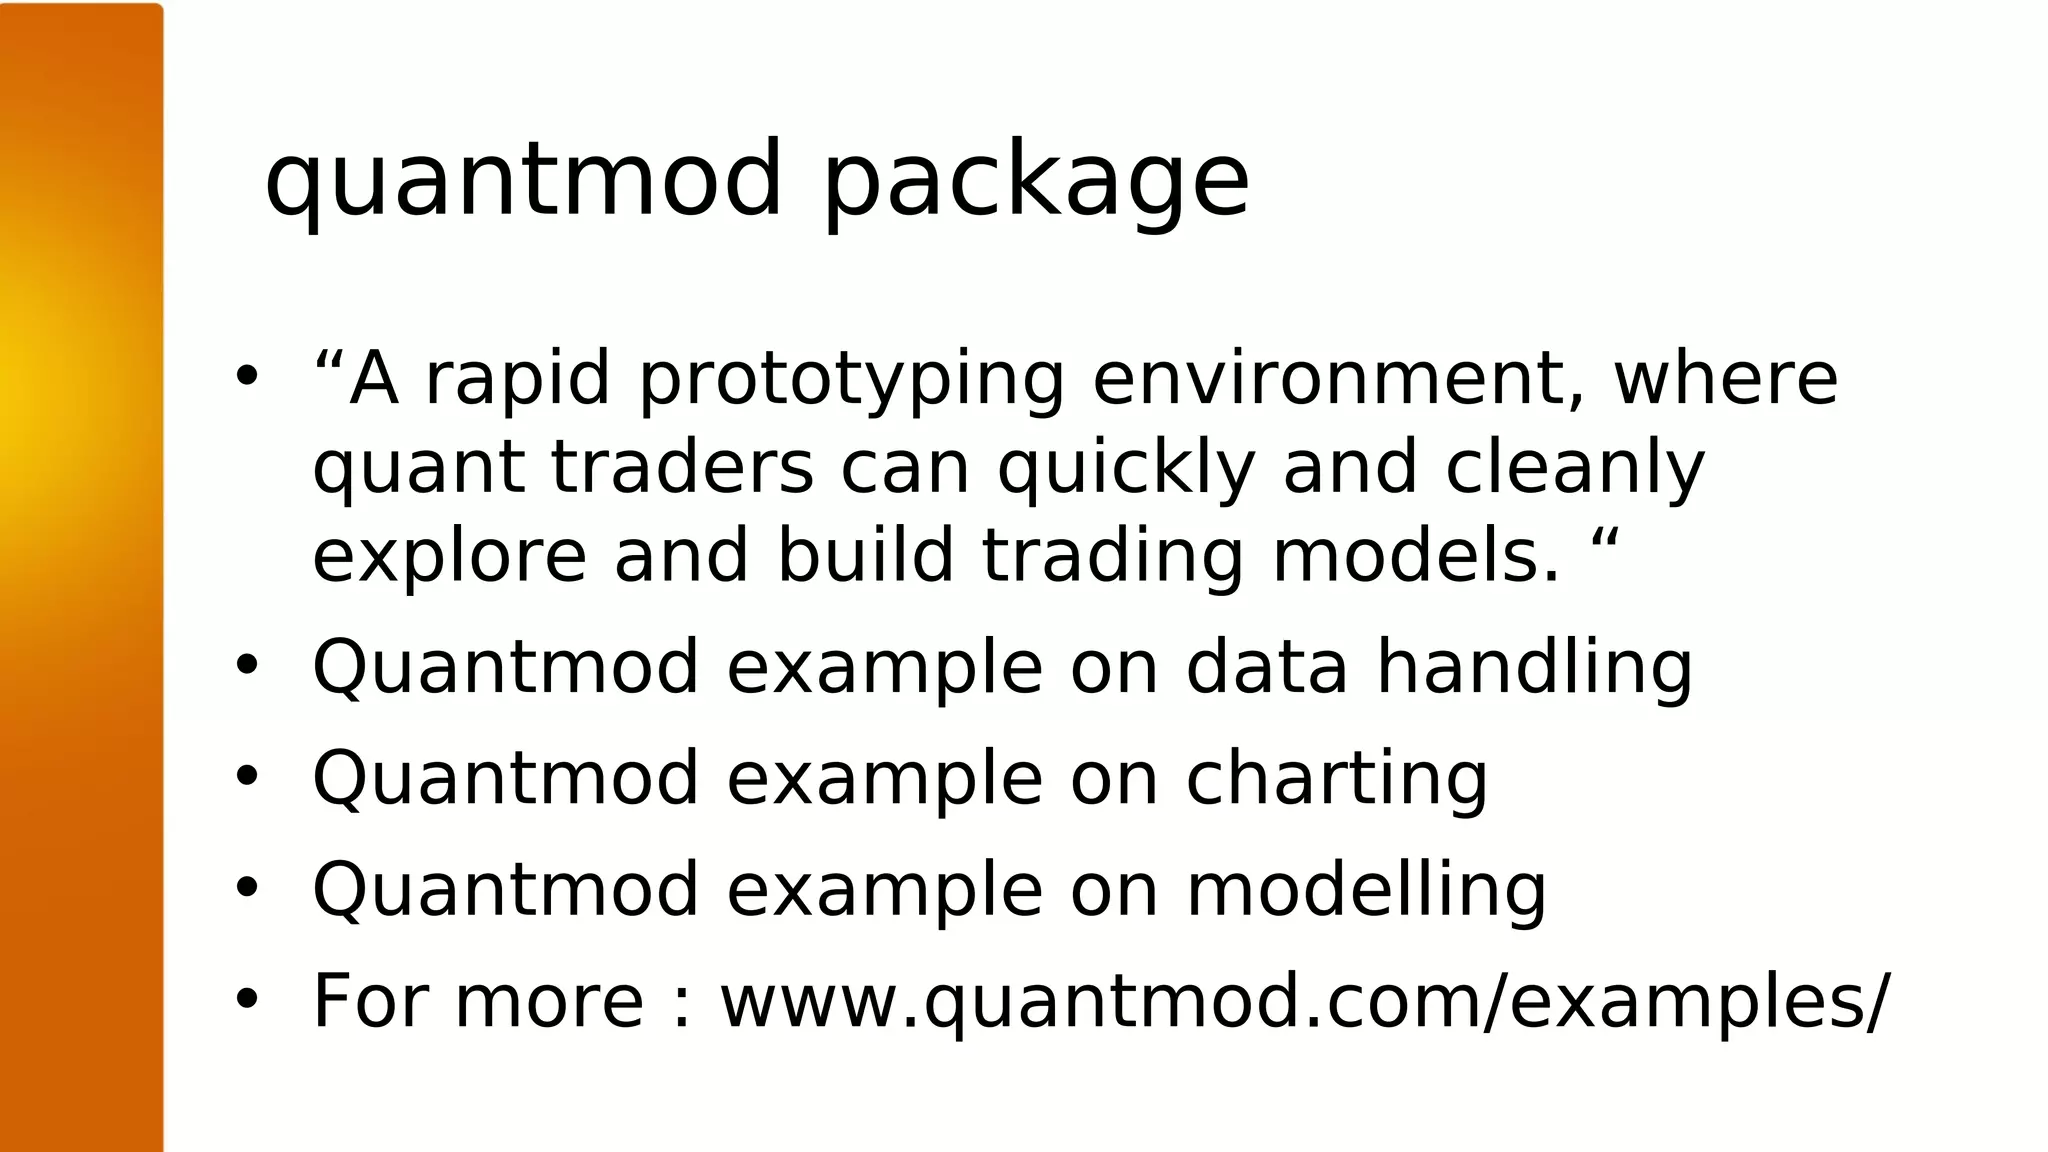
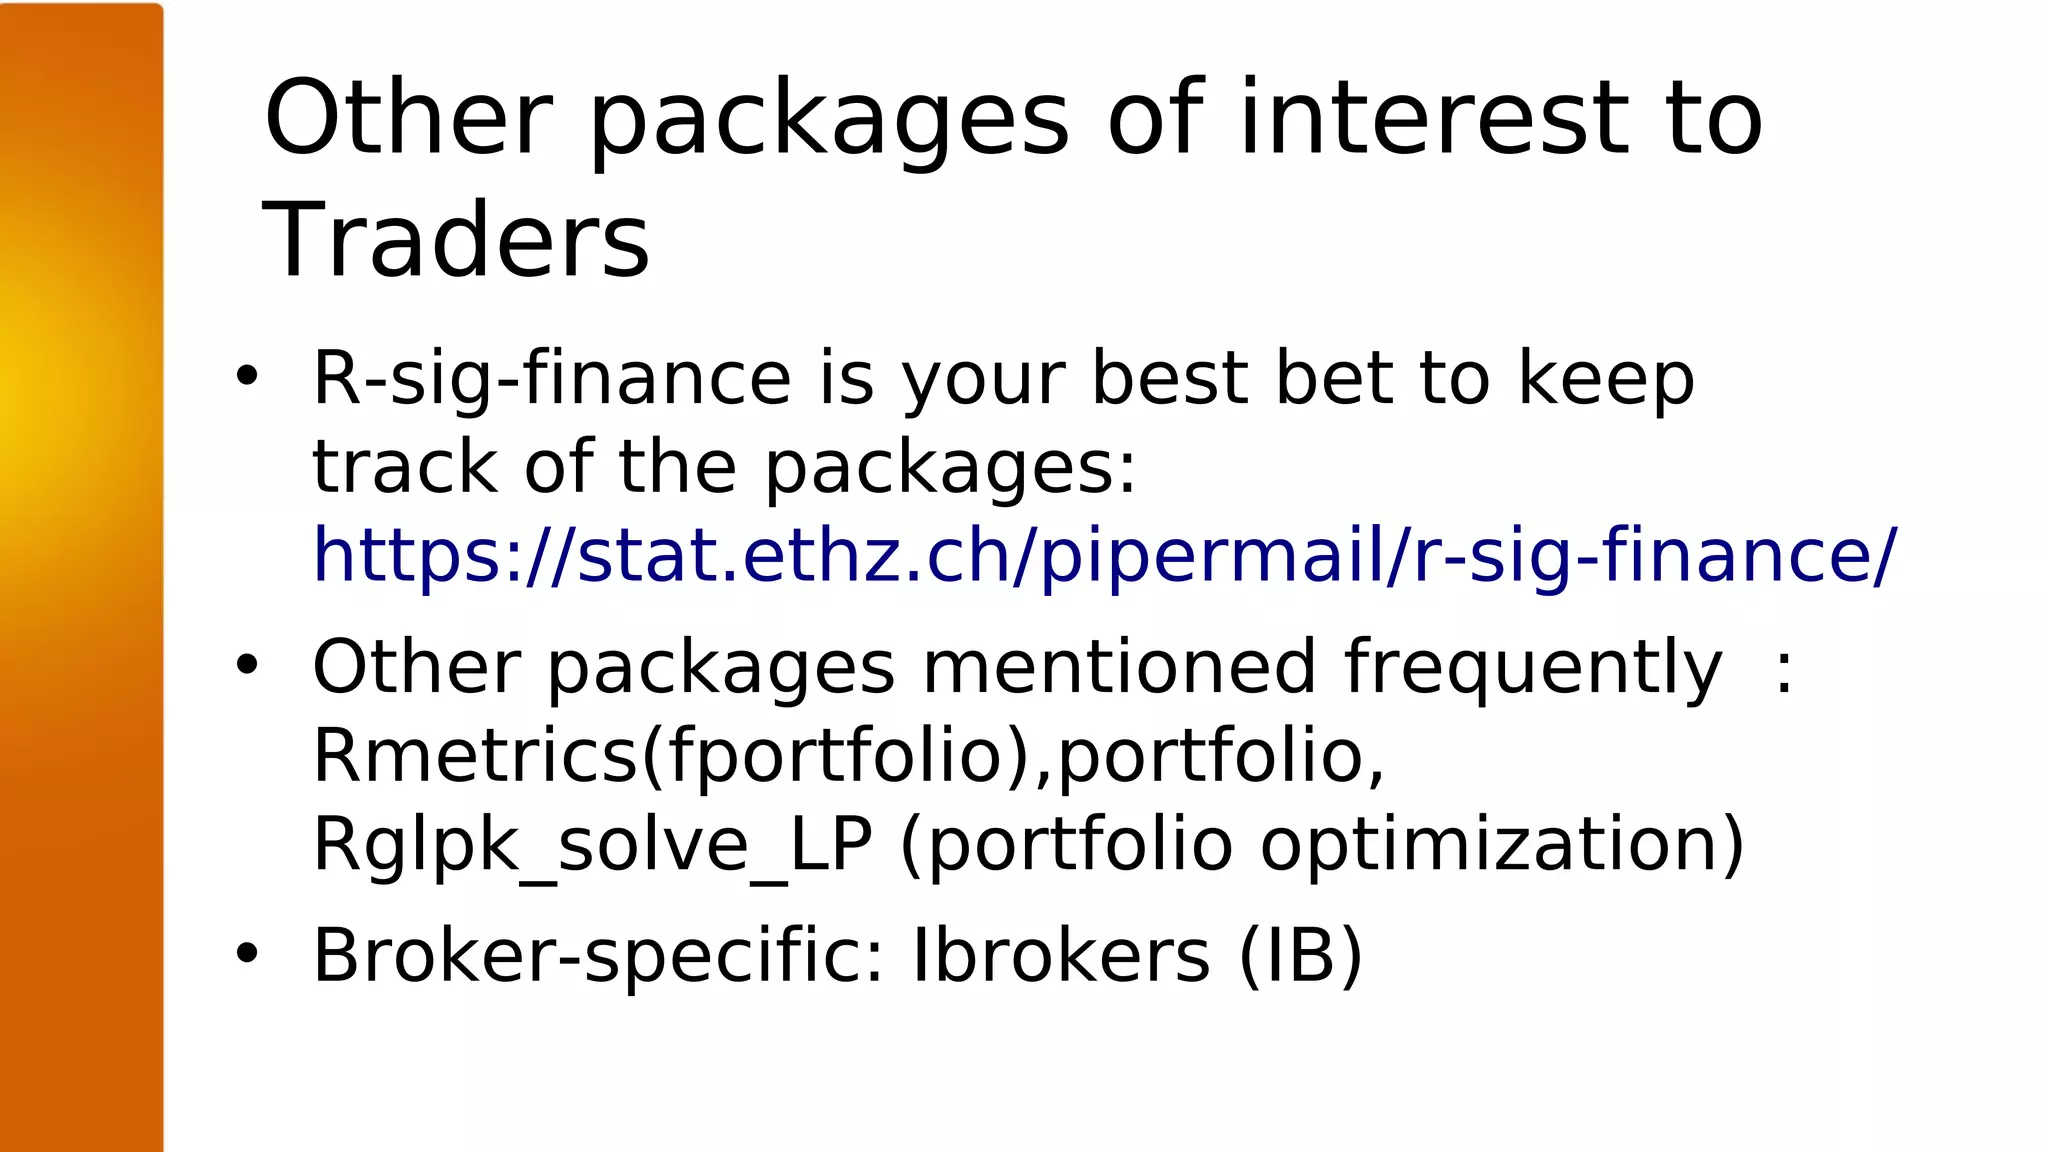
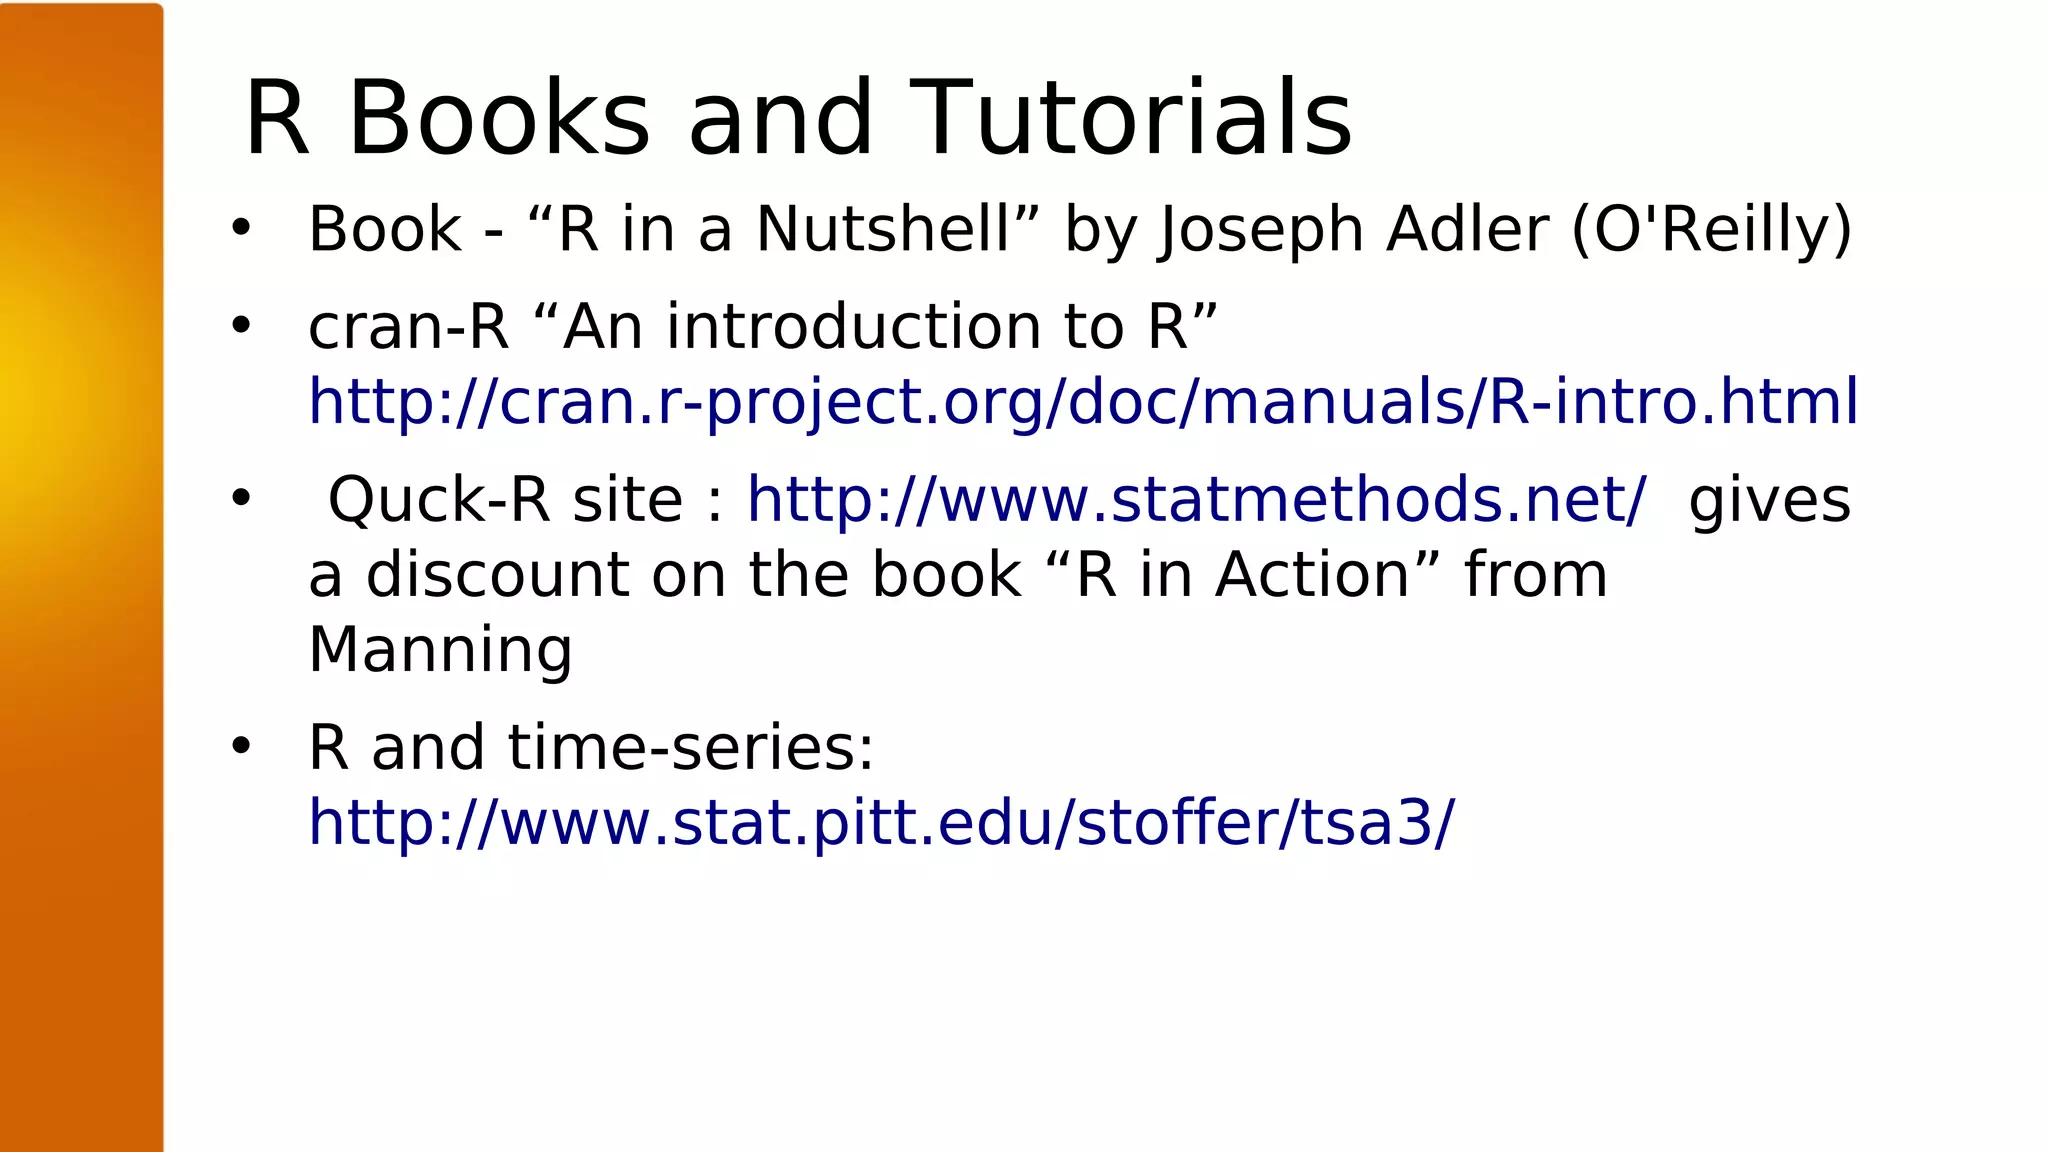


The document introduces R as an open-source environment for statistical computing and programming, highlighting its capabilities in data manipulation and graphical output. It covers installation instructions for R and RStudio, along with procedures for installing and using R packages, specifically focusing on the quantmod package for trading. Additional resources, packages, and literature for further learning in R are also provided.