The document provides a comprehensive overview of using Python for machine learning, including key libraries such as NumPy, SciPy, Pandas, and Scikit-learn, along with their functionalities. It outlines the essential phases of machine learning, ranging from data exploration to predictive modeling, and presents a case study on a loan prediction problem. Additionally, it offers resources for further learning and practical applications in data analytics.


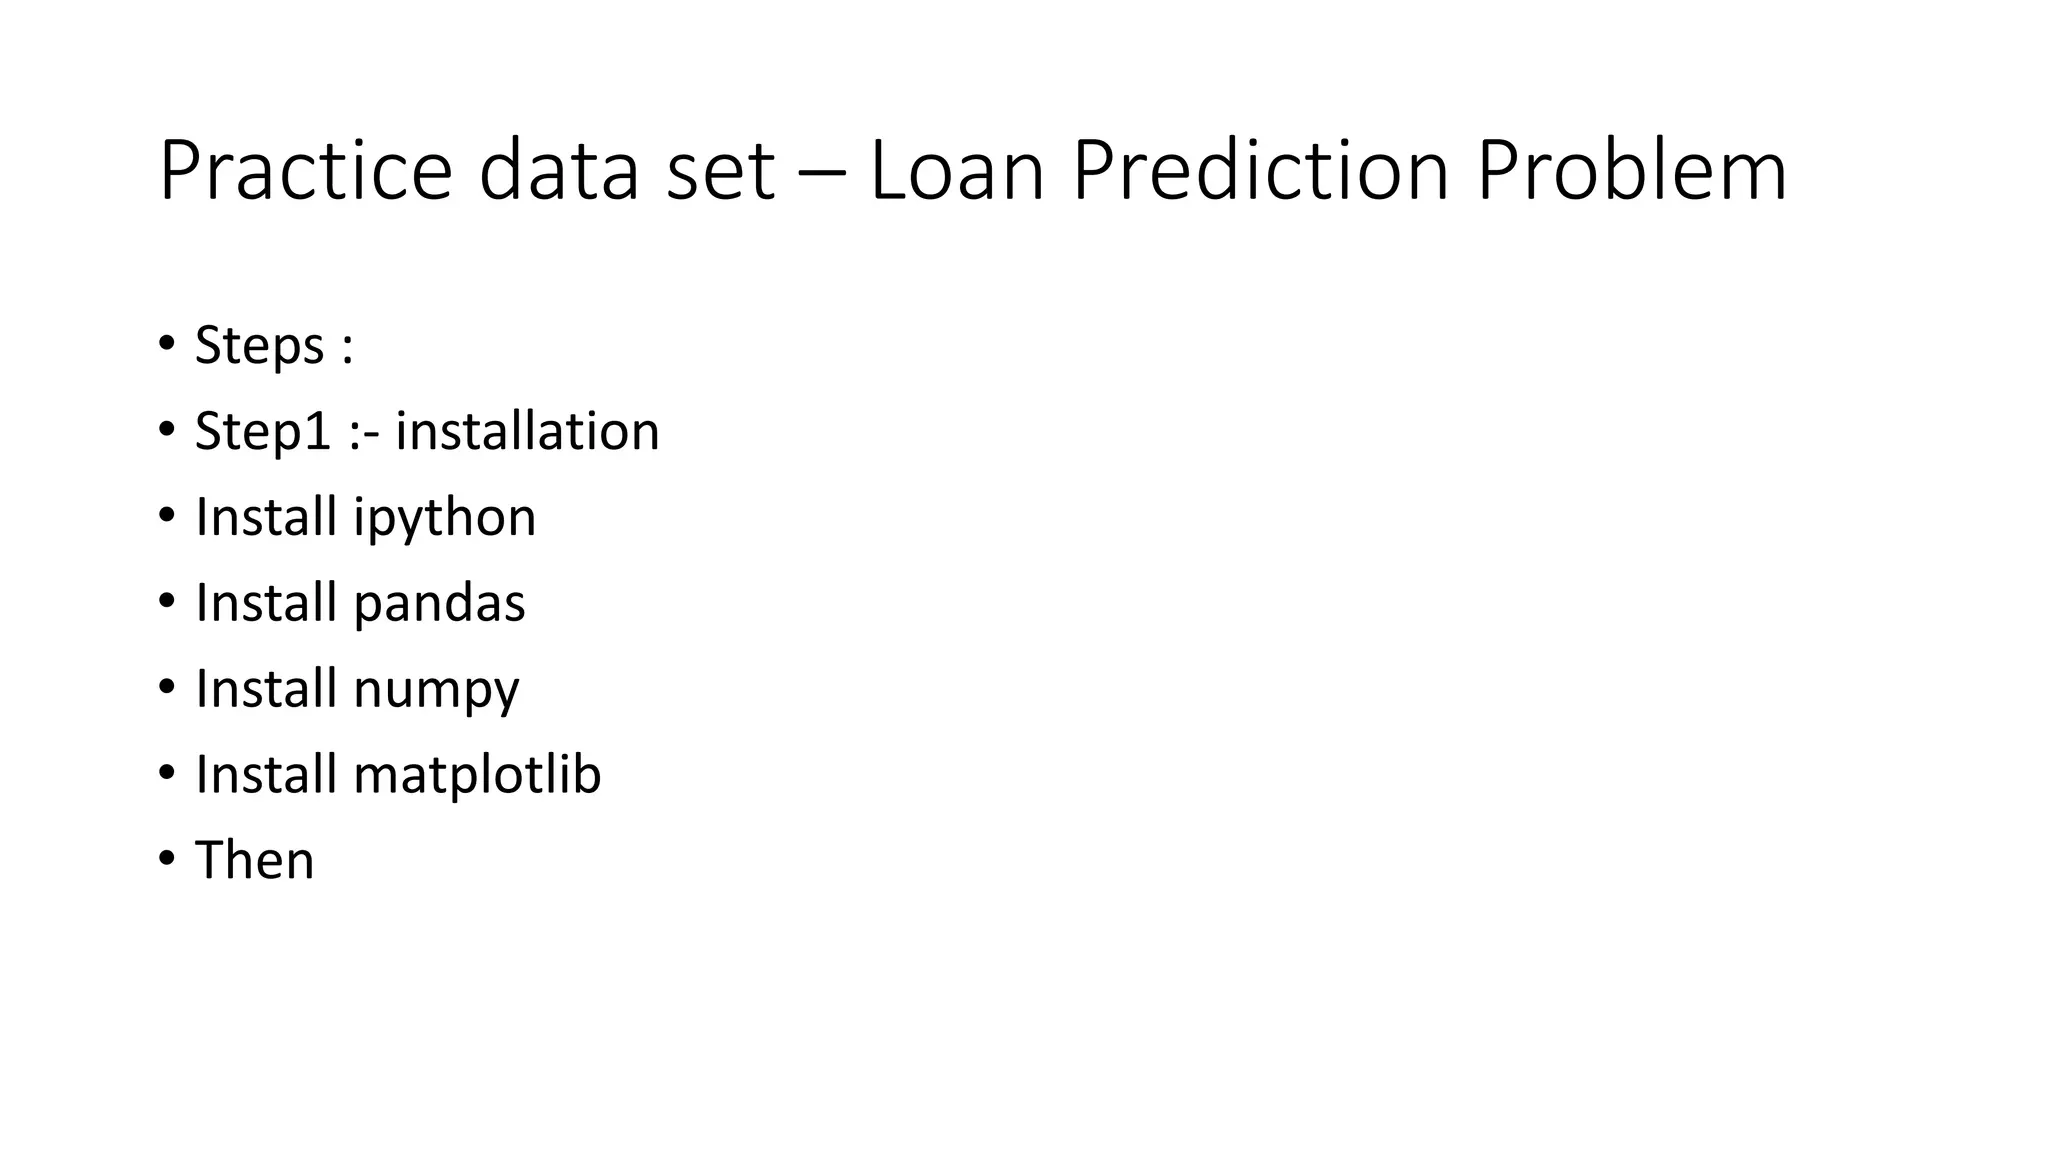
![Practice data set – Loan Prediction Problem • Step 2:- begin with exploration • To begin, start iPython interface in Inline Pylab mode by typing following on your terminal / windows command/pydev(eclip) prompt: • >>>ipython notebook --pylab=inline • Importing libraries and the data set: • Importing libraries and the data set: • import pandas as pd • import numpy as np • import matplotlib as plt • df = pd.read_csv("/home/kunal/Downloads/Loan_Prediction/train.csv") #Reading the dataset in a dataframe using Pandas • df.head(10) • df.describe() • df['Property_Area'].value_counts()](https://image.slidesharecdn.com/pythonml-180727174806/75/Python-ml-14-2048.jpg)
![Practice data set – Loan Prediction Problem • Step 3 :- Distribution analysis • Lets start by plotting the histogram of ApplicantIncome using the following commands: • df['ApplicantIncome'].hist(bins=50) • Next, we look at box plots to understand the distributions. Box plot for fare can be plotted by: • df.boxplot(column='ApplicantIncome’) • Categorical variable analysis • temp1 = df['Credit_History'].value_counts(ascending=True) • temp2 = df.pivot_table(values='Loan_Status',index=['Credit_History'],aggfunc=lambda x: x.map({'Y':1,'N':0}).mean()) • print 'Frequency Table for Credit History:' • print temp1 • print 'nProbility of getting loan for each Credit History class:' • print temp2](https://image.slidesharecdn.com/pythonml-180727174806/75/Python-ml-15-2048.jpg)
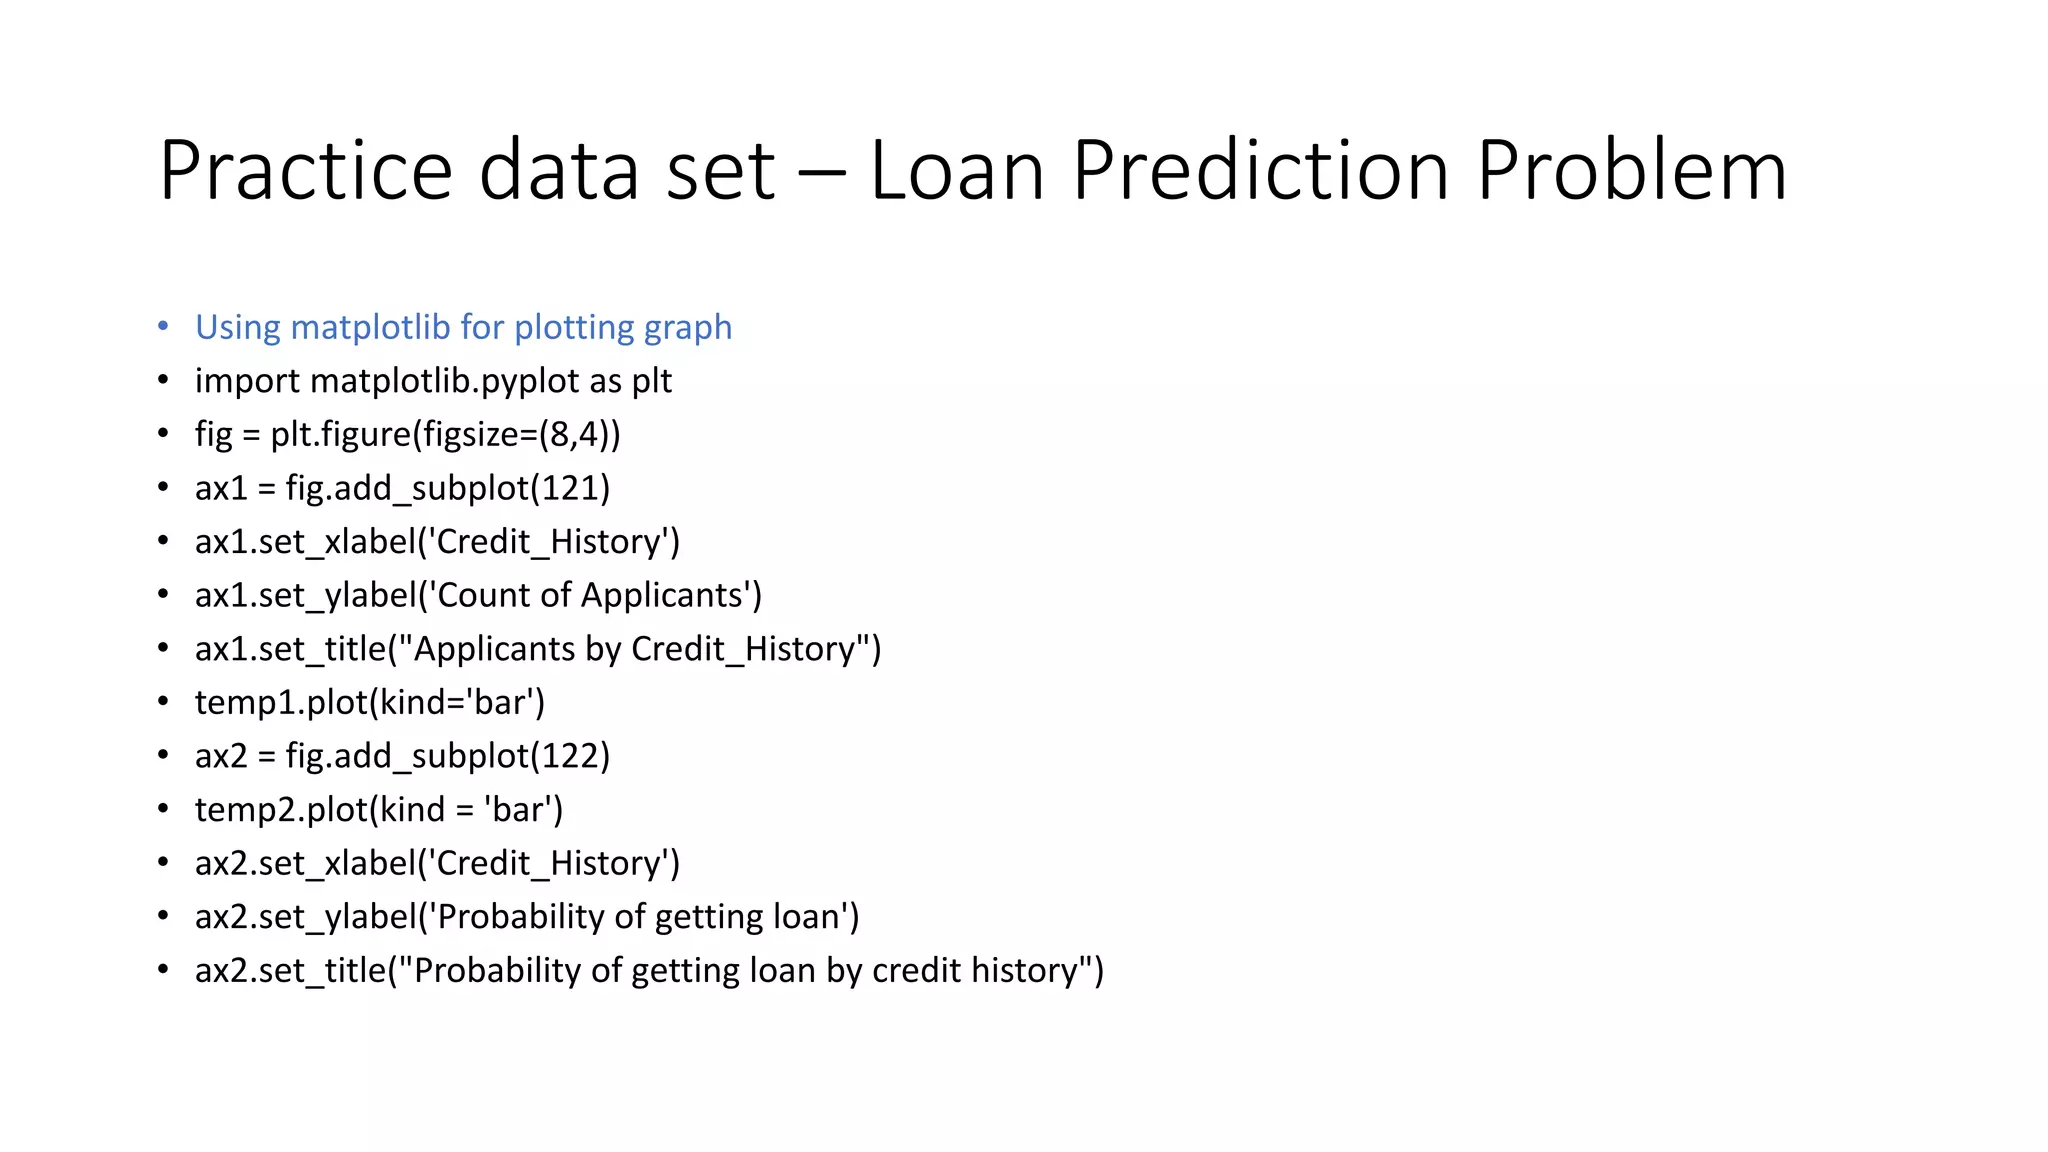
![Practice data set – Loan Prediction Problem • these two plots can also be visualized by combining them in a stacked chart:: • temp3 = pd.crosstab(df['Credit_History'], df['Loan_Status']) • temp3.plot(kind='bar', stacked=True, color=['red','blue'], grid=False) • 4. Data Munging in Python : Using Pandas • Check missing values in the dataset • df.apply(lambda x: sum(x.isnull()),axis=0) • df['LoanAmount'].fillna(df['LoanAmount'].mean(), inplace=True)](https://image.slidesharecdn.com/pythonml-180727174806/75/Python-ml-17-2048.jpg)
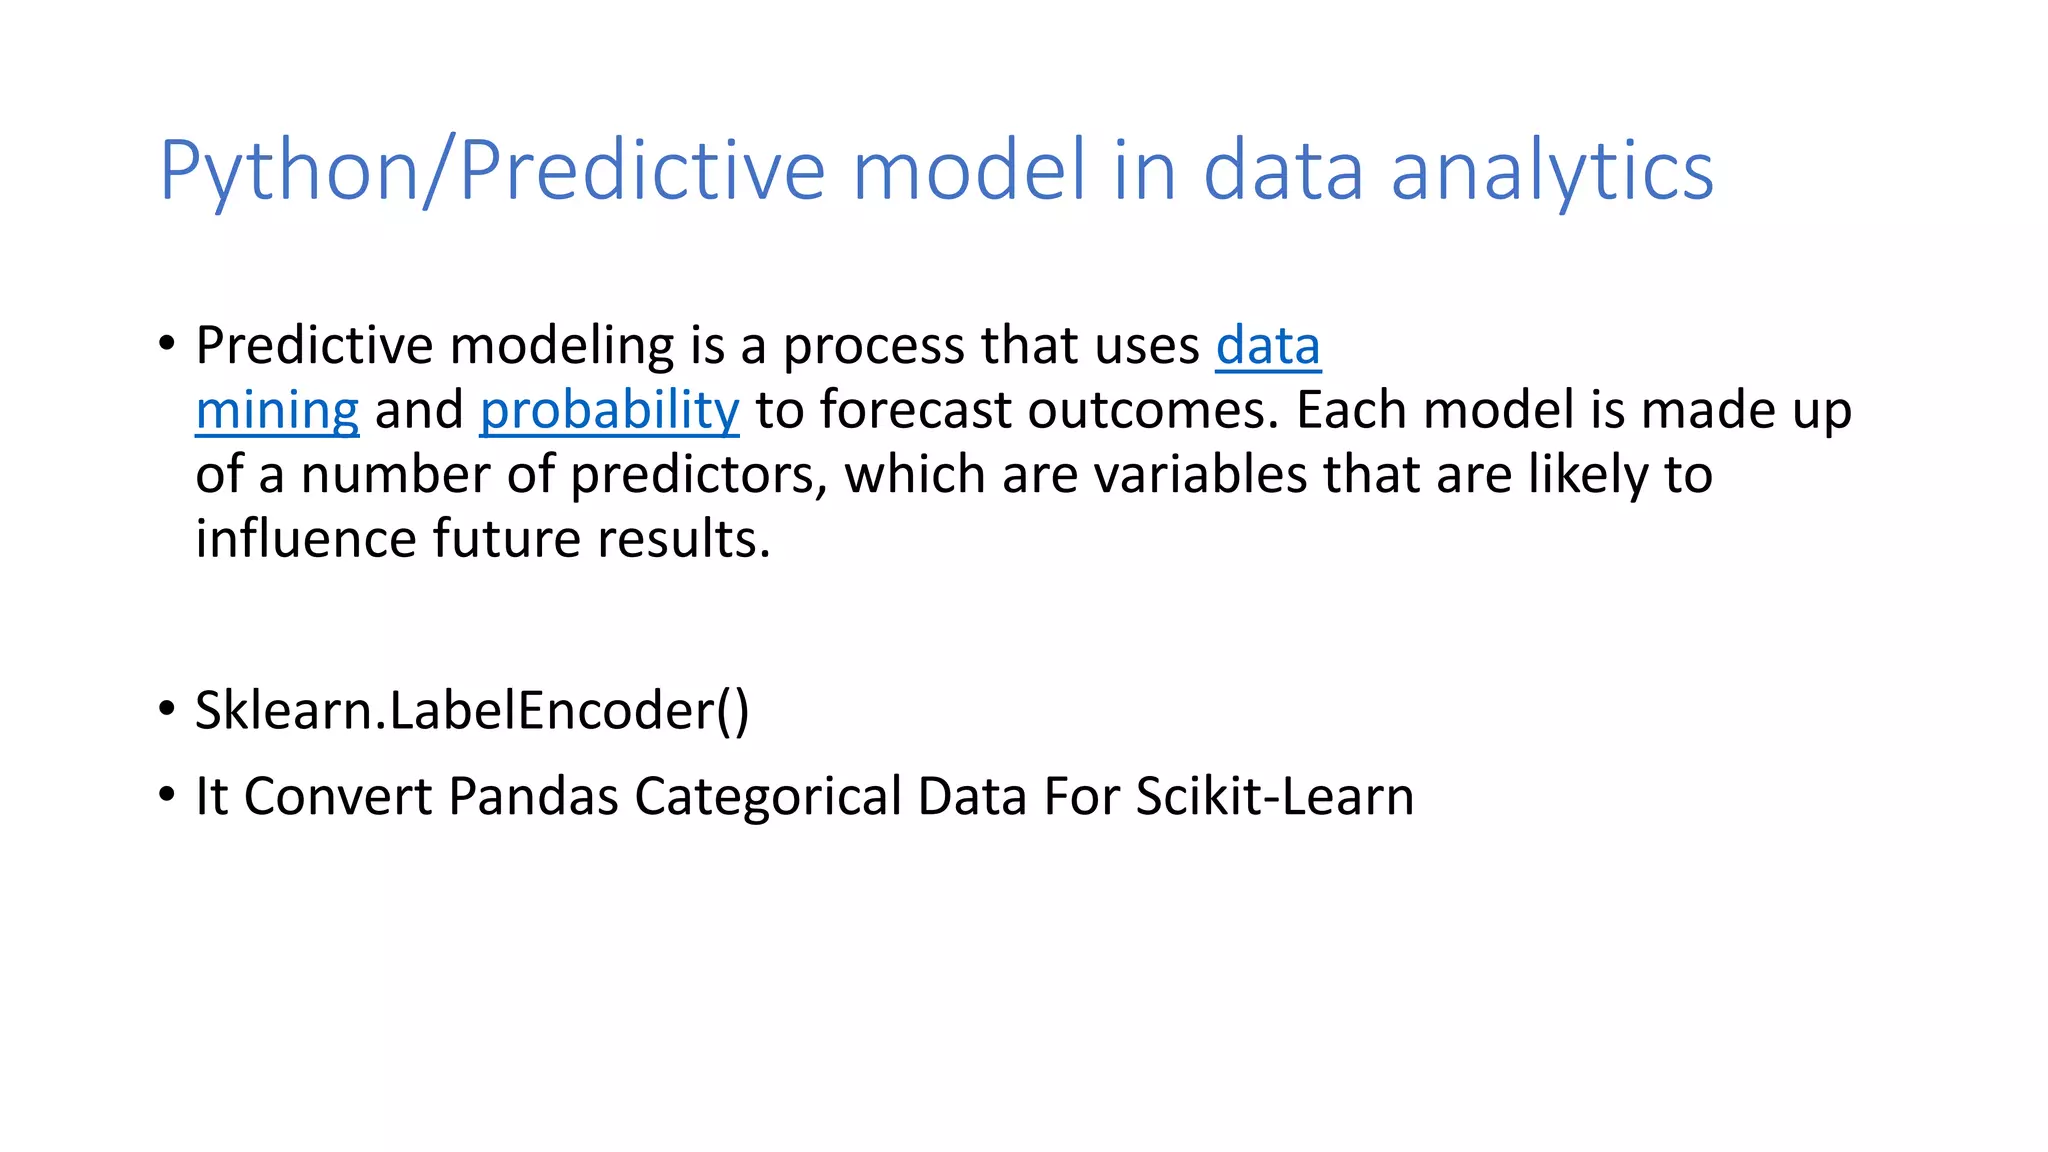
![Practice data set – Loan Prediction Problem • 5. Building a Predictive Model in Python • This can be done using the following code: • from sklearn.preprocessing import LabelEncoder • var_mod = ['Gender','Married','Dependents','Education','Self_Employed','Property_Area','Lo an_Status'] • le = LabelEncoder() • for i in var_mod: • df[i] = le.fit_transform(df[i]) • df.dtypes • Python is really a great tool, and is becoming an increasingly popular language among the data scientists.](https://image.slidesharecdn.com/pythonml-180727174806/75/Python-ml-18-2048.jpg)
![Python/time-series-forecast-study • 3. Test Harness • We must develop a test harness to investigate the data and evaluate candidate models. • This involves two steps: • Defining a Validation Dataset. • Developing a Method for Model Evaluation. • 3.1 Validation Dataset • The code below will load the dataset as a Pandas Series and split into two, one for model development (dataset.csv) and the other for validation (validation.csv). • from pandas import Series • series = Series.from_csv('champagne.csv', header=0) • split_point = len(series) - 12 • dataset, validation = series[0:split_point], series[split_point:] • print('Dataset %d, Validation %d' % (len(dataset), len(validation))) • dataset.to_csv('dataset.csv') • validation.to_csv('validation.csv')](https://image.slidesharecdn.com/pythonml-180727174806/75/Python-ml-26-2048.jpg)