Embed presentation
Download to read offline
![• • or • Layer [ save, load, data, file, seek, dput, dget, parse, write, scan, etc... ] • Layer [ read.csv, write.csv, read.table, write.csv, etc... ] • Layer [ write.graph, read.graph, sqlFetch, etc... ] • http://cran.r-project.org/doc/manuals/R-data.html](https://image.slidesharecdn.com/20110922-110922175132-phpapp02/75/R-Basic-Introduction-5-2048.jpg)
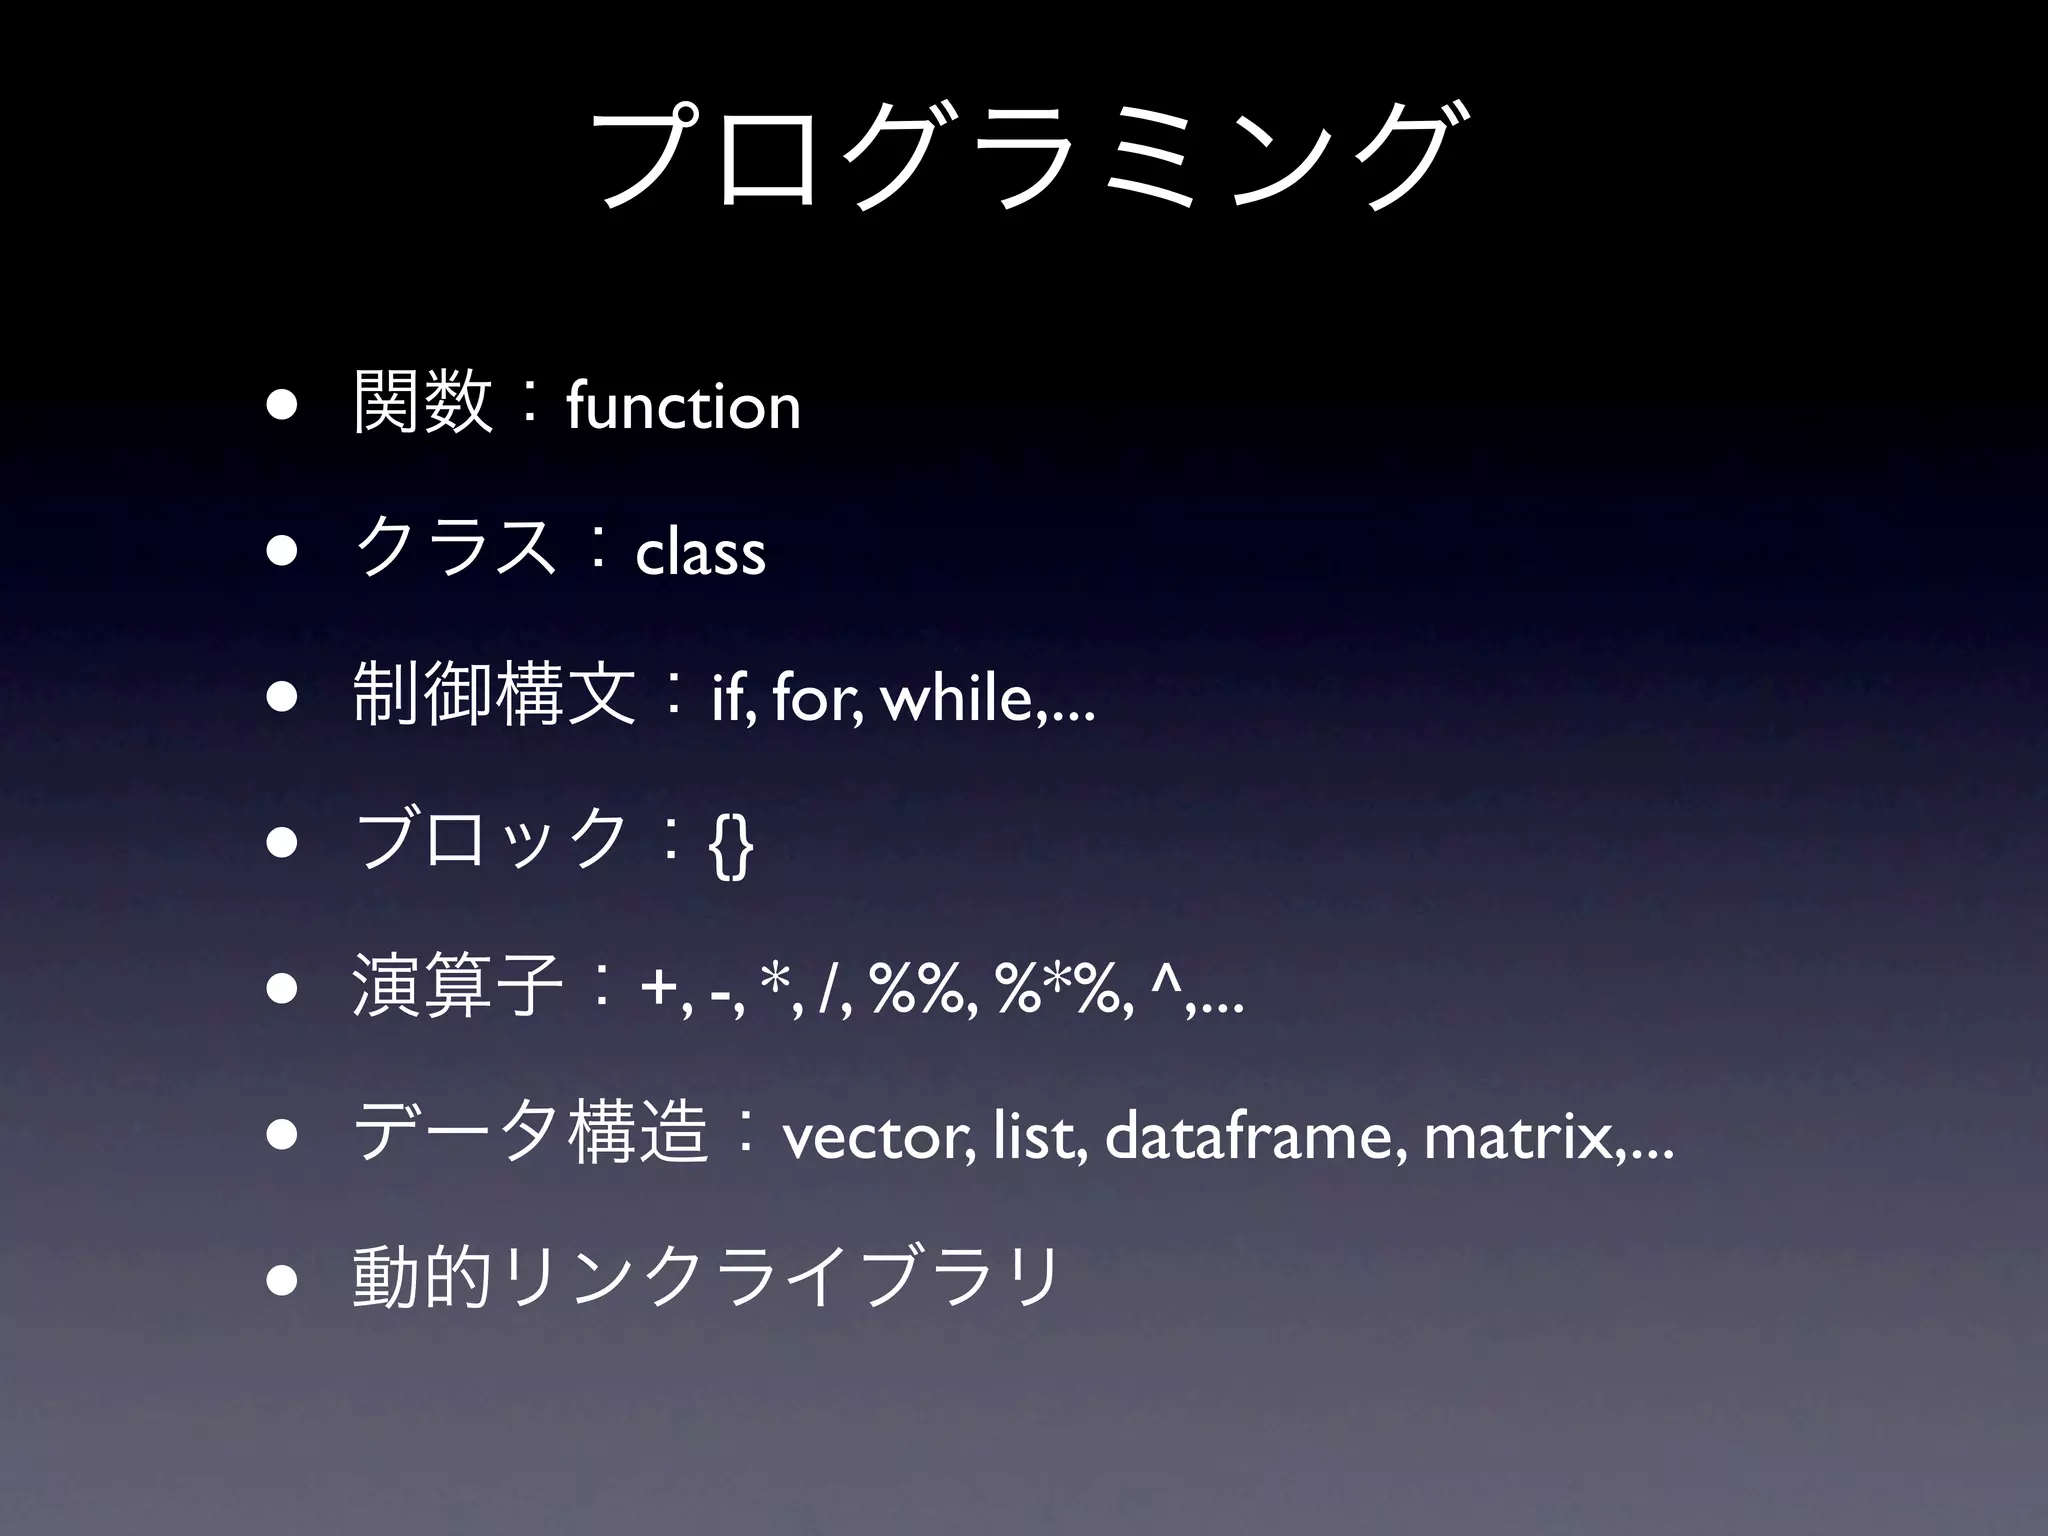
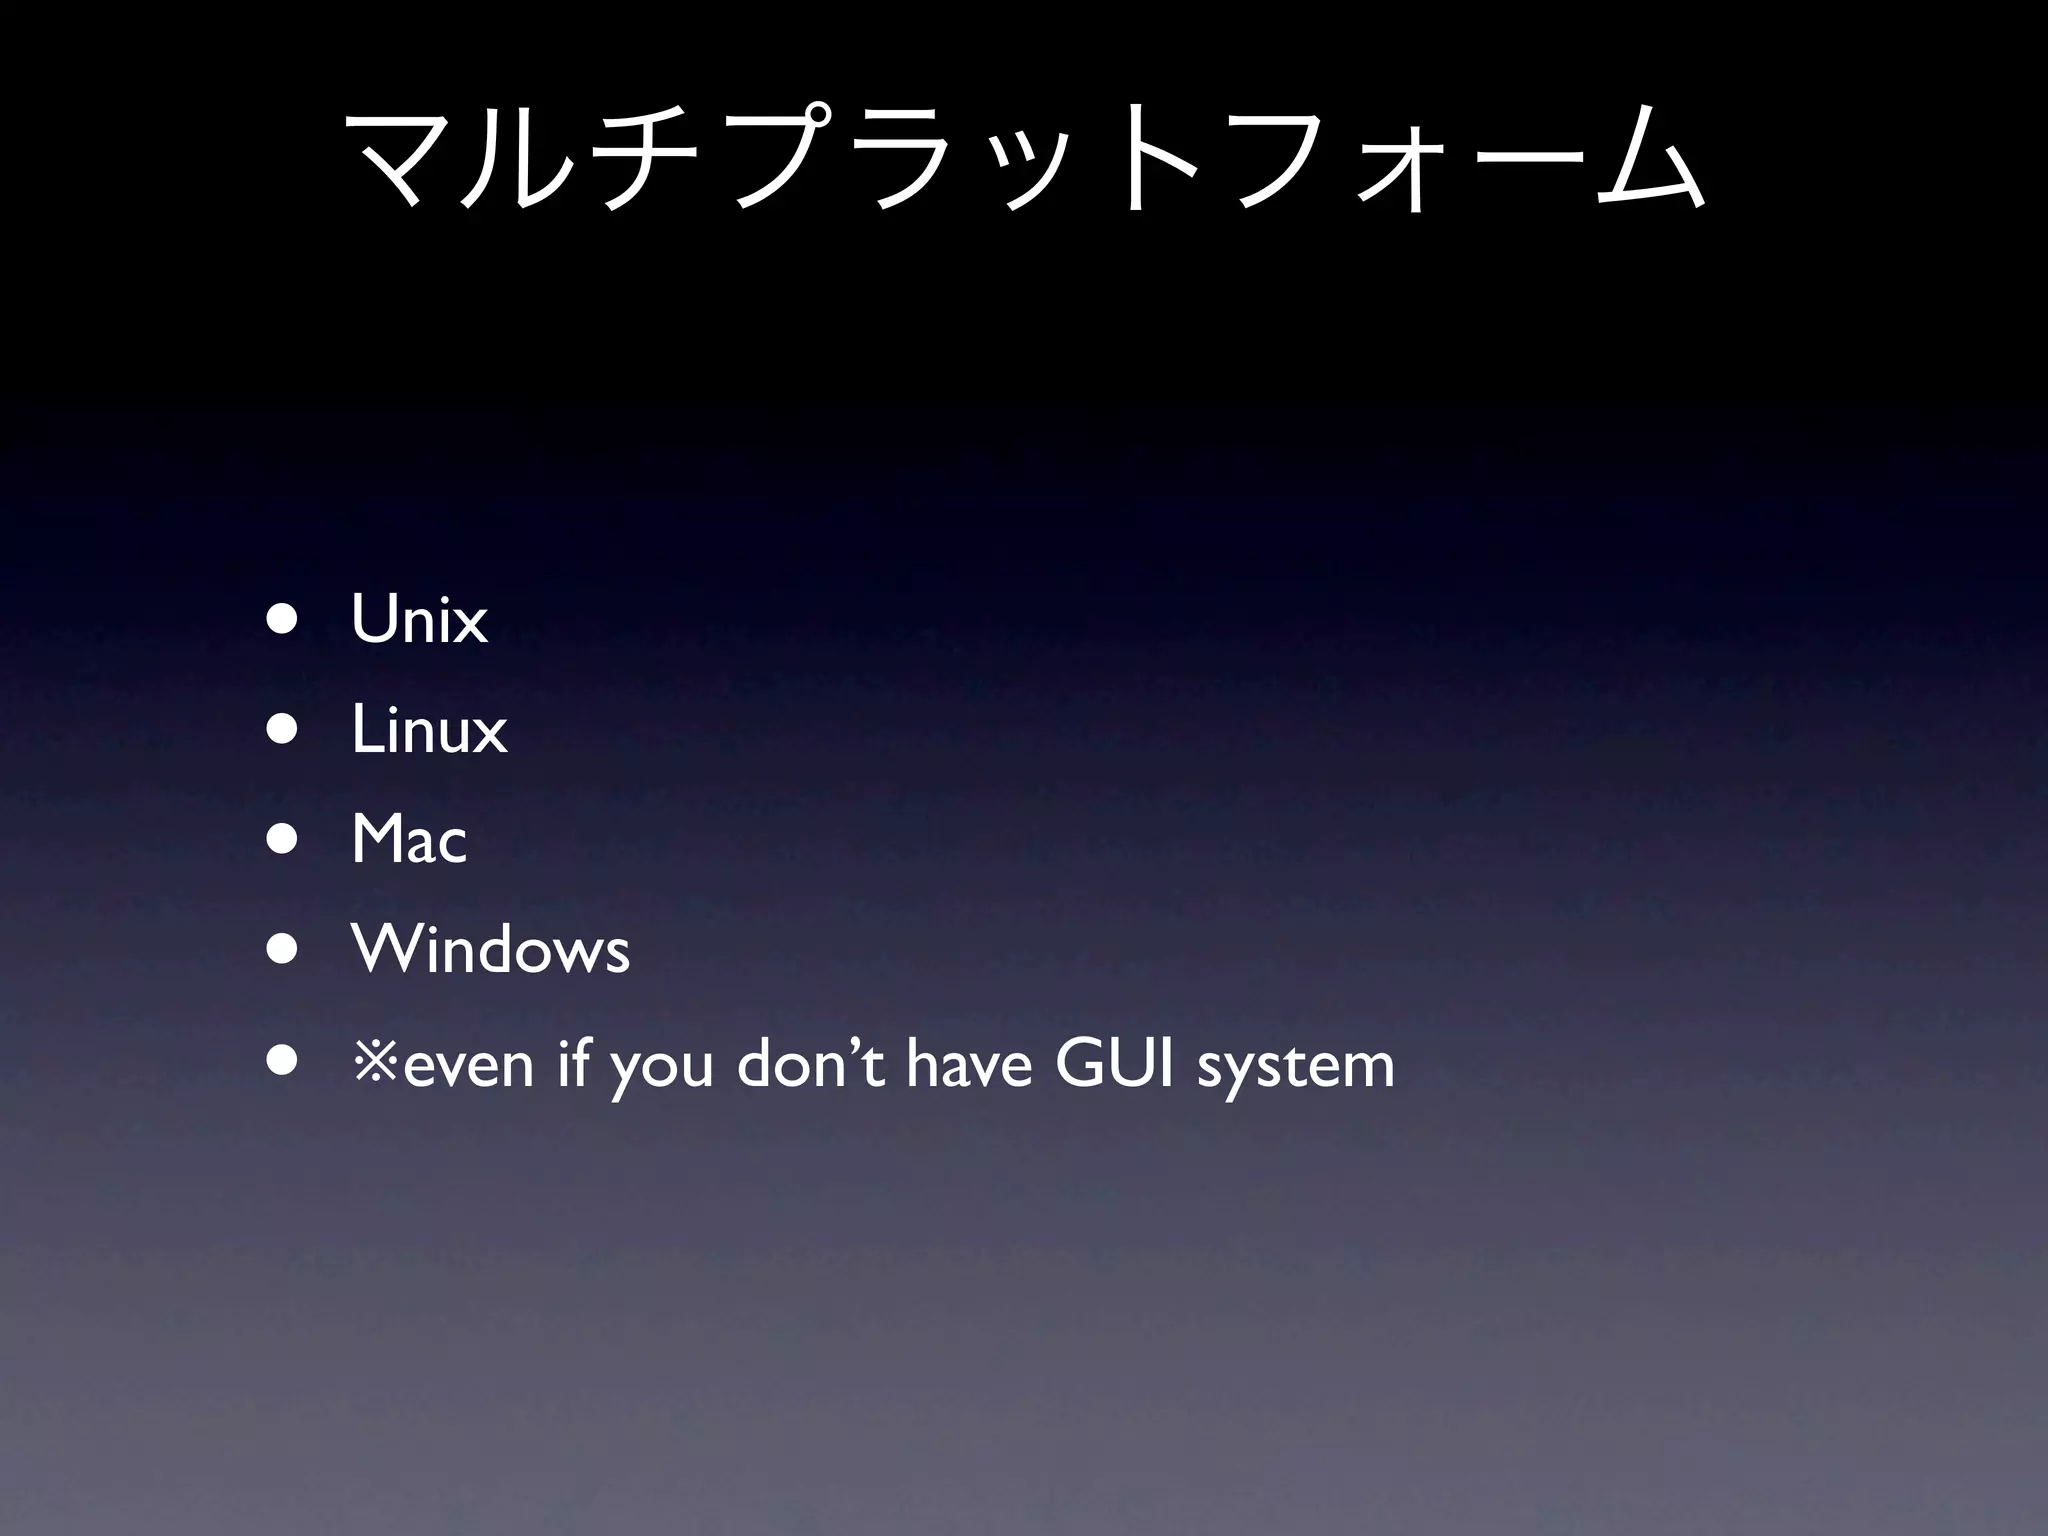
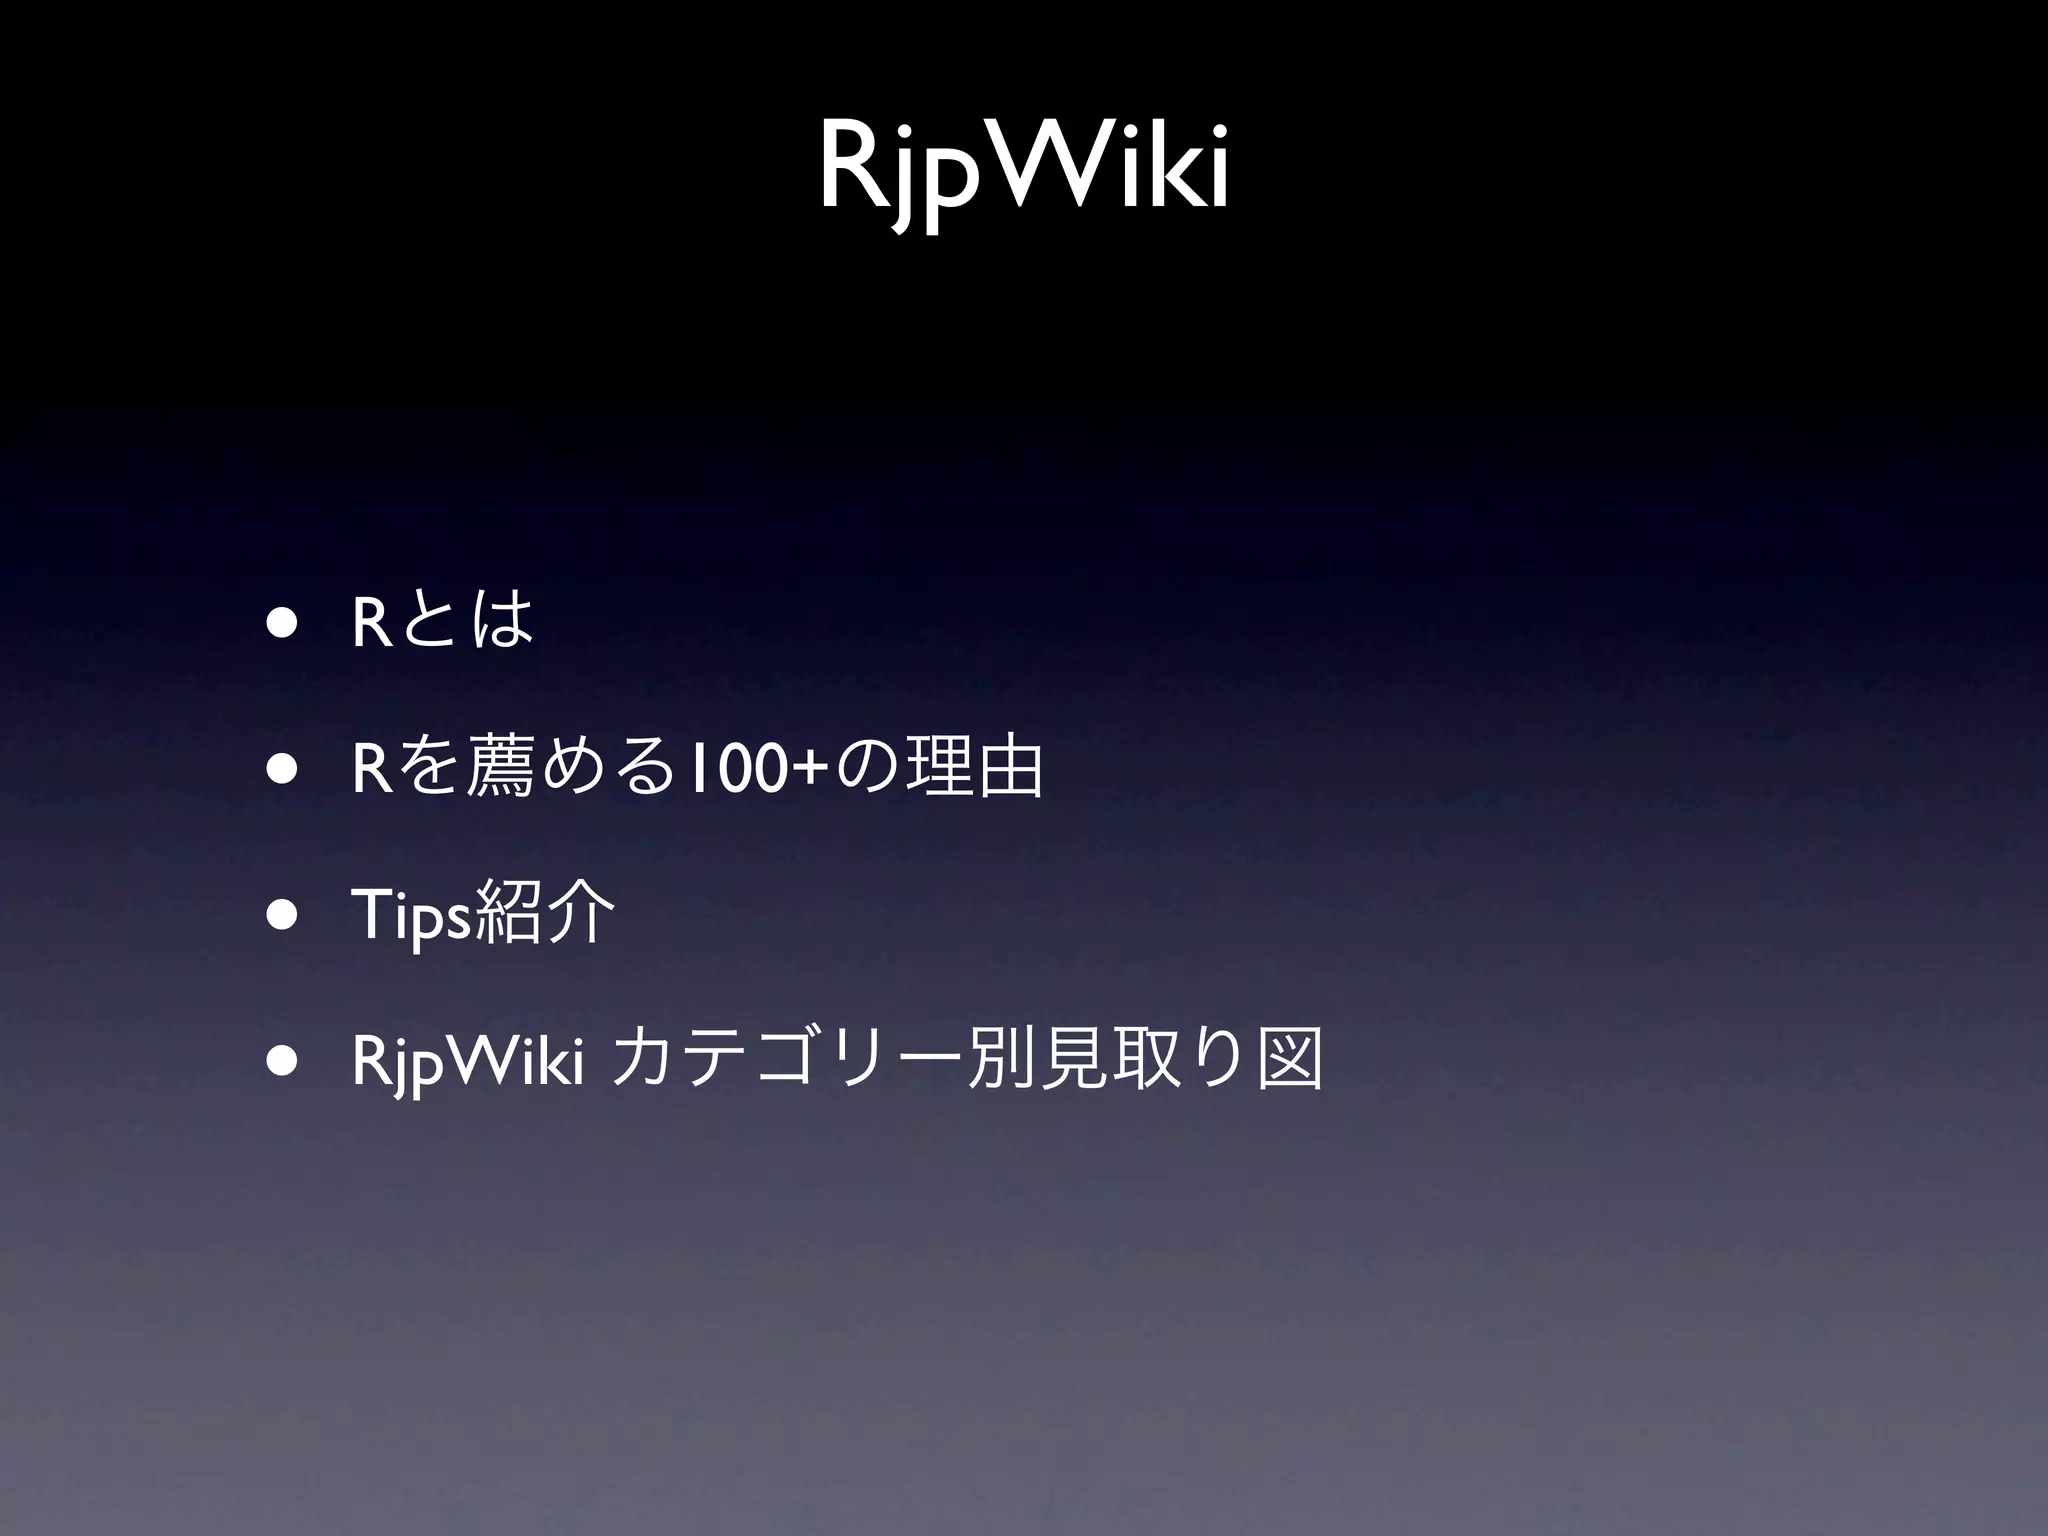

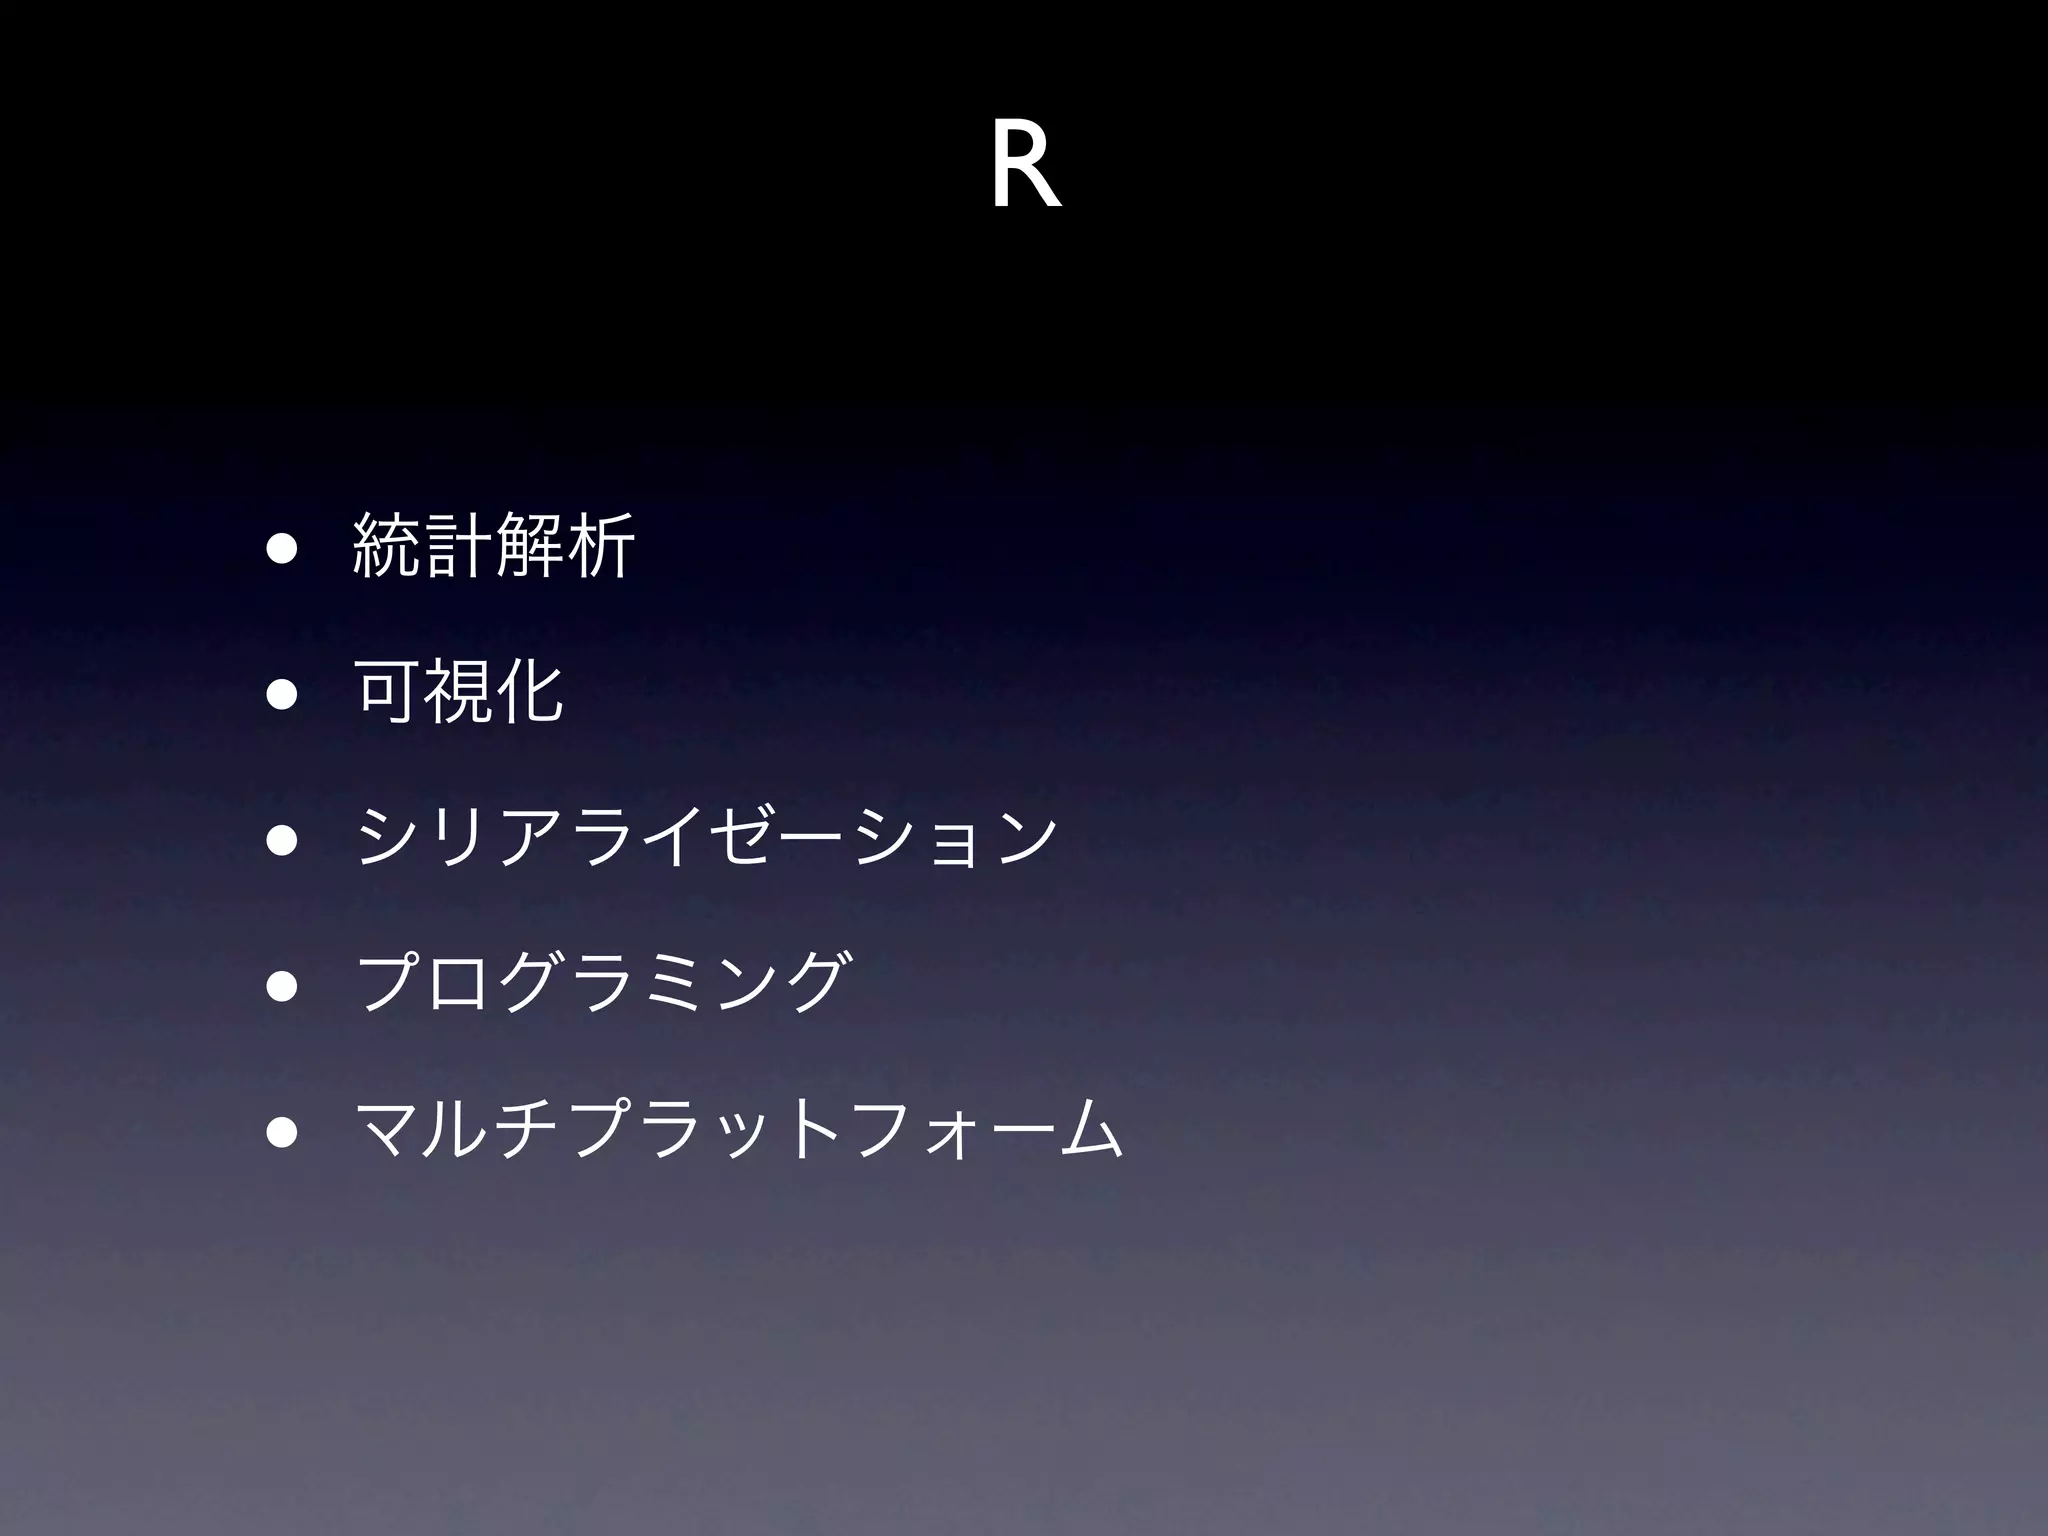
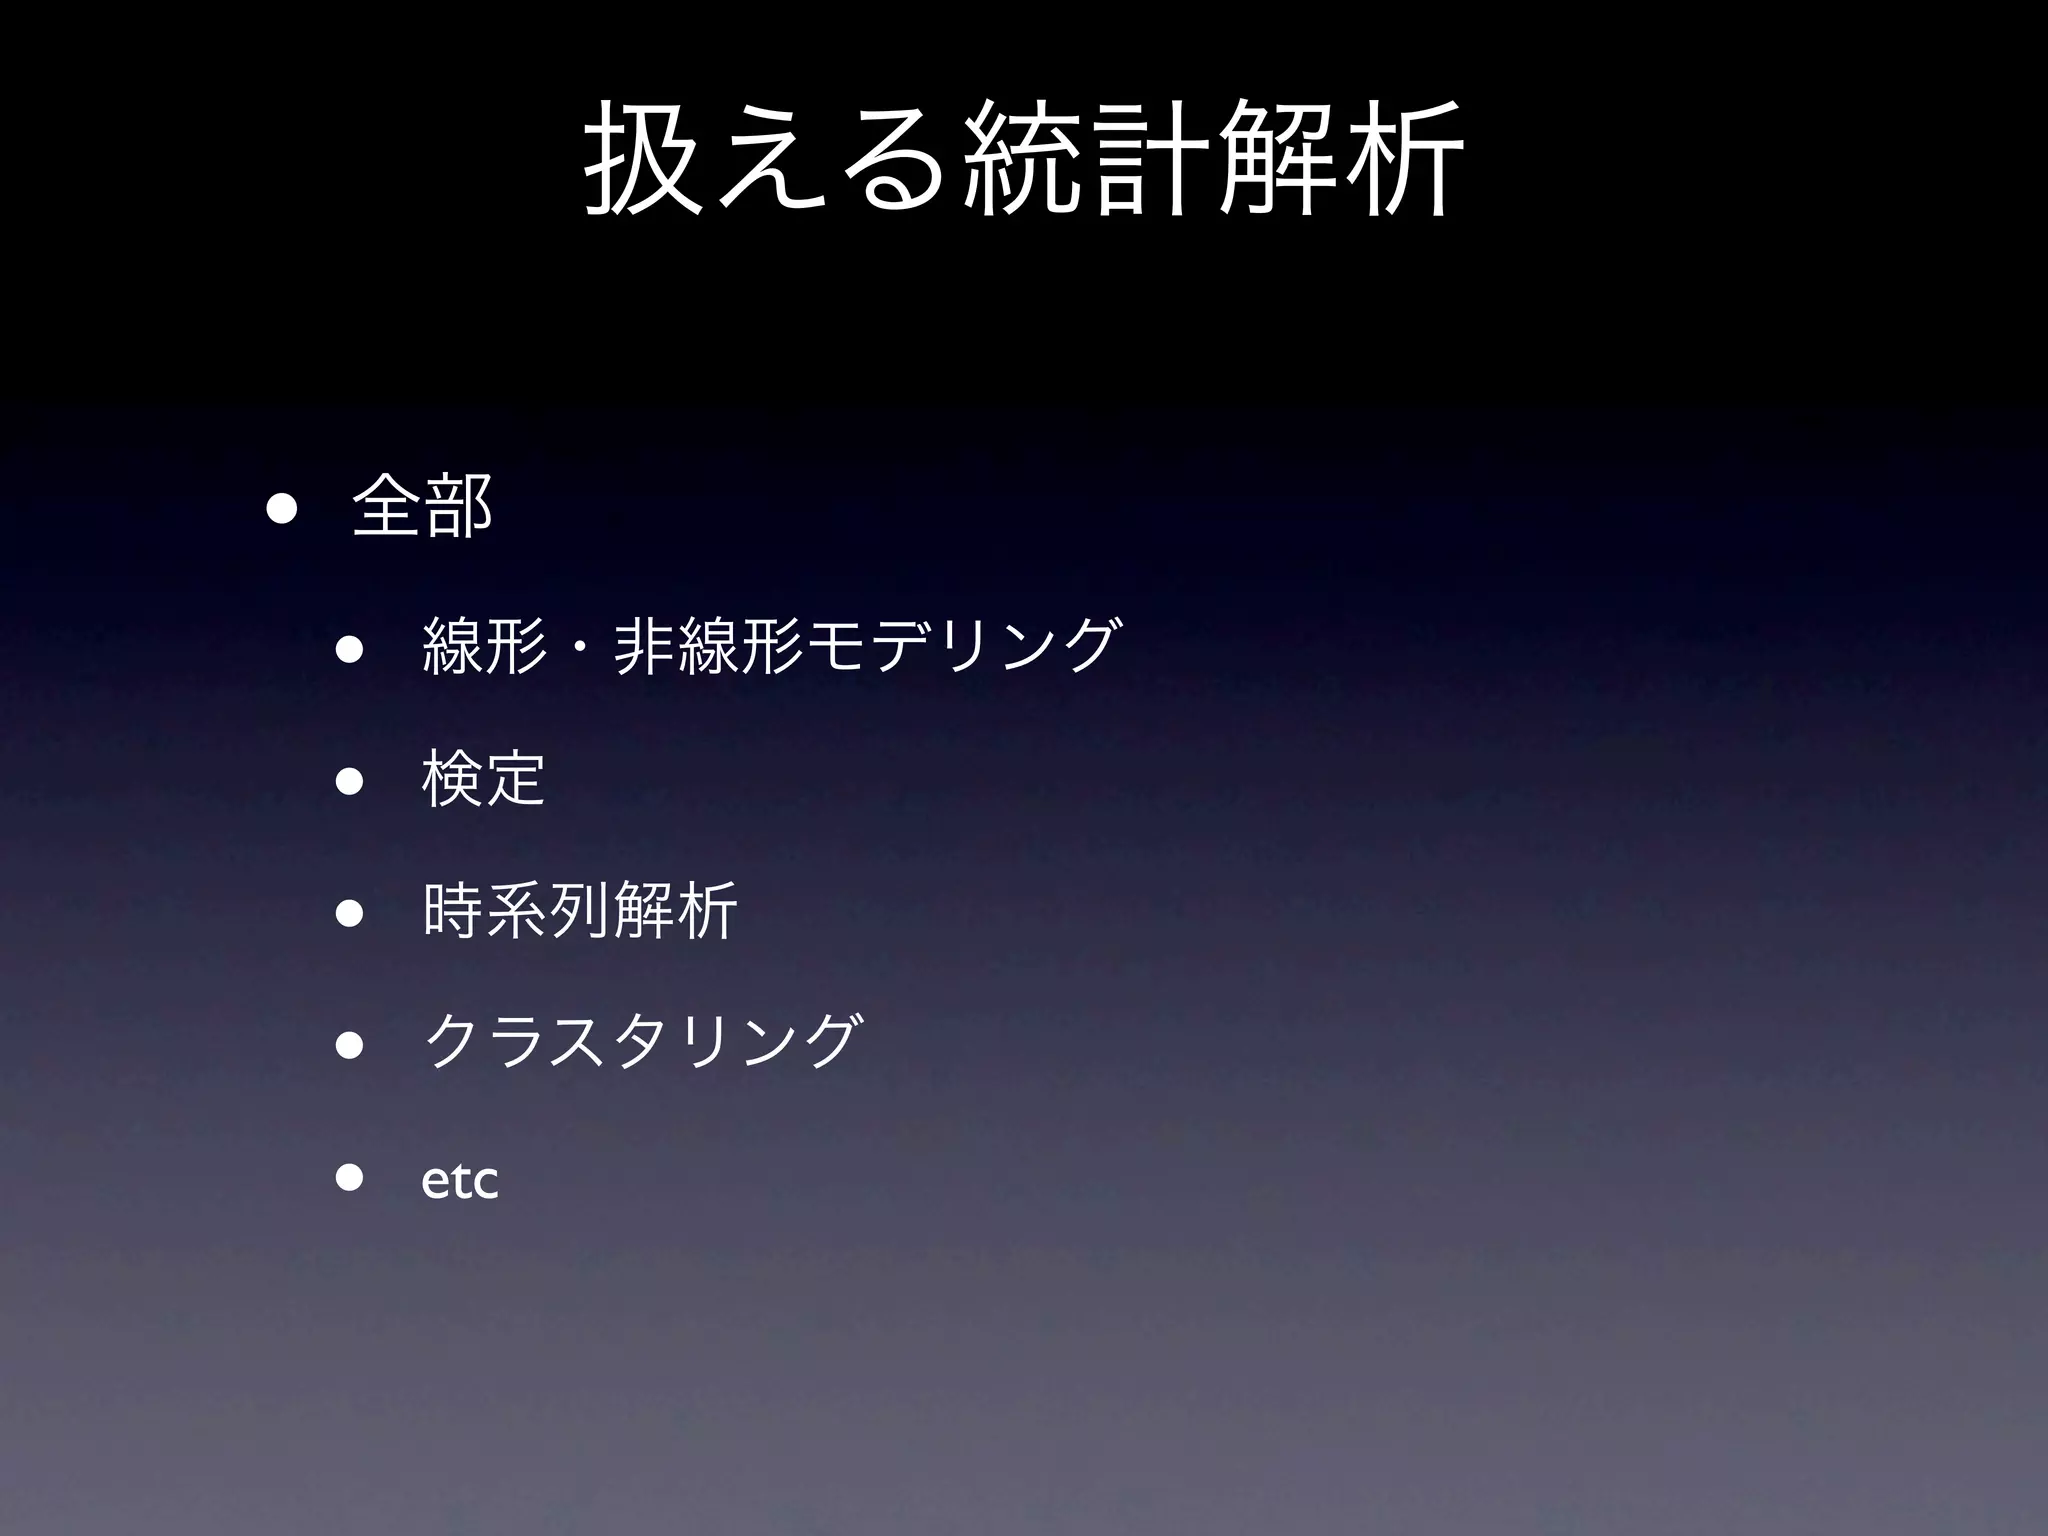
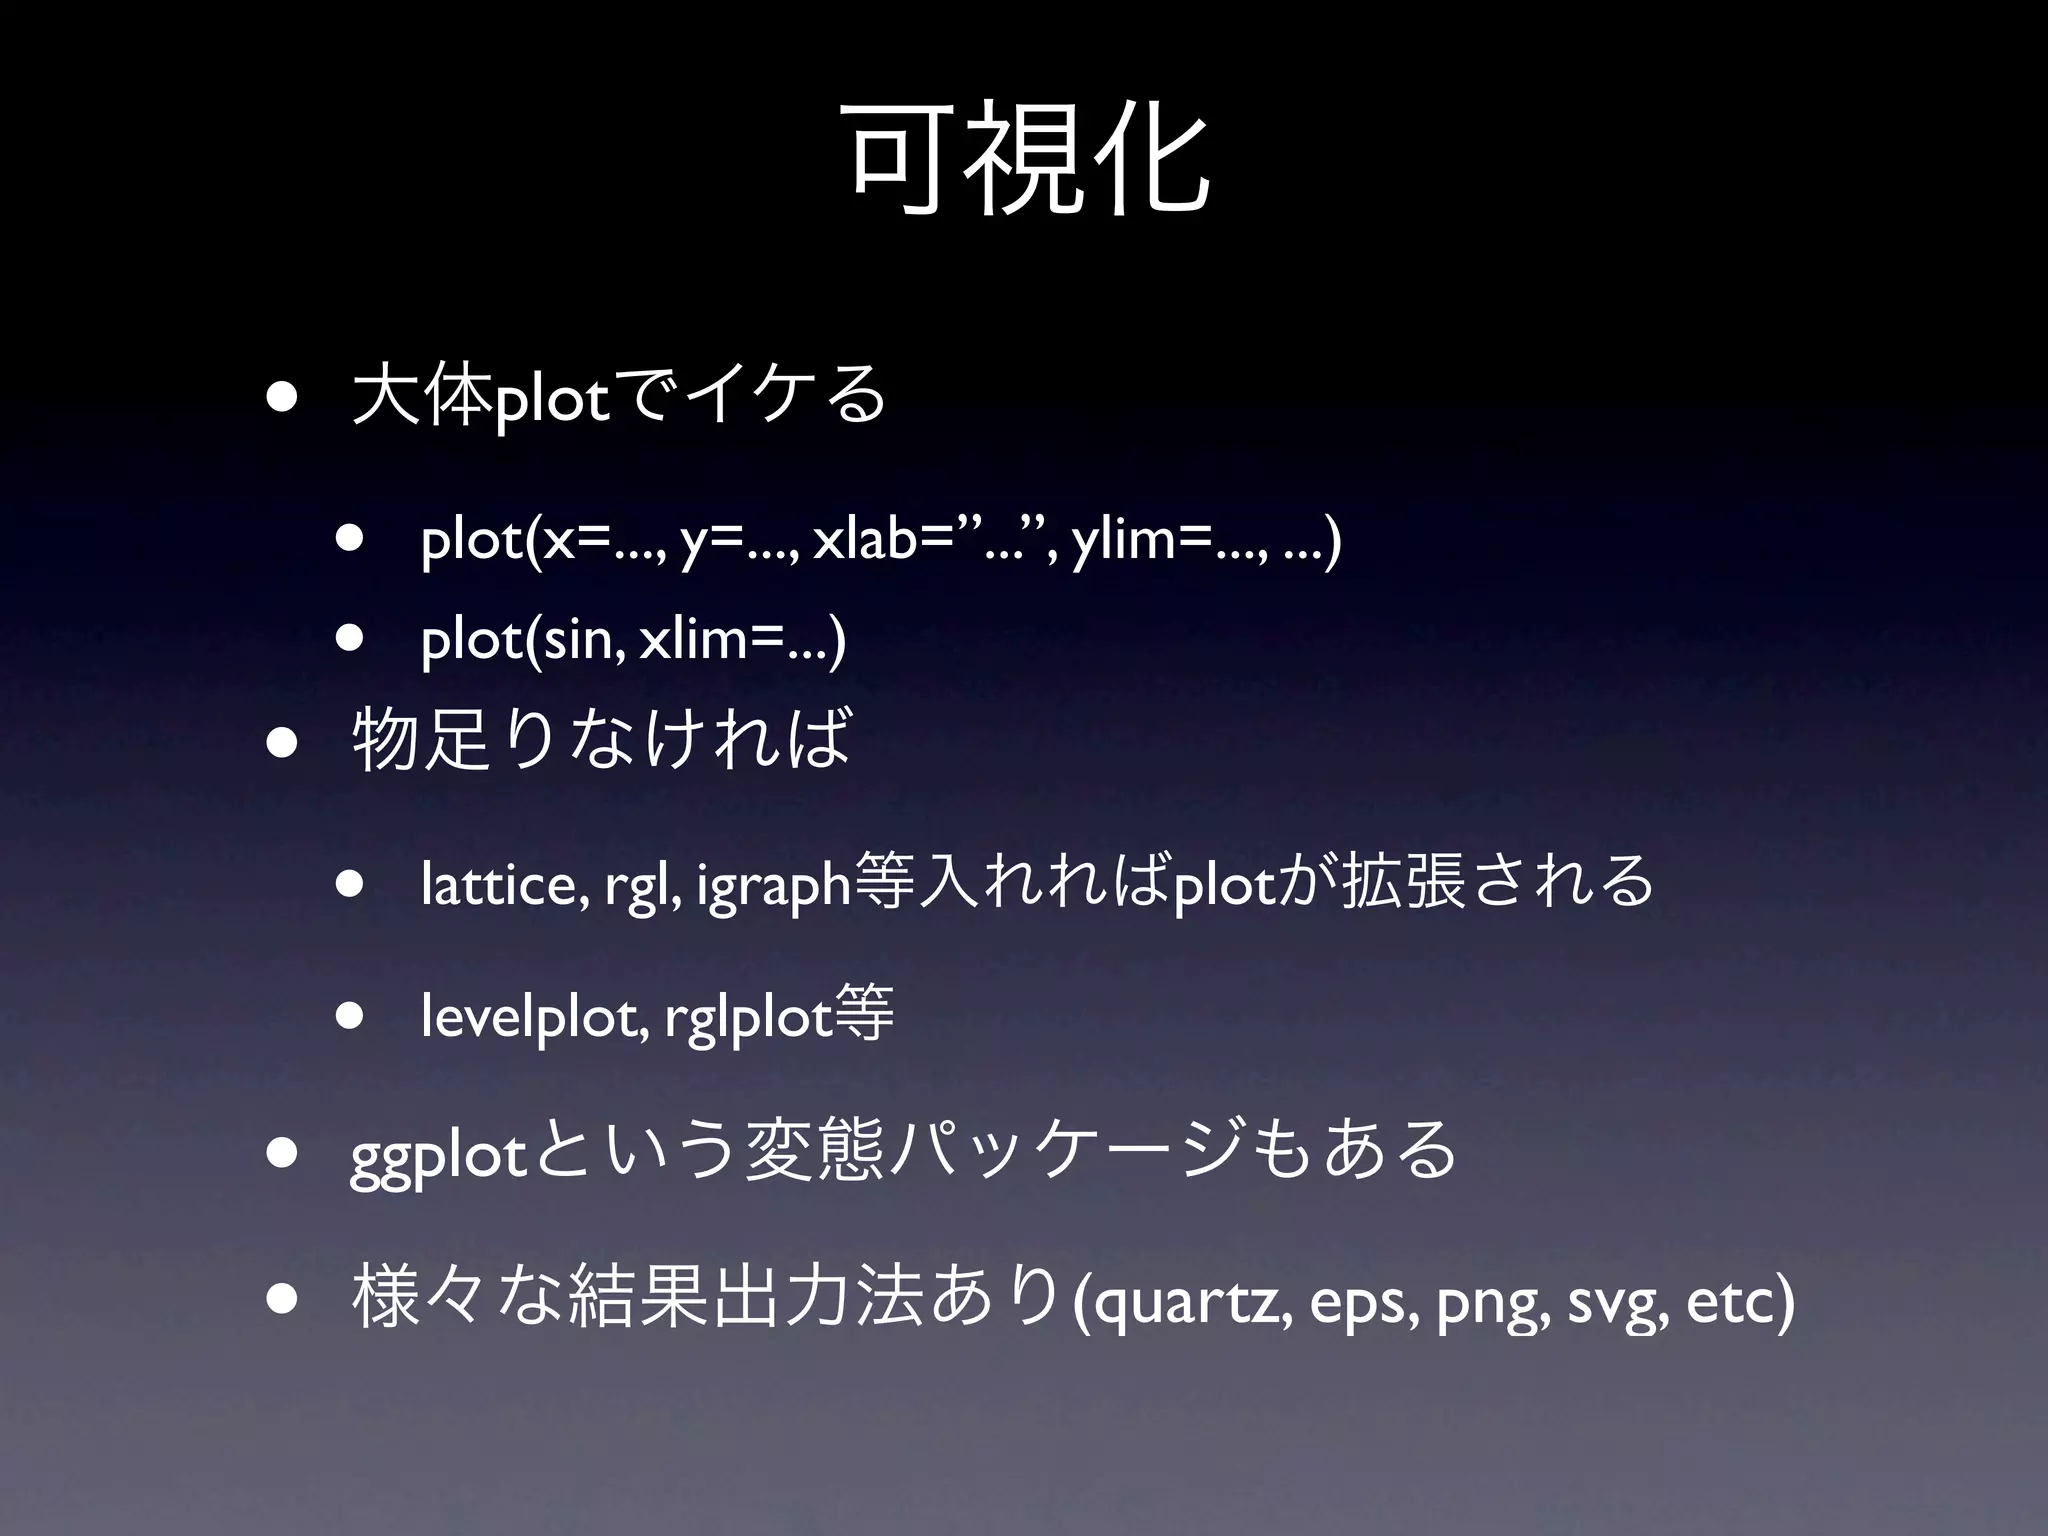
This document provides an overview of key concepts in R including: - Common plots like basic plots, lattice plots, and ggplot2 plots that can be saved in different file formats - Functions for reading and writing data from files, databases, and the web - Common programming structures like functions, classes, control flow, and vectors - How to get help in R using the ? operator and resources like RjpWiki - That R can be used on different operating systems even without a GUI


![• • or • Layer [ save, load, data, file, seek, dput, dget, parse, write, scan, etc... ] • Layer [ read.csv, write.csv, read.table, write.csv, etc... ] • Layer [ write.graph, read.graph, sqlFetch, etc... ] • http://cran.r-project.org/doc/manuals/R-data.html](https://image.slidesharecdn.com/20110922-110922175132-phpapp02/75/R-Basic-Introduction-5-2048.jpg)


