Download as PDF, PPTX
![Python “a,b,c,d,e”.split(“,”) (R strsplit) • strsplit(“a,b,c,d,e”,“,“) • (Output R-list) • unlist(strsplit(“a,b,c,d,e”,“,"))[vector_index]](https://image.slidesharecdn.com/learningnotesofrforpythonprogrammer-120930145414-phpapp01/75/Learning-notes-of-r-for-python-programmer-Temp1-11-2048.jpg)
![Python Dictionary (R List) • Constructor – Rlist <- list(key1=value1, … , key_n = value_n) • Evaluate – Rlist$key1 (Python> D[key1]) – Rlist[[1]] • Sublist – Rlist[key_i] (output list(key_i=value_i))](https://image.slidesharecdn.com/learningnotesofrforpythonprogrammer-120930145414-phpapp01/75/Learning-notes-of-r-for-python-programmer-Temp1-14-2048.jpg)
![Python D[“new_key”]=new_value • Rlist$new_key = new_value or • Rlist$new_key <- new_value](https://image.slidesharecdn.com/learningnotesofrforpythonprogrammer-120930145414-phpapp01/75/Learning-notes-of-r-for-python-programmer-Temp1-15-2048.jpg)
![Python> del D[key] • New_Rlist <- Rlist[-key_index] or • New_Rlist <- Rlist[-vector_of_key_index]](https://image.slidesharecdn.com/learningnotesofrforpythonprogrammer-120930145414-phpapp01/75/Learning-notes-of-r-for-python-programmer-Temp1-16-2048.jpg)
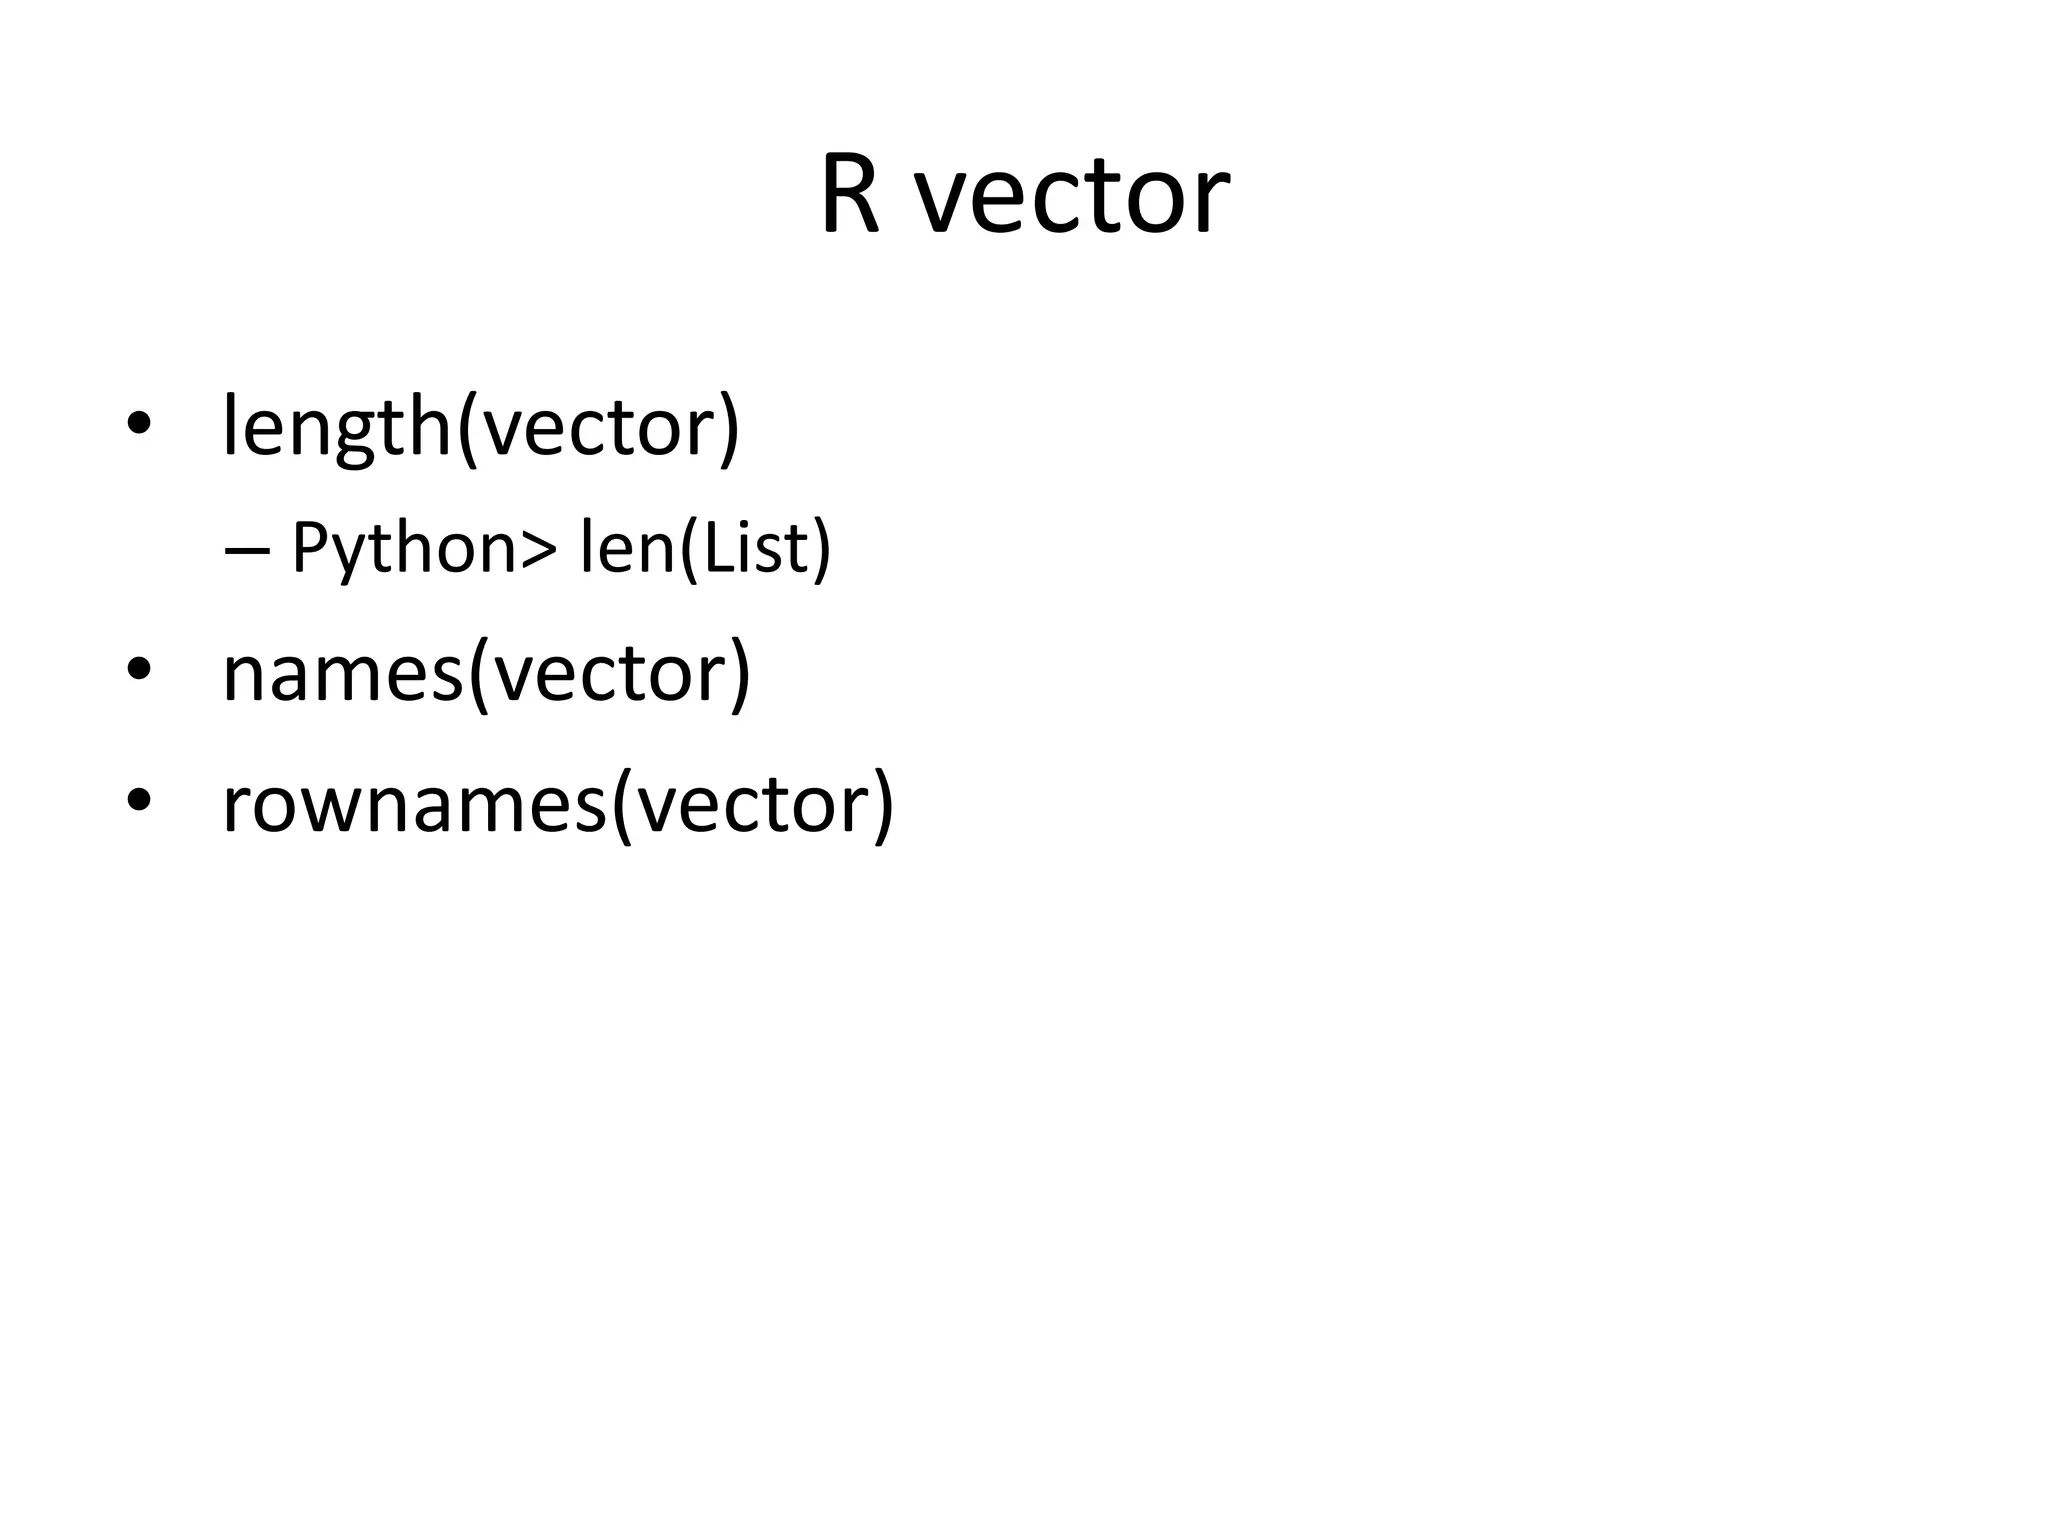
![Python List (R vector) • [Constructor] vector(mode , length) – vector(mode = "character", length = 10) • 0:10 – 0:10 == c(0,1,2,3,4,5,6,7,8,9,10) – Python> range(0,11) ) • seq(0,1,0.1) – seq(0,1,0.1) == 0:10*0.1 – Matlab> linspace(0,1,0.1) • rep(0:10, times = 2)](https://image.slidesharecdn.com/learningnotesofrforpythonprogrammer-120930145414-phpapp01/75/Learning-notes-of-r-for-python-programmer-Temp1-19-2048.jpg)
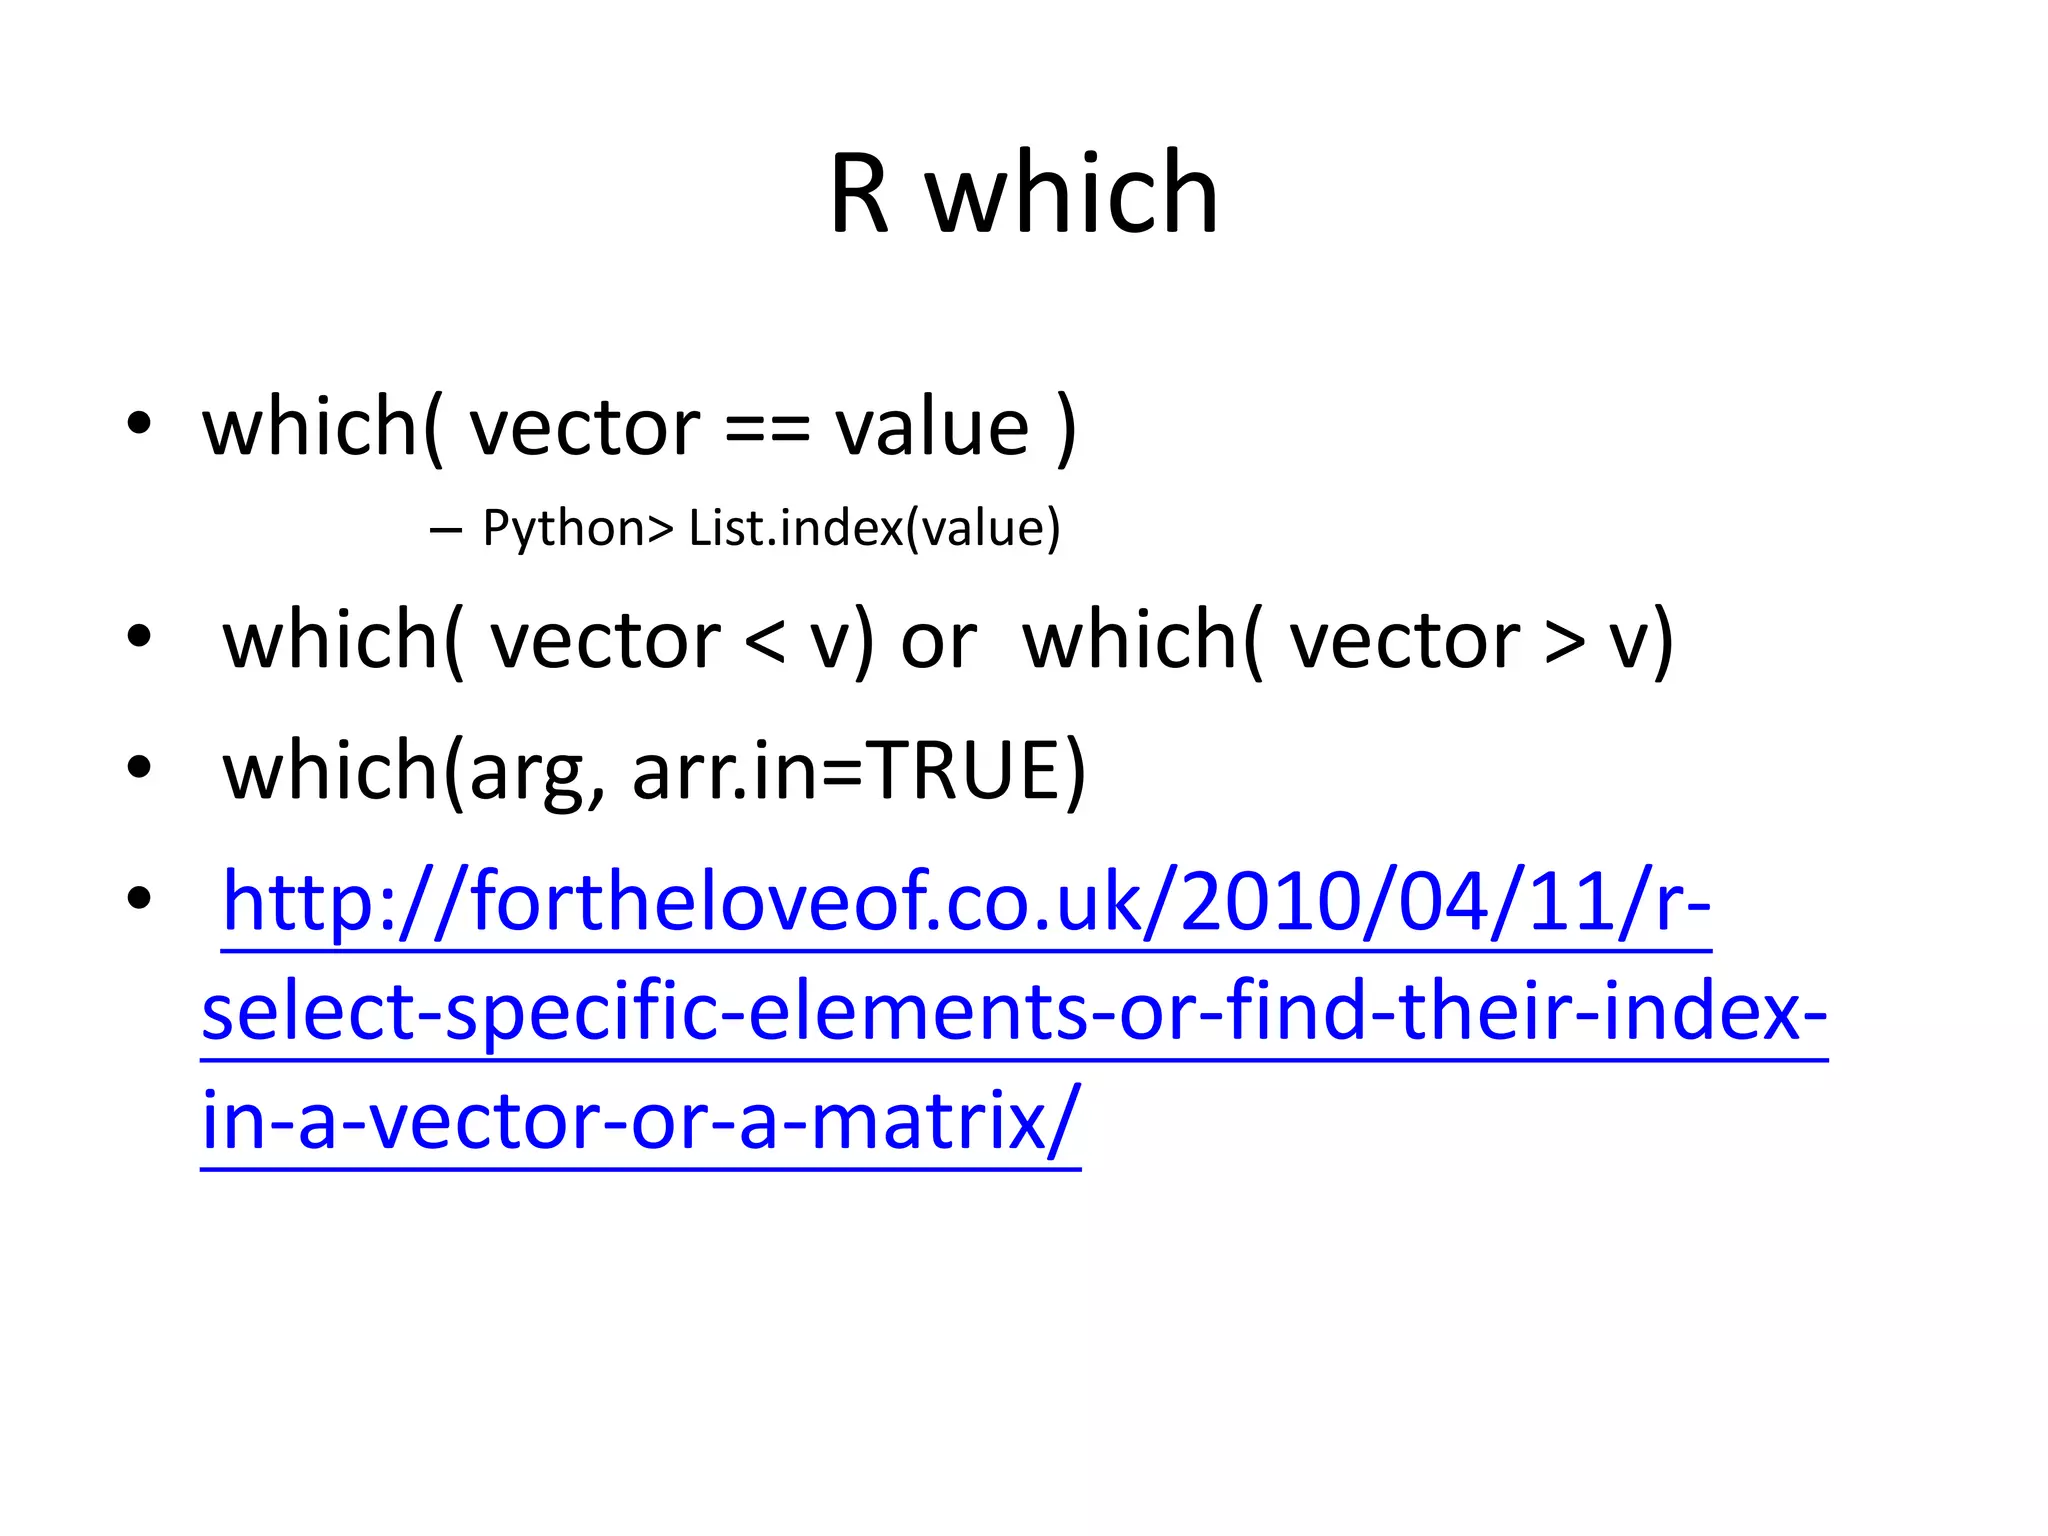
![Python List.methods • vector <- c(vector, other_vector) – Python> List.append • vector[-J] or vector[-(I:J)] – Python> List.pop • subvector <- vector[vector_of_index] • which( vector == value ) – Python> List.index(value)](https://image.slidesharecdn.com/learningnotesofrforpythonprogrammer-120930145414-phpapp01/75/Learning-notes-of-r-for-python-programmer-Temp1-20-2048.jpg)
![R-Matrix=R-Vector with Dimension > x <- 1:15 > class(x) [1] "integer" > dim(x) <- c(3, 5) > class(x) [1] "matrix"](https://image.slidesharecdn.com/learningnotesofrforpythonprogrammer-120930145414-phpapp01/75/Learning-notes-of-r-for-python-programmer-Temp1-26-2048.jpg)
![Names on Matrix • Just as you can name indices in a vector you can (and should!) name columns and rows in a matrix with colnames(X) and rownames(X). • E.g. – colname(R-matrix) <- c(name_1,name_2,…) – colname(R-matrix) [i] <- name_i](https://image.slidesharecdn.com/learningnotesofrforpythonprogrammer-120930145414-phpapp01/75/Learning-notes-of-r-for-python-programmer-Temp1-27-2048.jpg)

![swtich • Switch (statement, list) • Example: > y <- "fruit" > switch(y, fruit = "banana", vegetable = "broccoli", meat = "beef") [1] "banana"](https://image.slidesharecdn.com/learningnotesofrforpythonprogrammer-120930145414-phpapp01/75/Learning-notes-of-r-for-python-programmer-Temp1-37-2048.jpg)
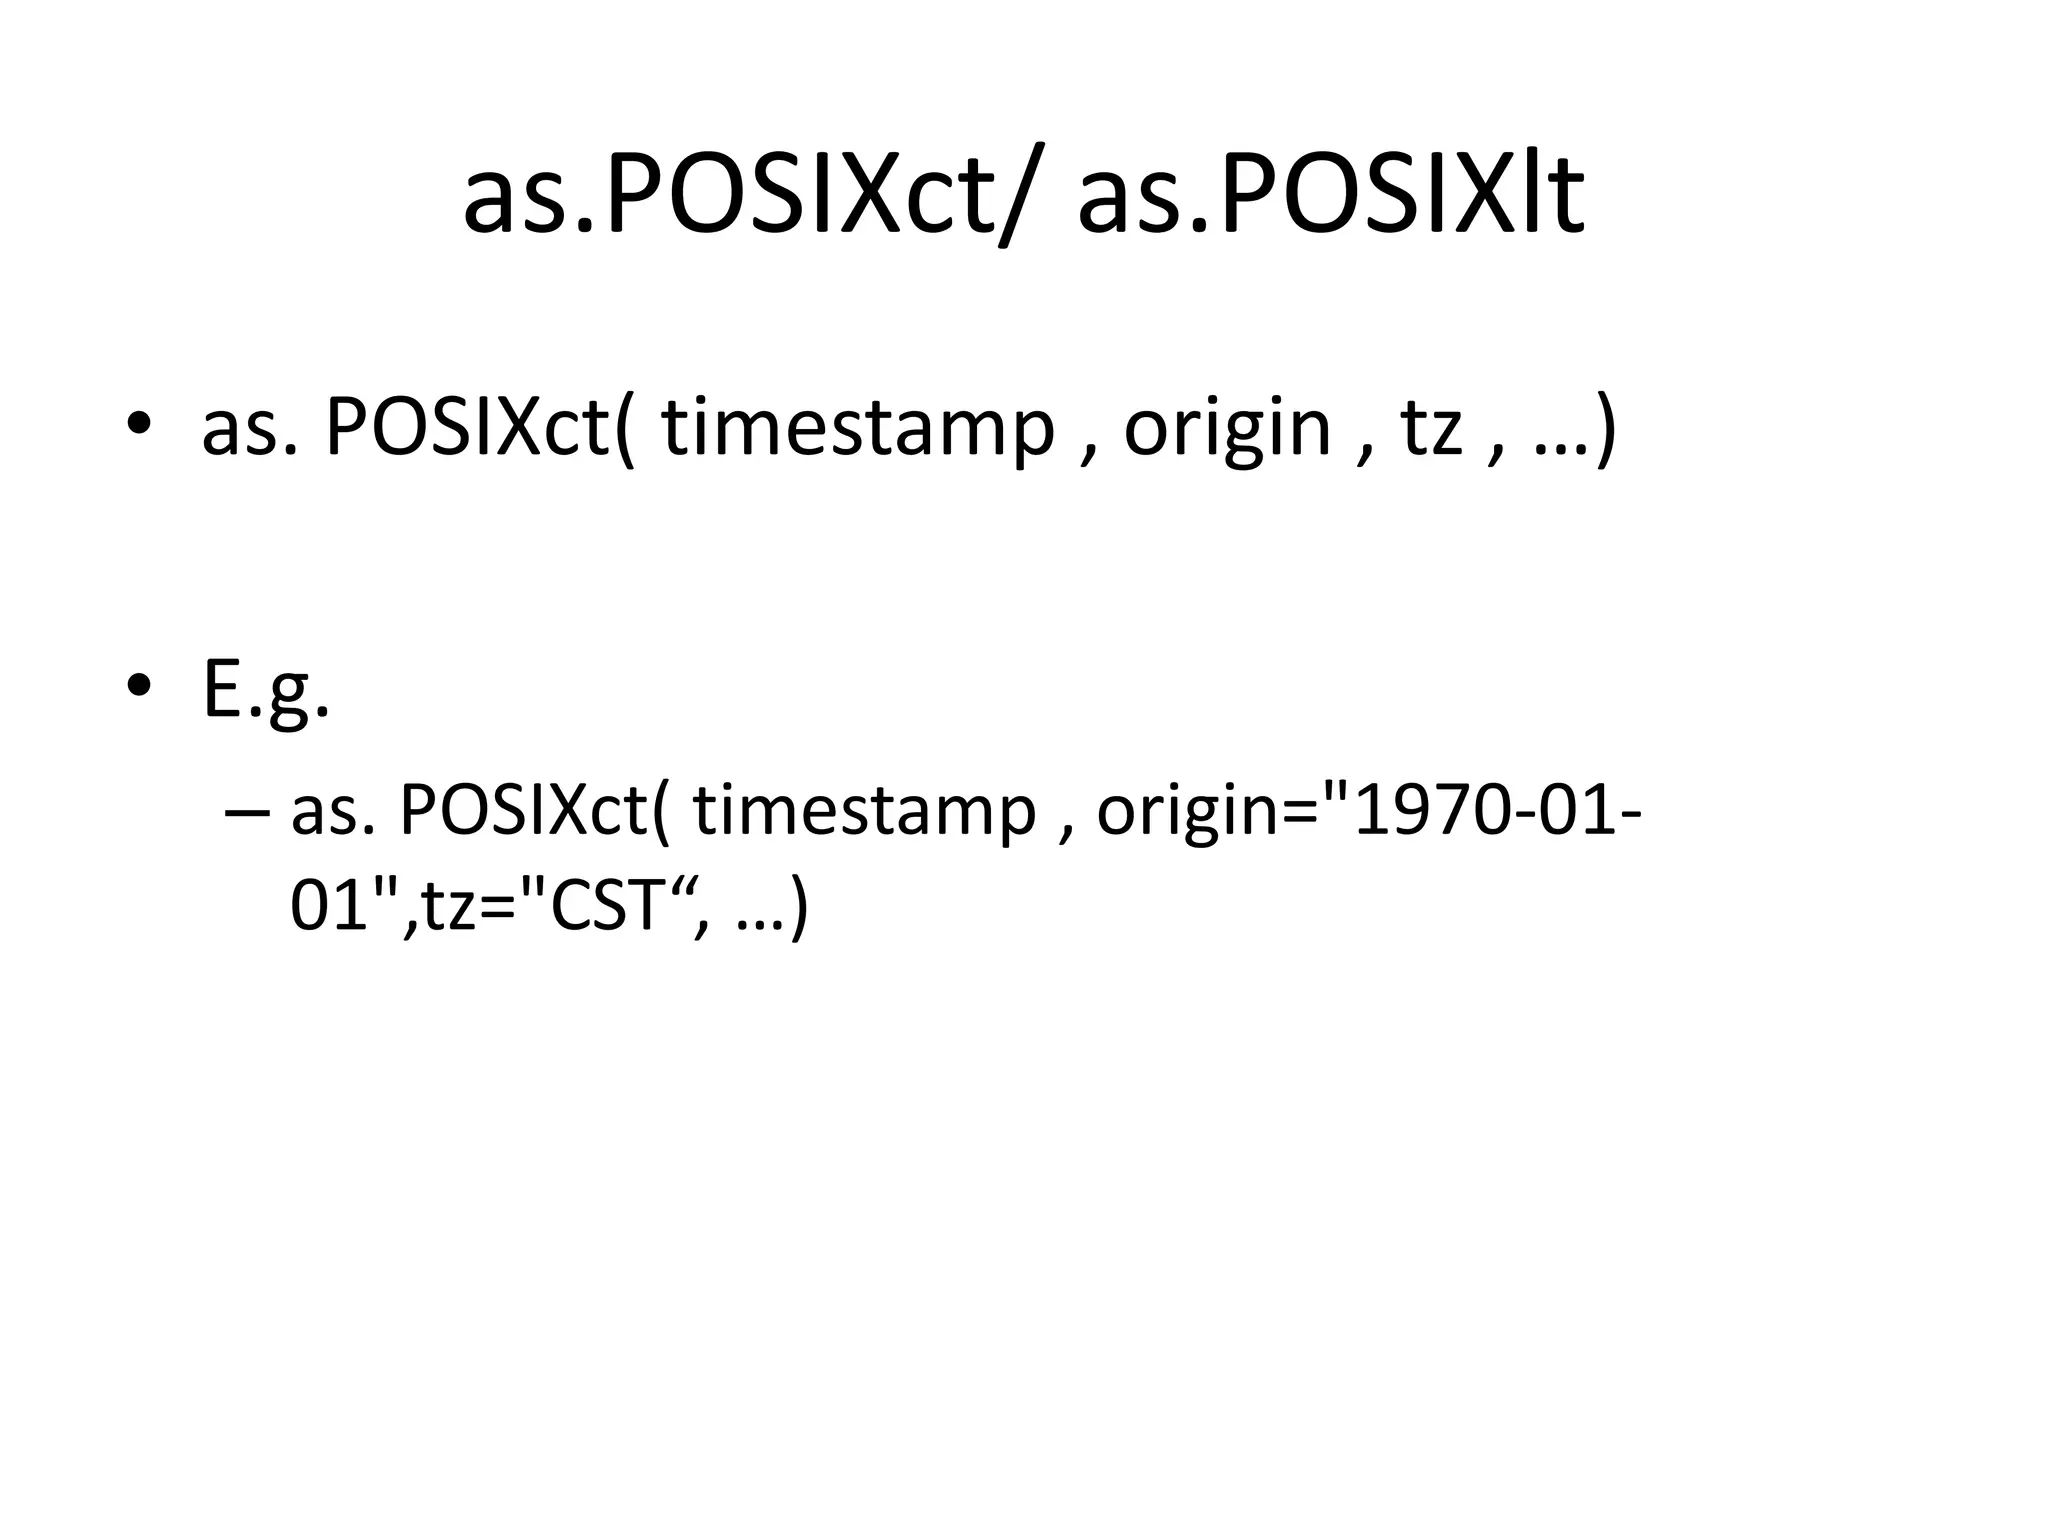
![Time to Timestamp [Python> time.mktime(…)] • as.numeric(POSIXlt Object) • E.g. – as.numeric(Sys.time())](https://image.slidesharecdn.com/learningnotesofrforpythonprogrammer-120930145414-phpapp01/75/Learning-notes-of-r-for-python-programmer-Temp1-49-2048.jpg)

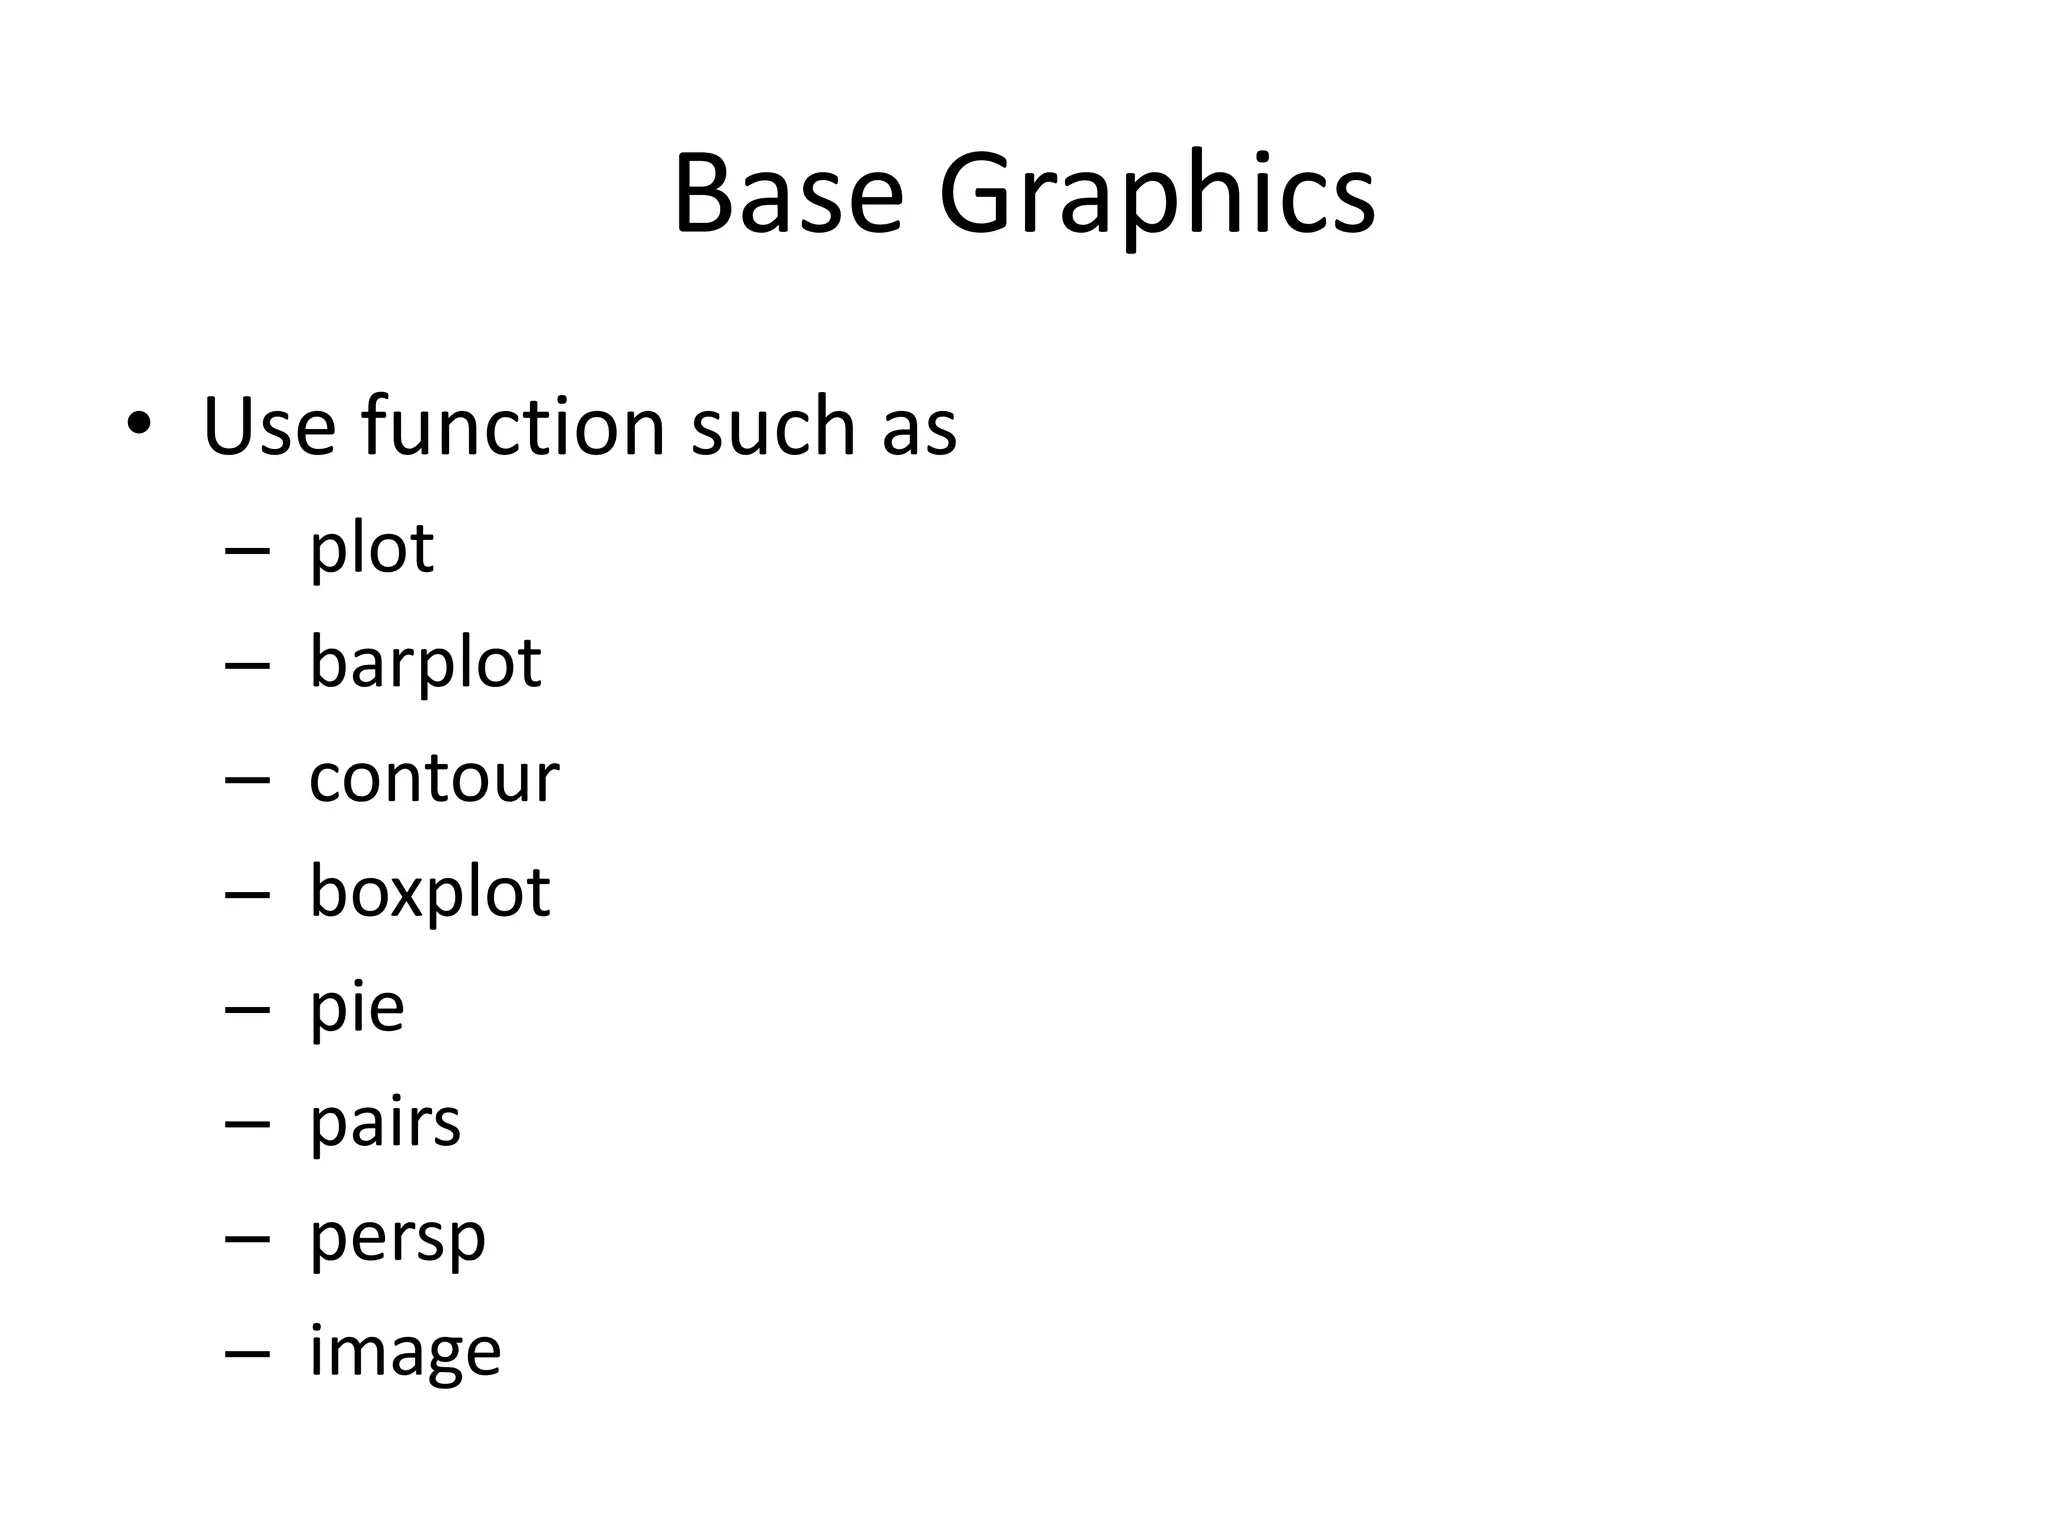
![pairs • E.g. – R> pairs(iris[,c(1,3,5)]) – R> example(pairs)](https://image.slidesharecdn.com/learningnotesofrforpythonprogrammer-120930145414-phpapp01/75/Learning-notes-of-r-for-python-programmer-Temp1-61-2048.jpg)
![MISC. Code2 (Saving Graph) • windows(record=TRUE, width=7, height=7) • Last_30_TXF<-last(TXF,30)plt • chartSeries(Last_30_TXF) • savePlot(paste("Last30_",unlist(strsplit(filena me,"."))[1],sep=""),type = "jpeg",device = dev.cur(),restoreConsole = TRUE)](https://image.slidesharecdn.com/learningnotesofrforpythonprogrammer-120930145414-phpapp01/75/Learning-notes-of-r-for-python-programmer-Temp1-63-2048.jpg)


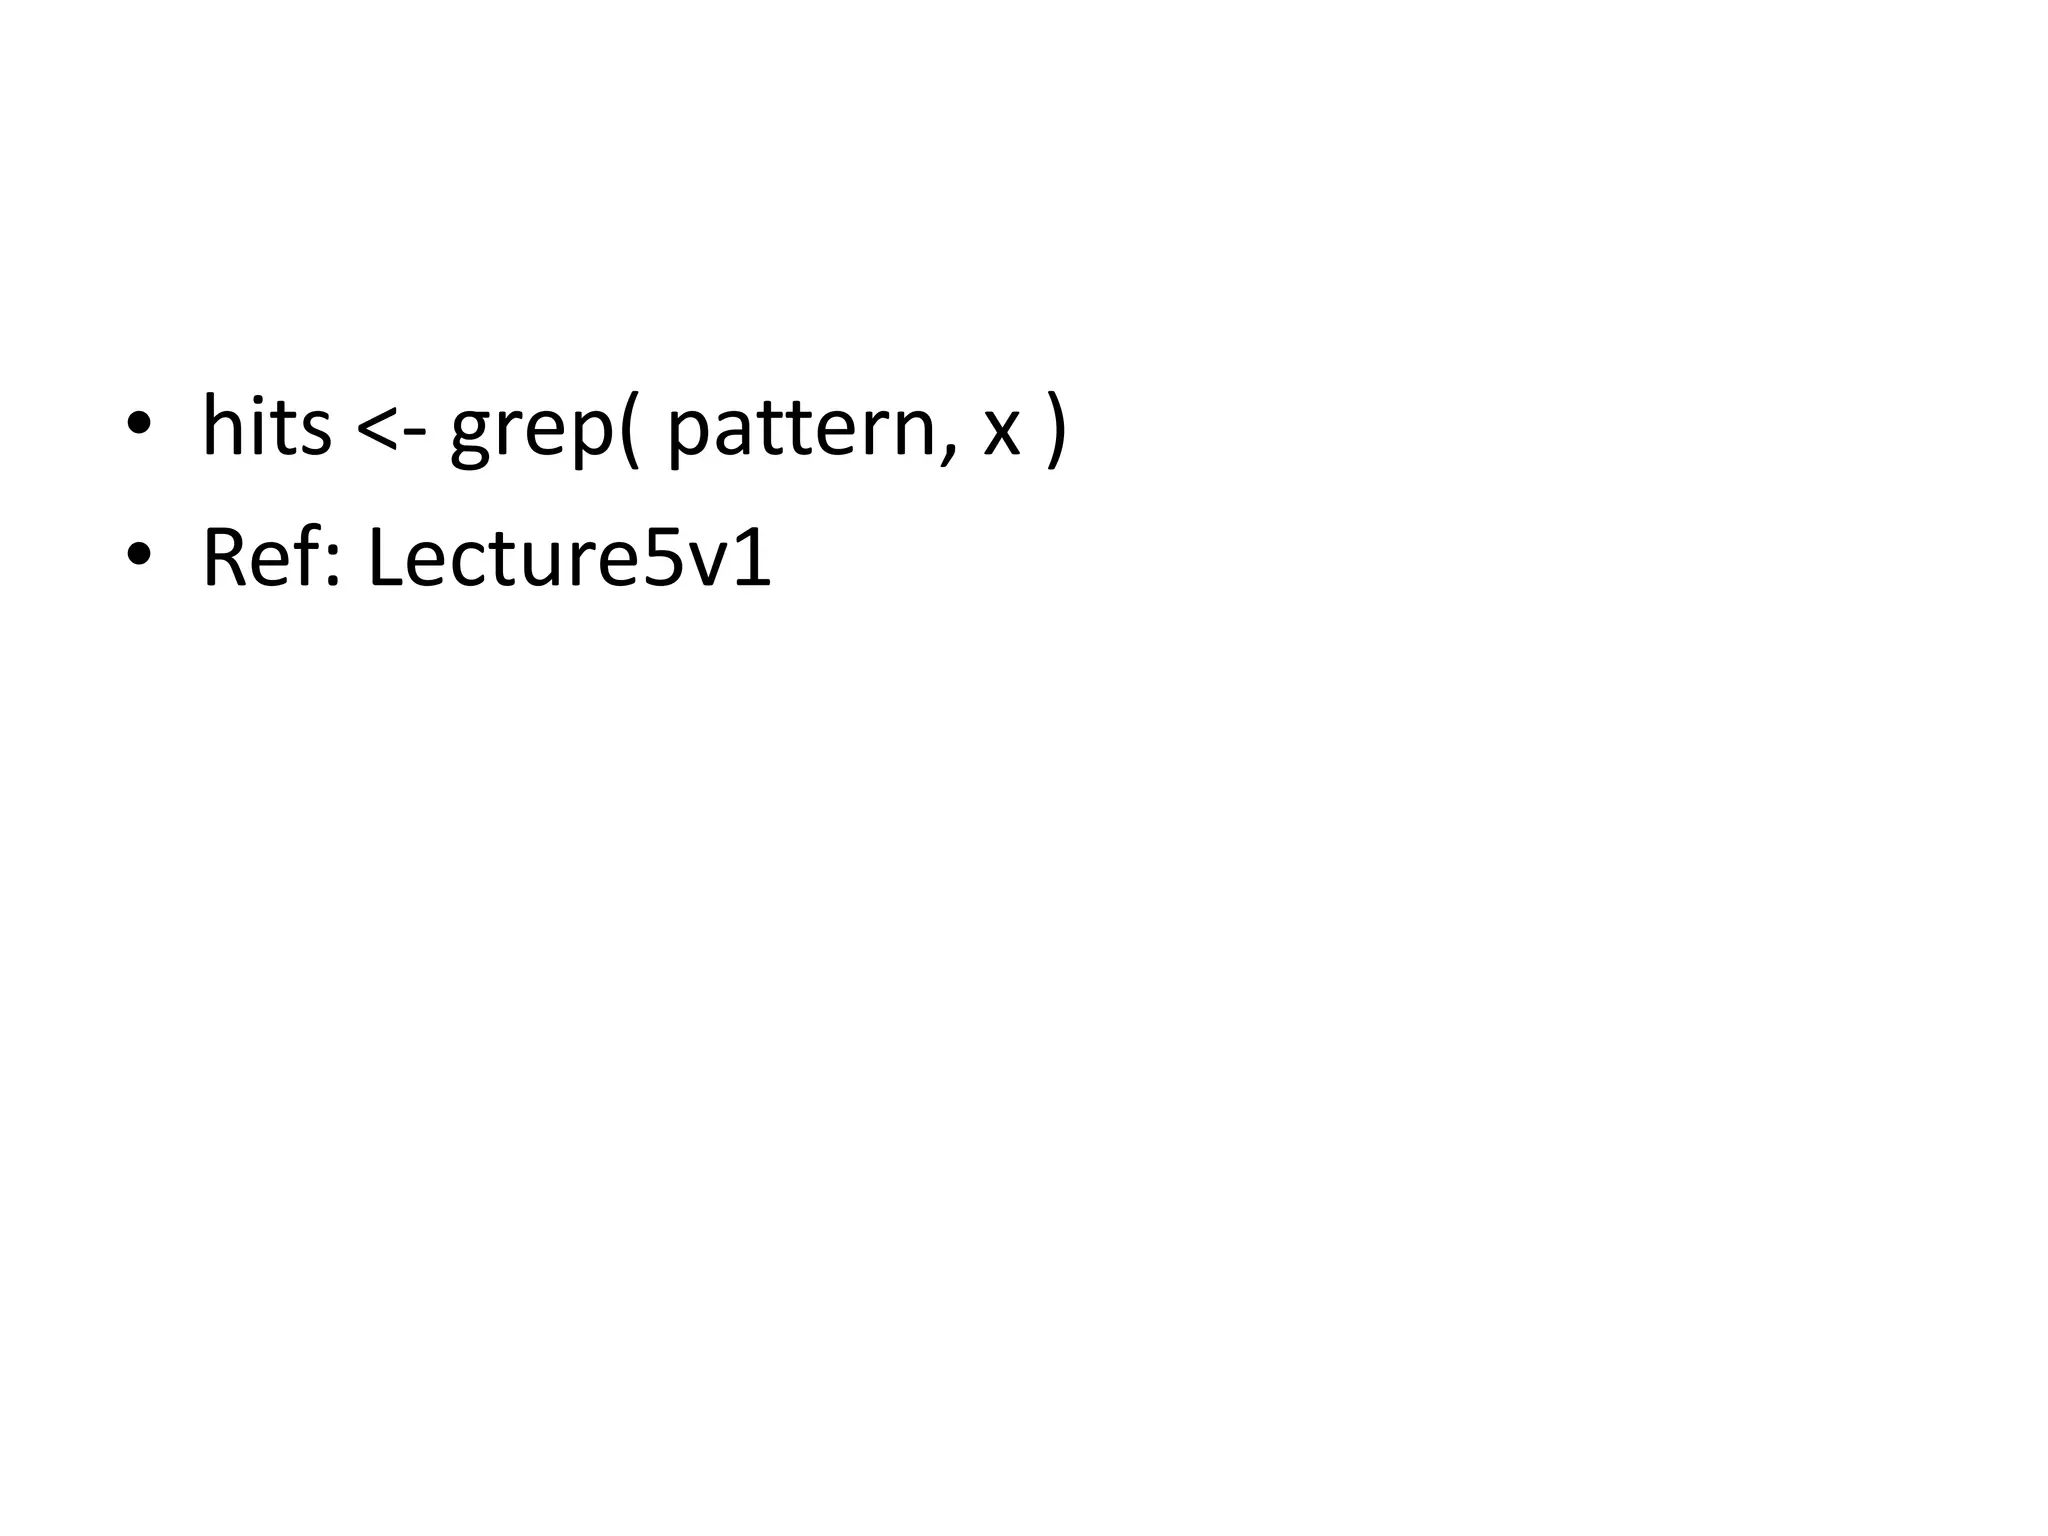
![grep • Pattern_Index <- grep(Pattern, Search_Vector) • E.g. (quantmod中的 Cl function) return(x[, grep("Close", colnames(x))])](https://image.slidesharecdn.com/learningnotesofrforpythonprogrammer-120930145414-phpapp01/75/Learning-notes-of-r-for-python-programmer-Temp1-79-2048.jpg)


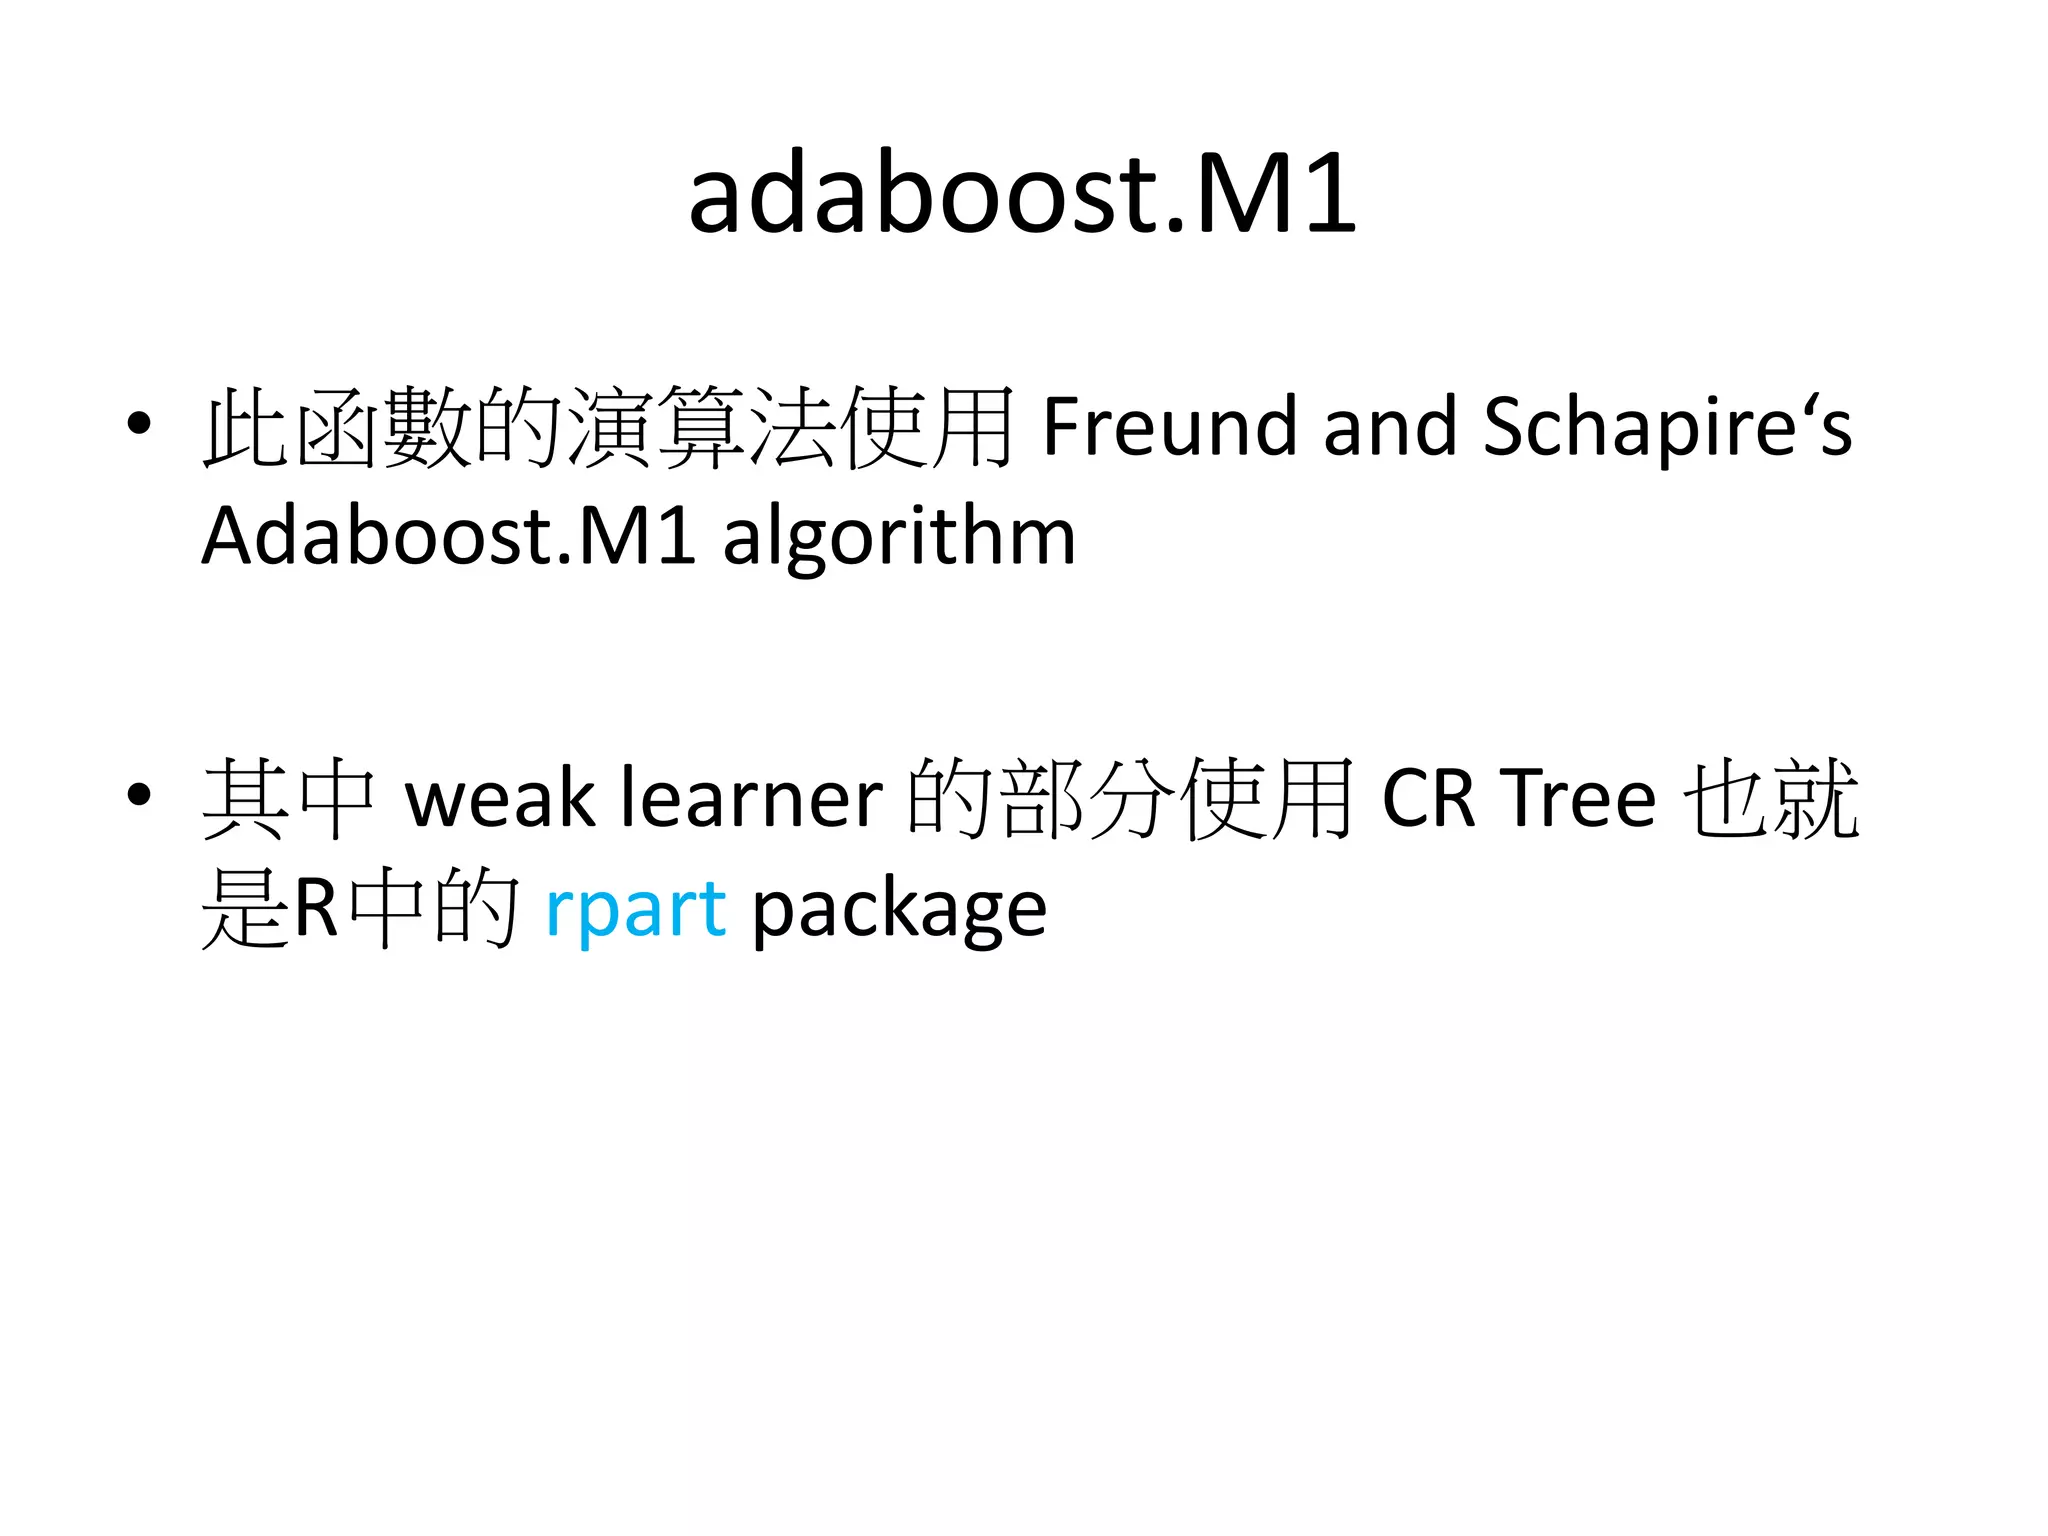
![adaboost.M1’s Training Data Form • Label Column must be a factor object (in source code) fit <- rpart(formula = formula, weights = data$pesos, data = data[, -1], maxdepth = maxdepth) flearn <- predict(fit, data = data[, -1], type = "class")](https://image.slidesharecdn.com/learningnotesofrforpythonprogrammer-120930145414-phpapp01/75/Learning-notes-of-r-for-python-programmer-Temp1-88-2048.jpg)


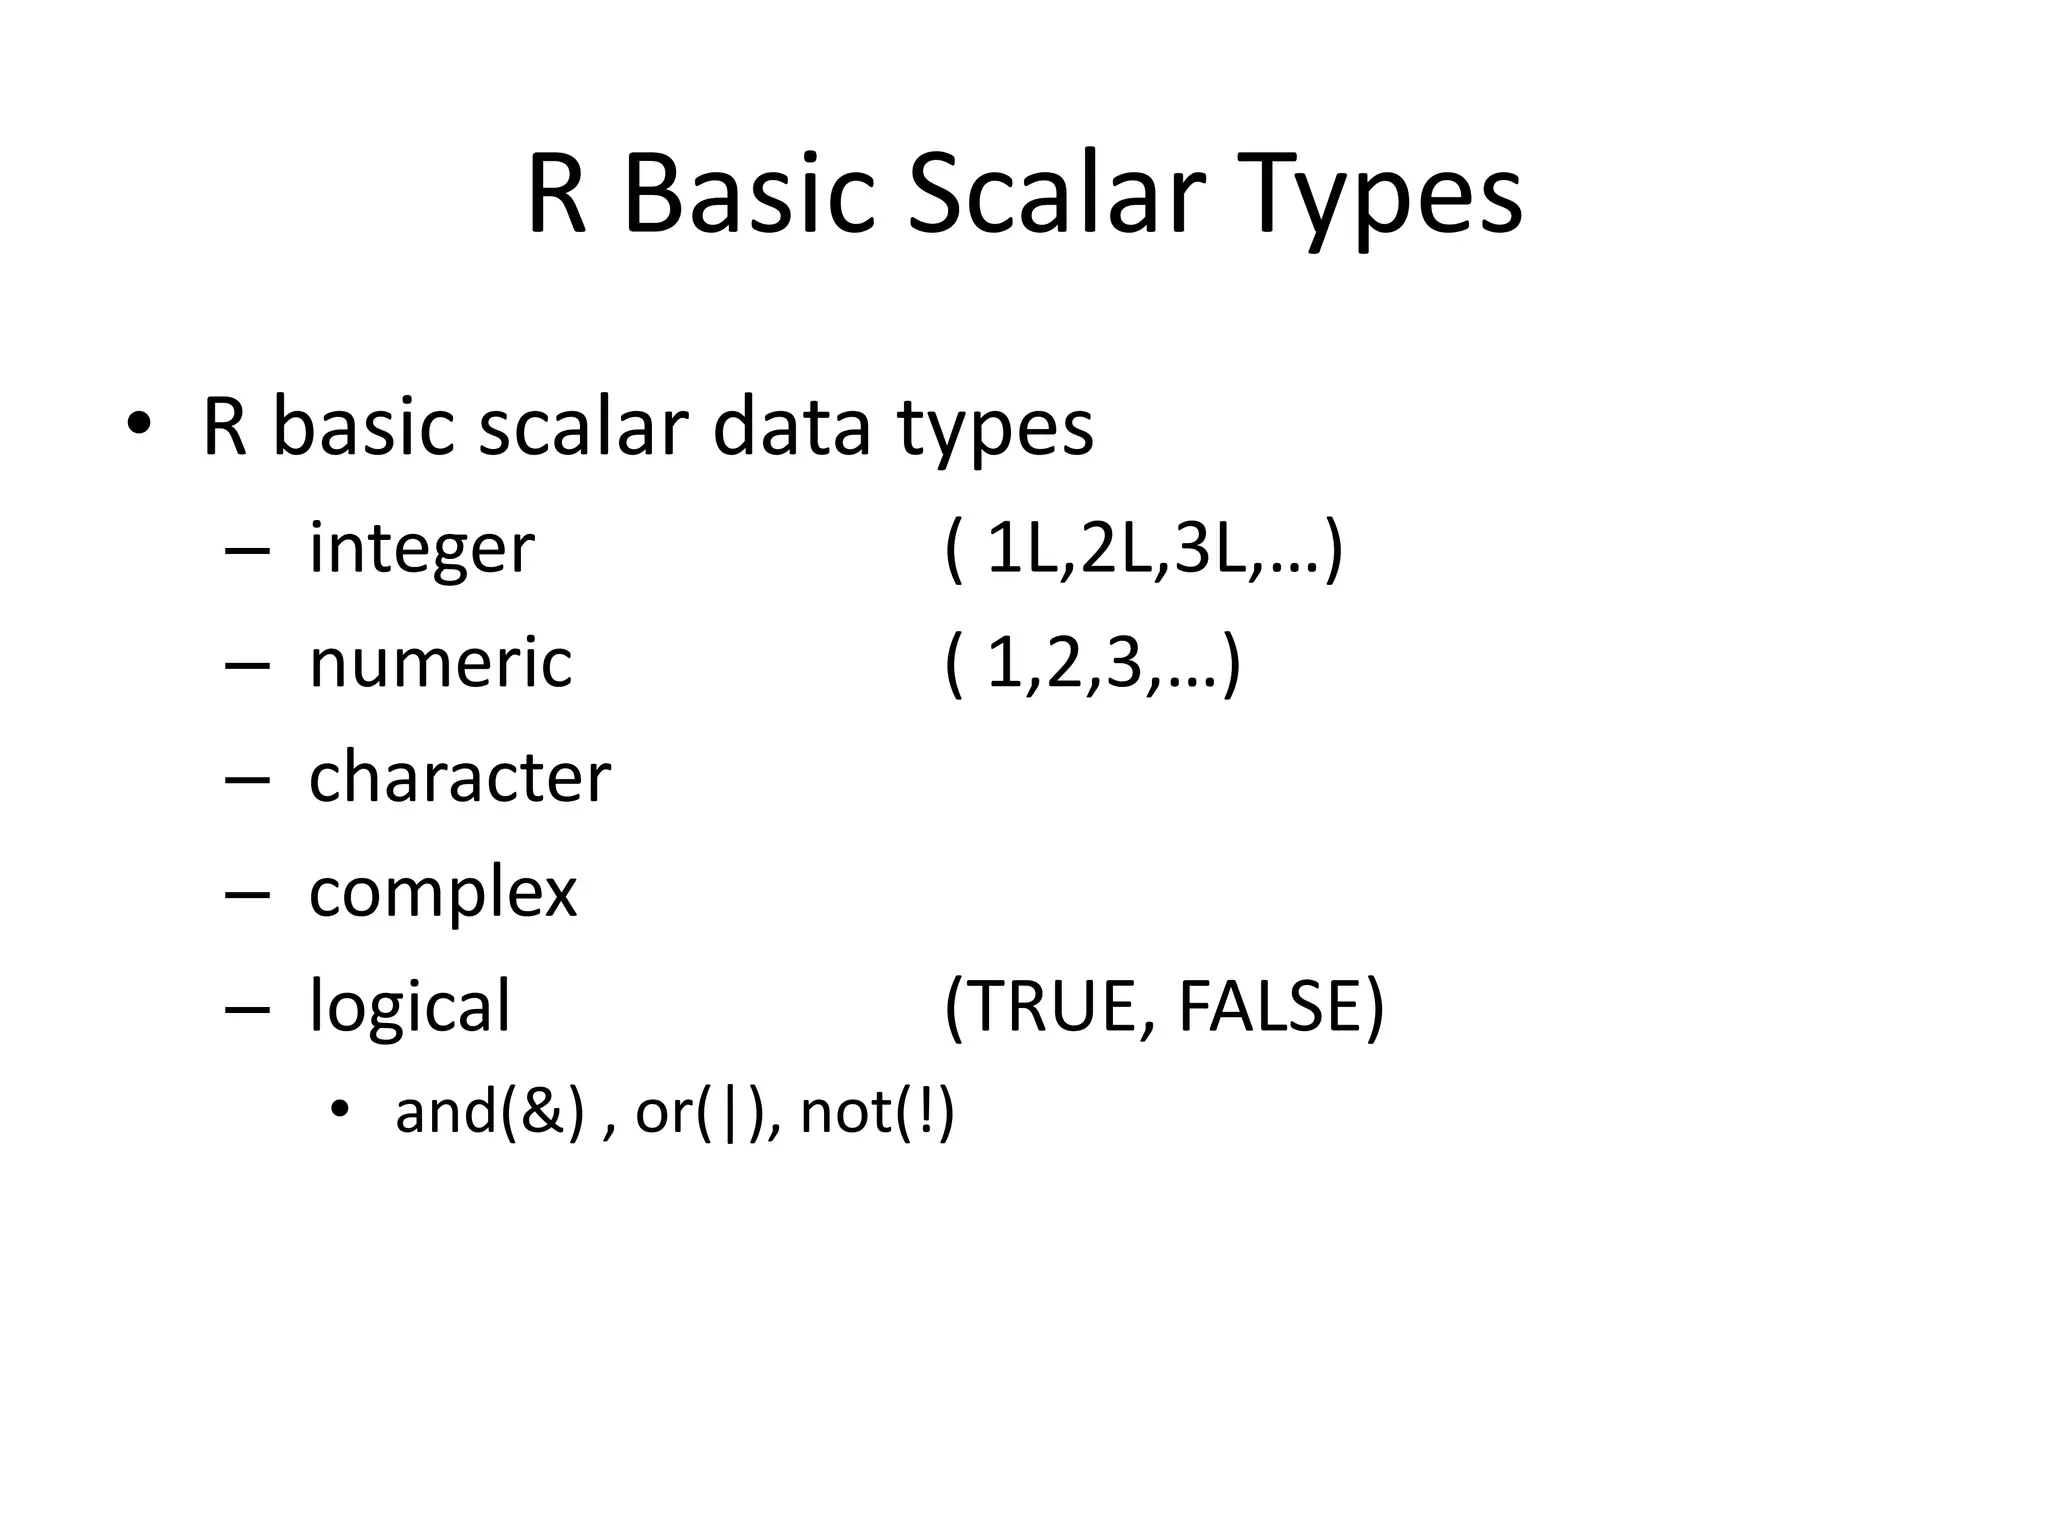
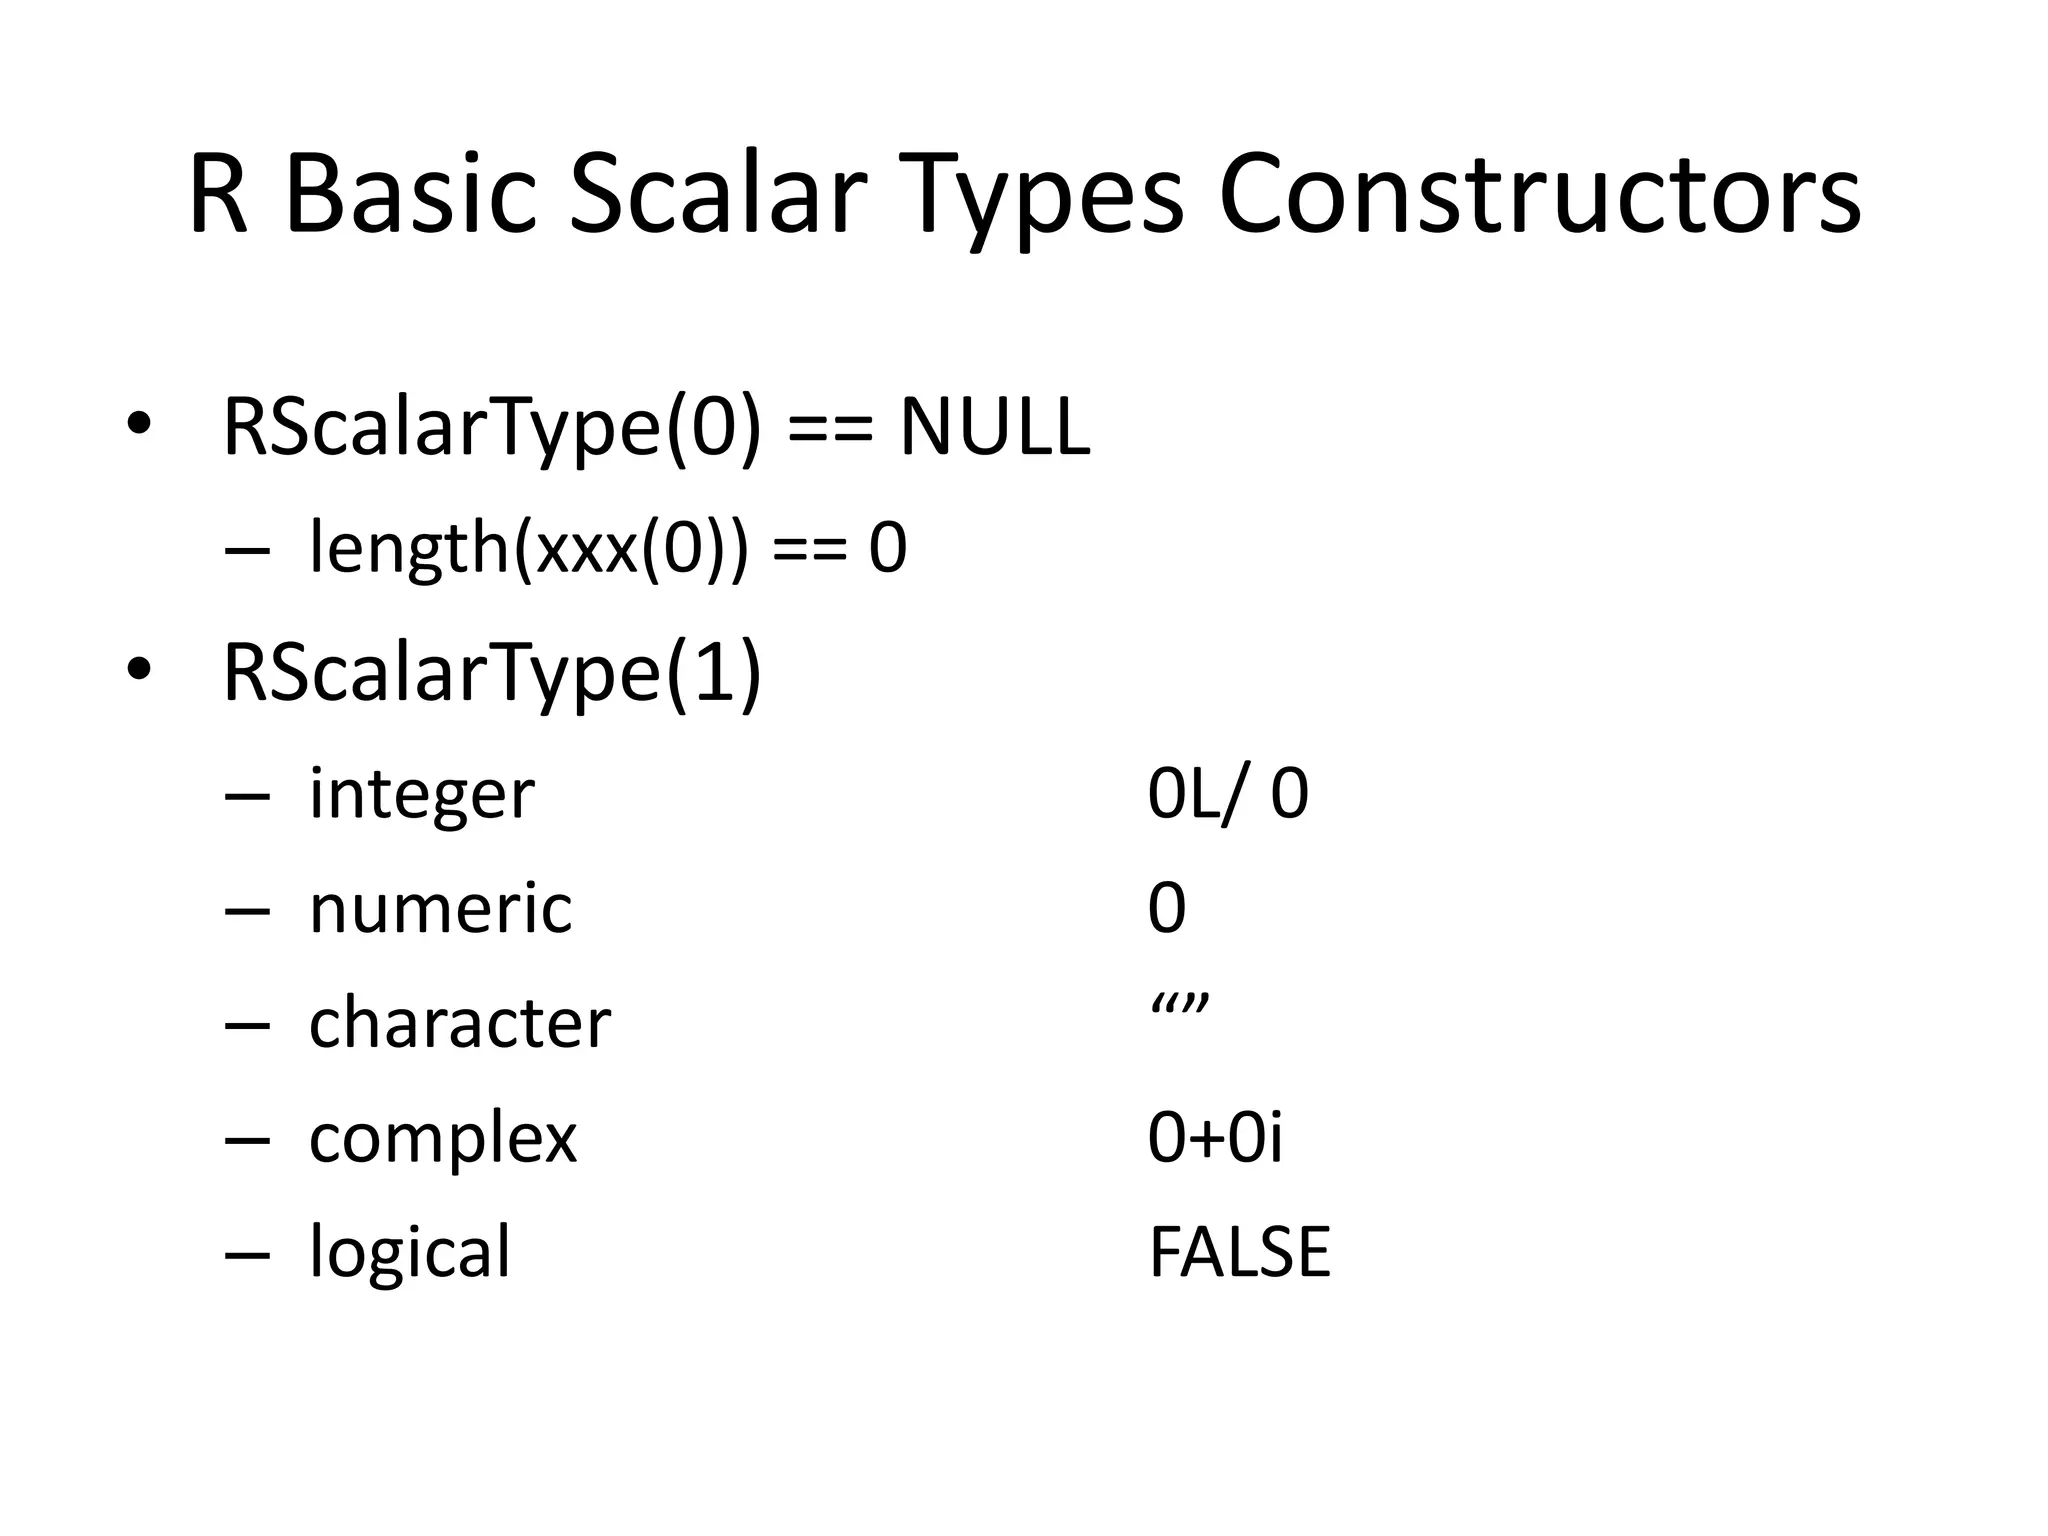
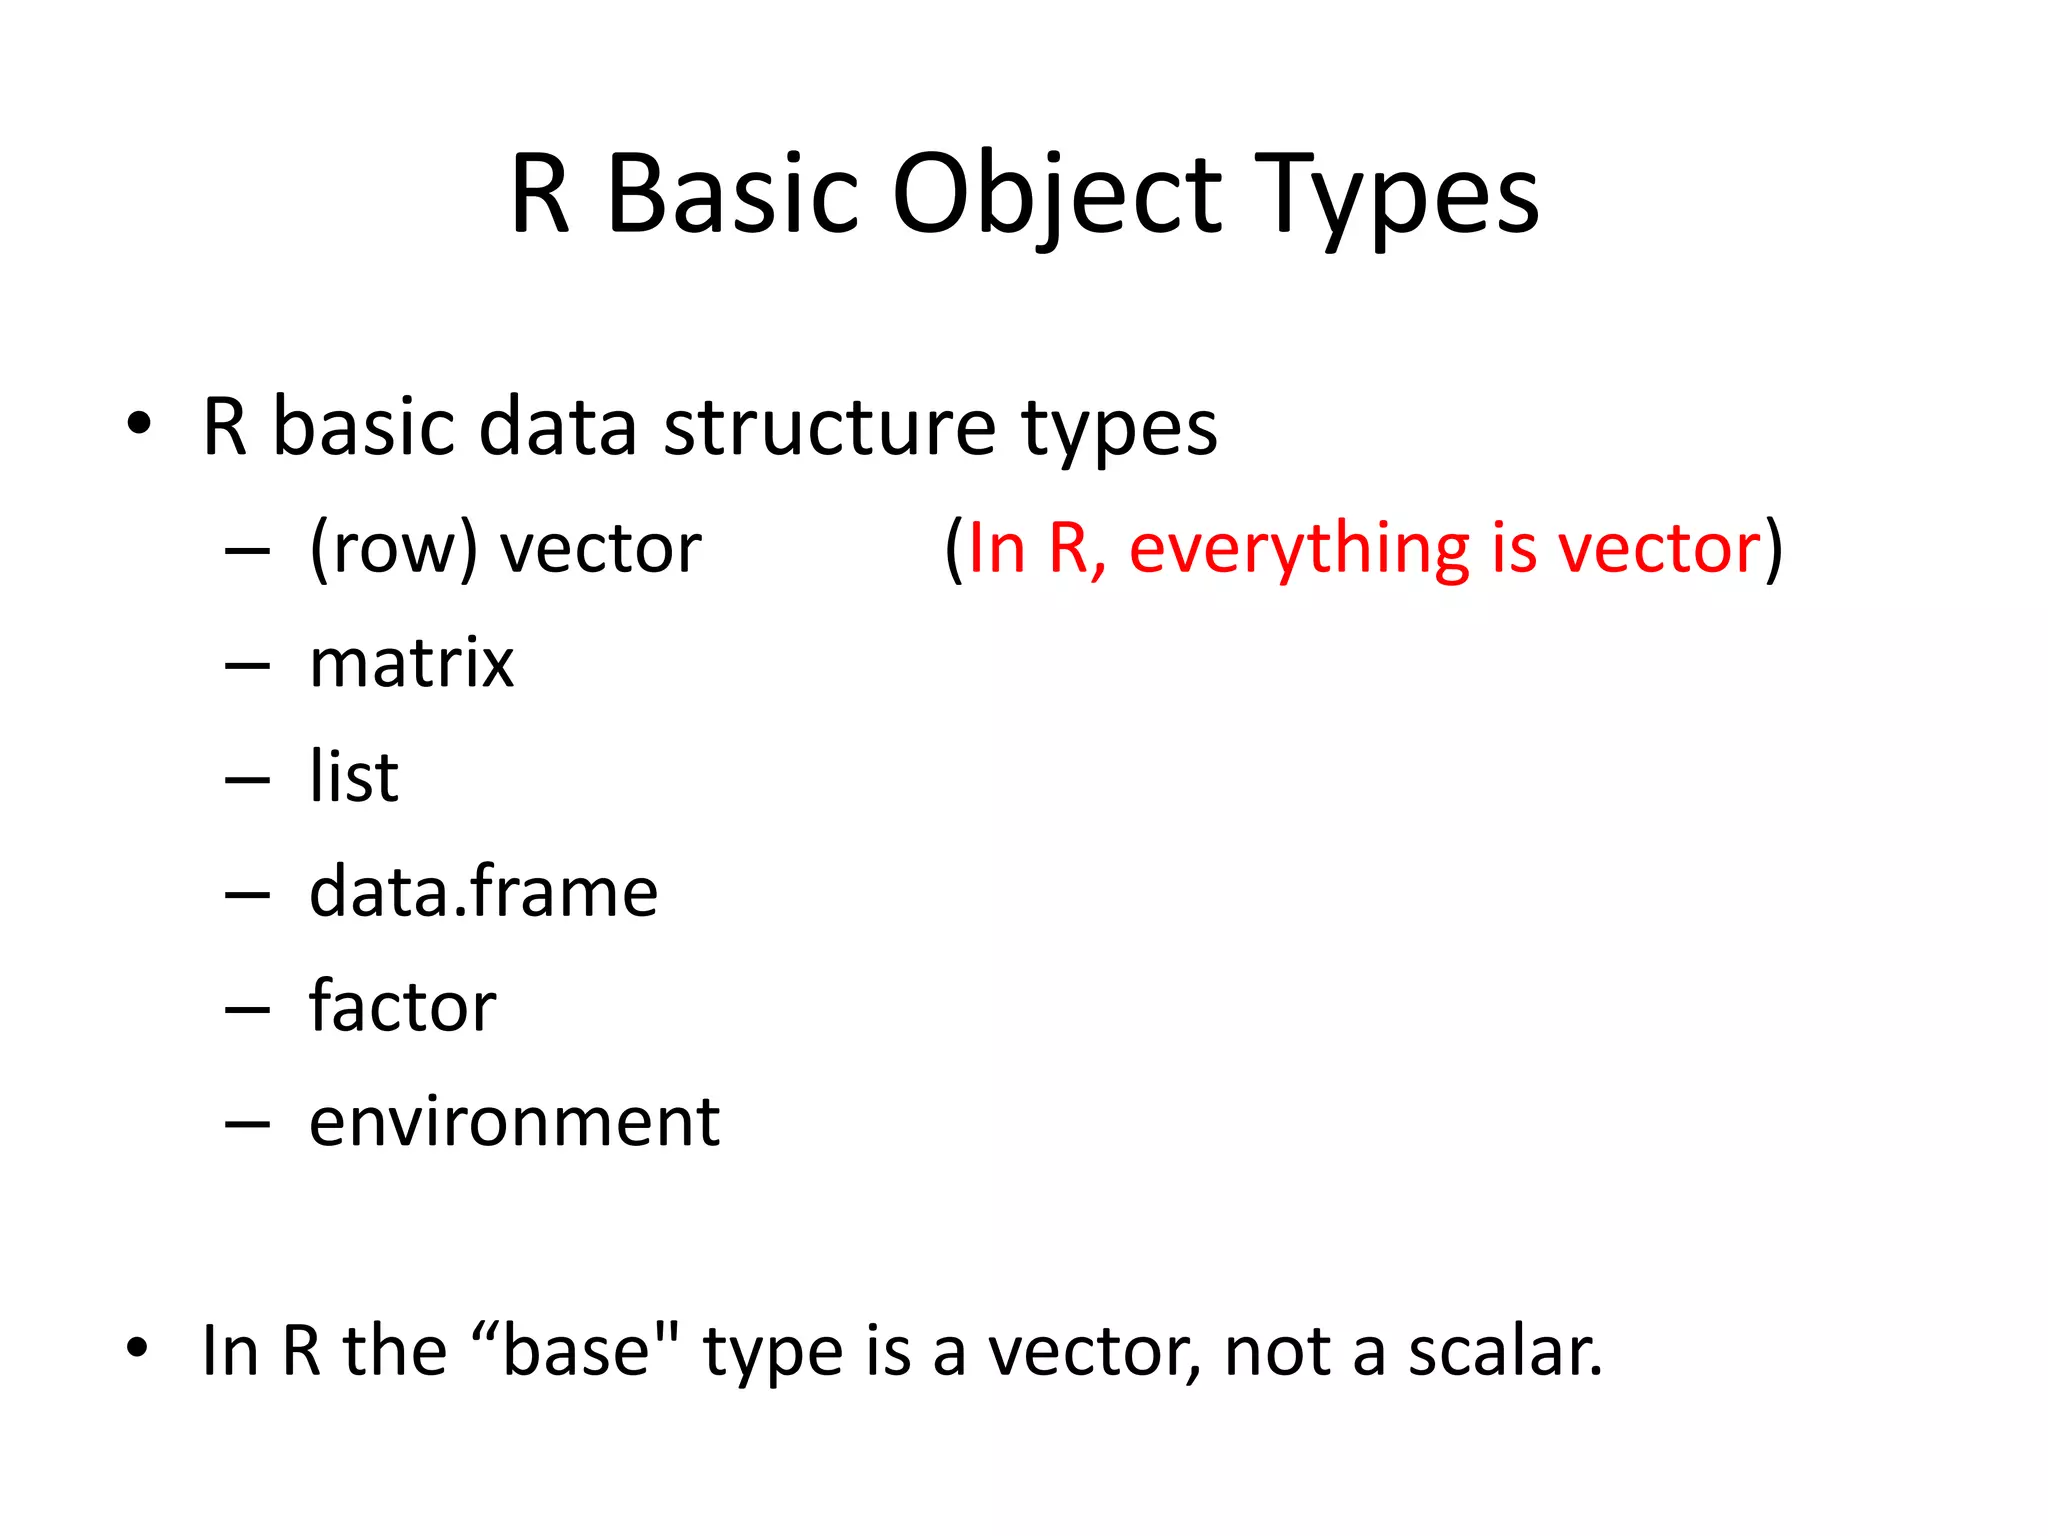
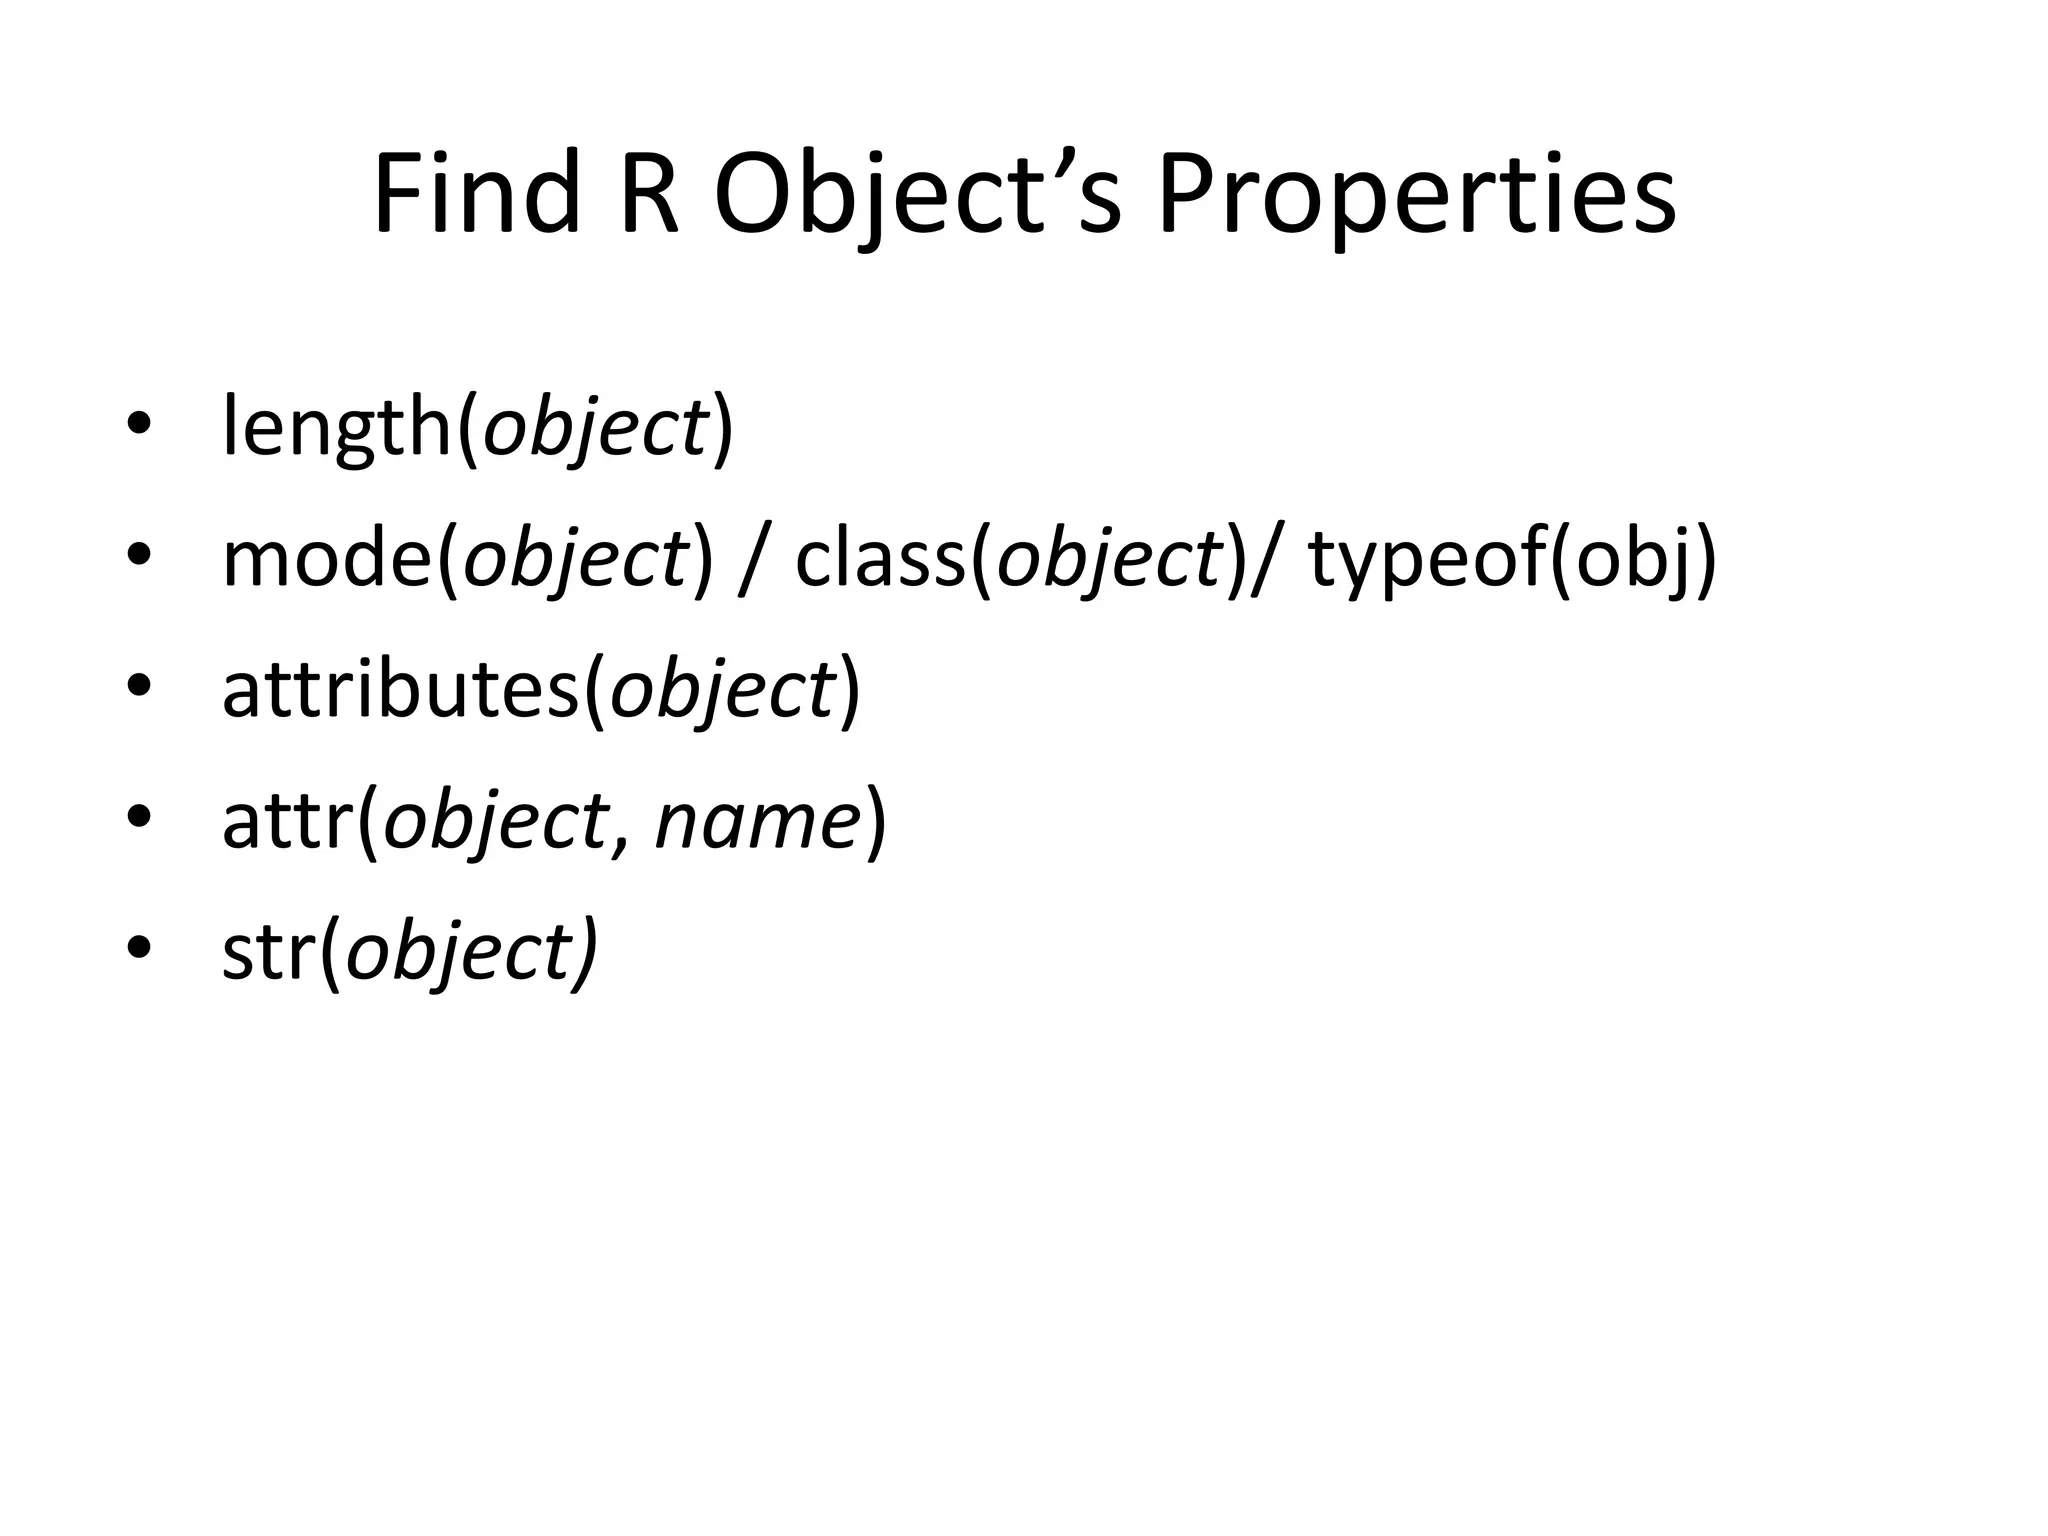
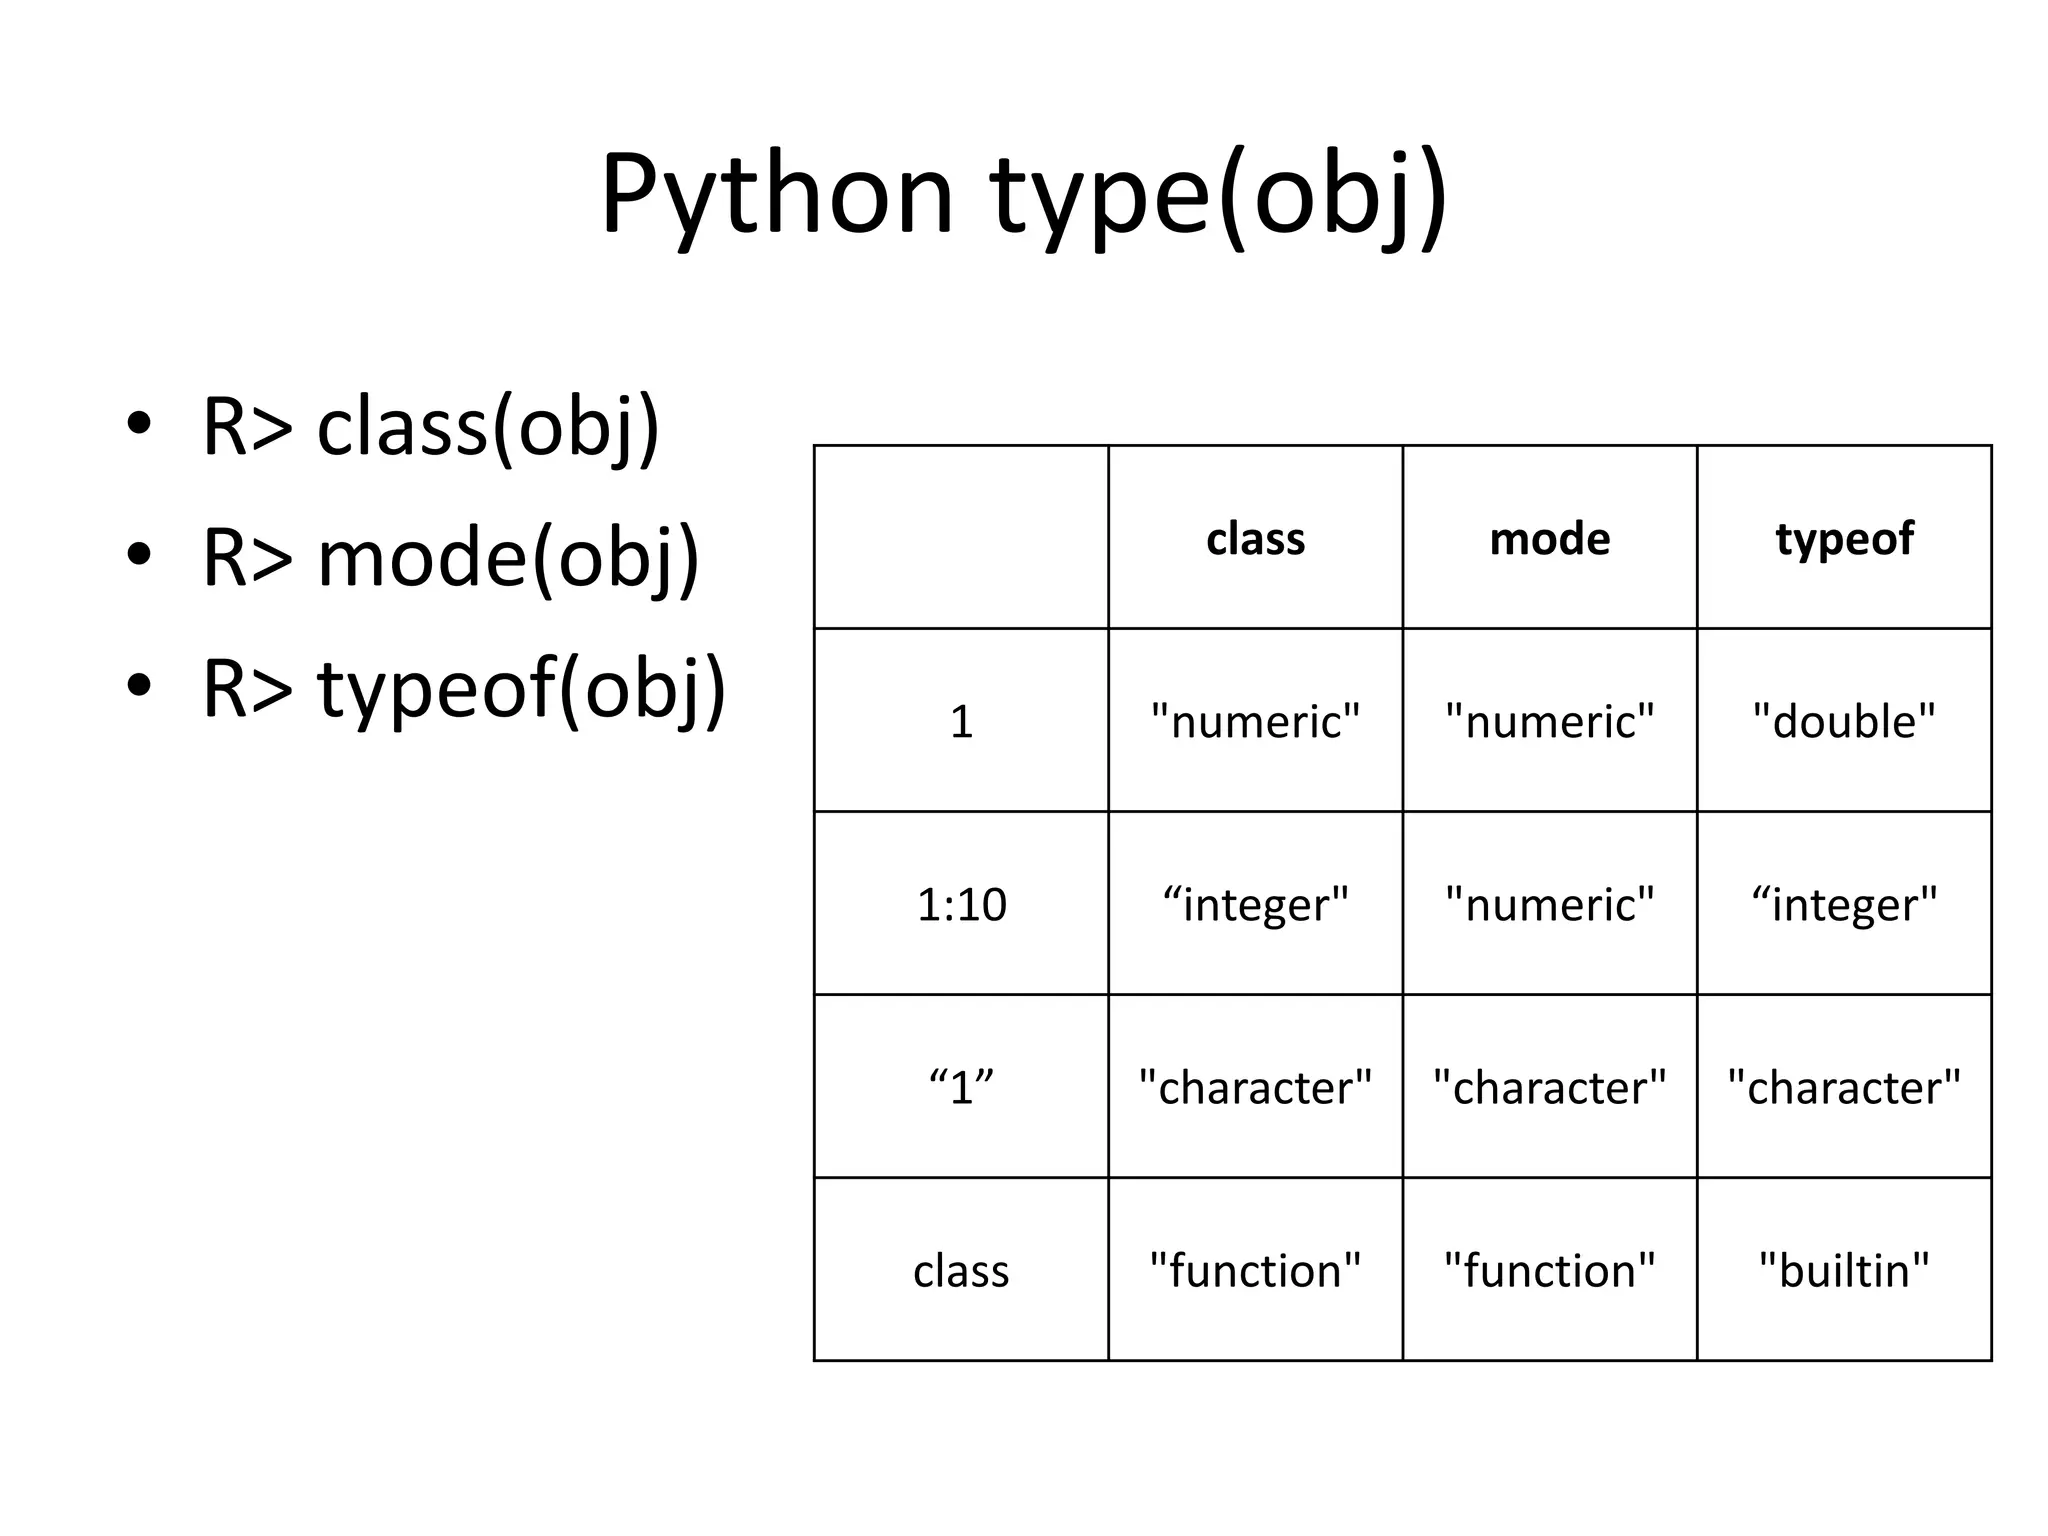
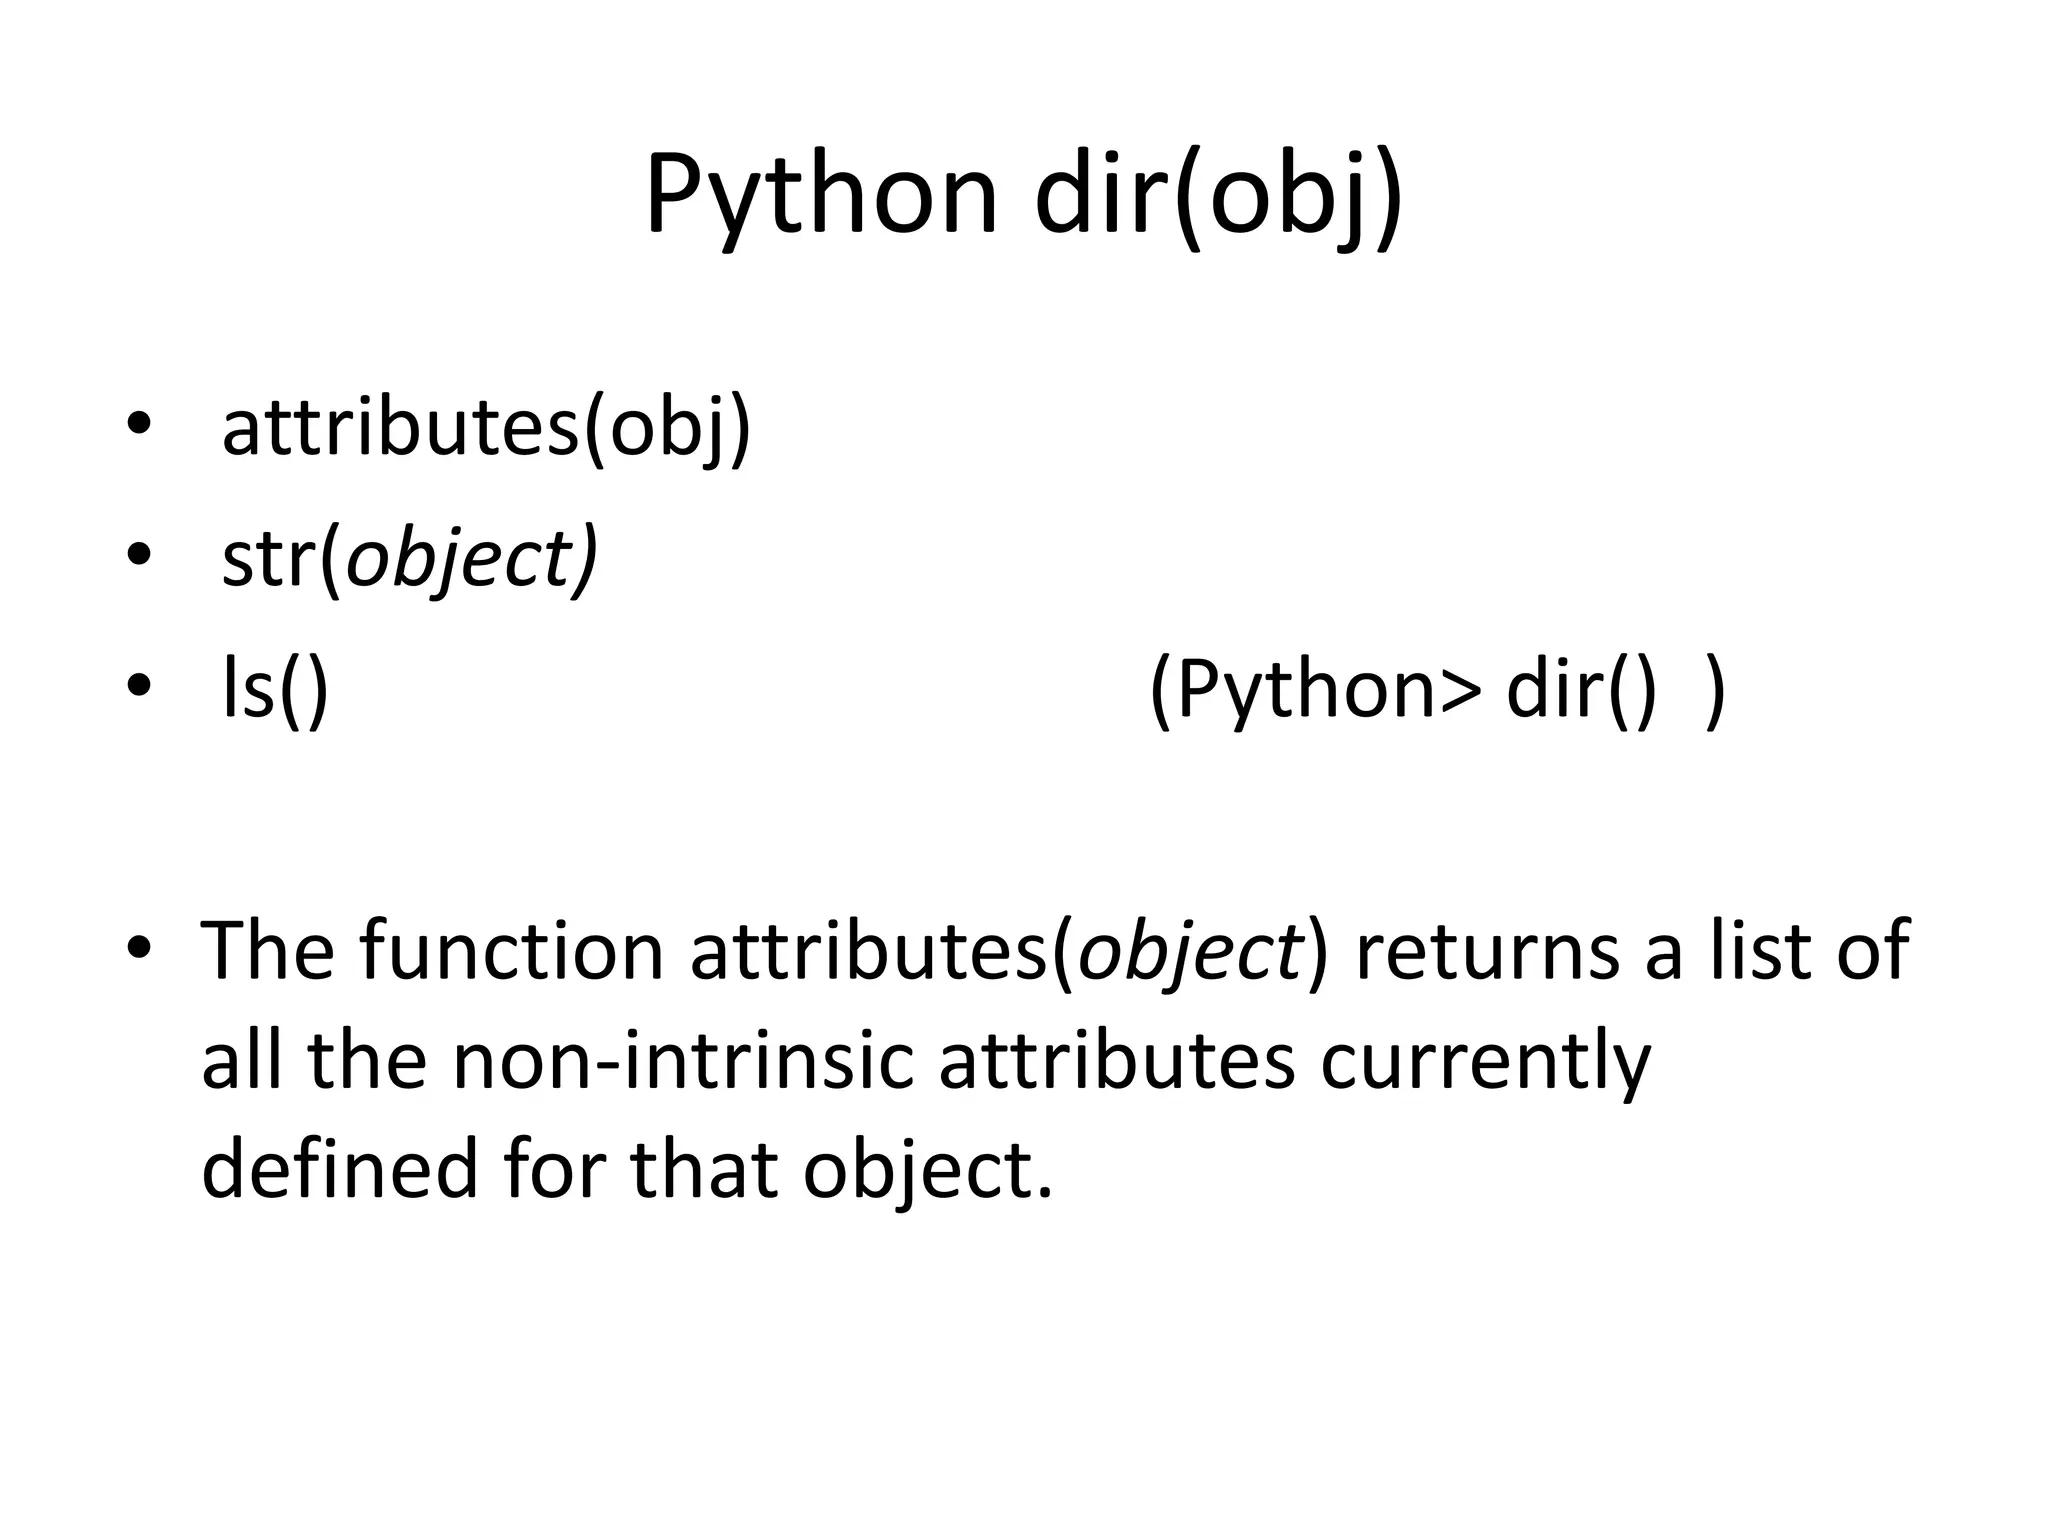
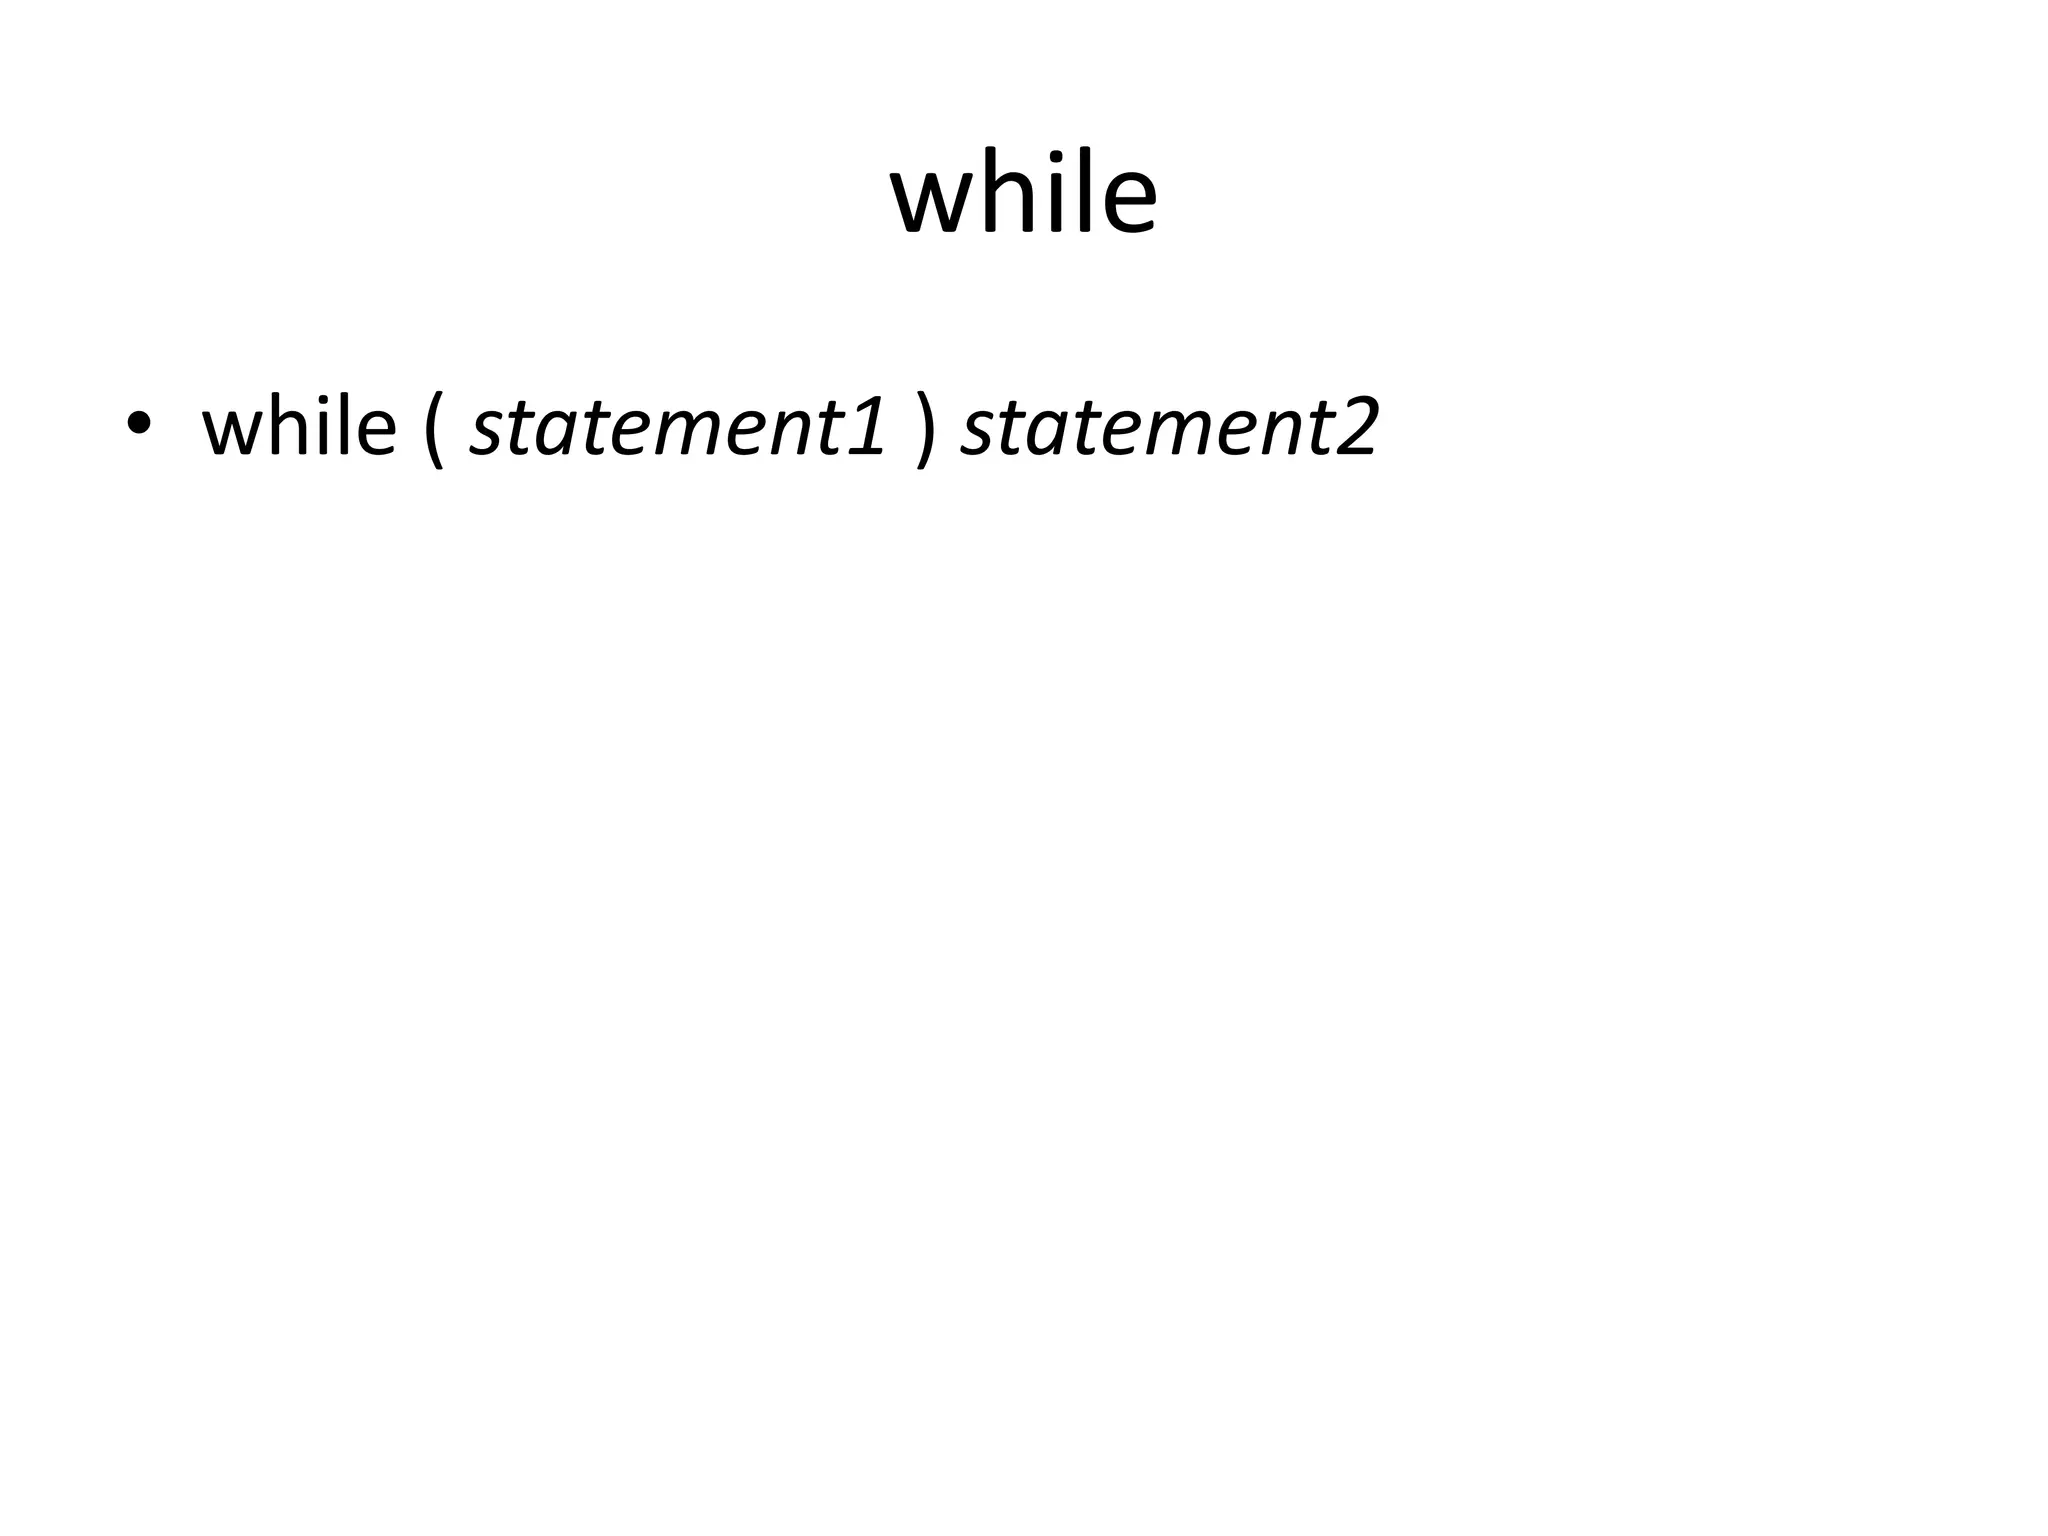
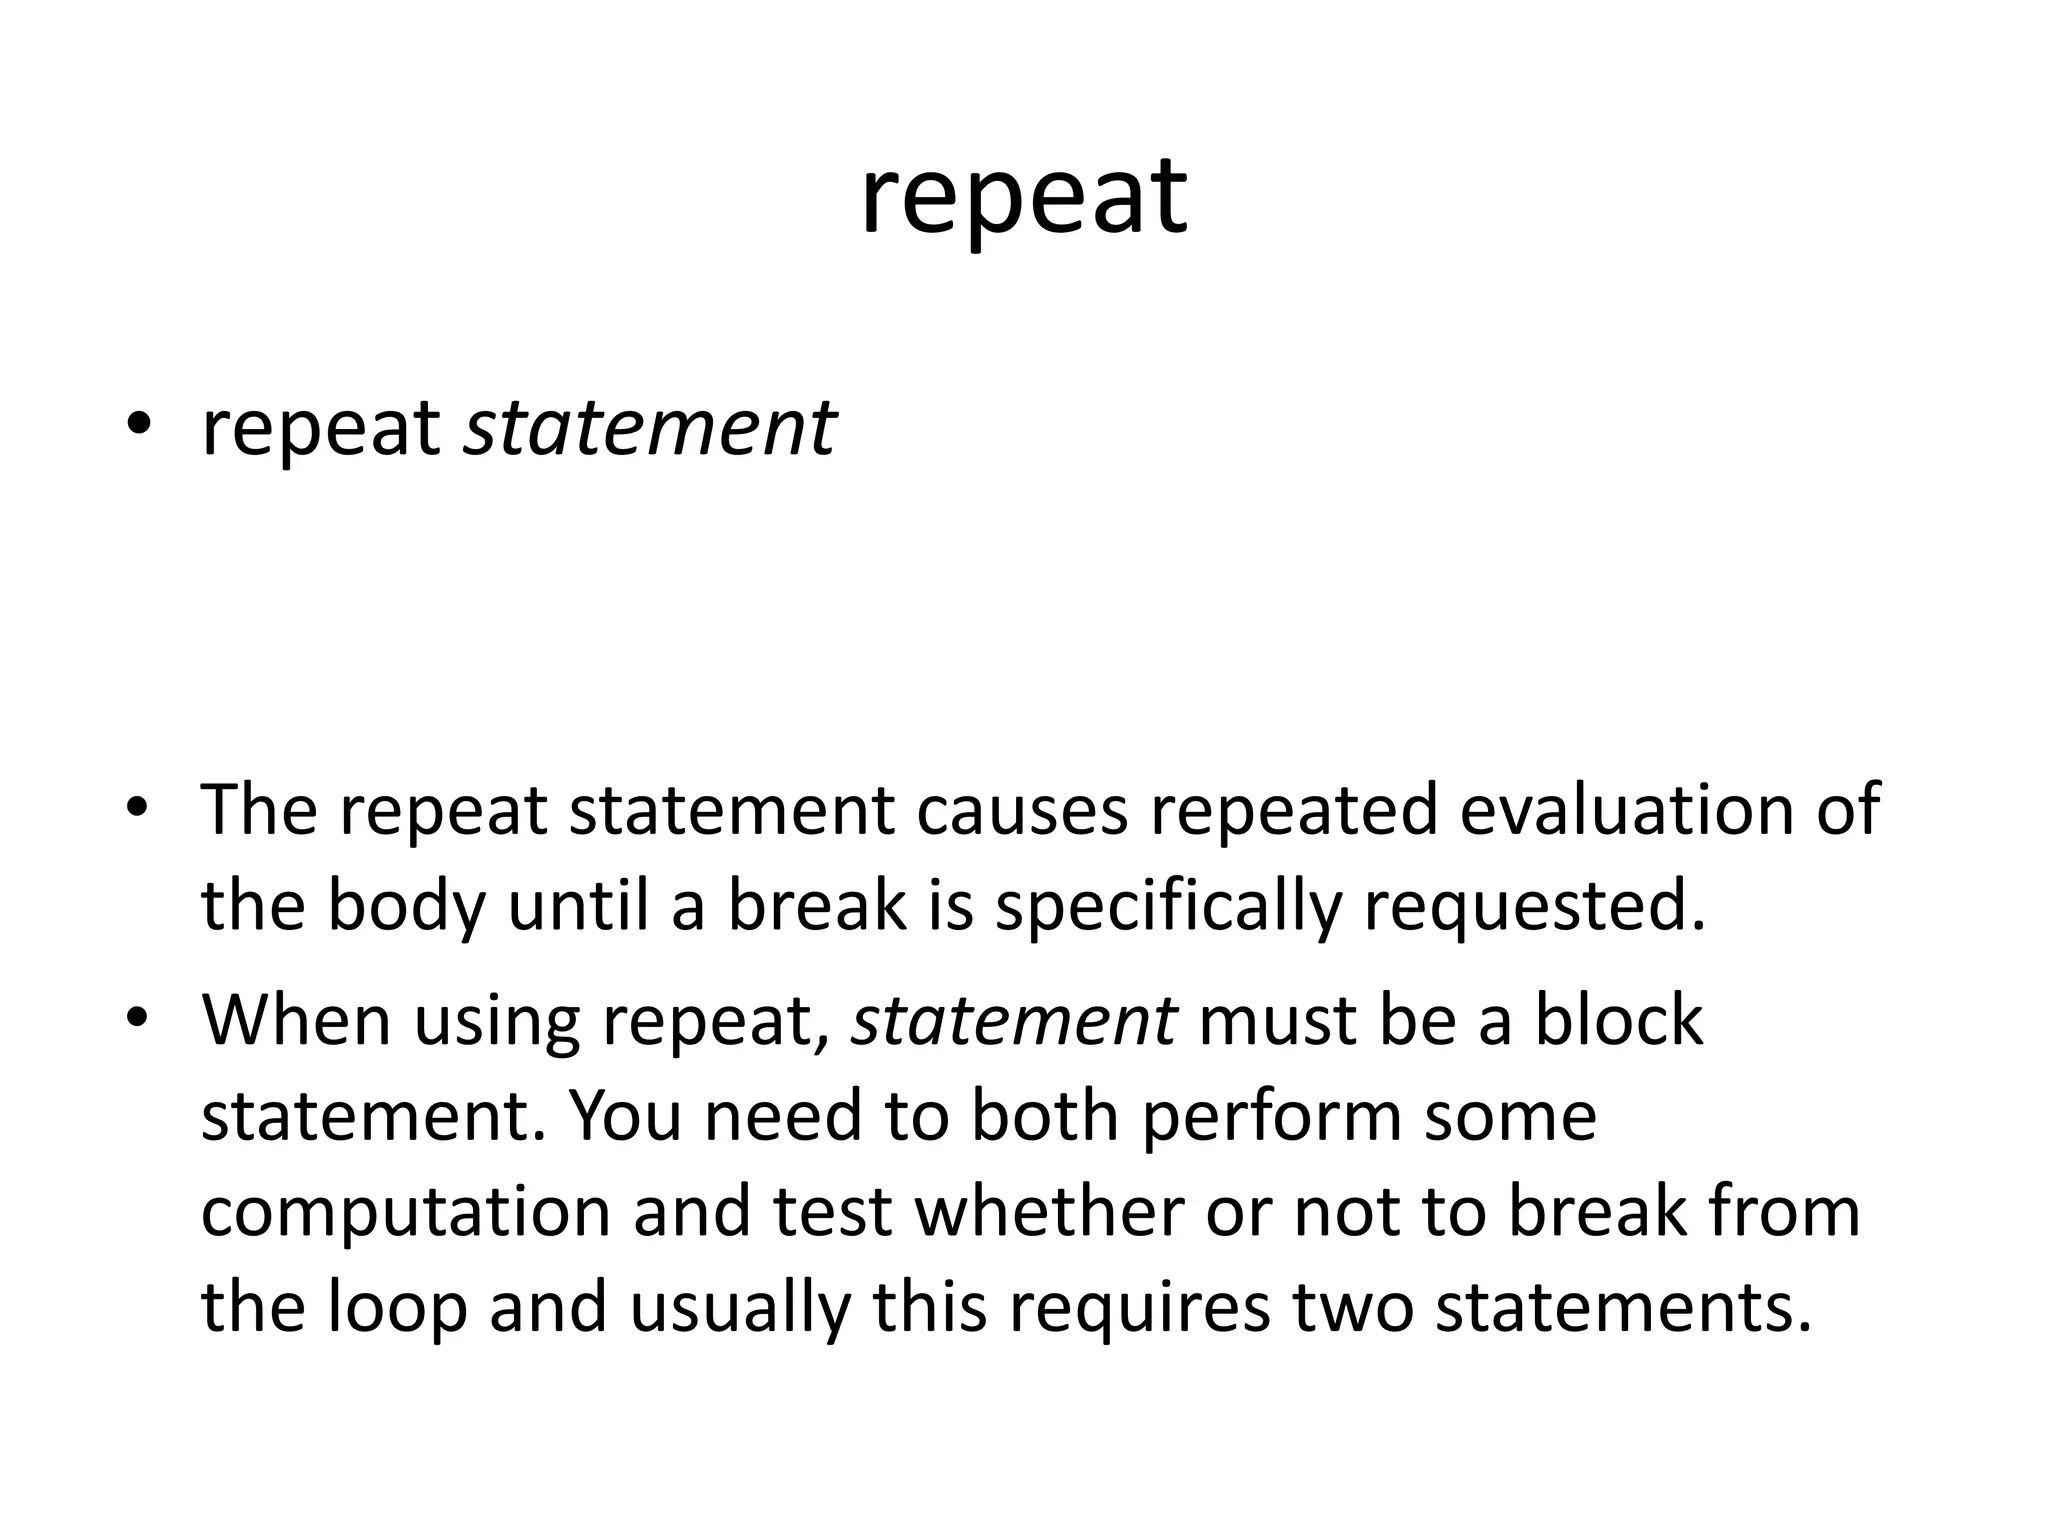
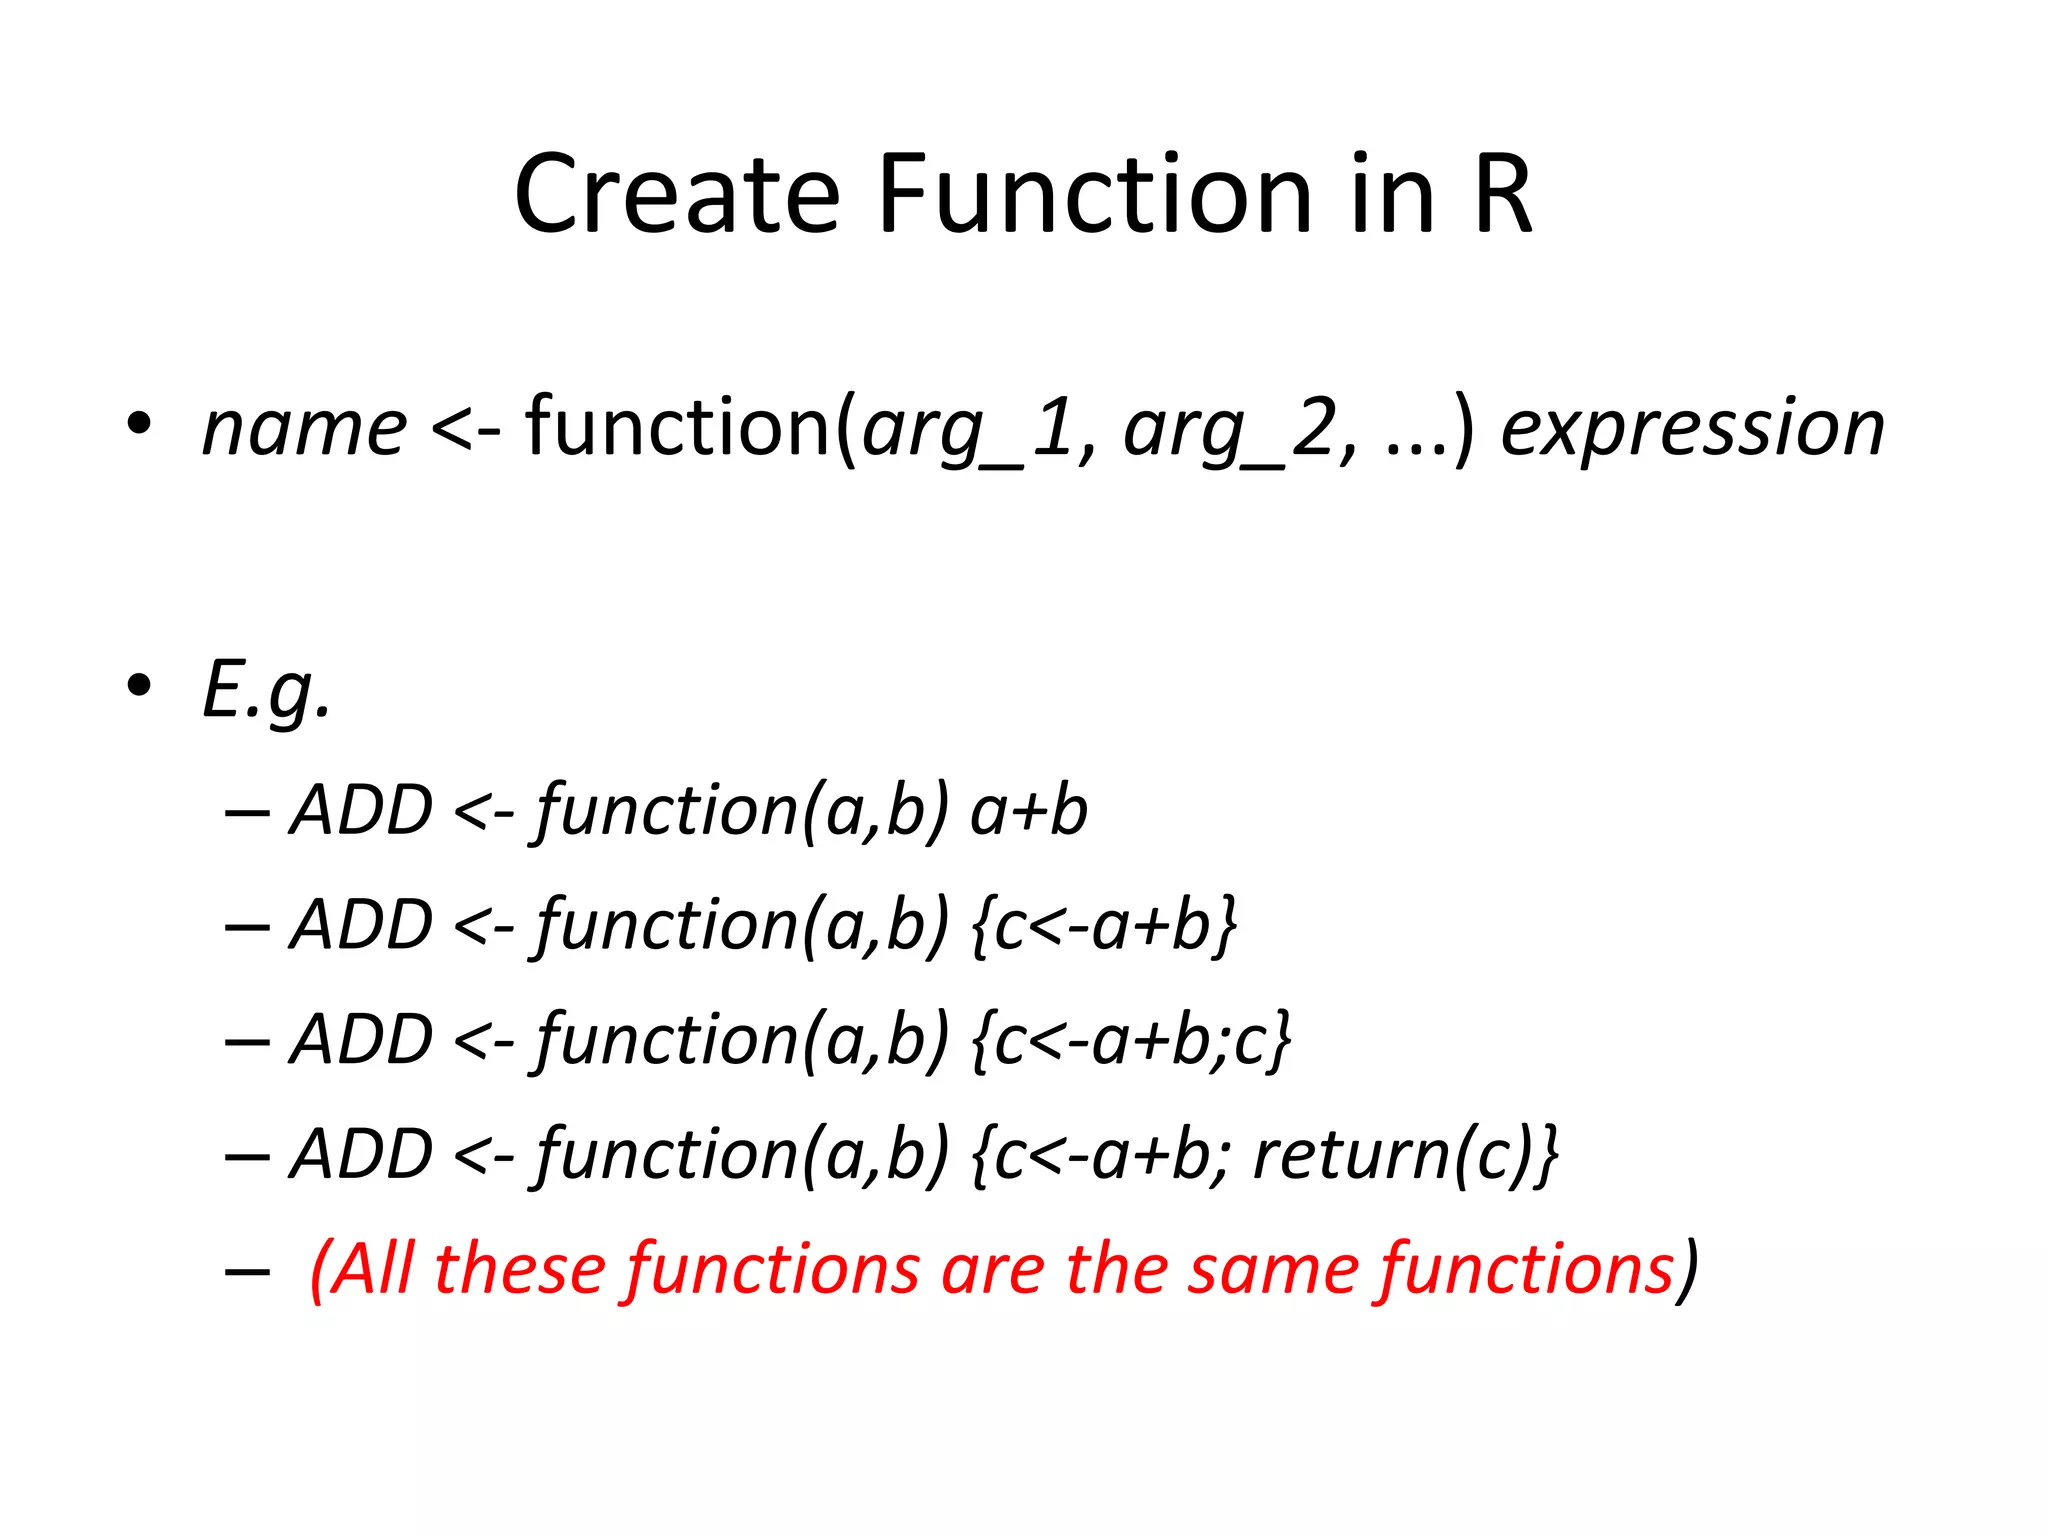
R has several basic data types including integers, numerics, characters, complexes, and logicals. Objects in R include vectors, matrices, lists, data frames, factors, and environments. Functions like length(), mode(), class(), and str() can provide properties of R objects. R supports control structures like if/else, for loops, while loops, and repeat loops. R also has rich graphics capabilities for creating plots, histograms and other visualizations using both base and lattice graphics. Common packages used with R include those for statistics, machine learning, and working with time series and financial data.