Download as PDF, PPTX


The document summarizes several industry standard benchmarks for measuring database and application server performance including SPECjAppServer2004, EAStress2004, TPC-E, and TPC-H. It discusses PostgreSQL's performance on these benchmarks and key configuration parameters used. There is room for improvement in PostgreSQL's performance on TPC-E, while SPECjAppServer2004 and EAStress2004 show good performance. TPC-H performance requires further optimization of indexes and query plans.
Overview of PostgreSQL benchmarks by Jignesh Shah, his experience, and his role in improving Open Source software on Solaris.
Introduction to benchmarks such as SPECjAppServer2004, EAStress2004, TPC-E, and TPC-H.
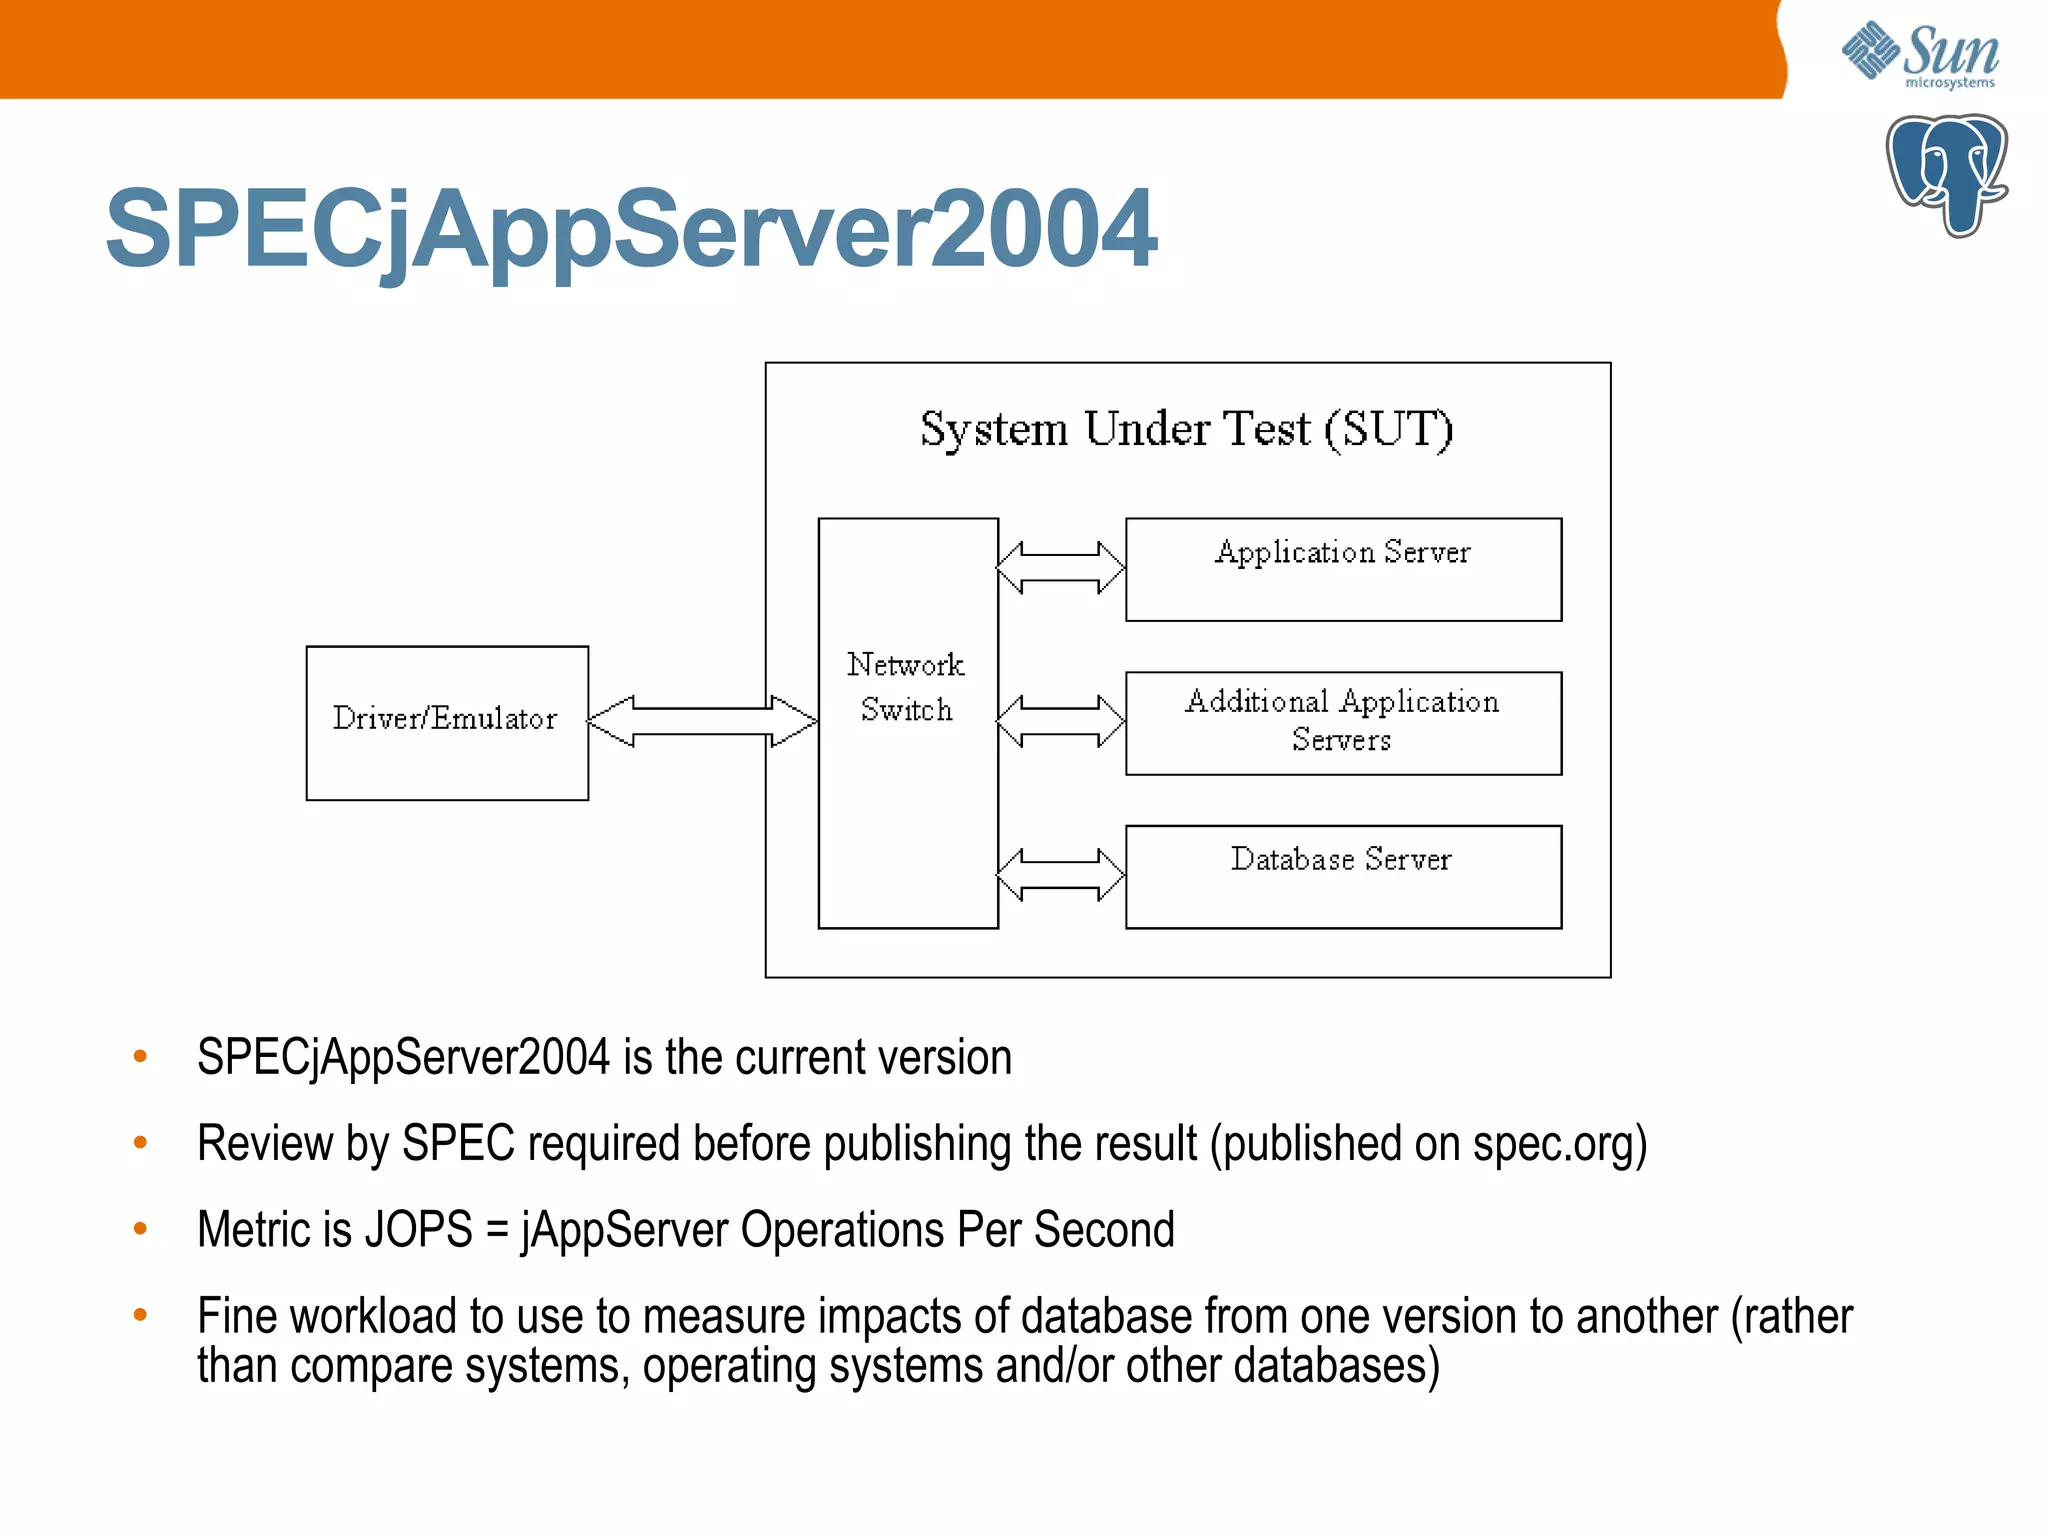
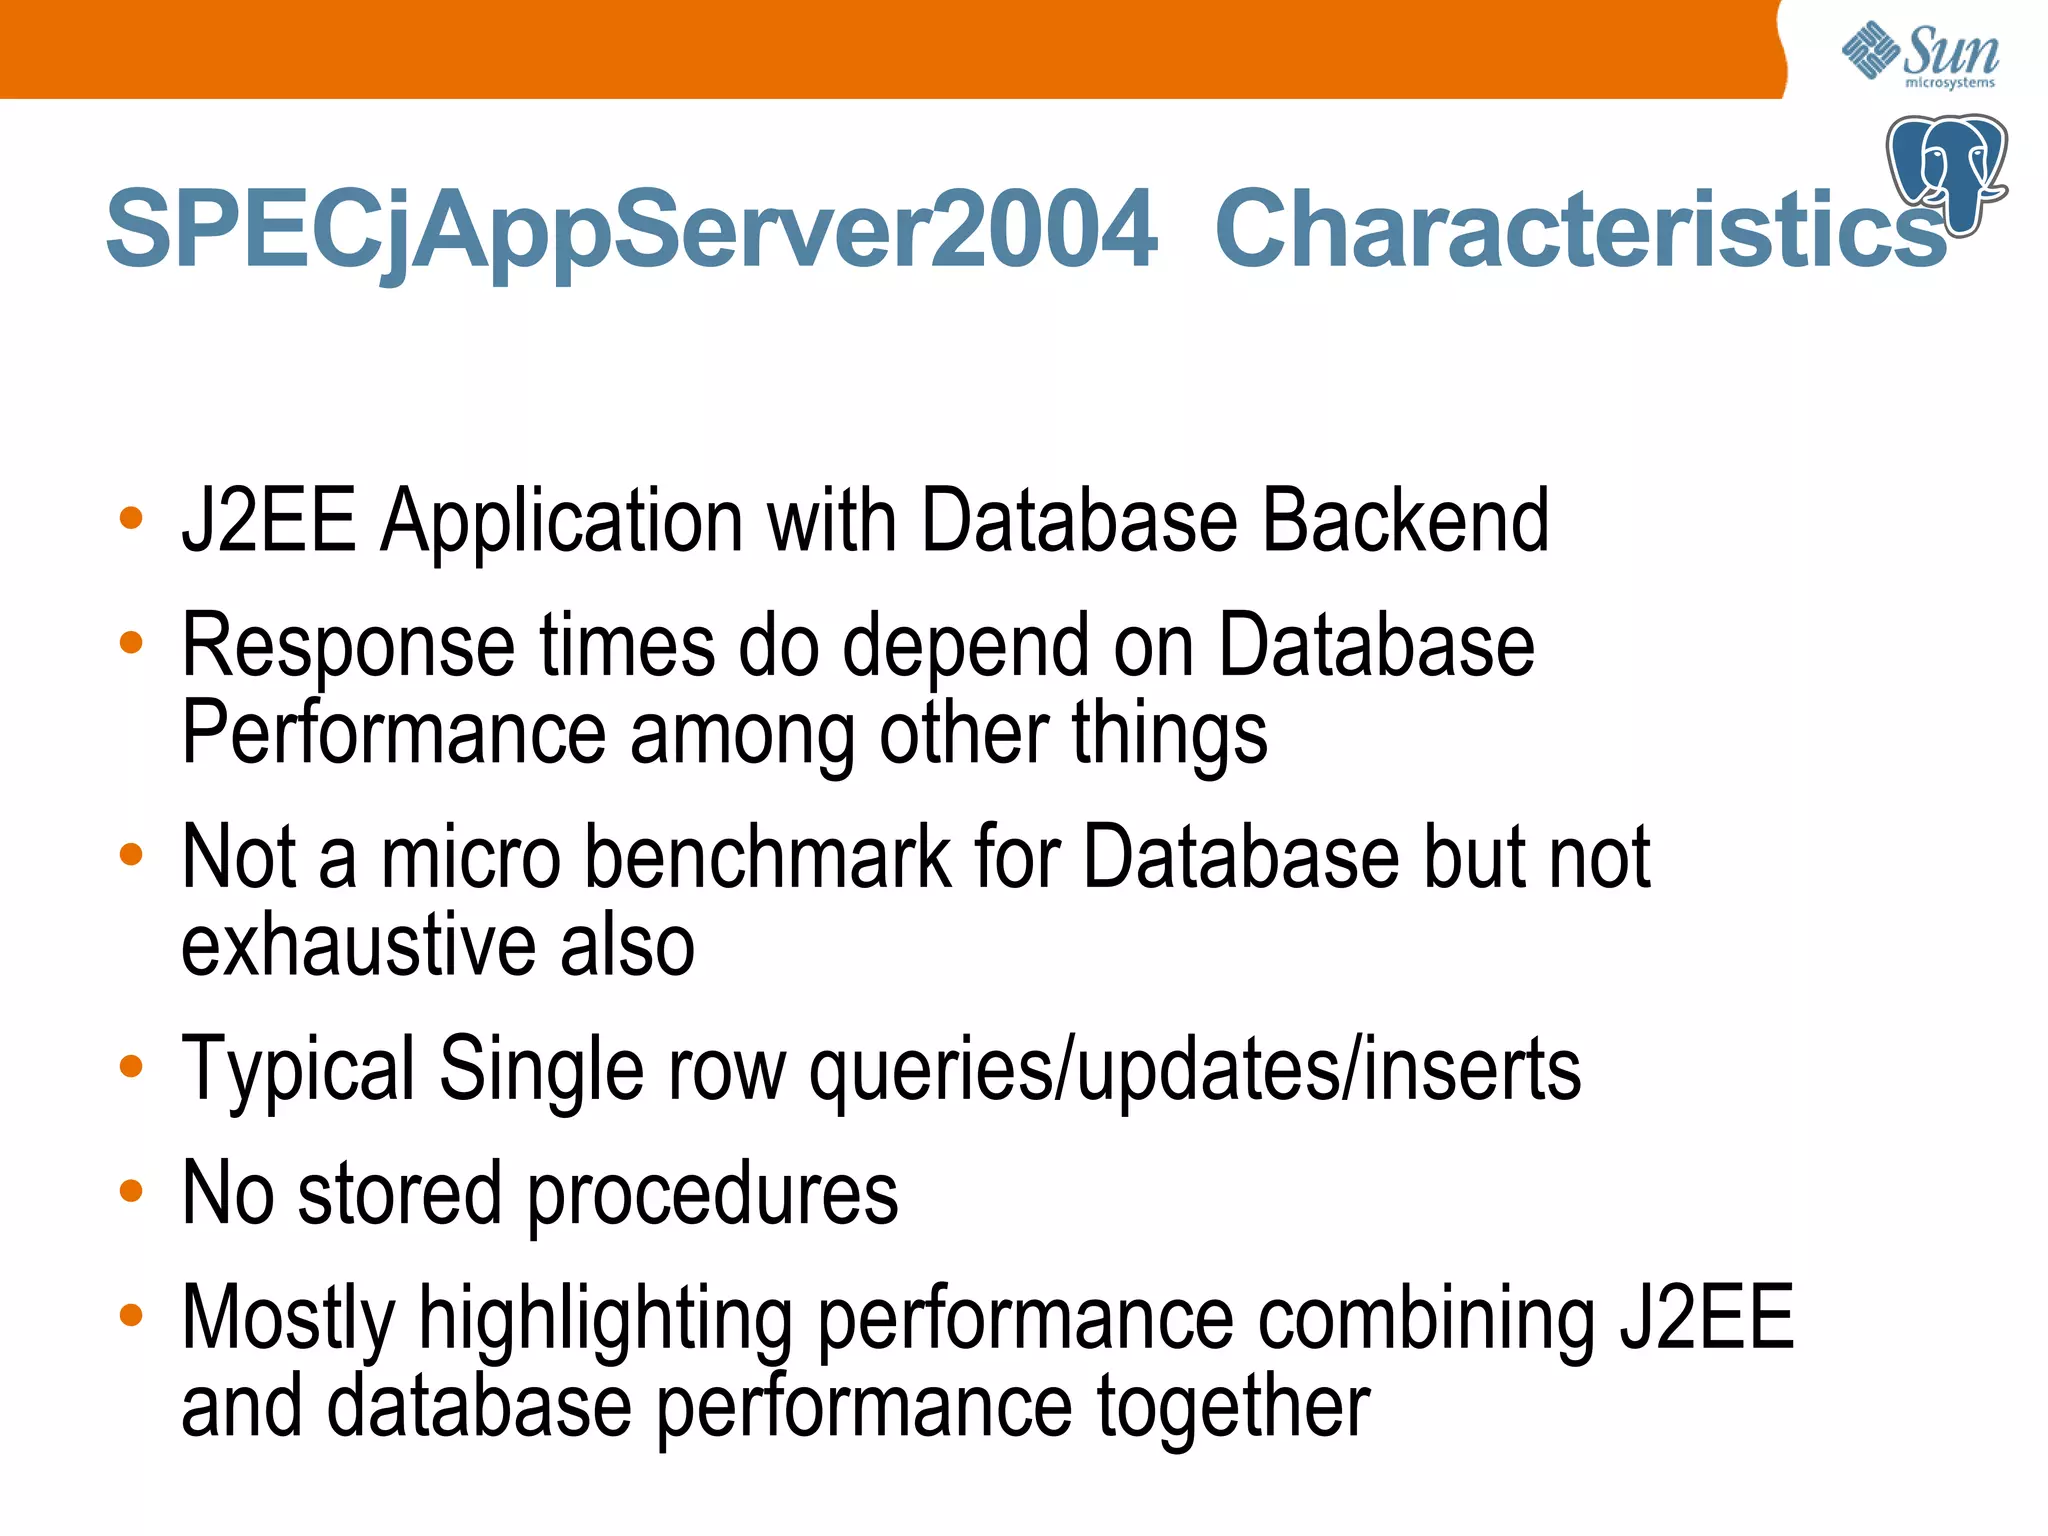
Details about SPECjAppServer2004 including its purpose, metrics (JOPS), and characteristics like typical workloads.
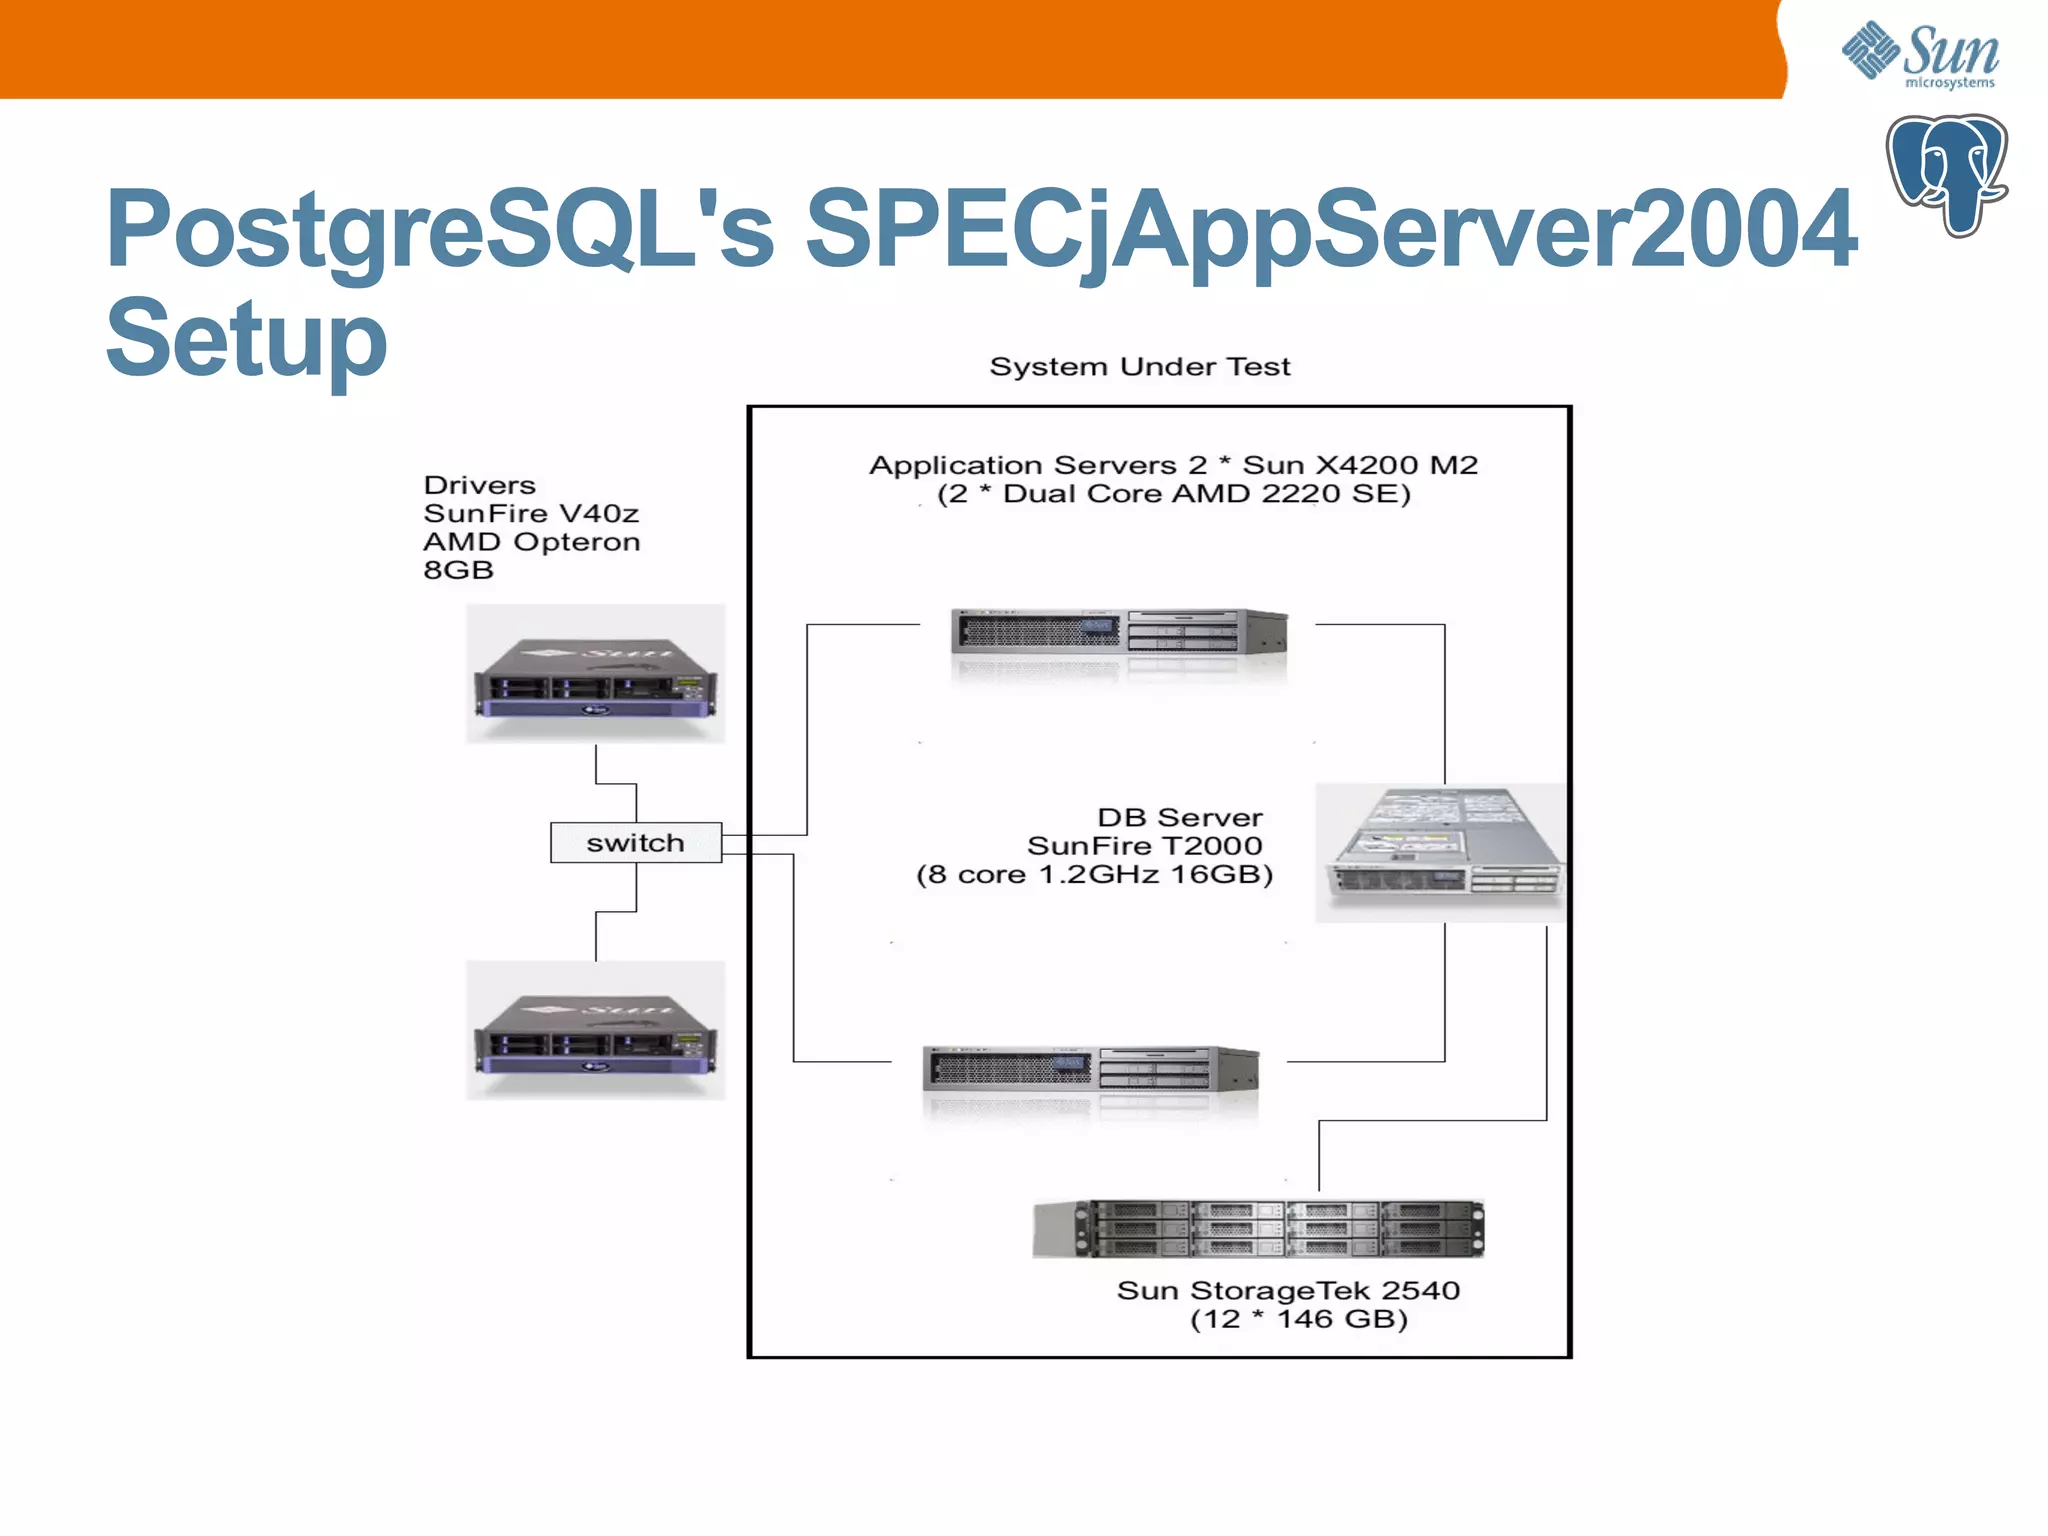
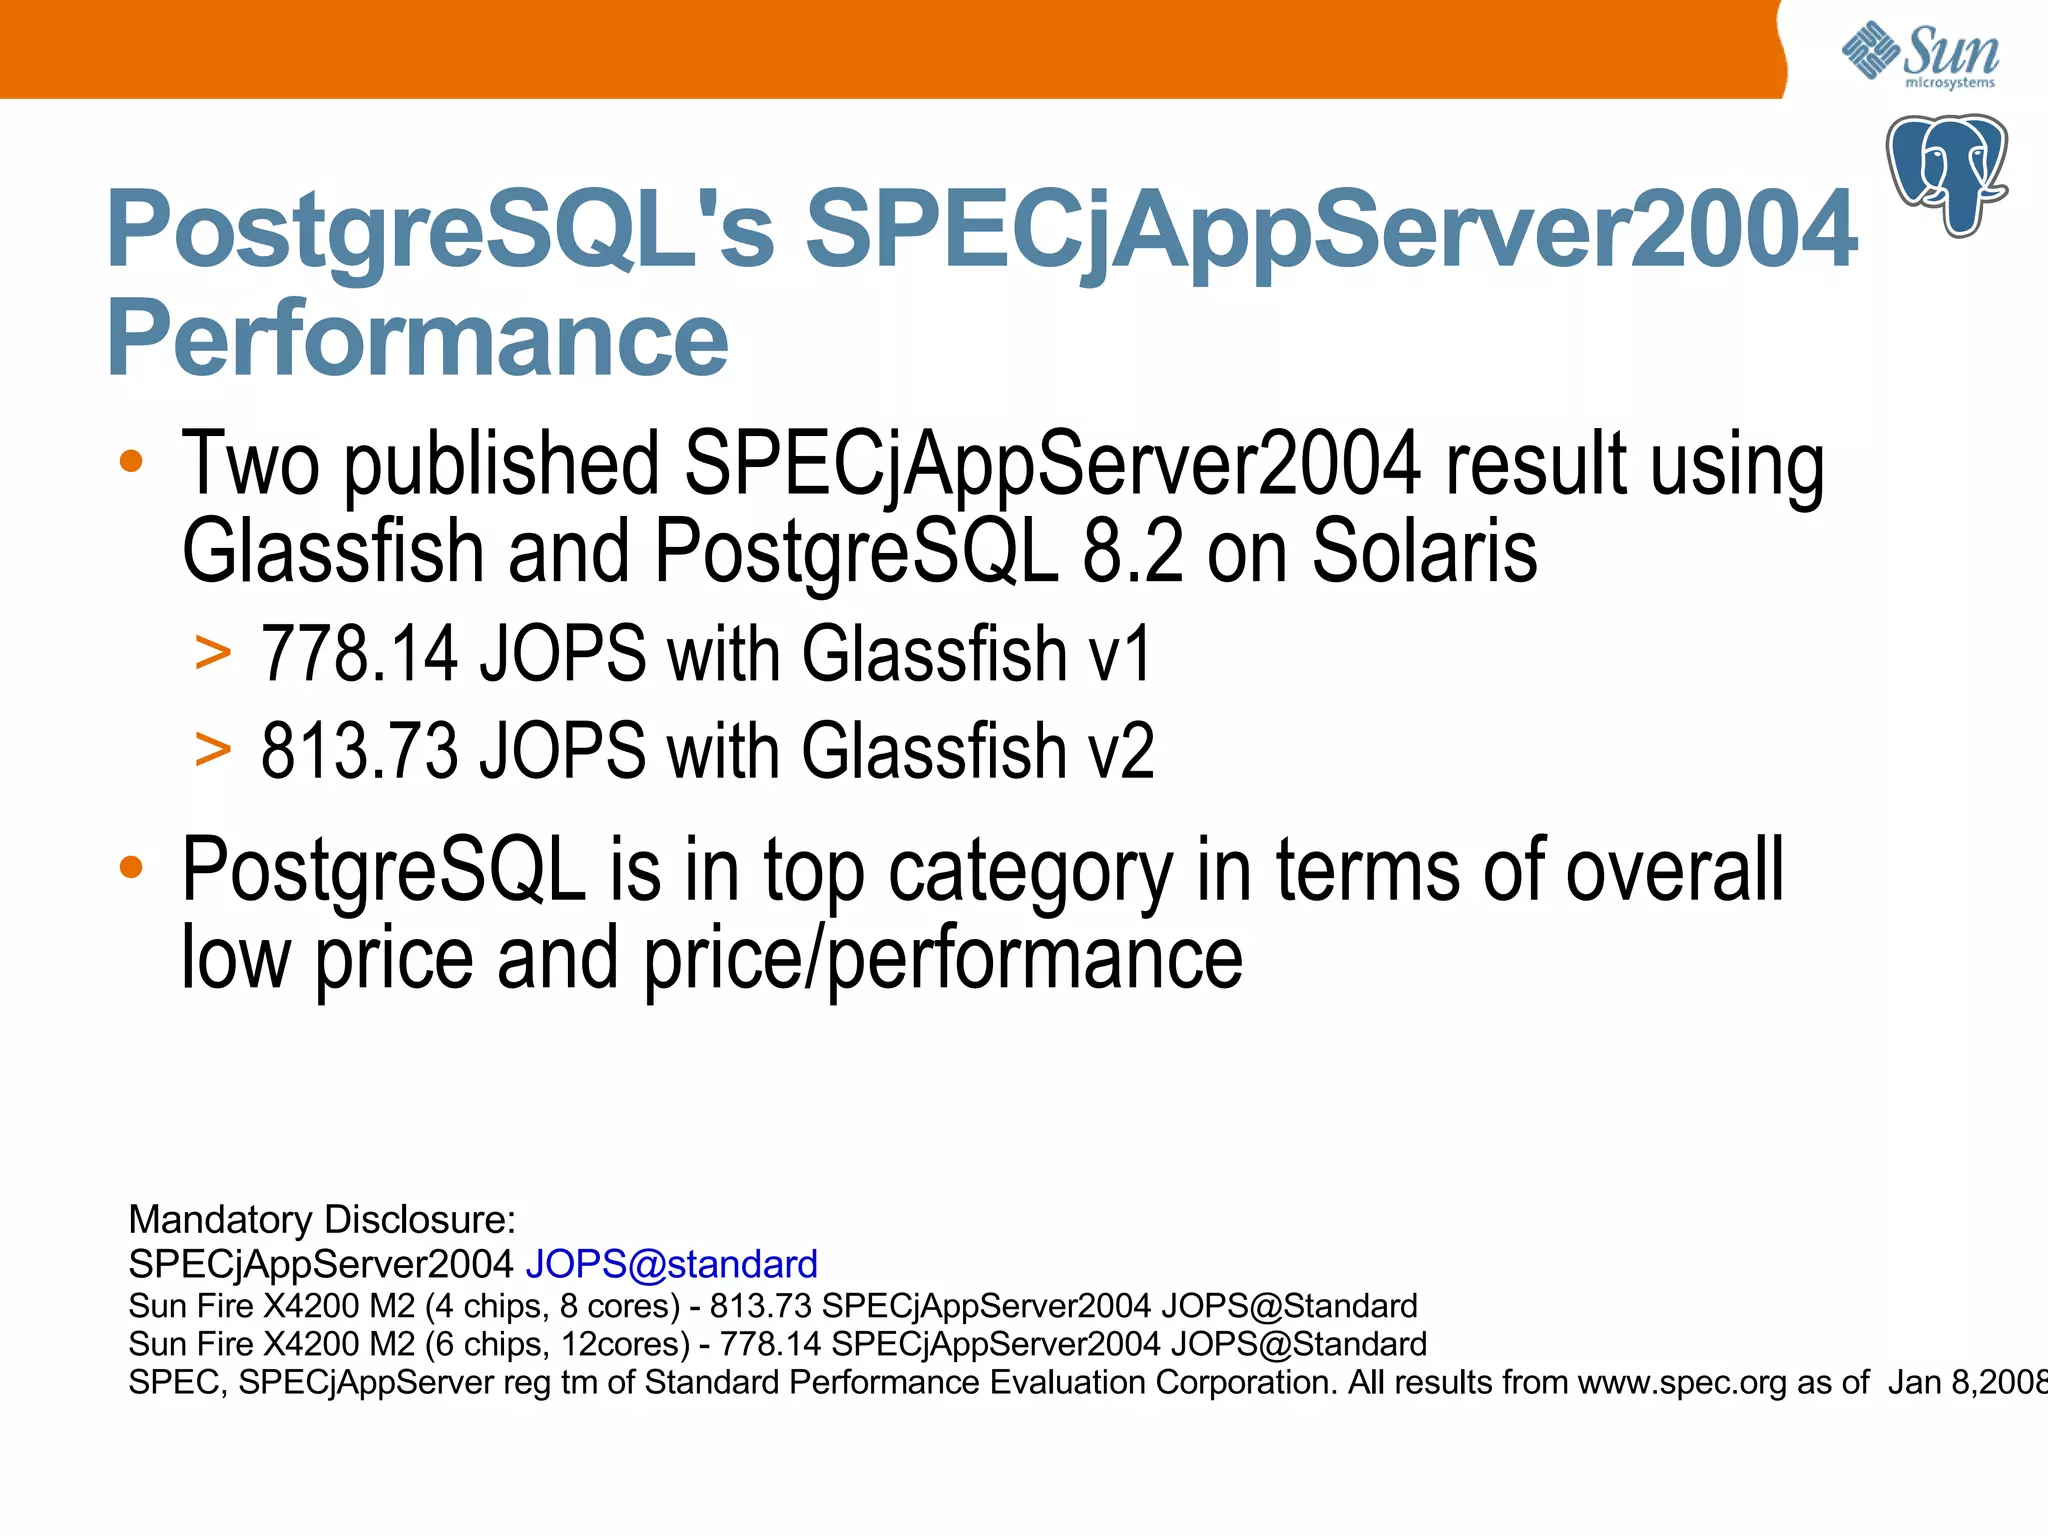
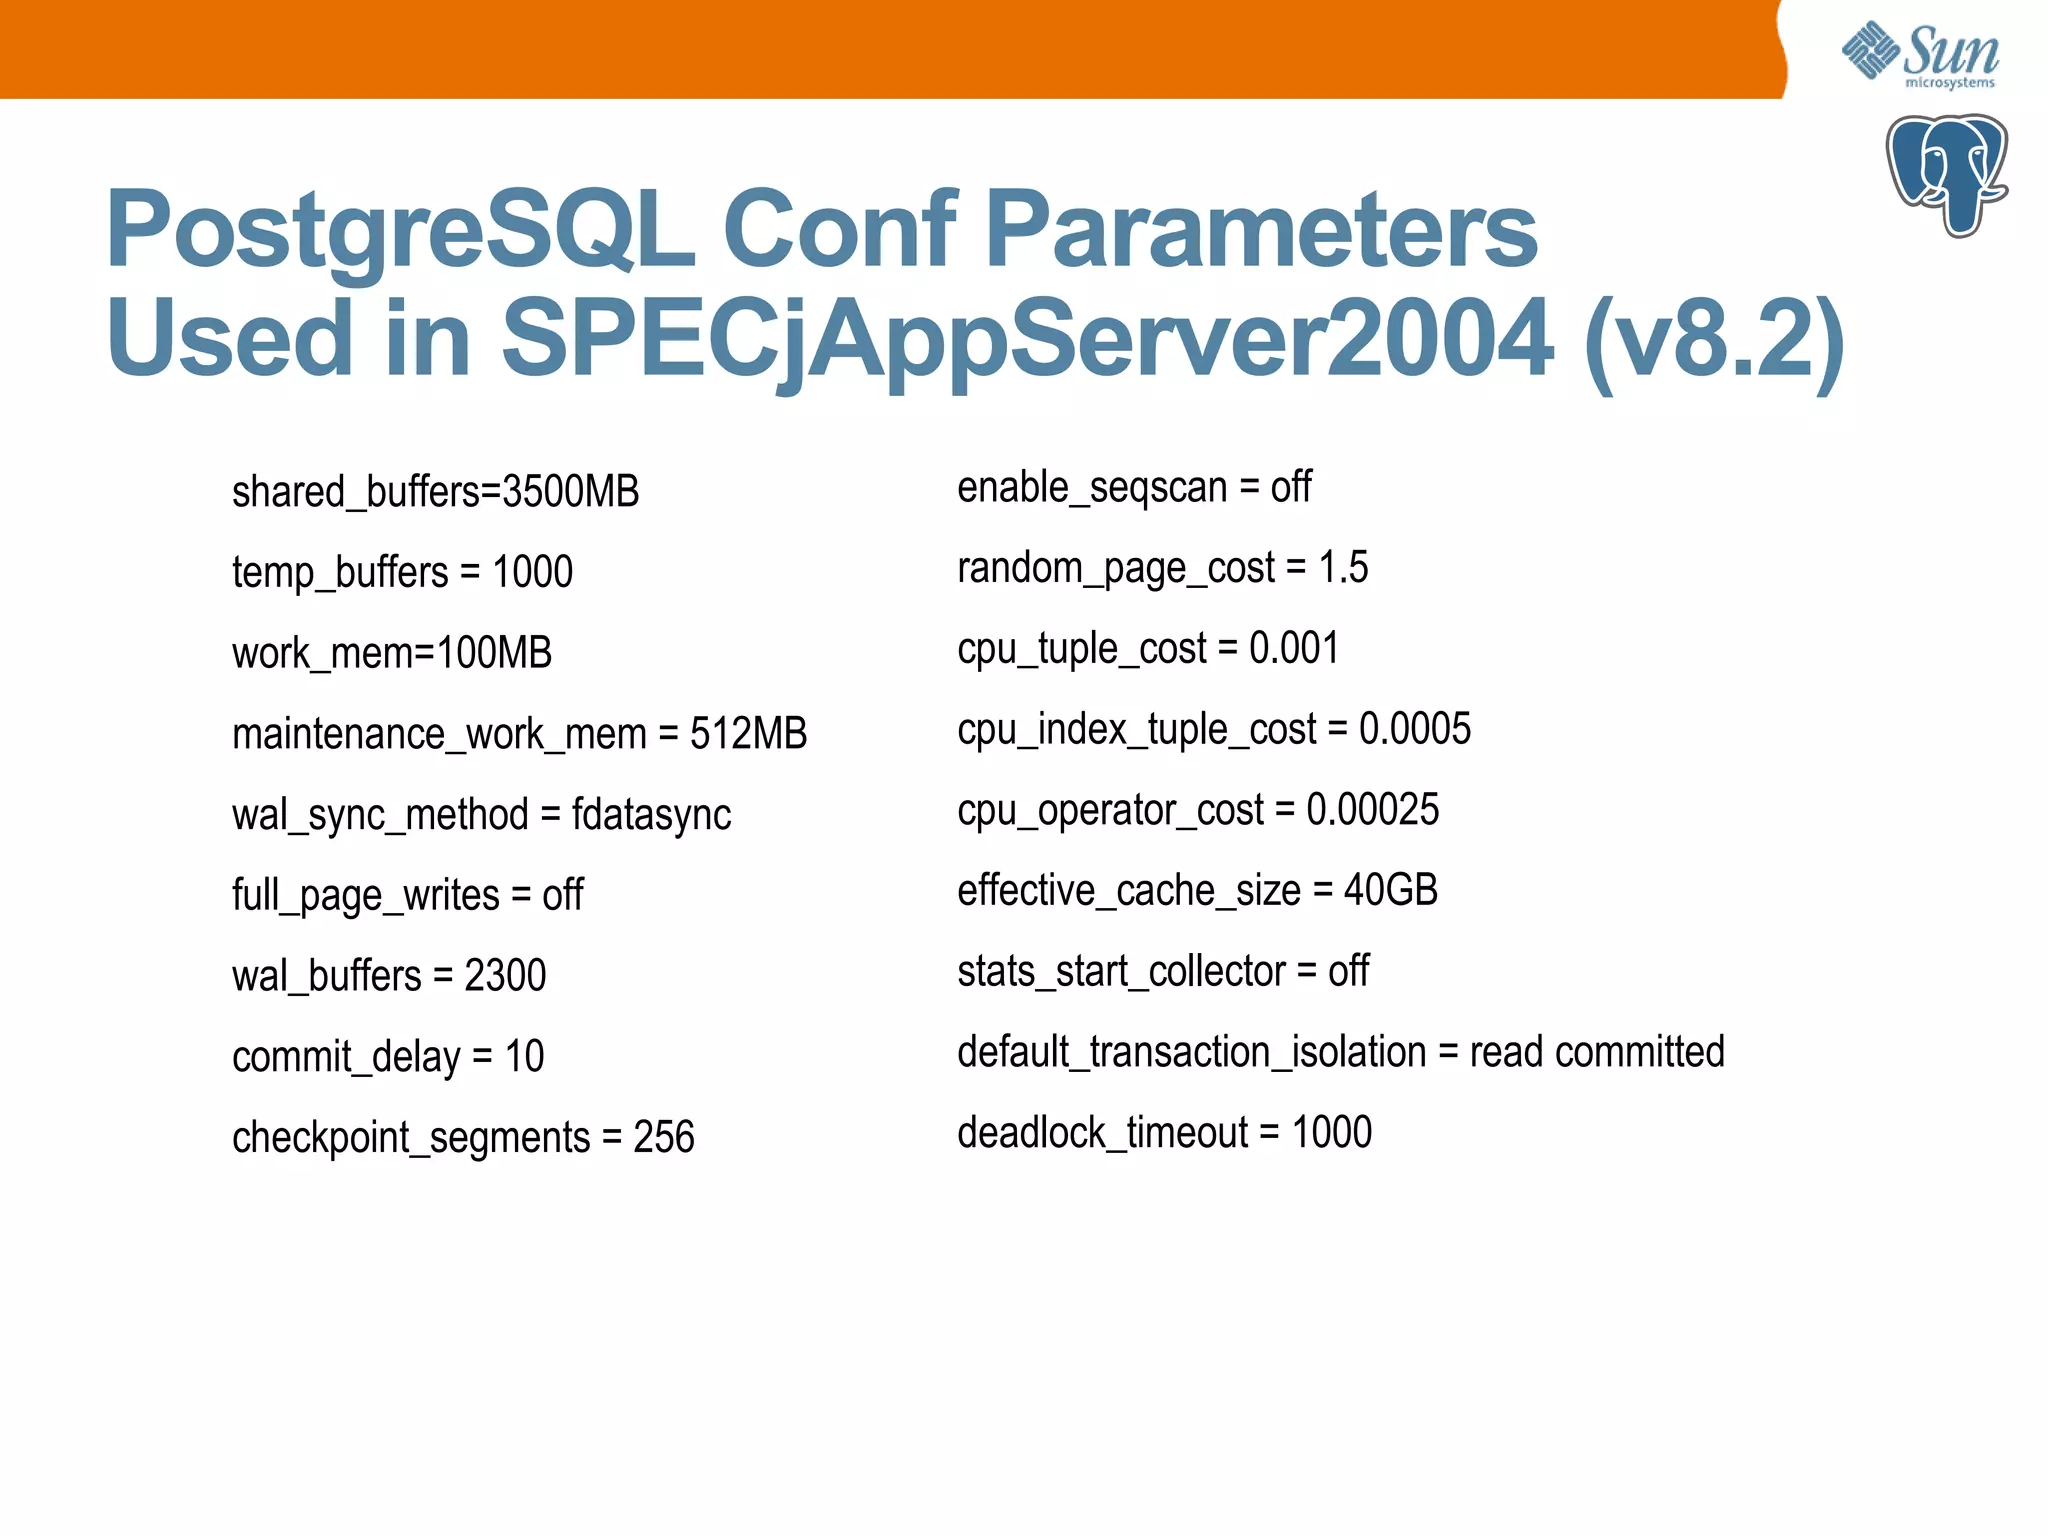
Setup and performance of PostgreSQL 8.2 with SPECjAppServer2004 metrics highlighting JOPS performance.
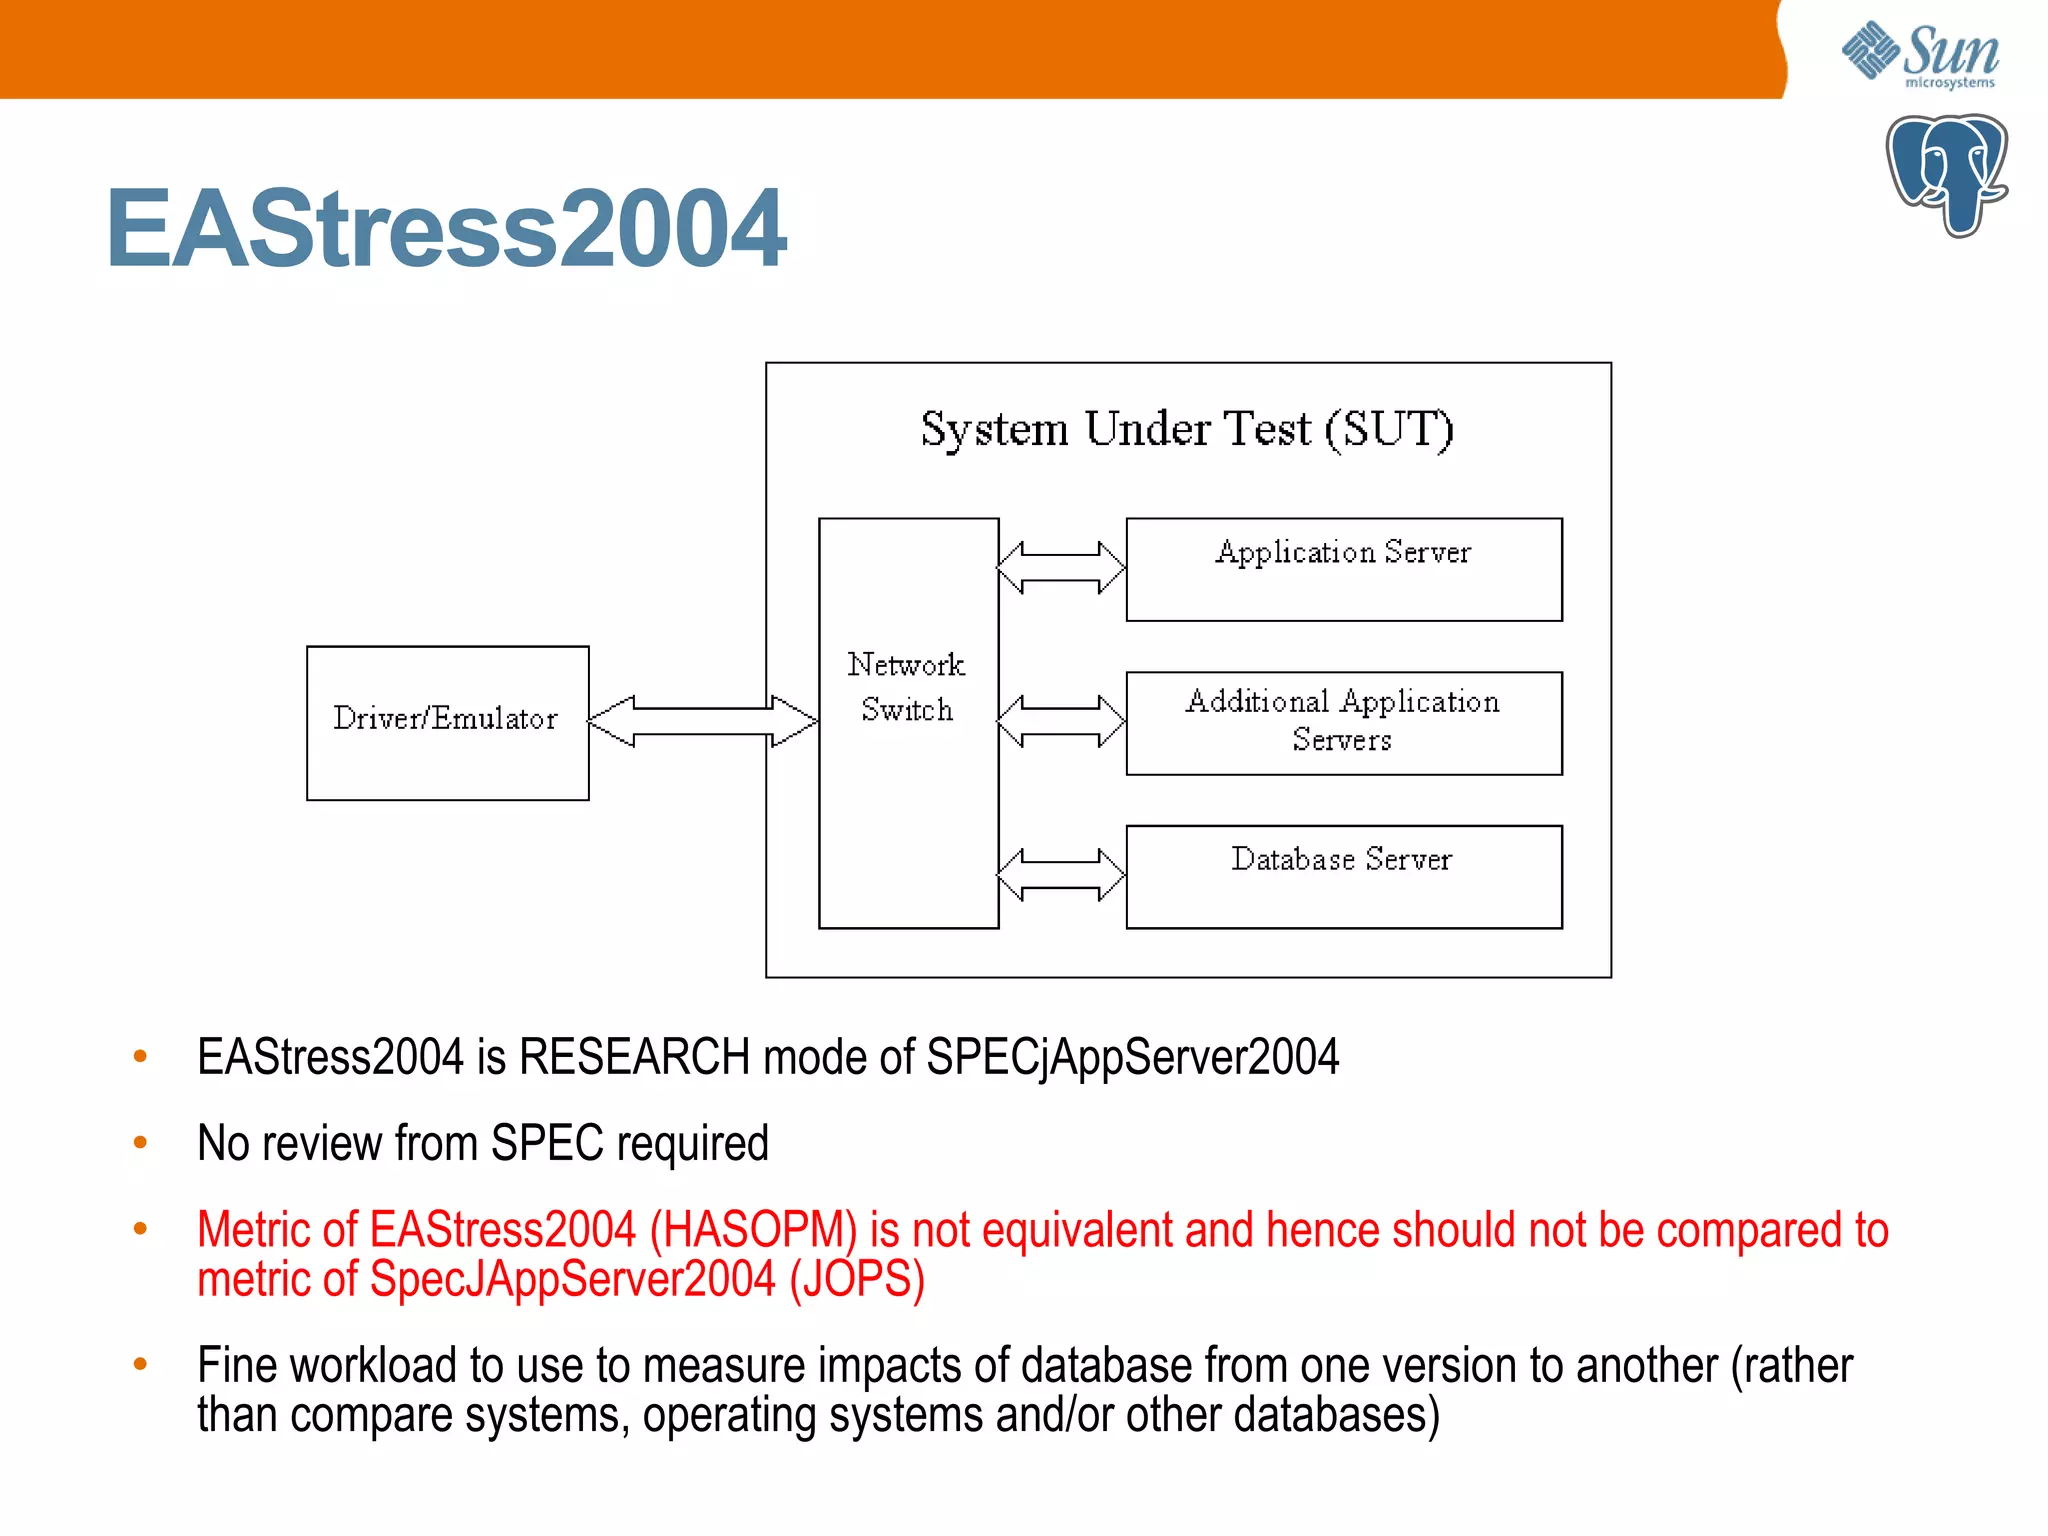
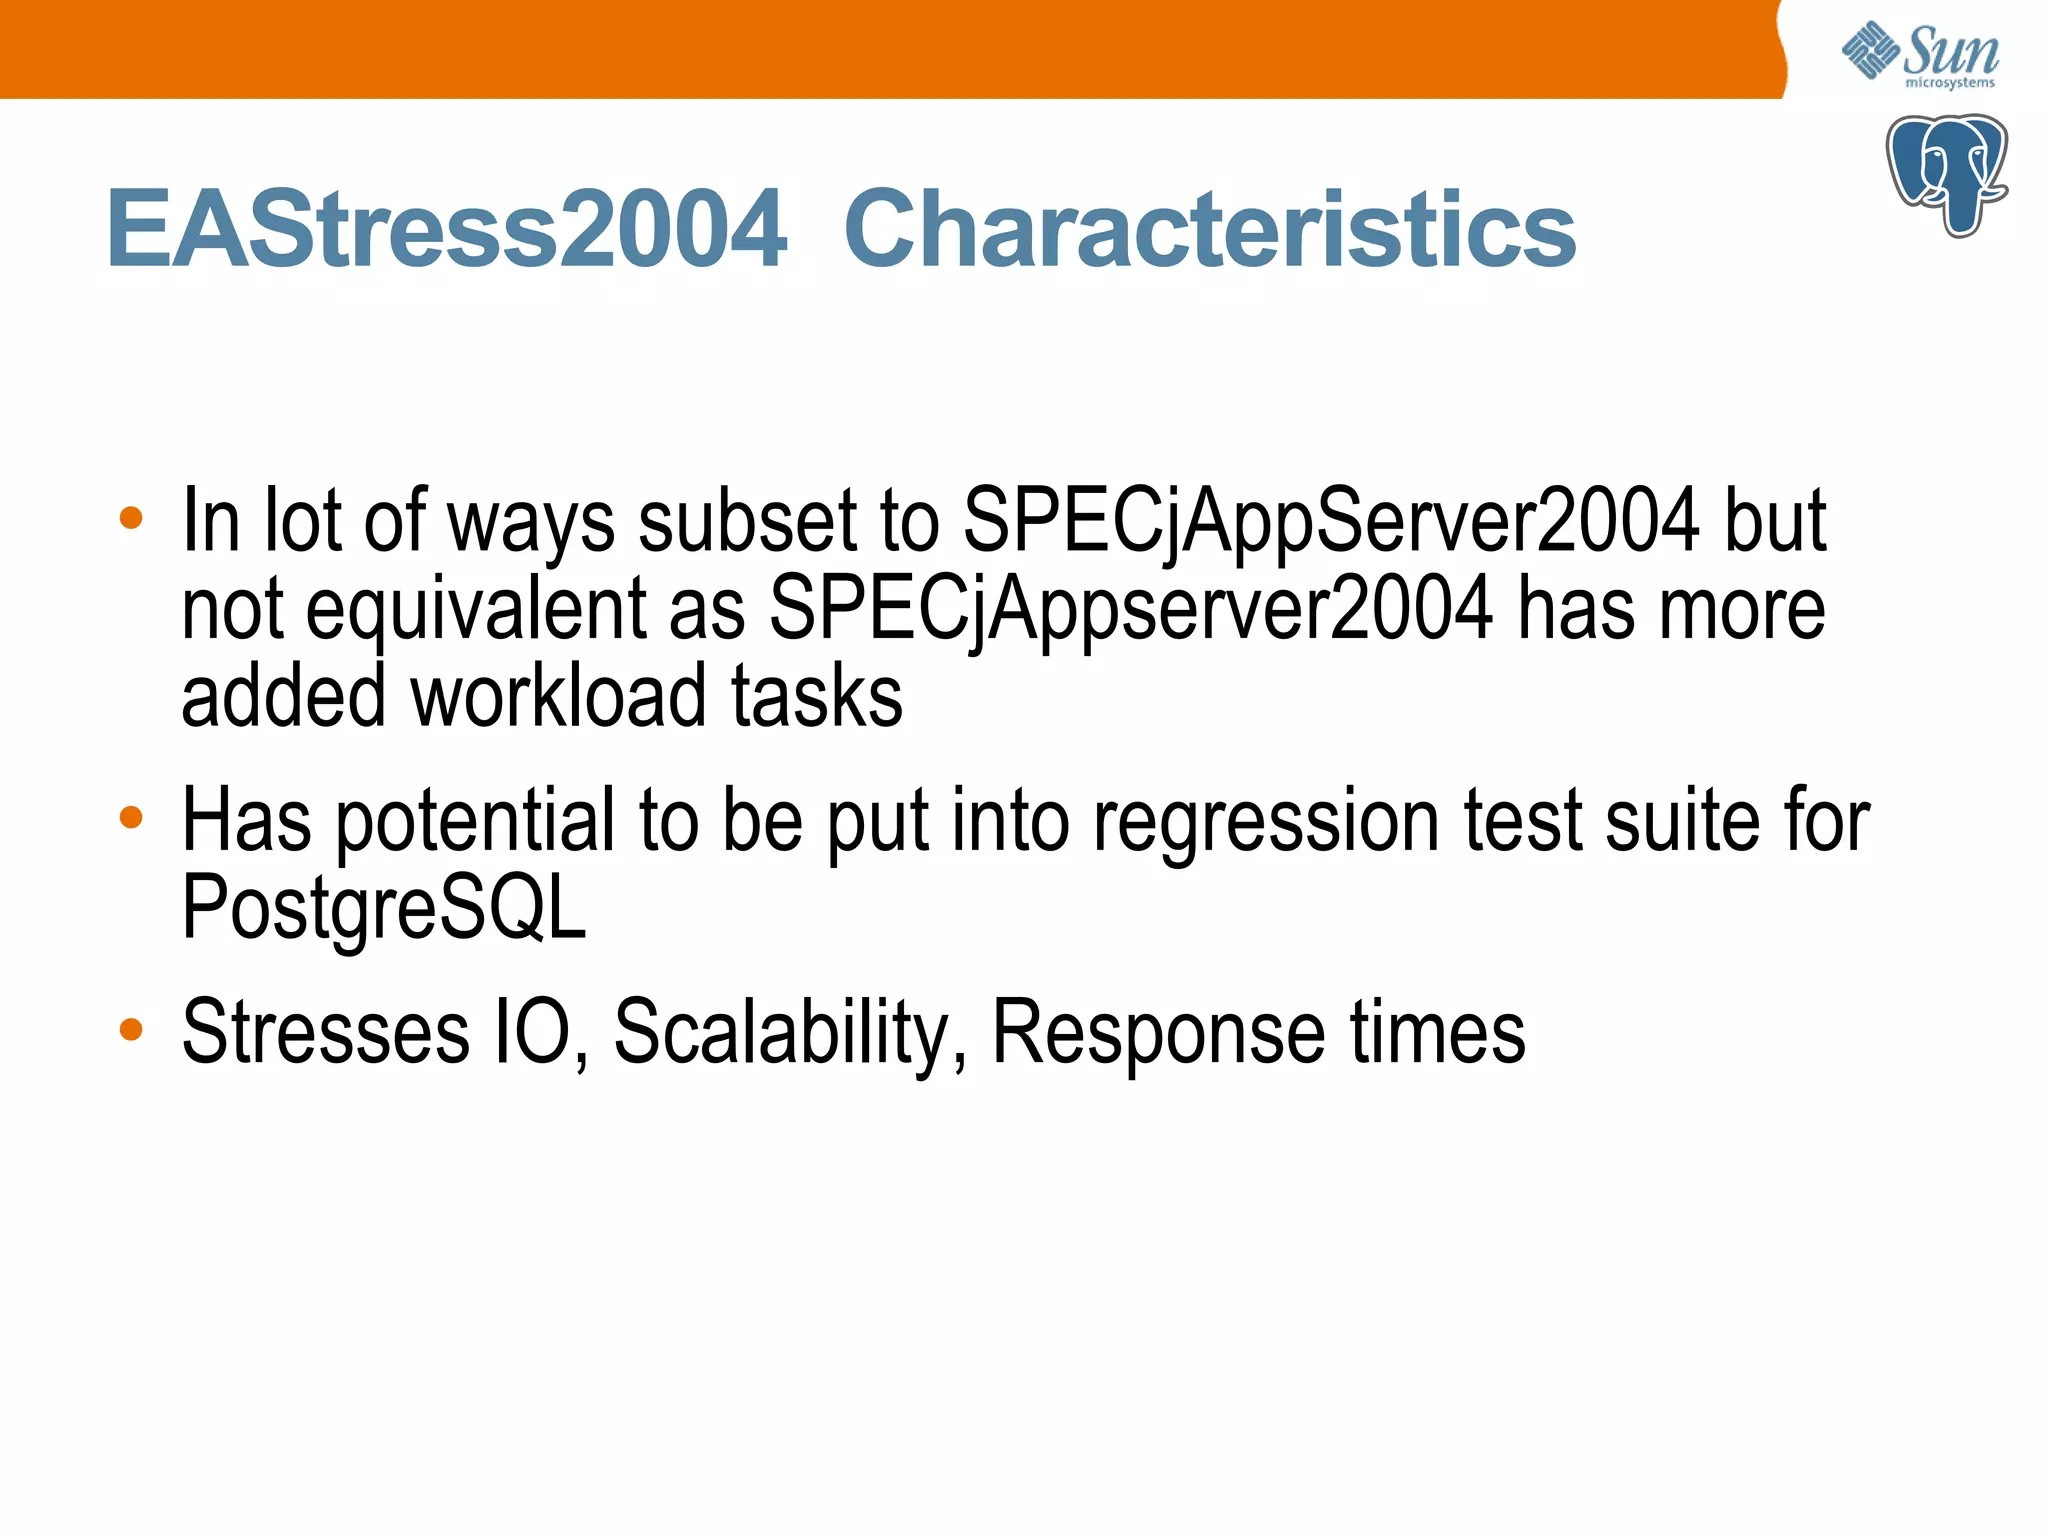
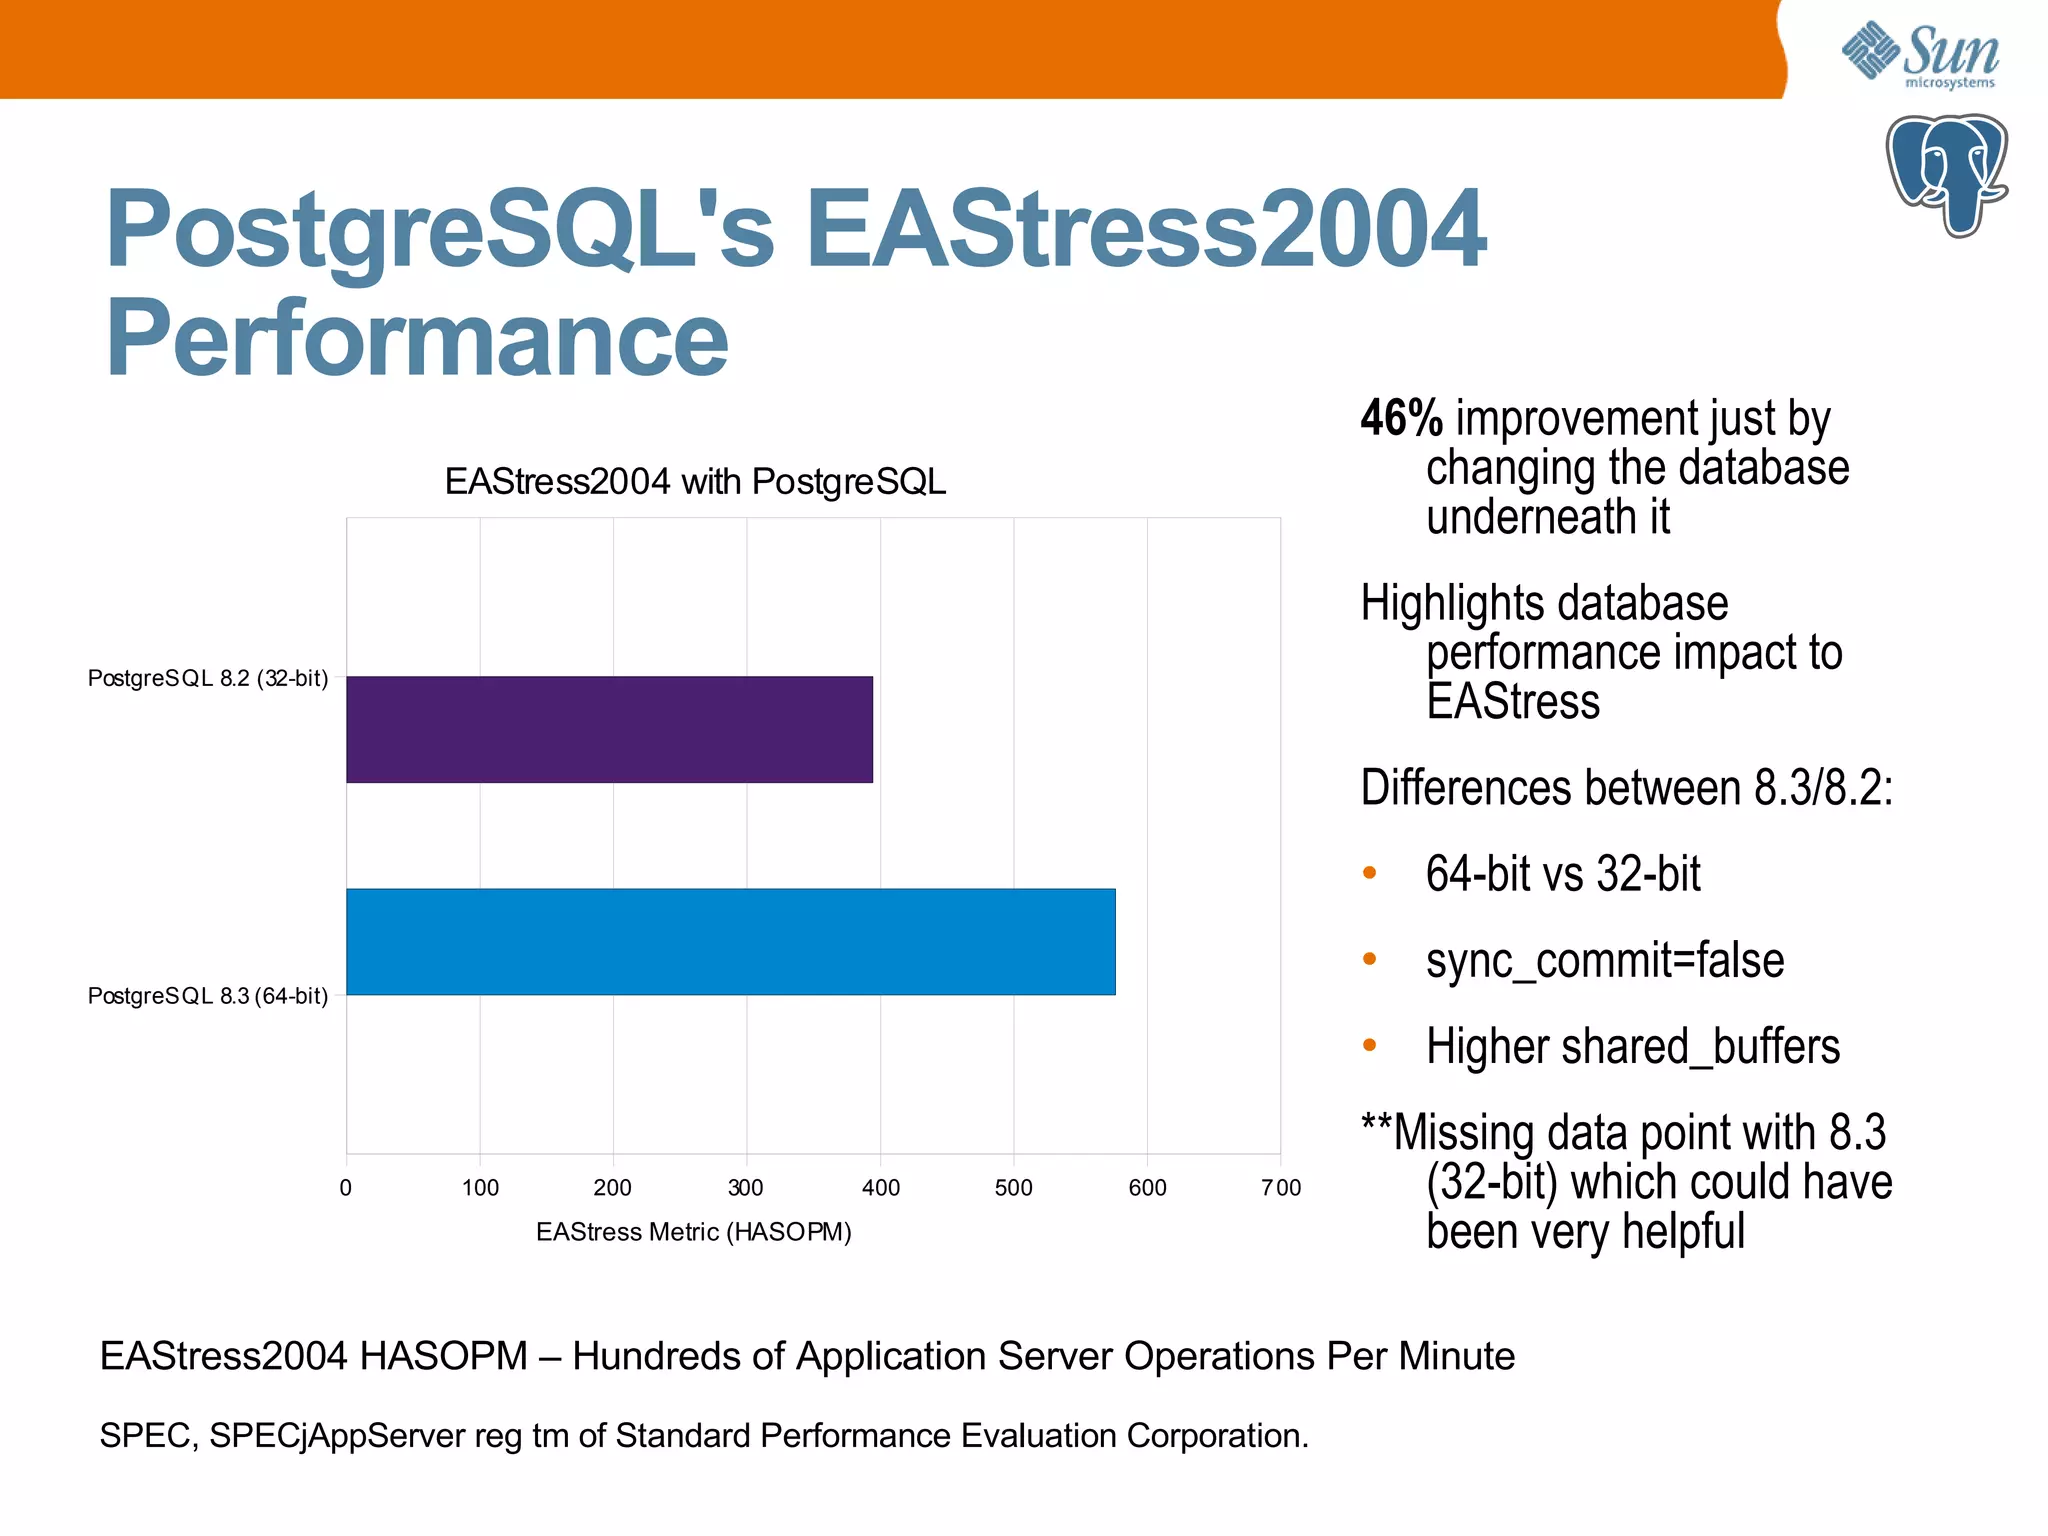
Introduction to EAStress2004, describing its metrics (HASOPM), characteristics, and relationship to SPECjAppServer2004.
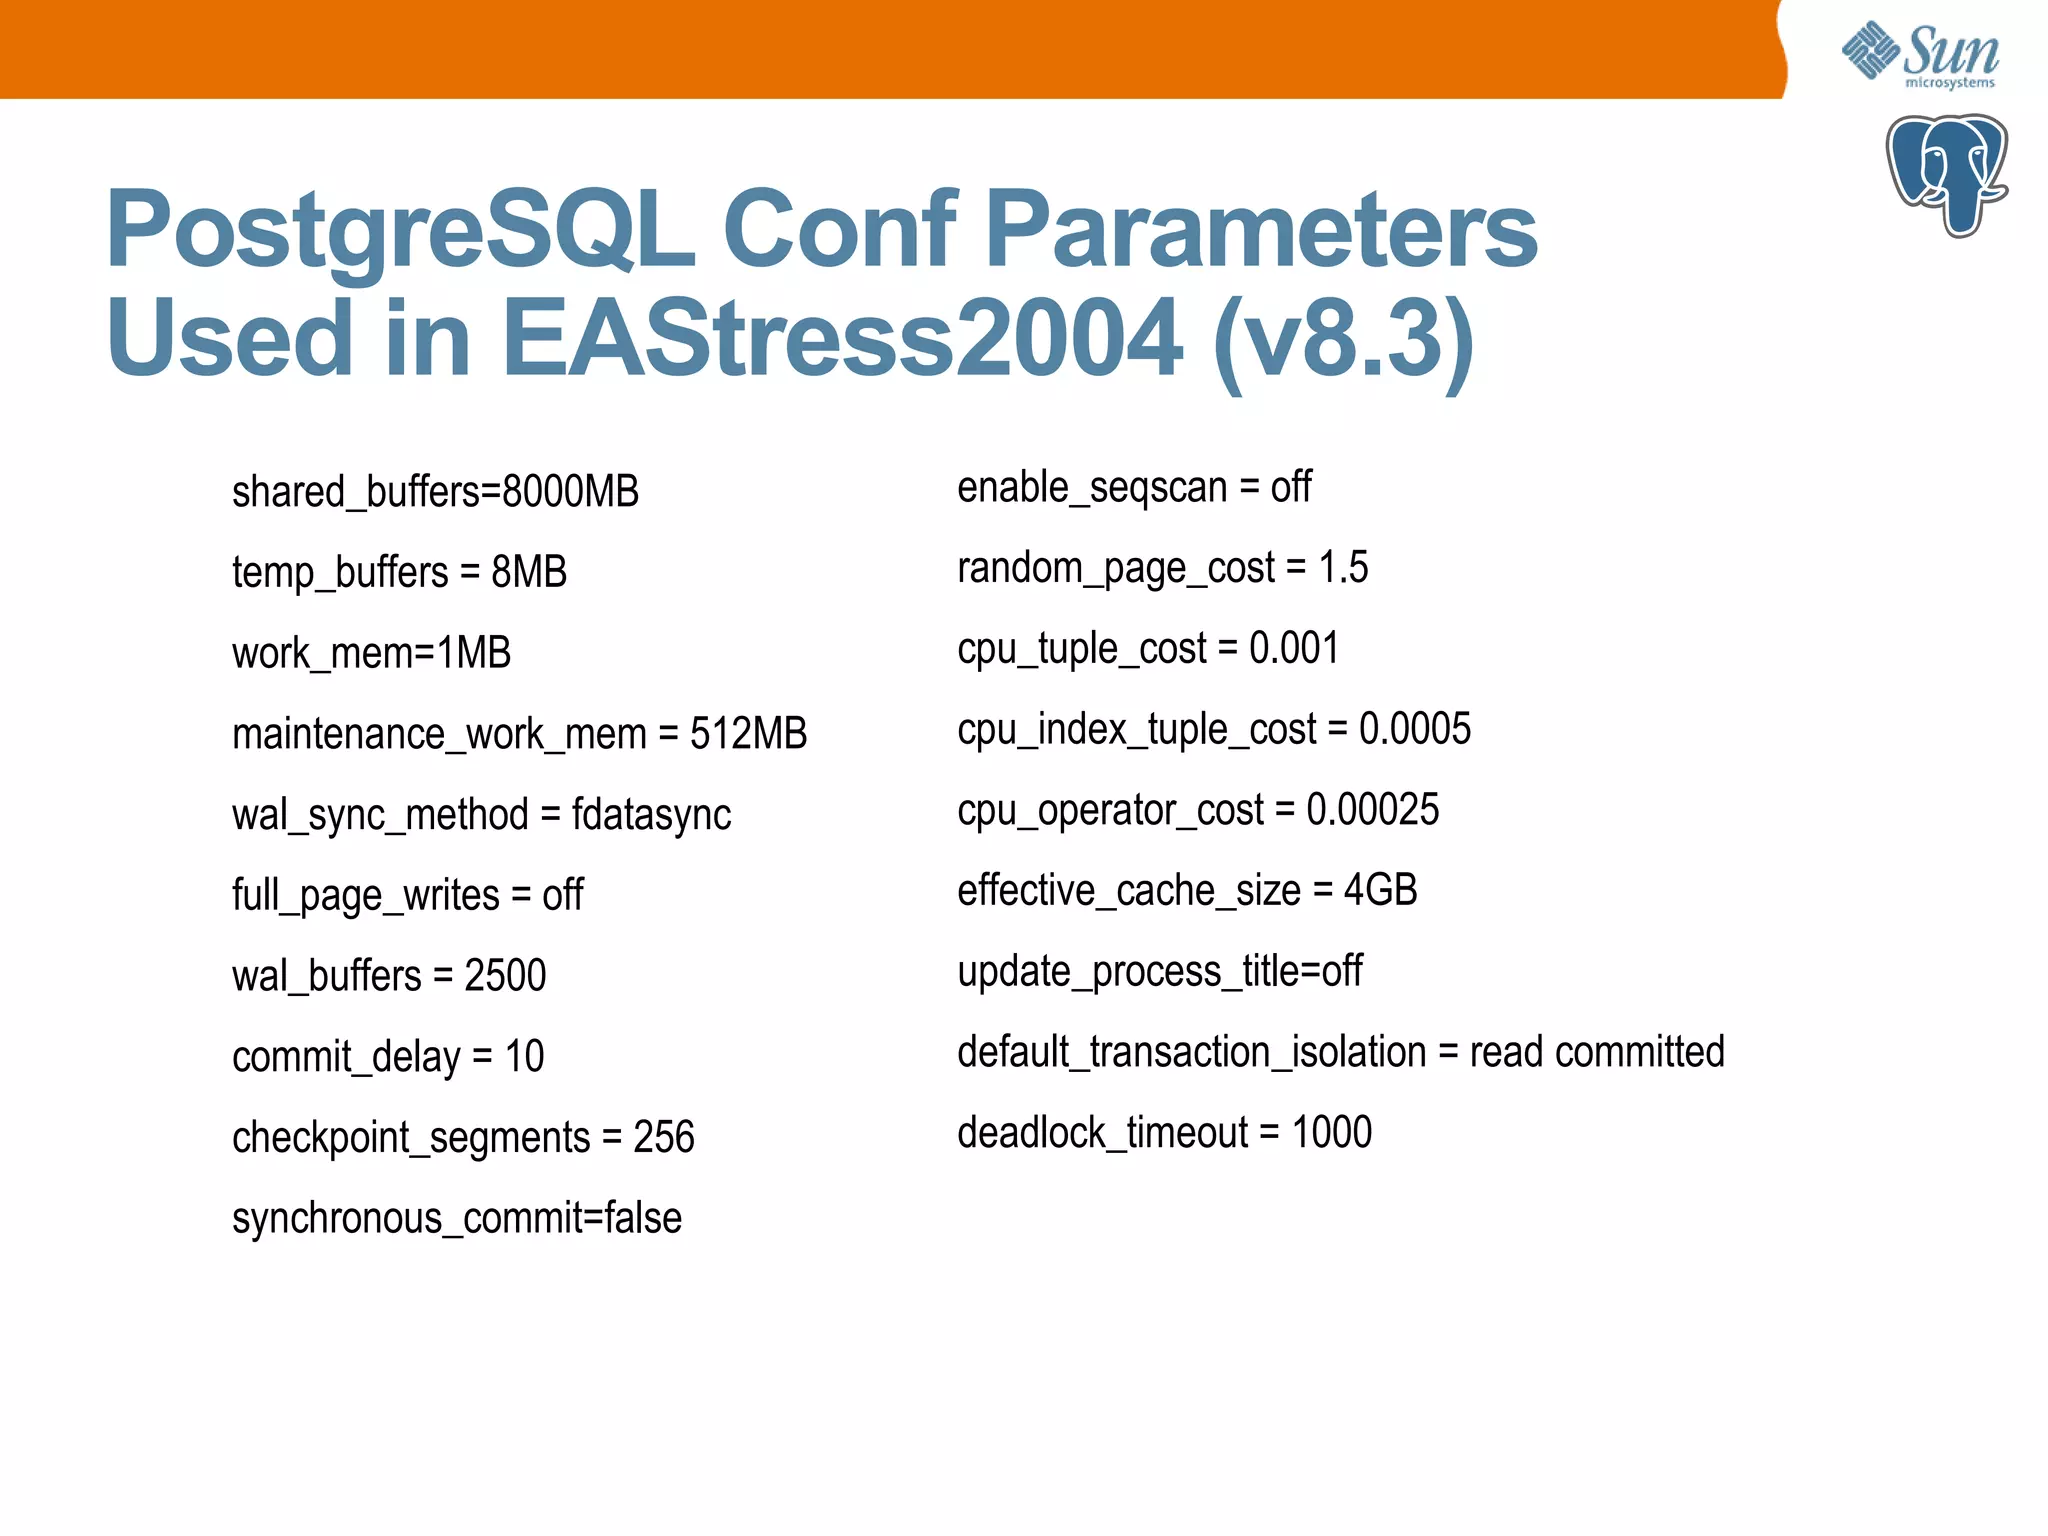
Performance results of PostgreSQL 8.2 and 8.3 in EAStress2004, showcasing improvements shown through database changes.
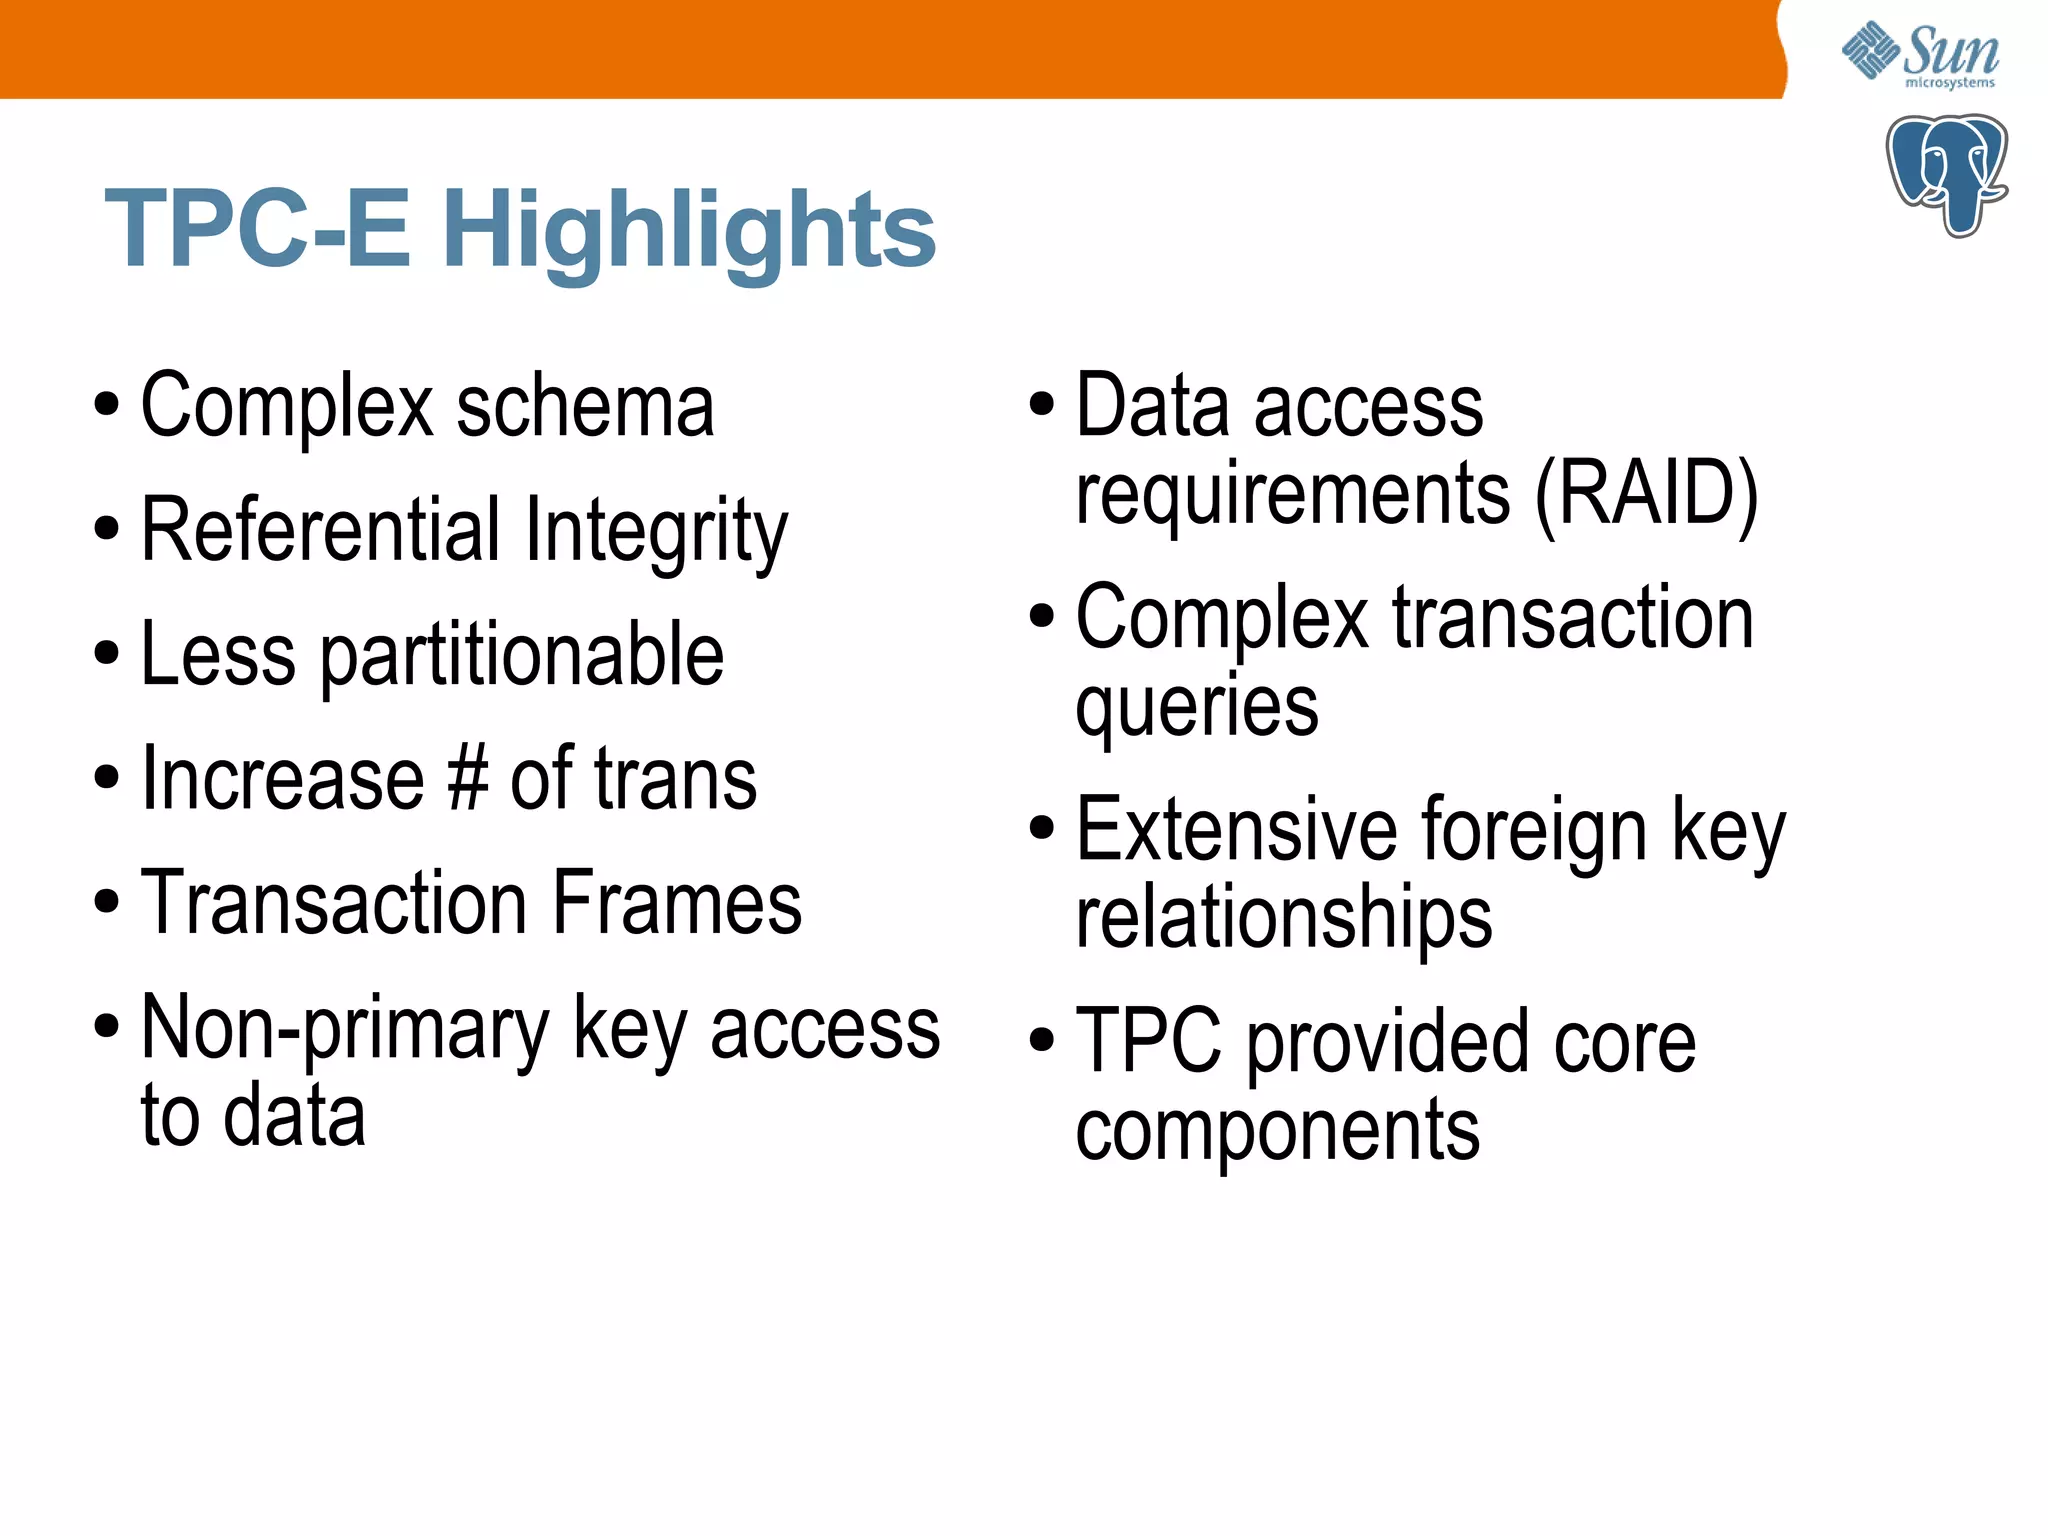
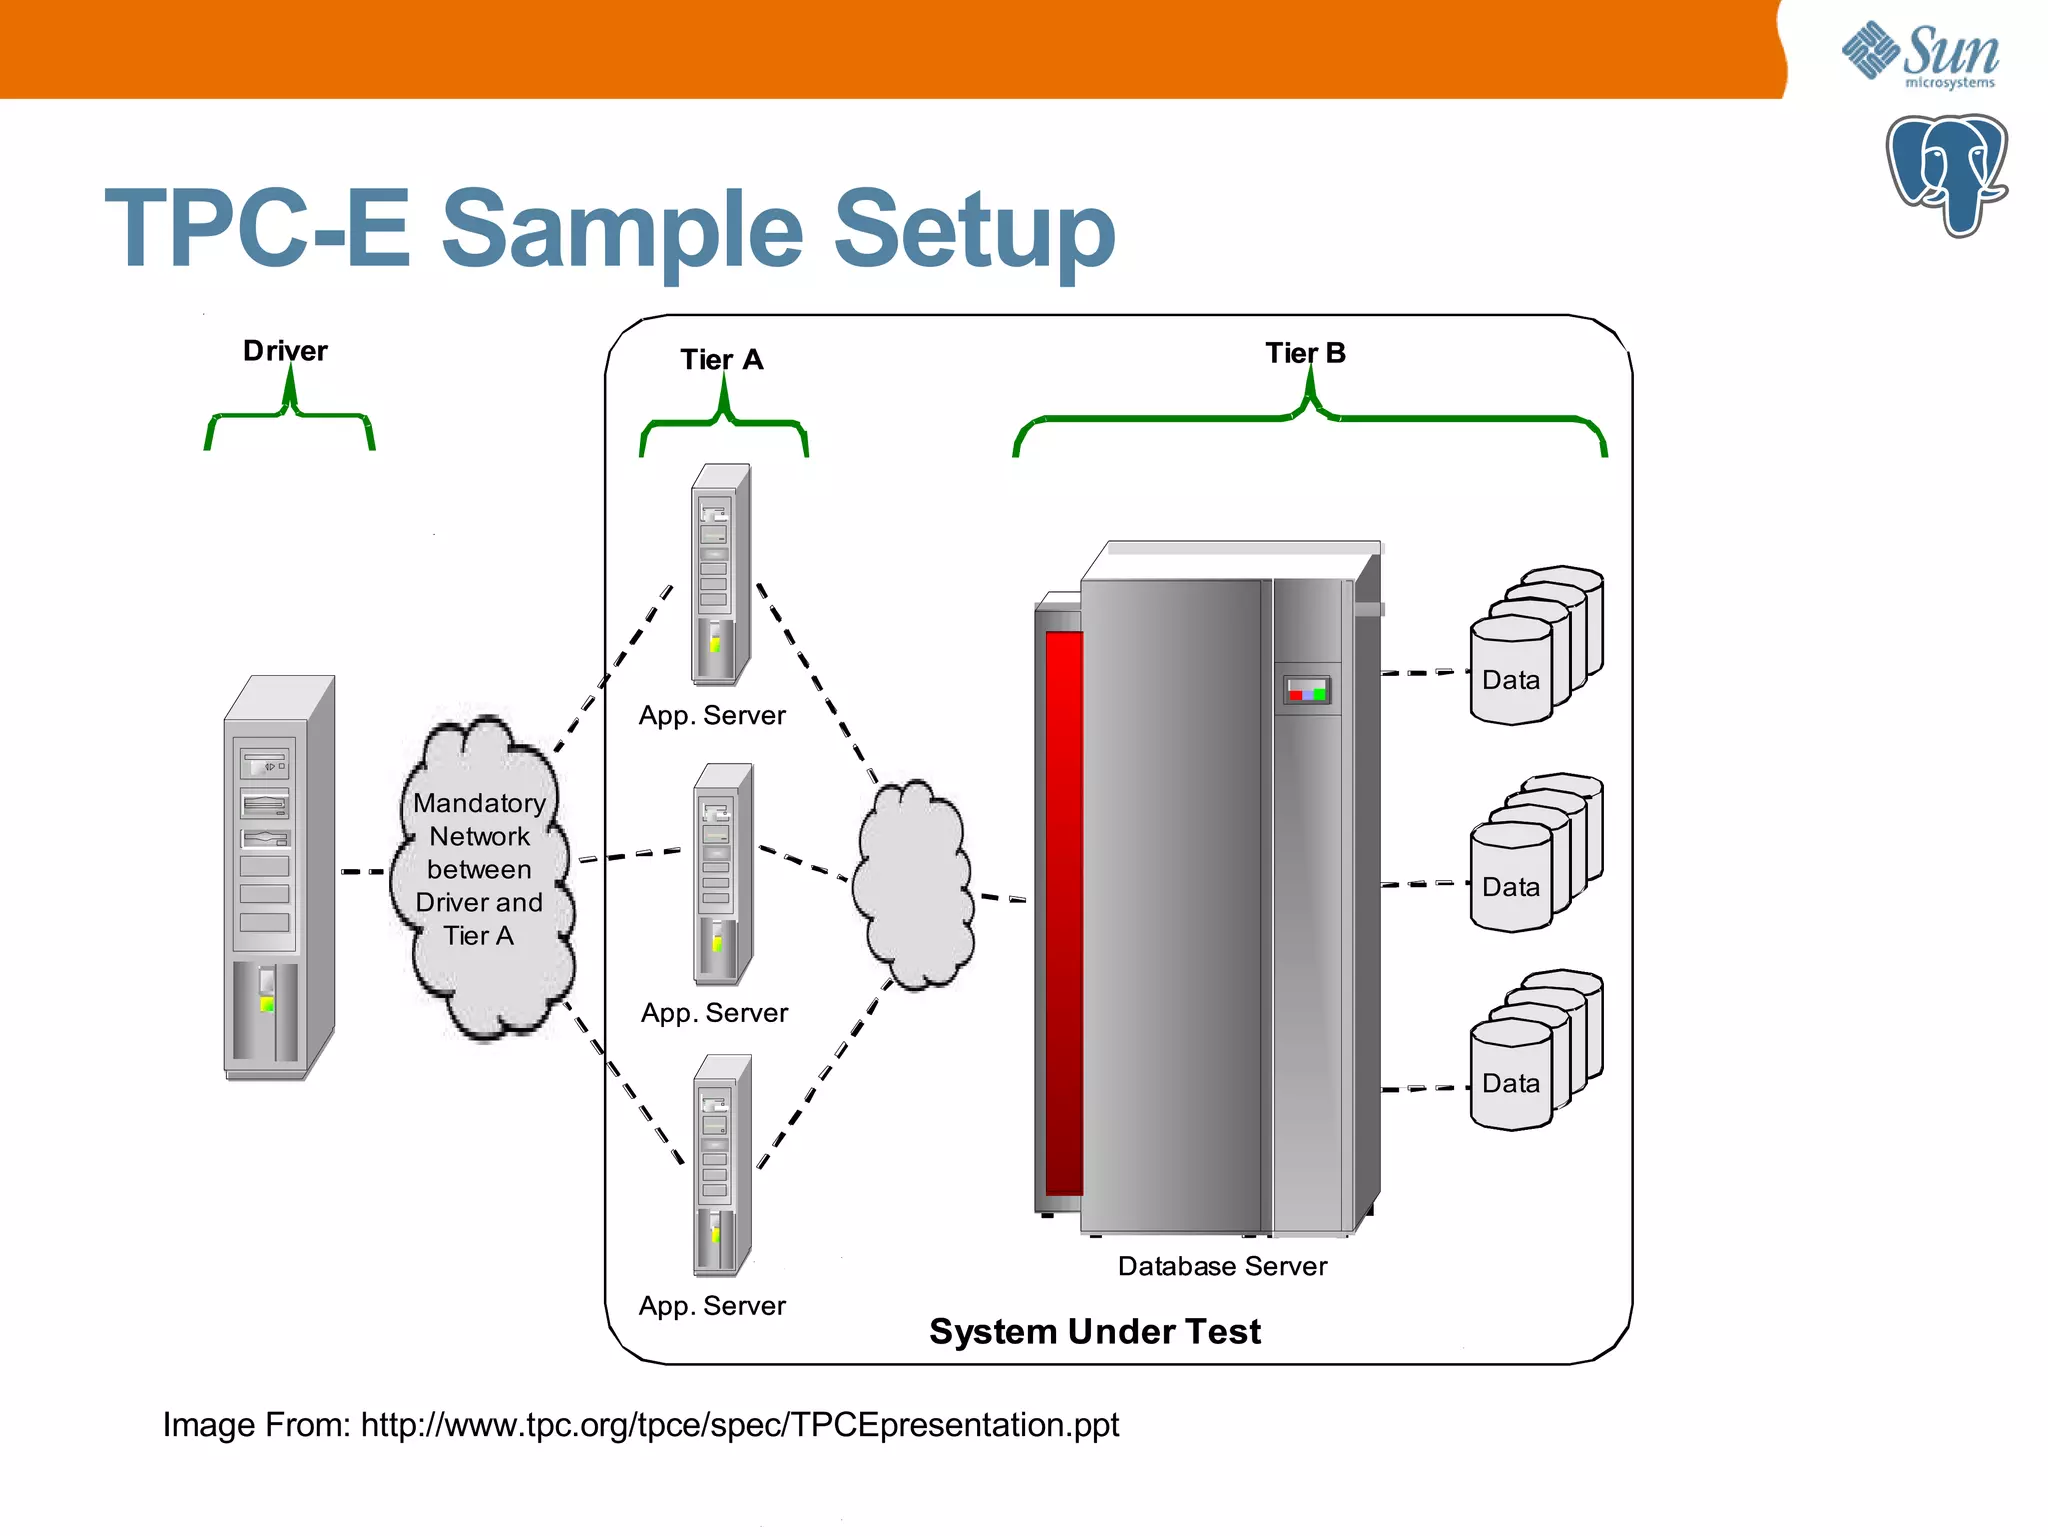
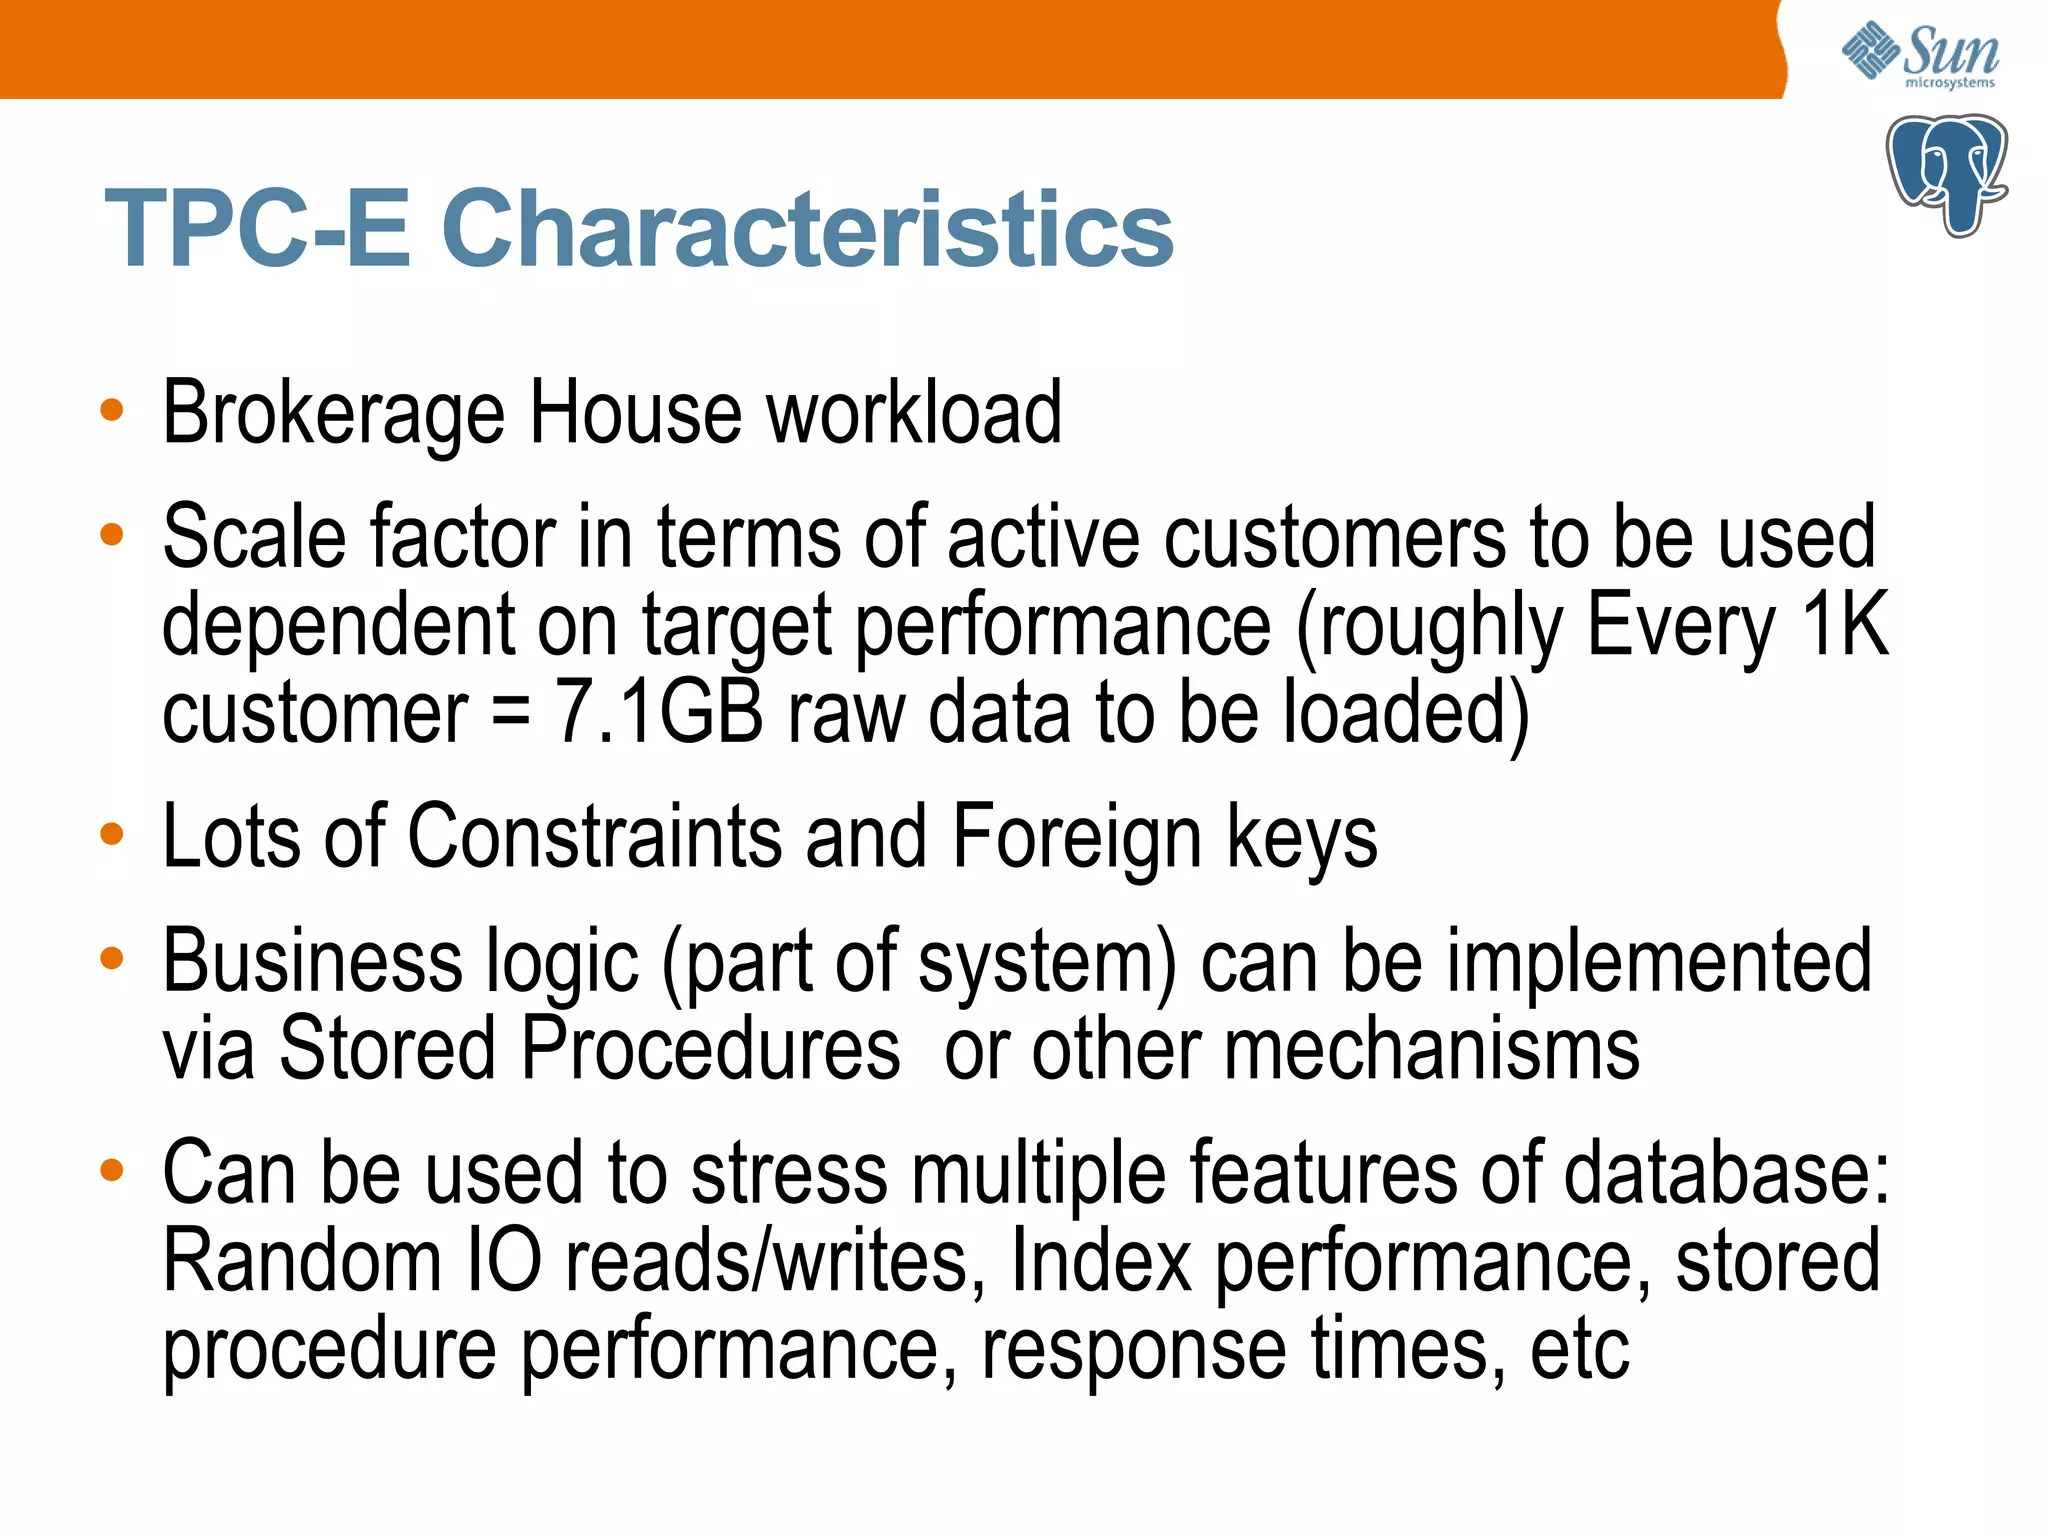
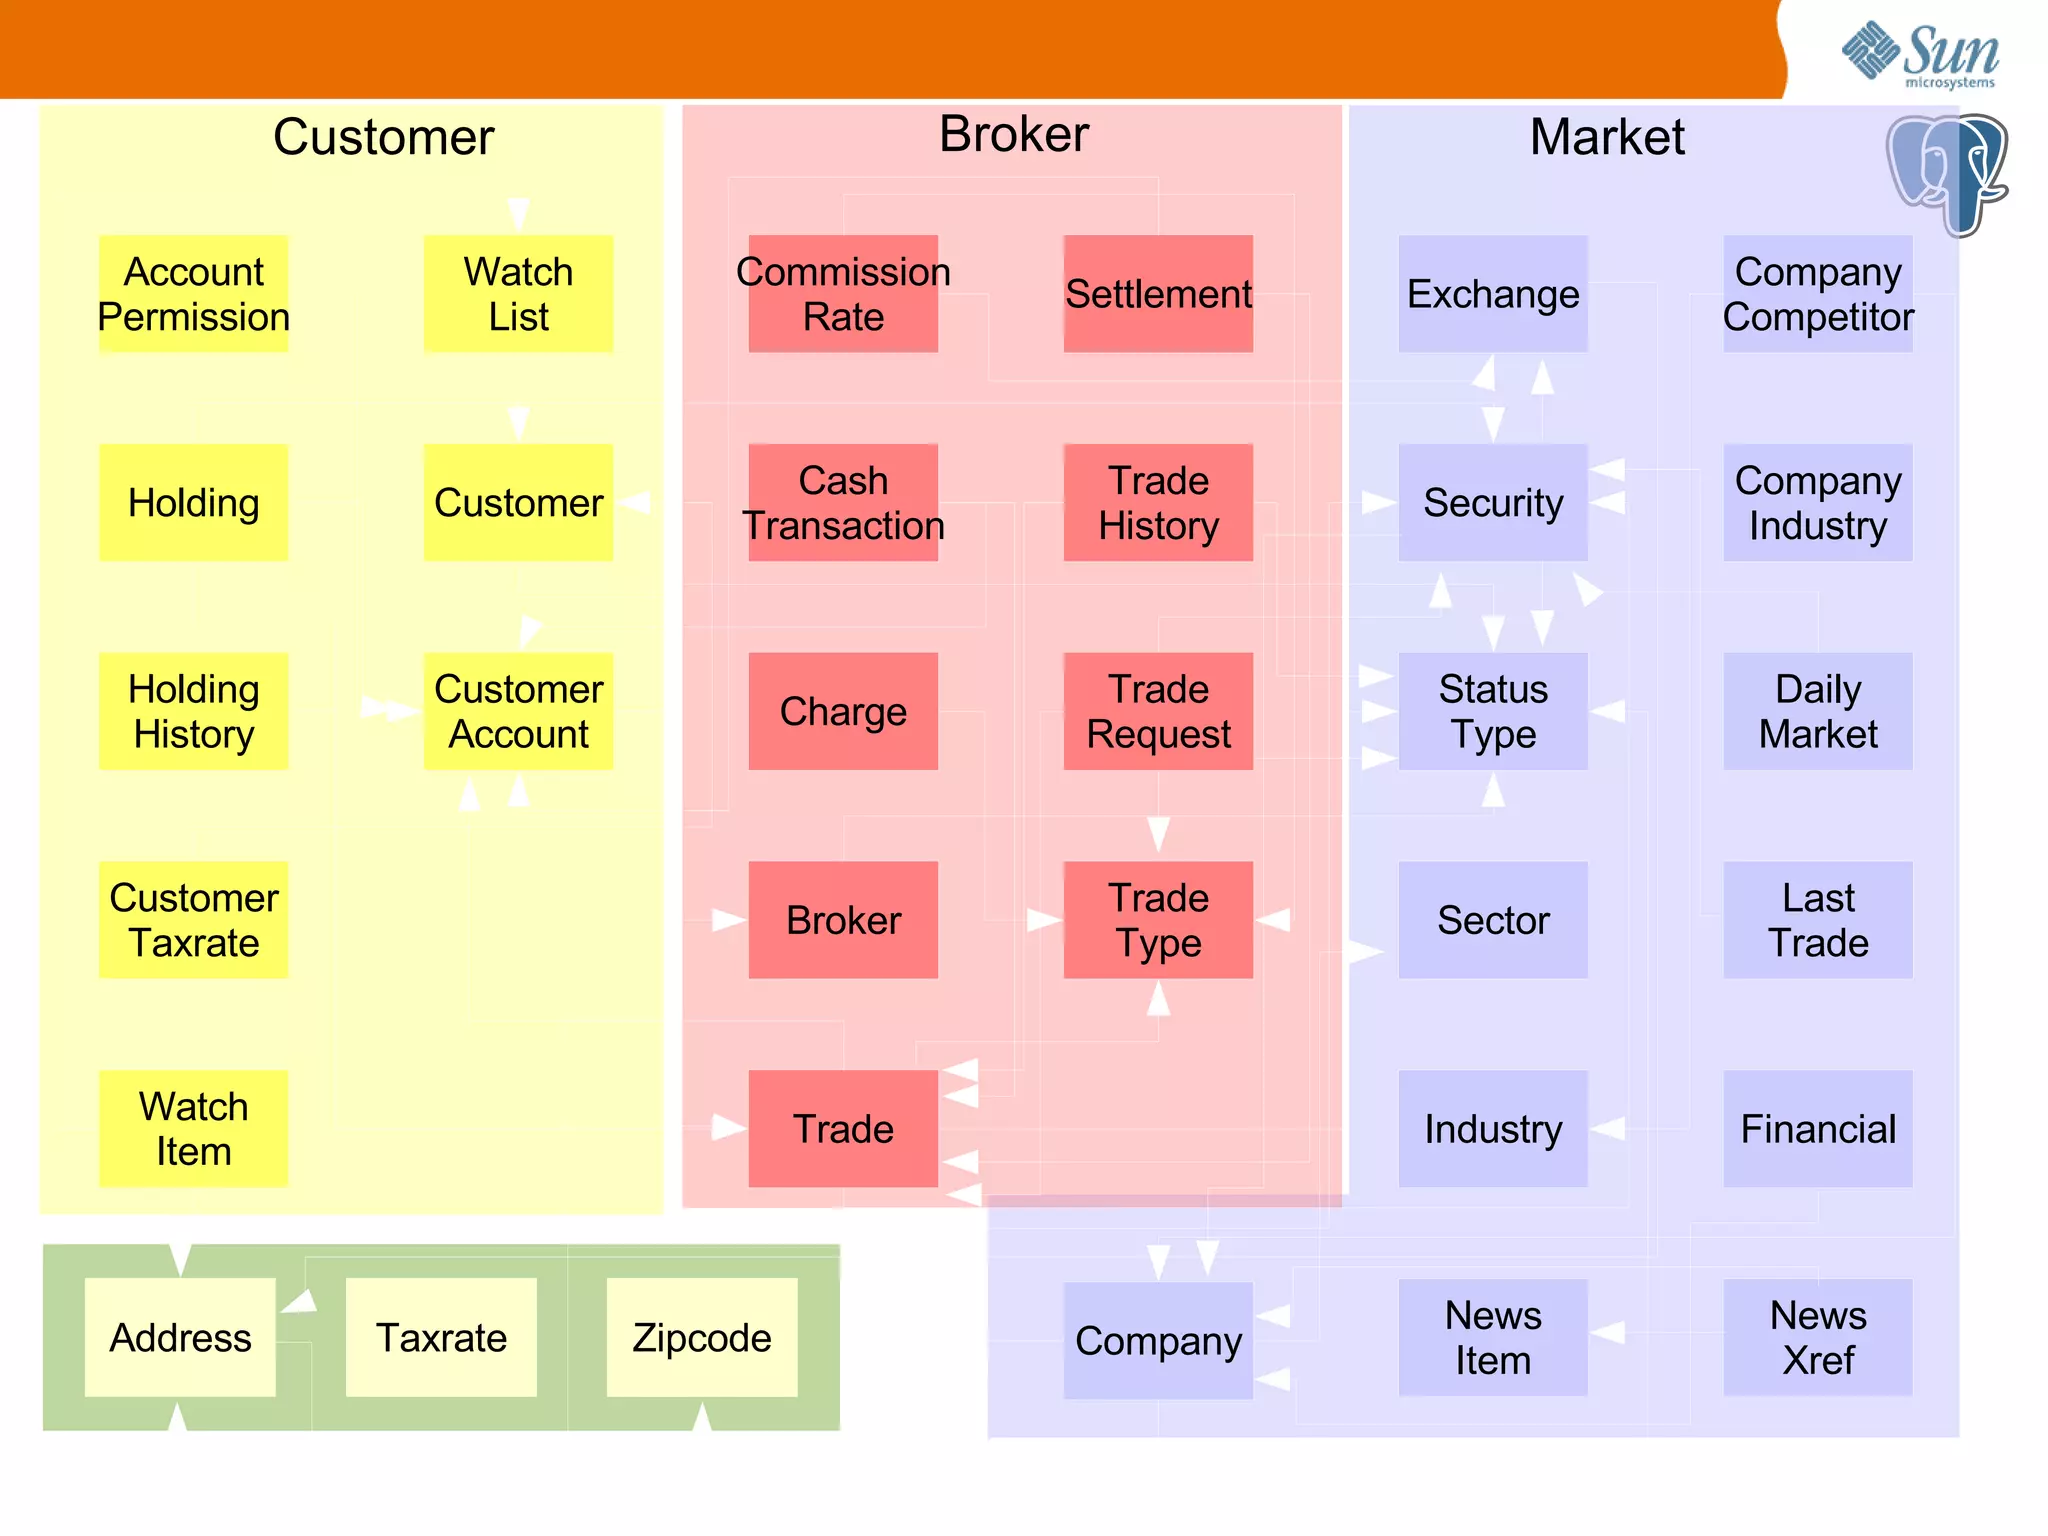
Details about TPC-E, including its complex schema, transaction characteristics, and how it stresses database features.
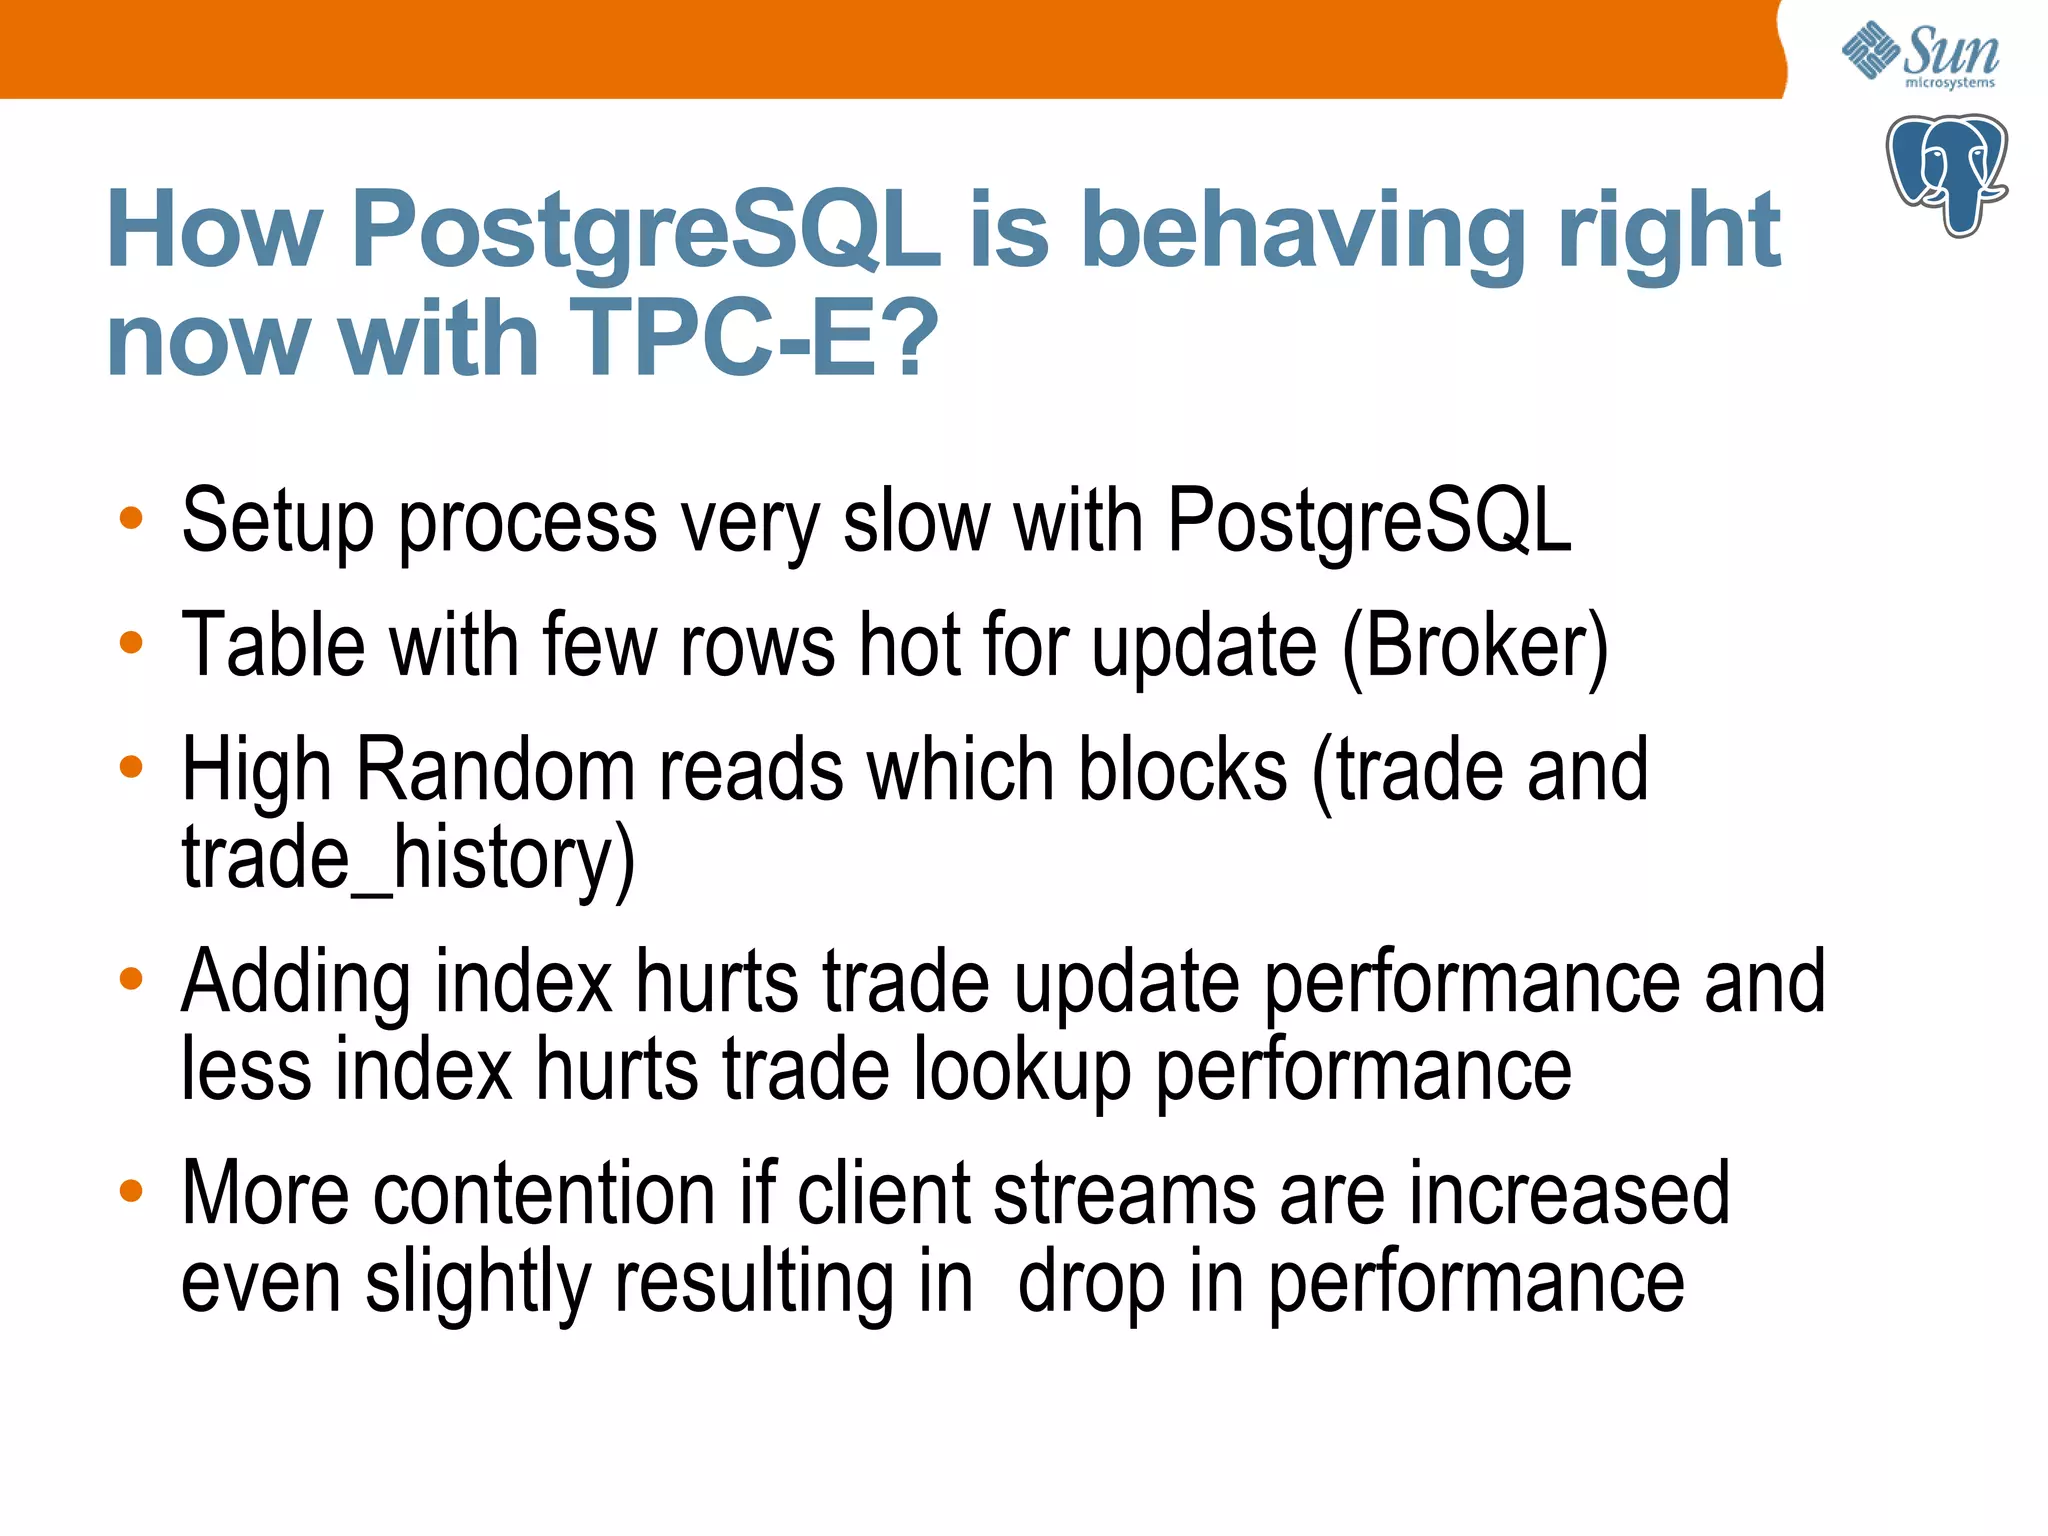
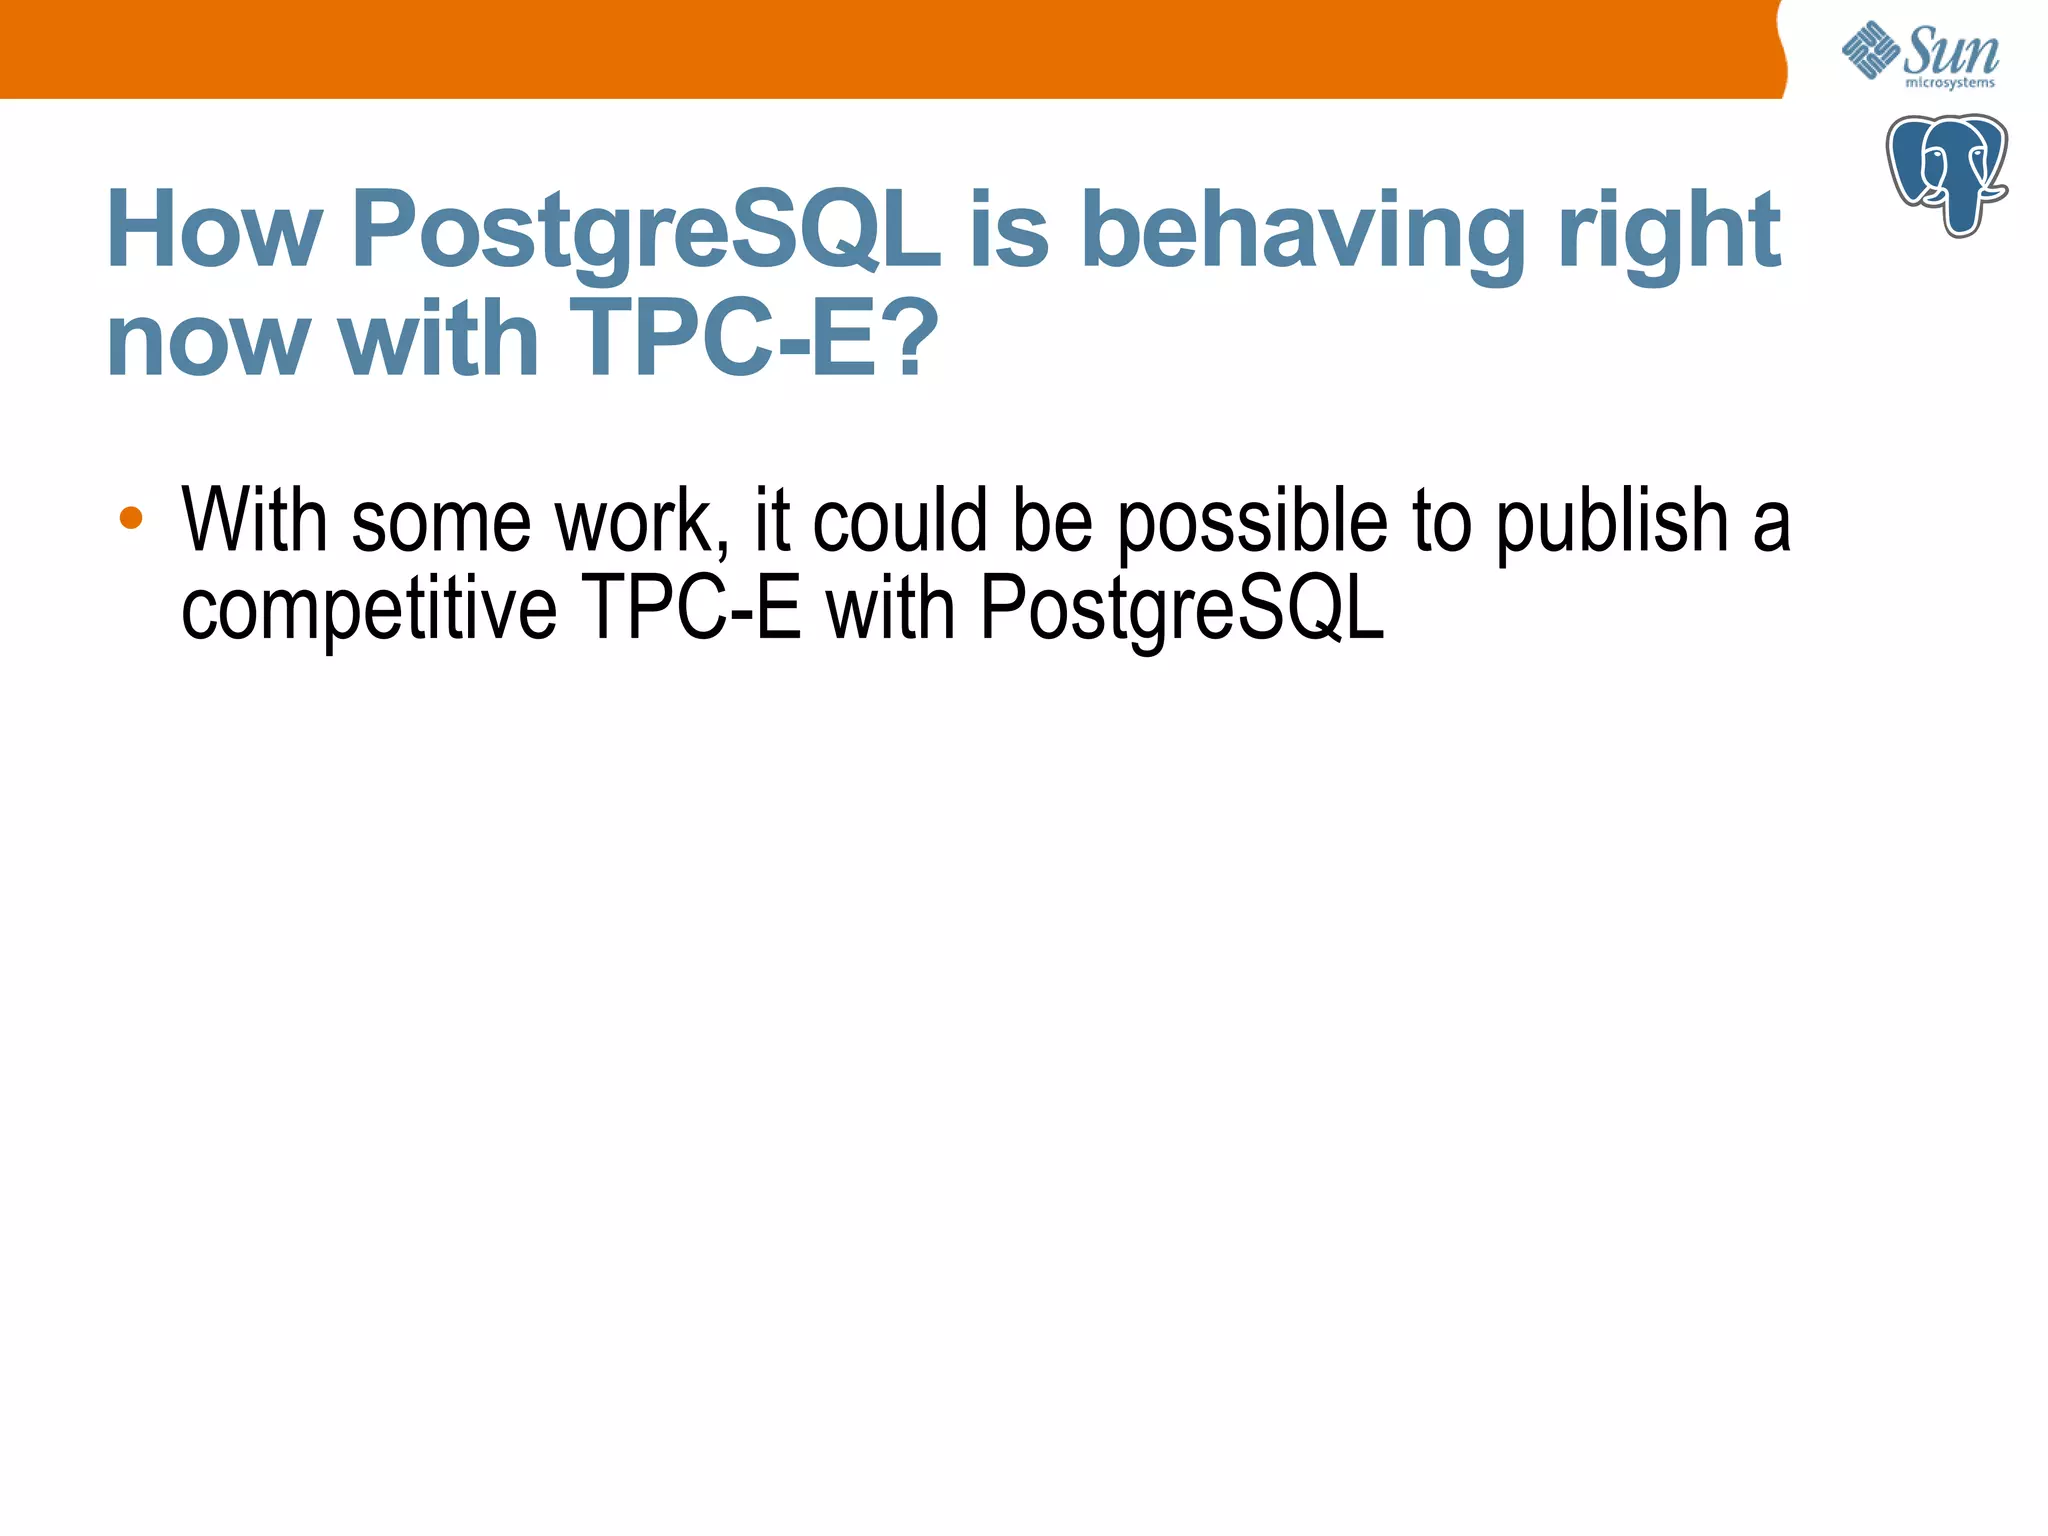
Assessment of PostgreSQL's performance on TPC-E, highlighting current issues and areas for competitive improvement.
Introduction to TPC-H, focusing on its data warehousing support, query environment, and schema characteristics.
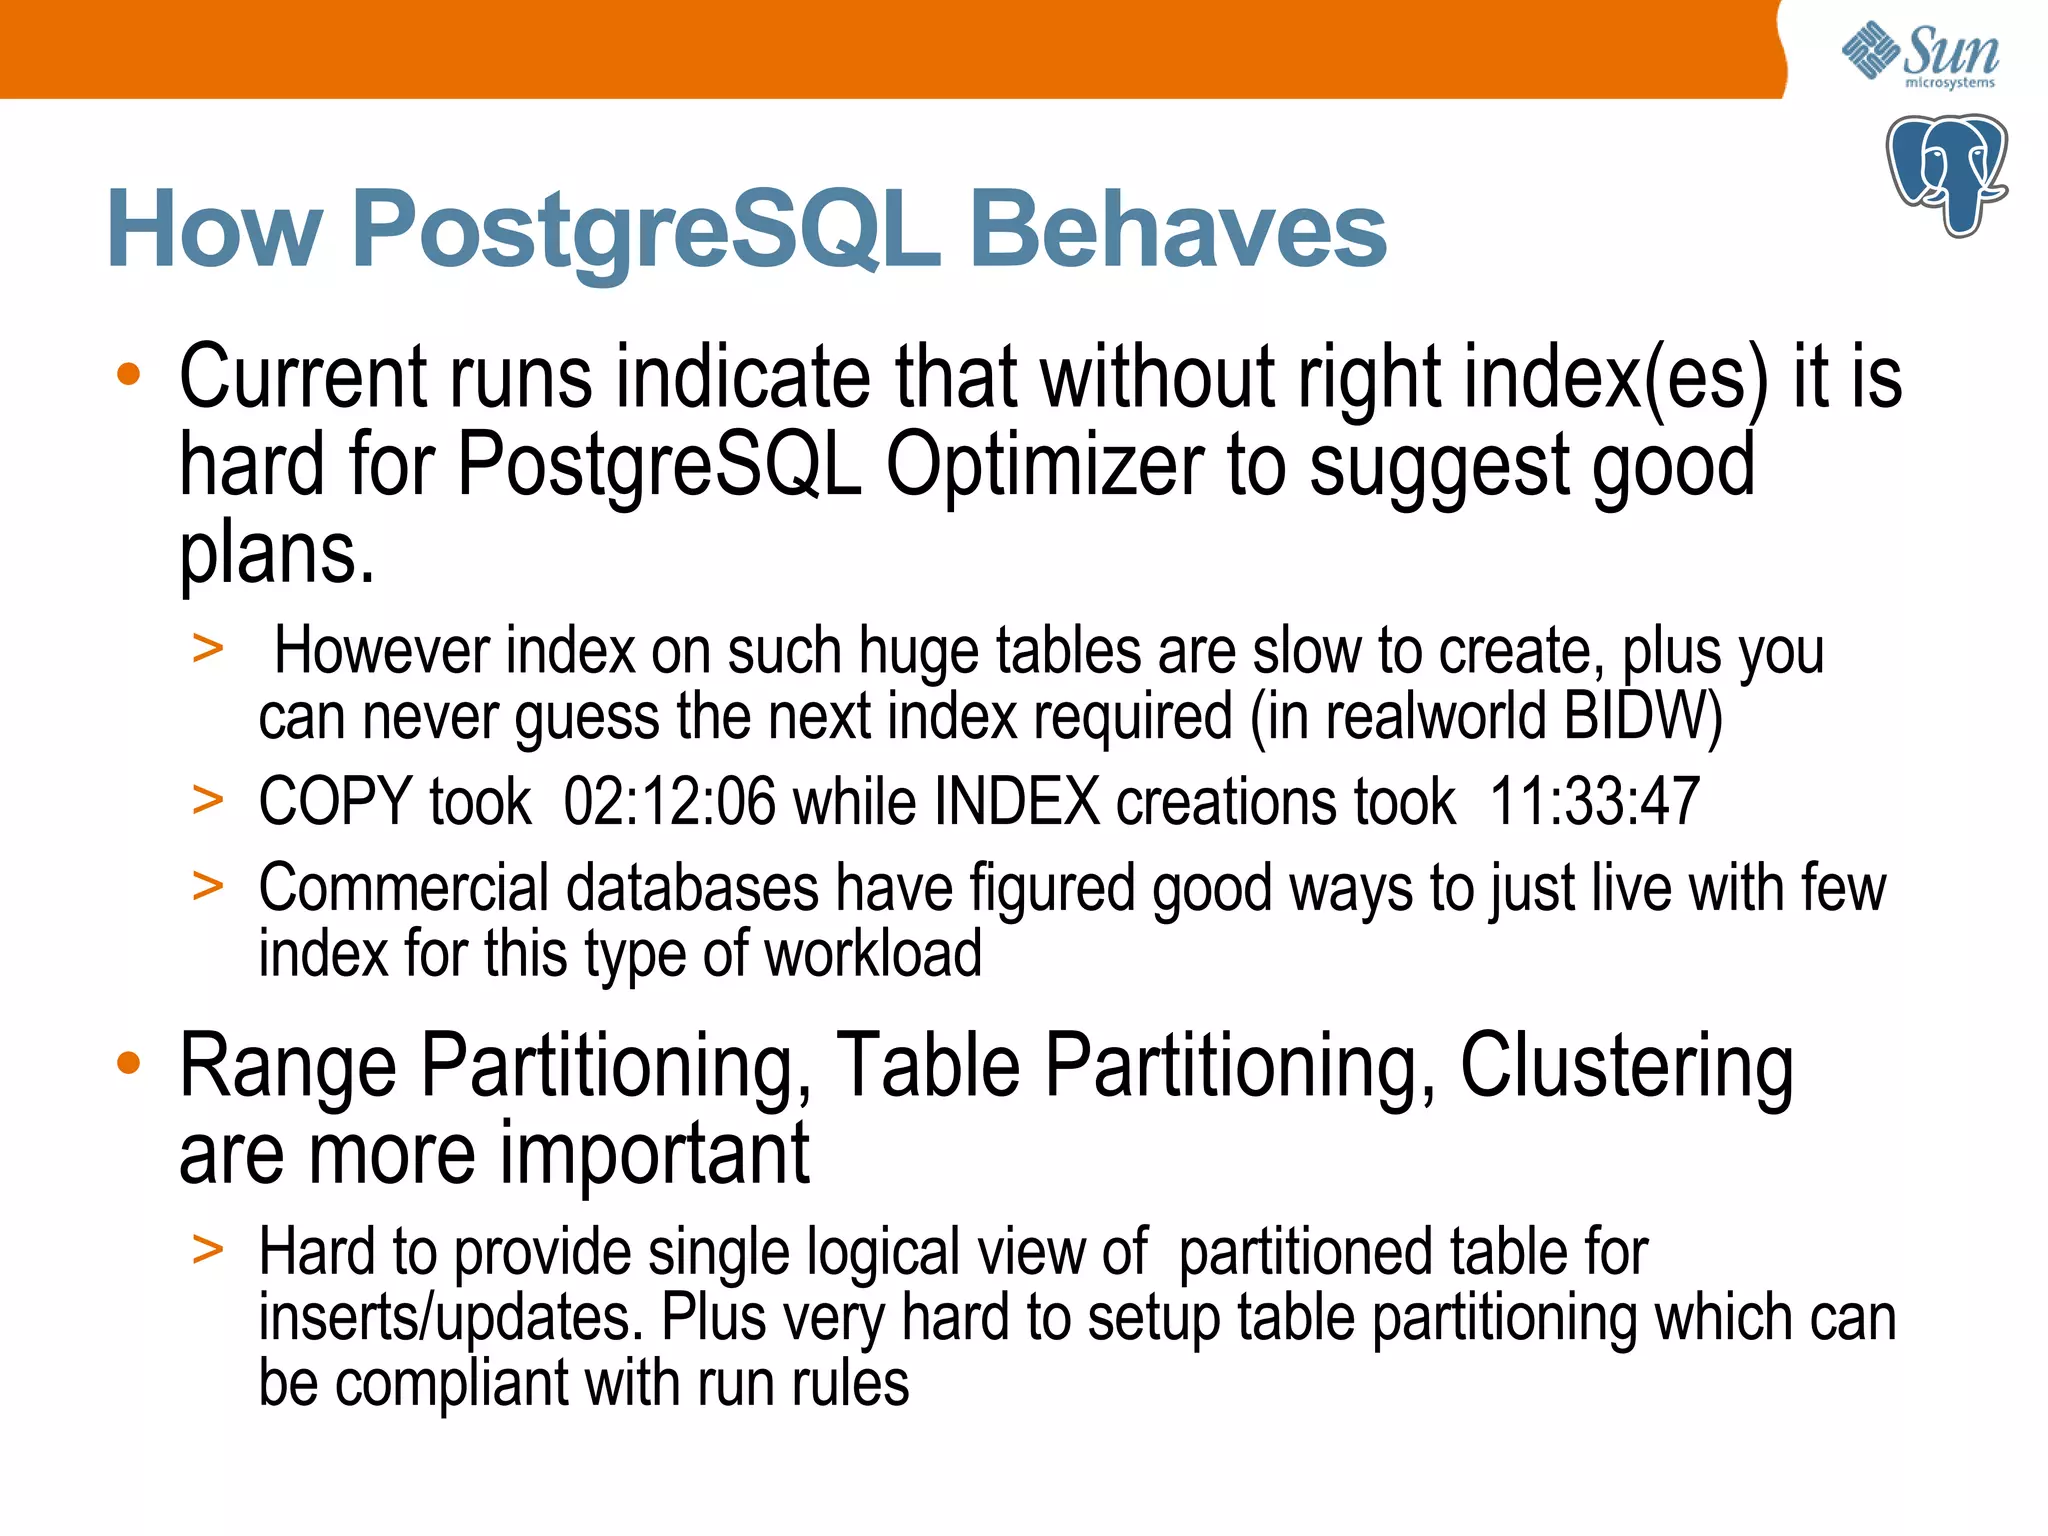
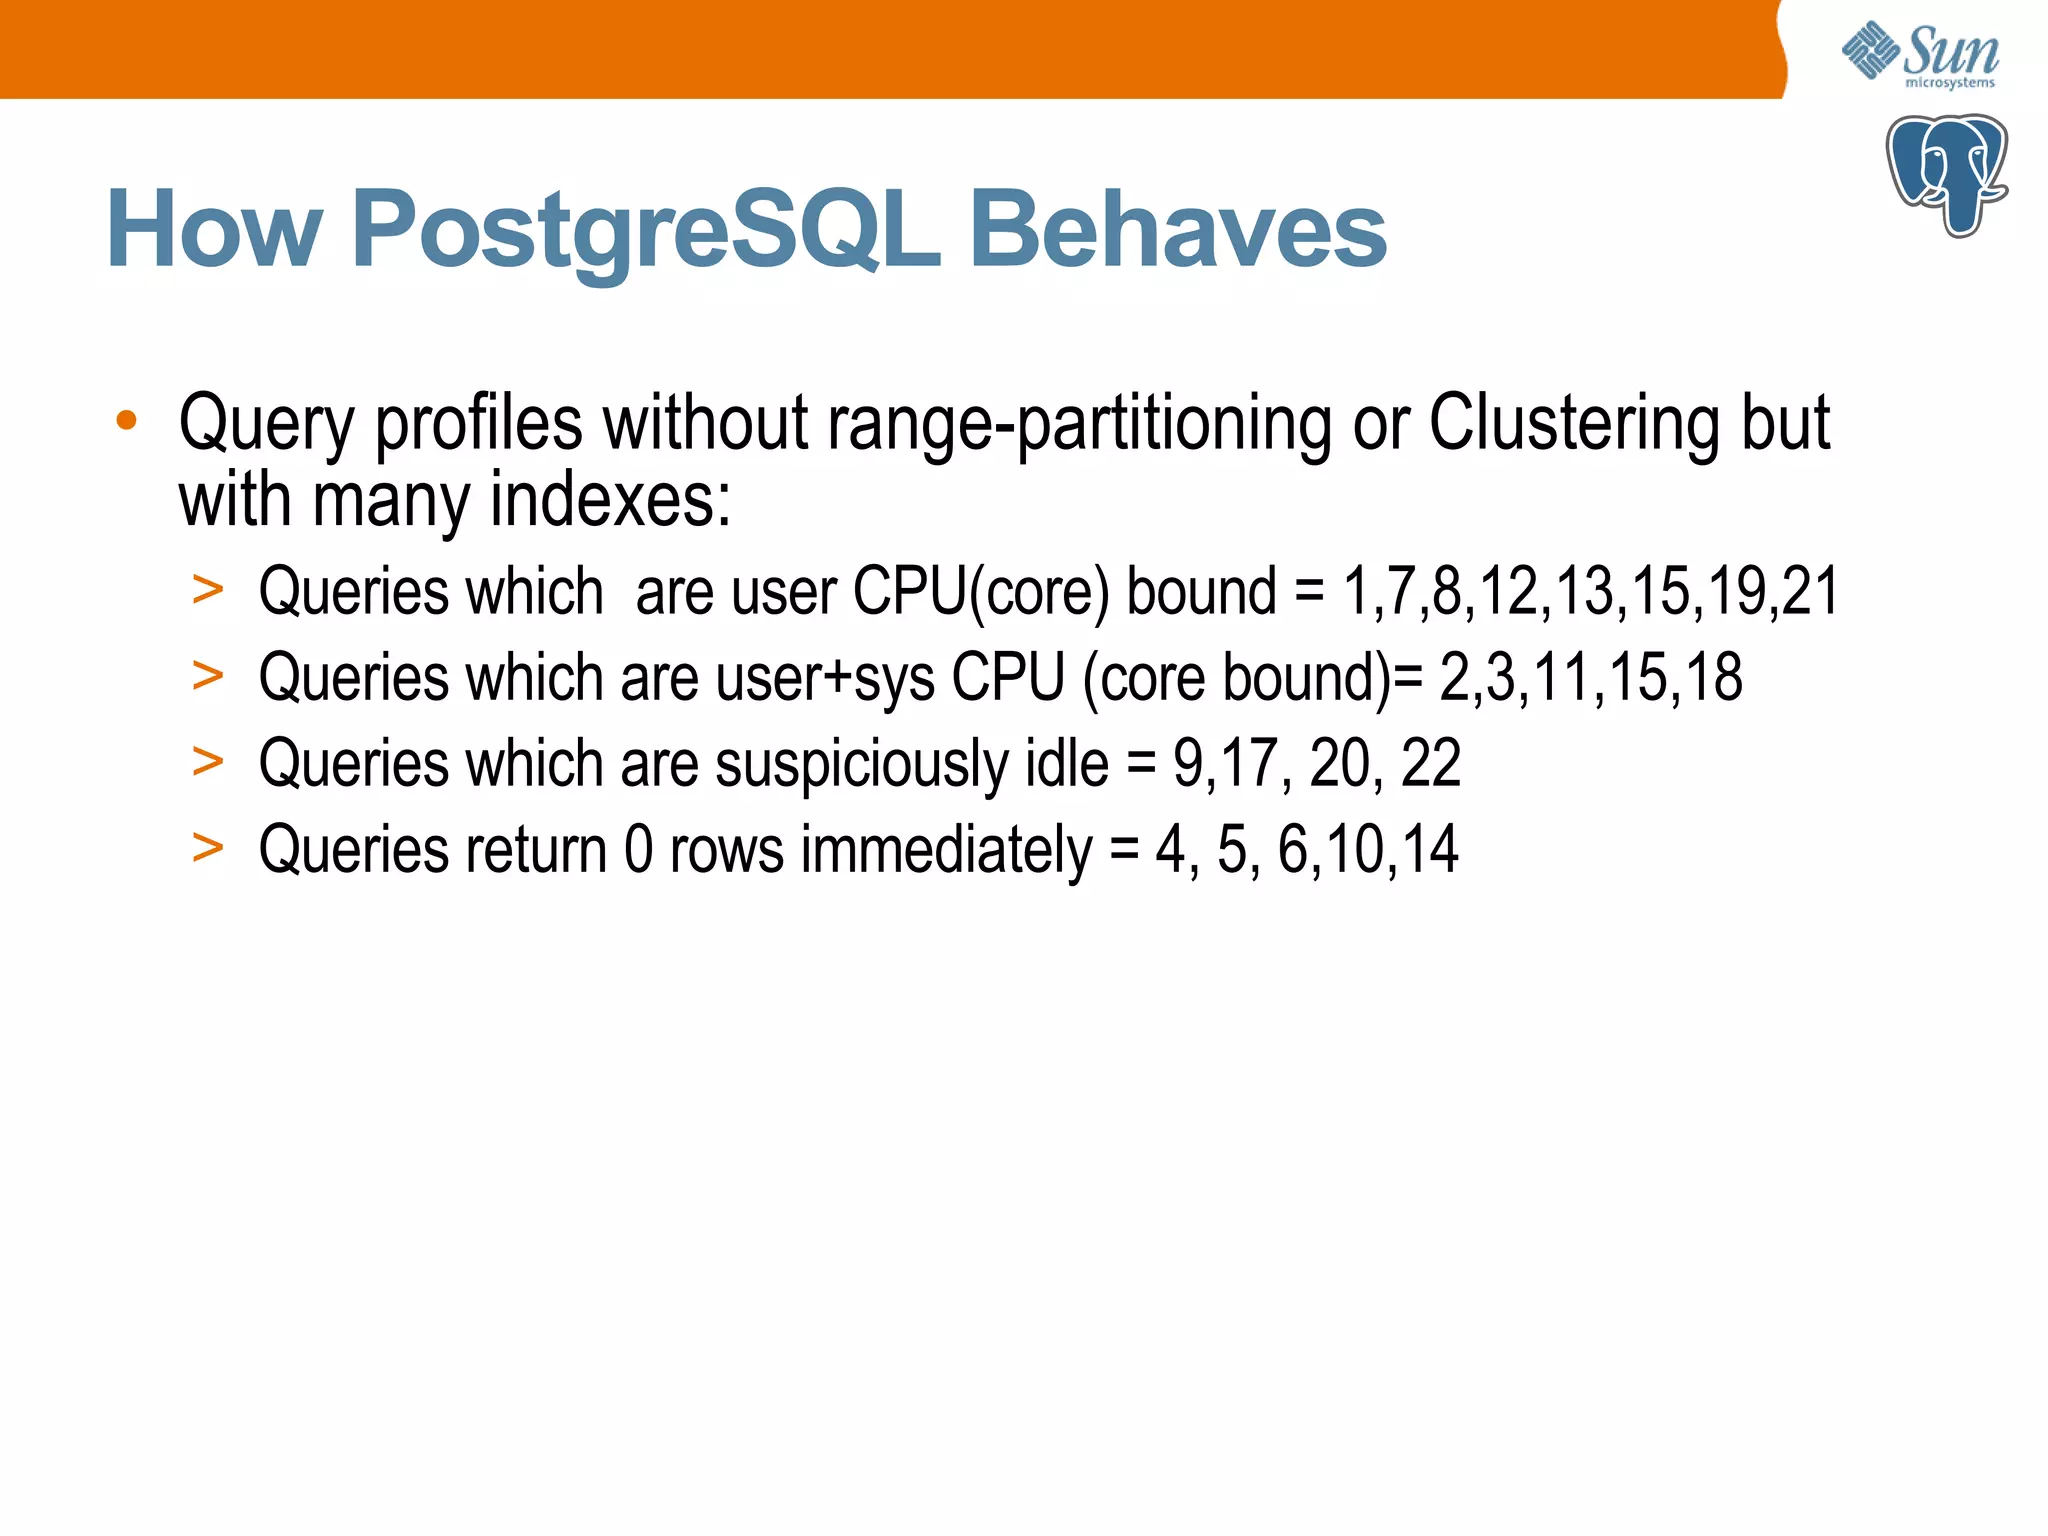
Analysis of PostgreSQL's performance in TPC-H including scaling issues and the importance of indexing and partitioning.
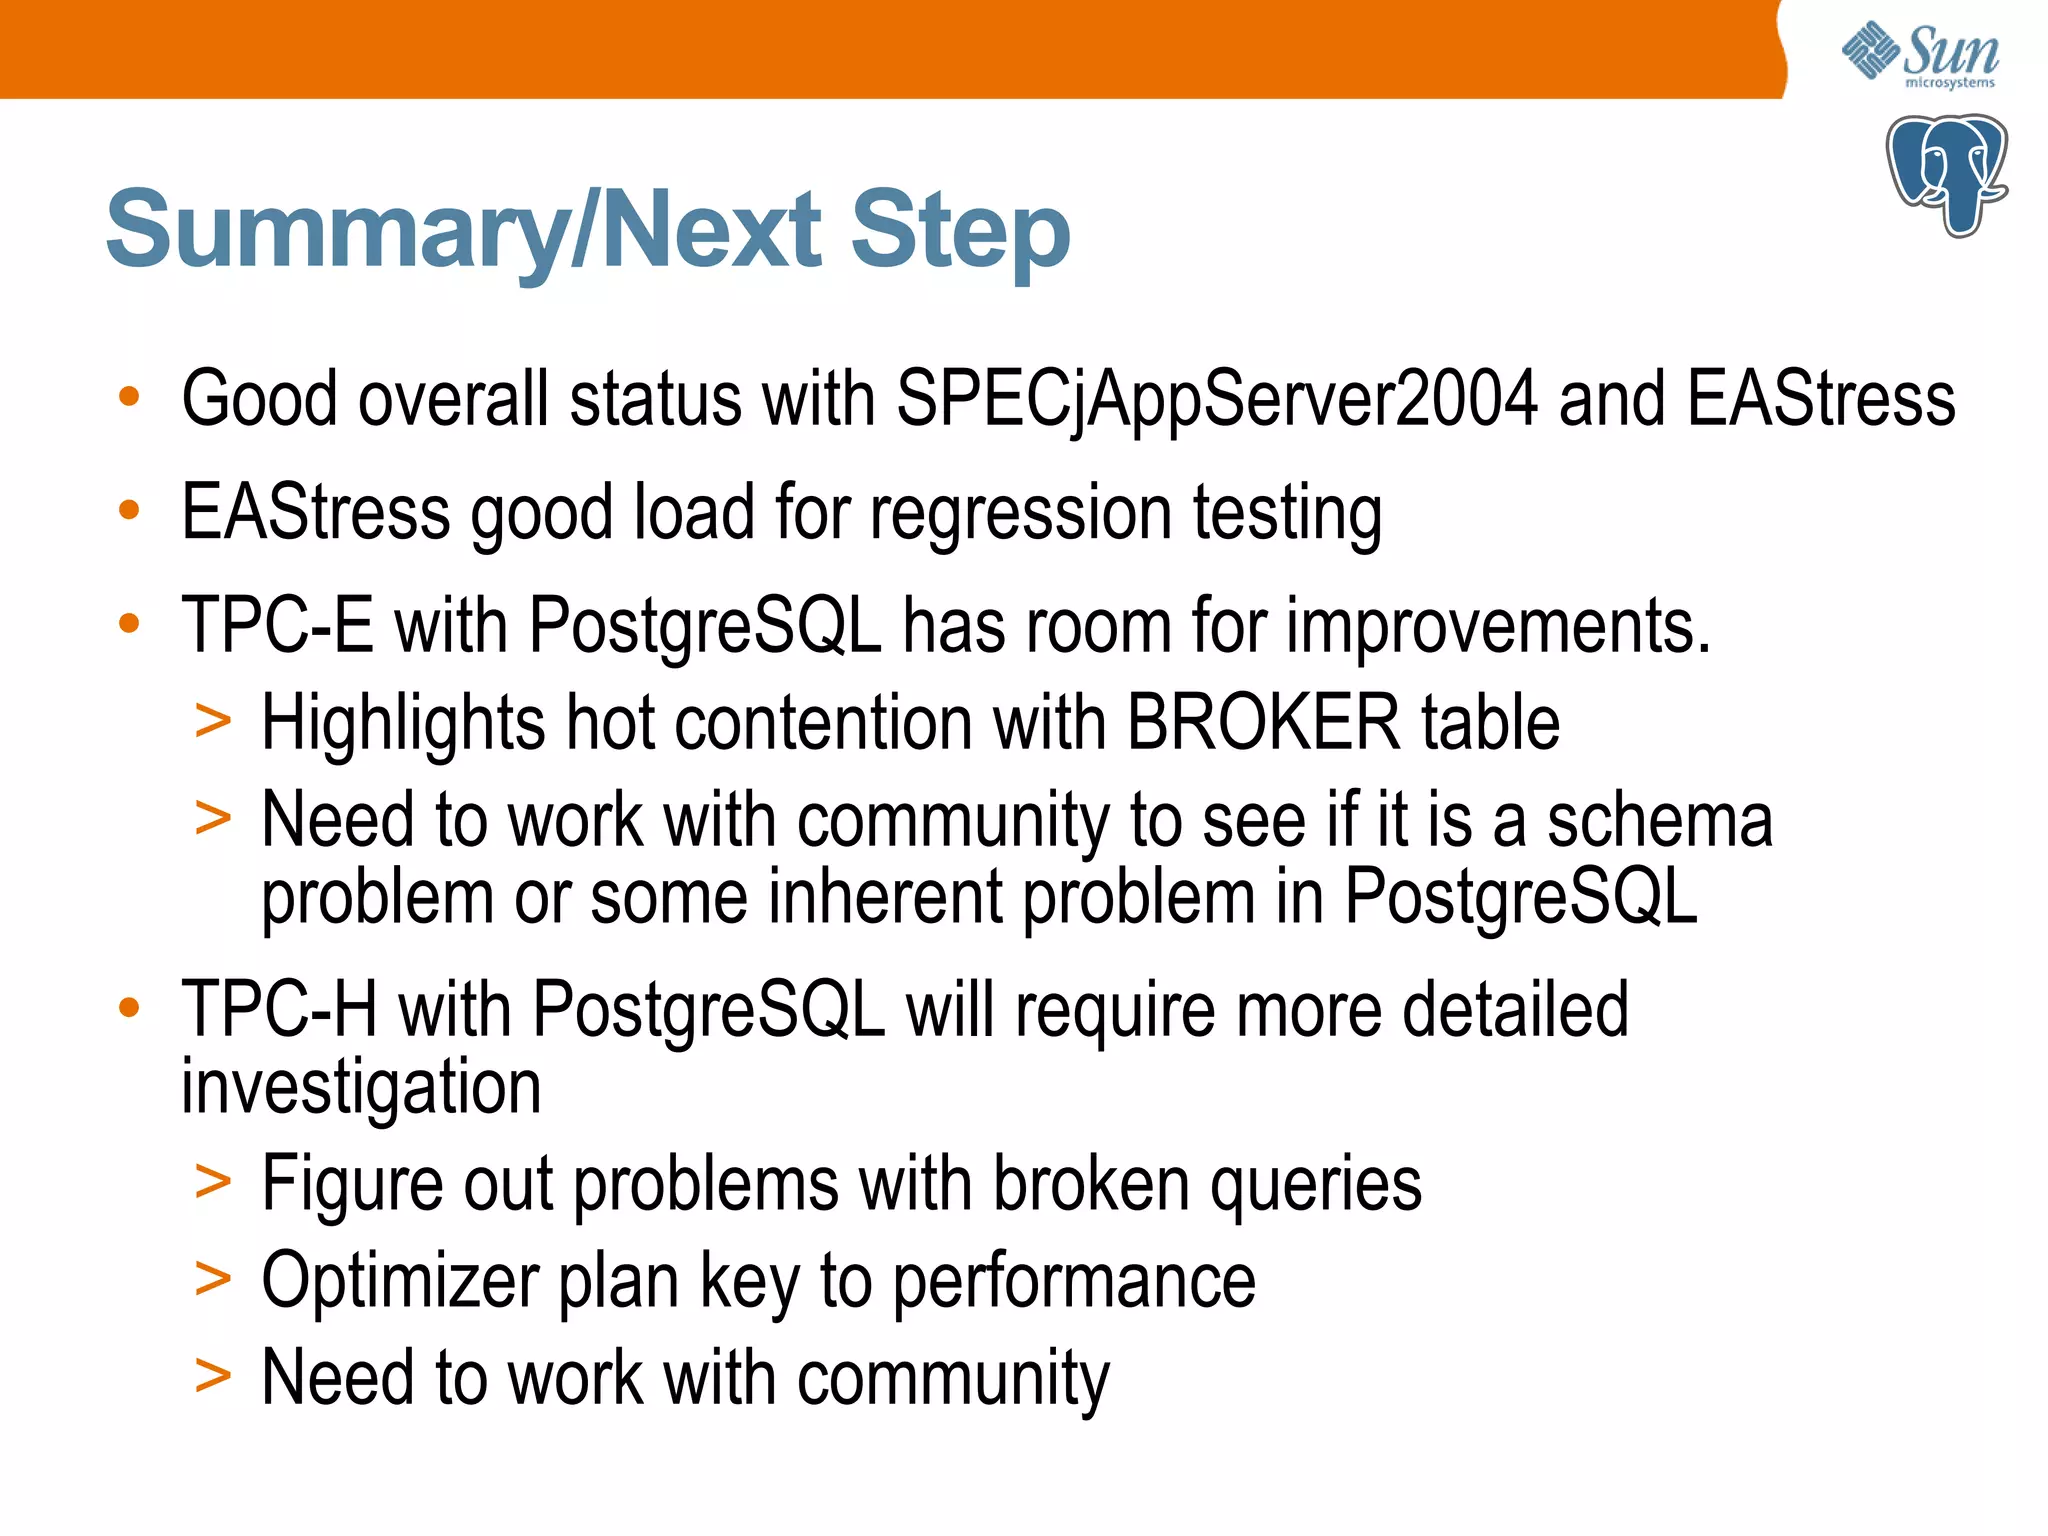
Evaluation of PostgreSQL benchmarks, outlining good performance in SPECjAppServer2004 and areas needing improvements in TPC-E and TPC-H.
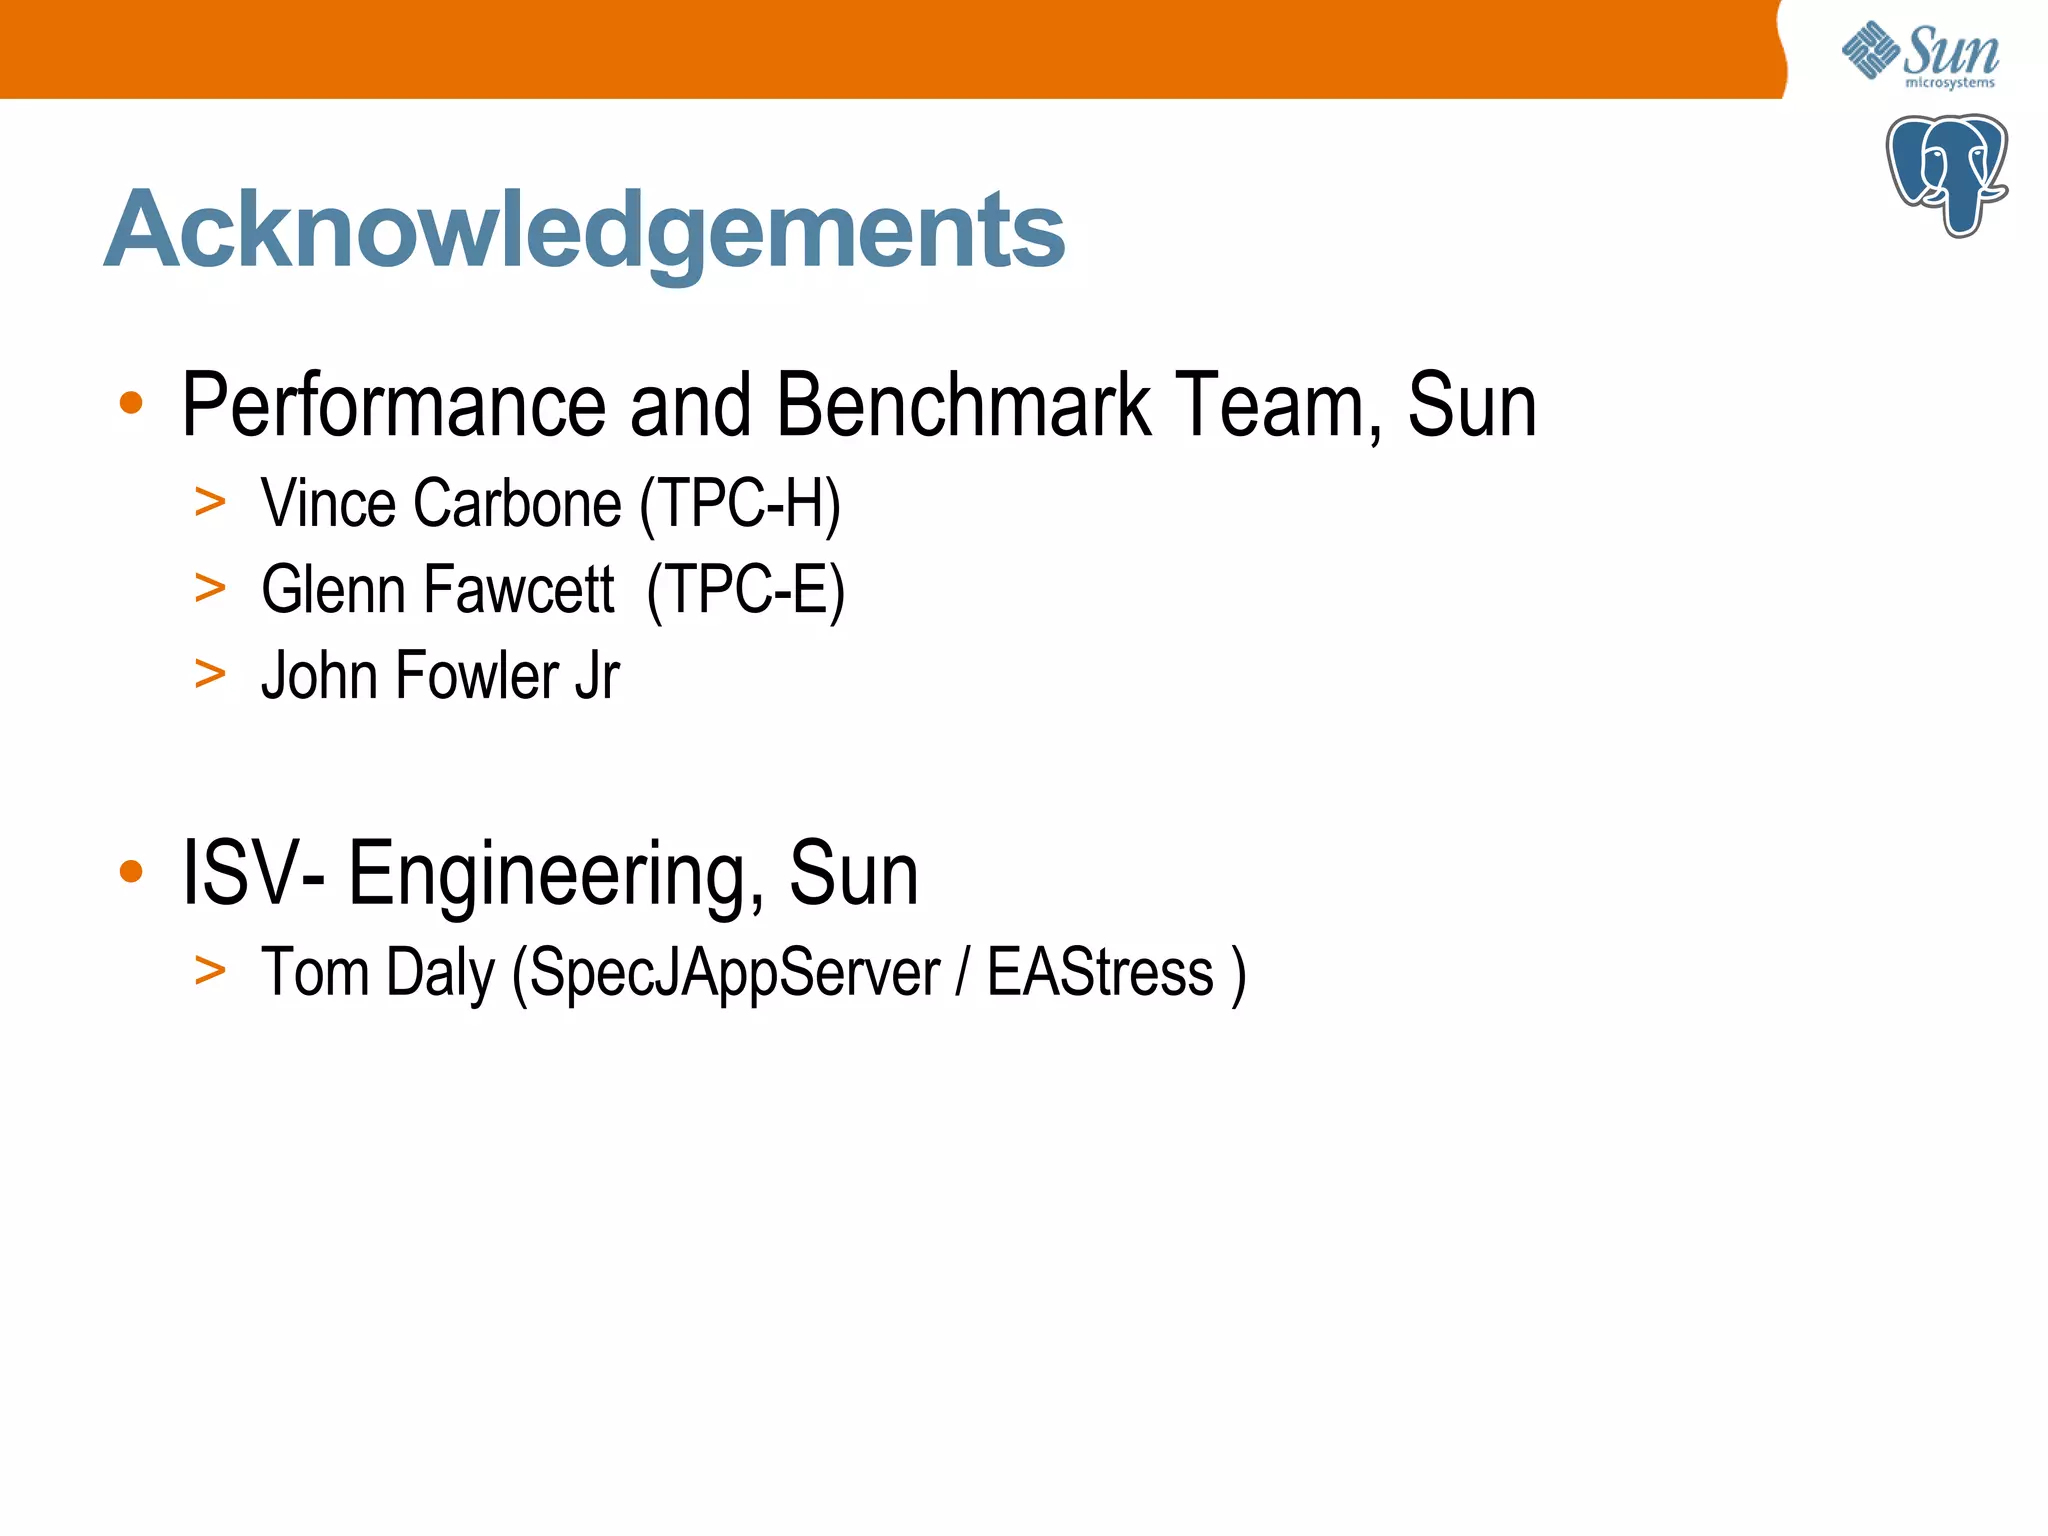
Credit to contributors from Sun Microsystems' Performance and Benchmark Team for their efforts in benchmarking.
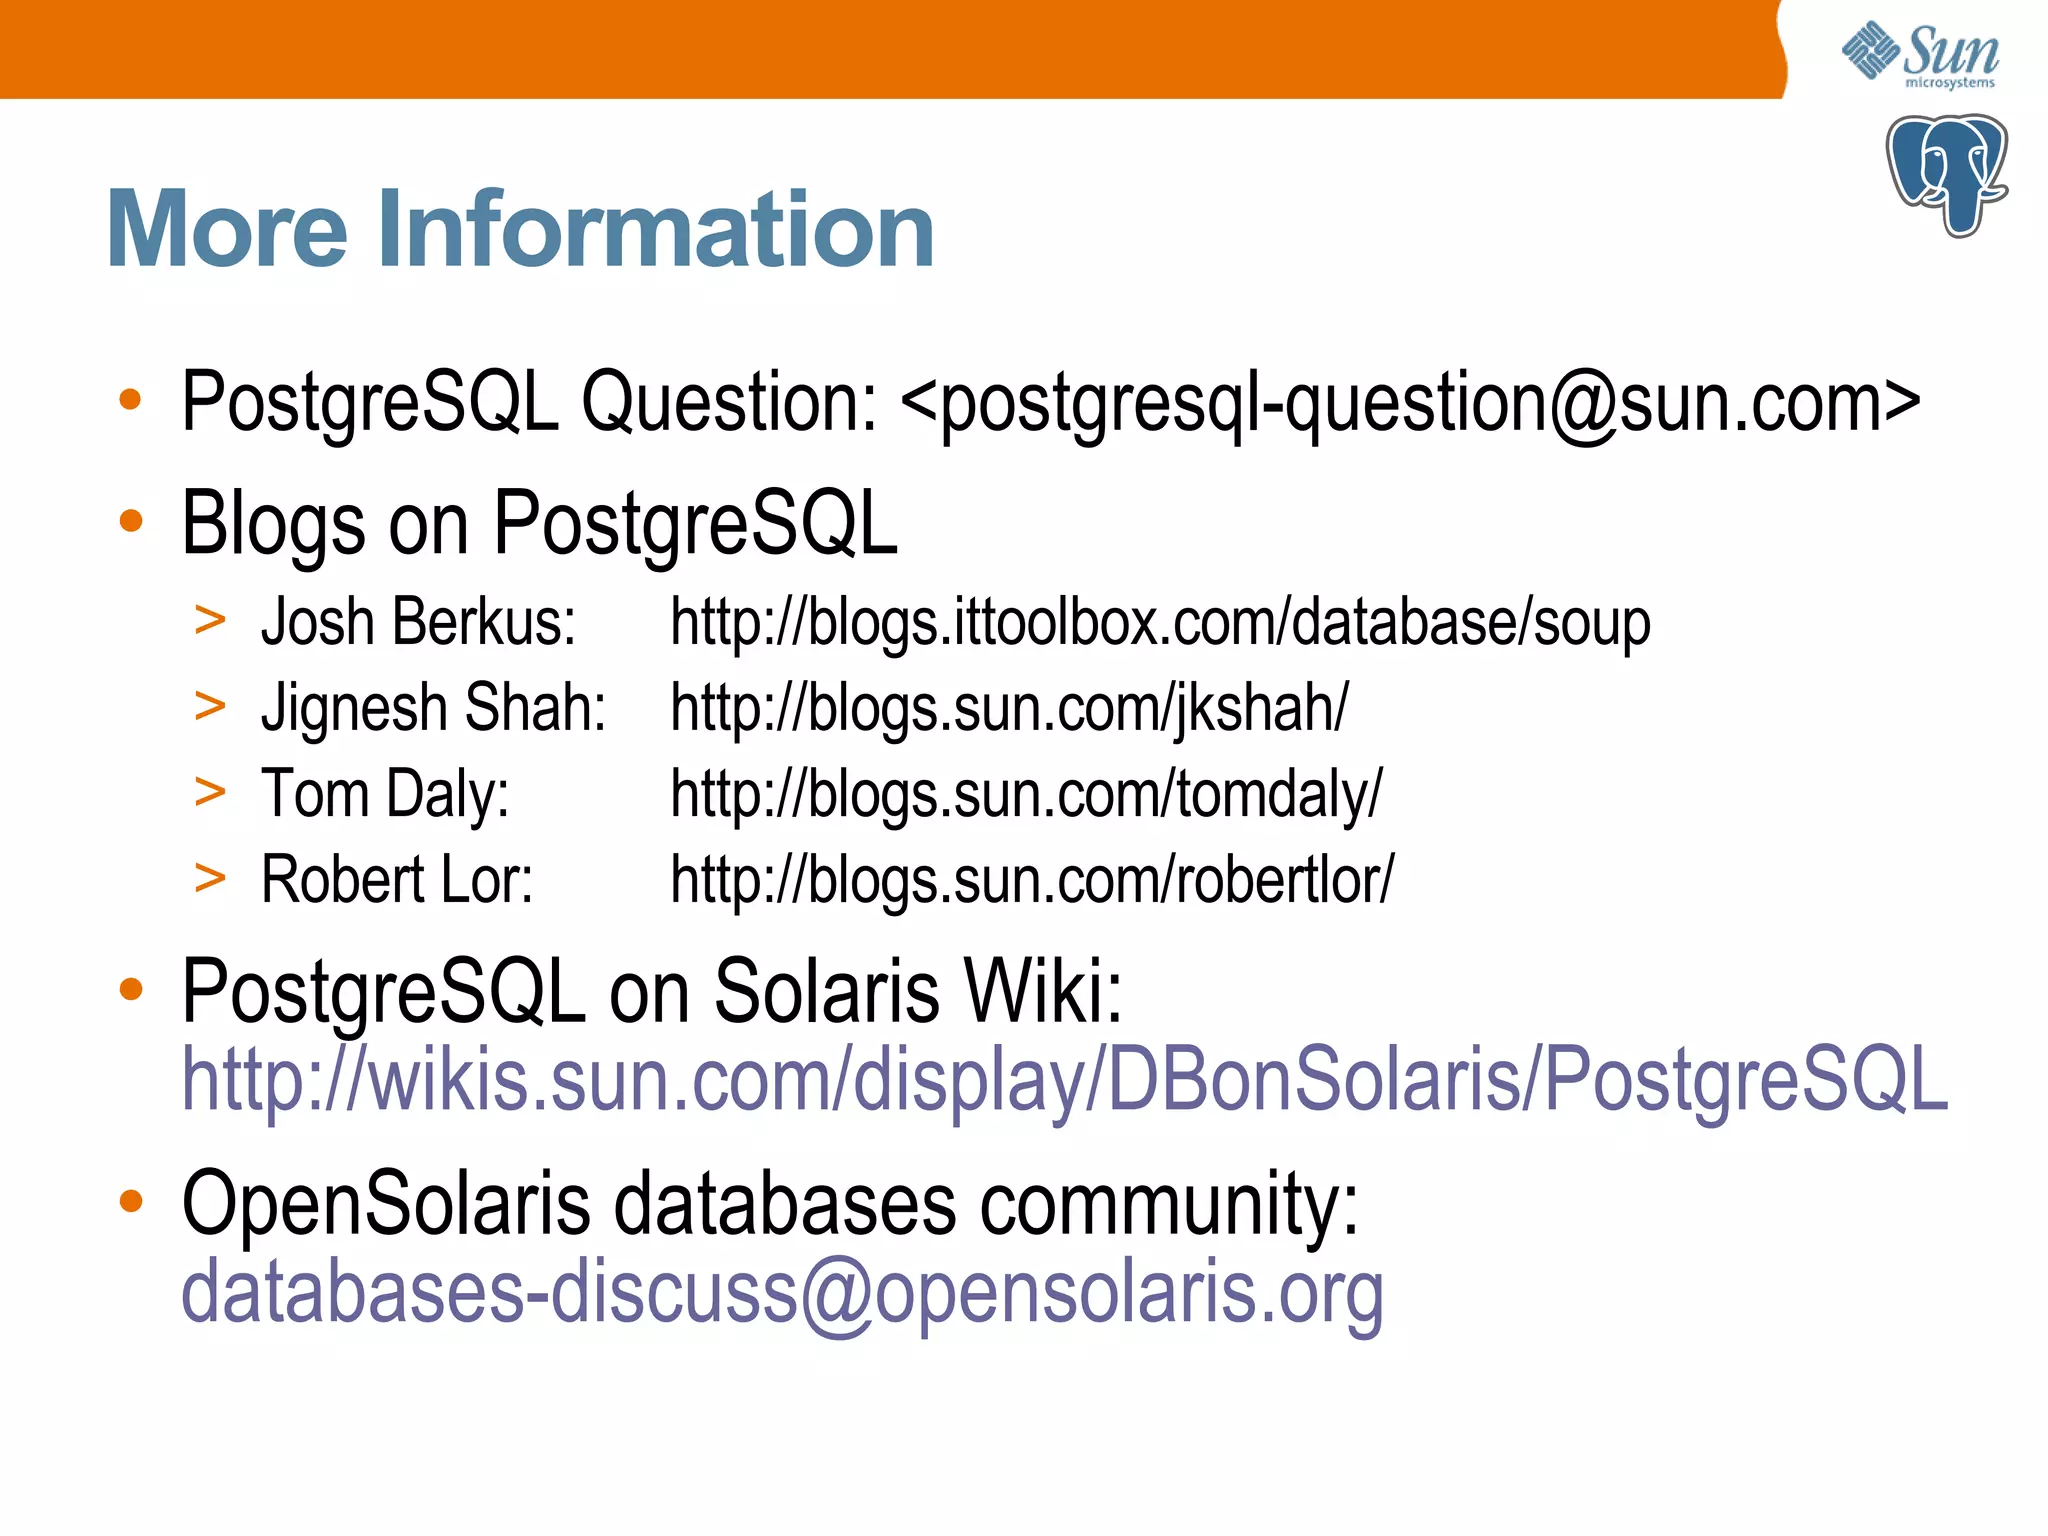
Contact information, blogs, and community resources for PostgreSQL, encouraging engagement and further inquiry.
Dedicated time for audience questions and clarifications following the presentation.
Extra slides providing detailed information to support the primary content of the presentation.
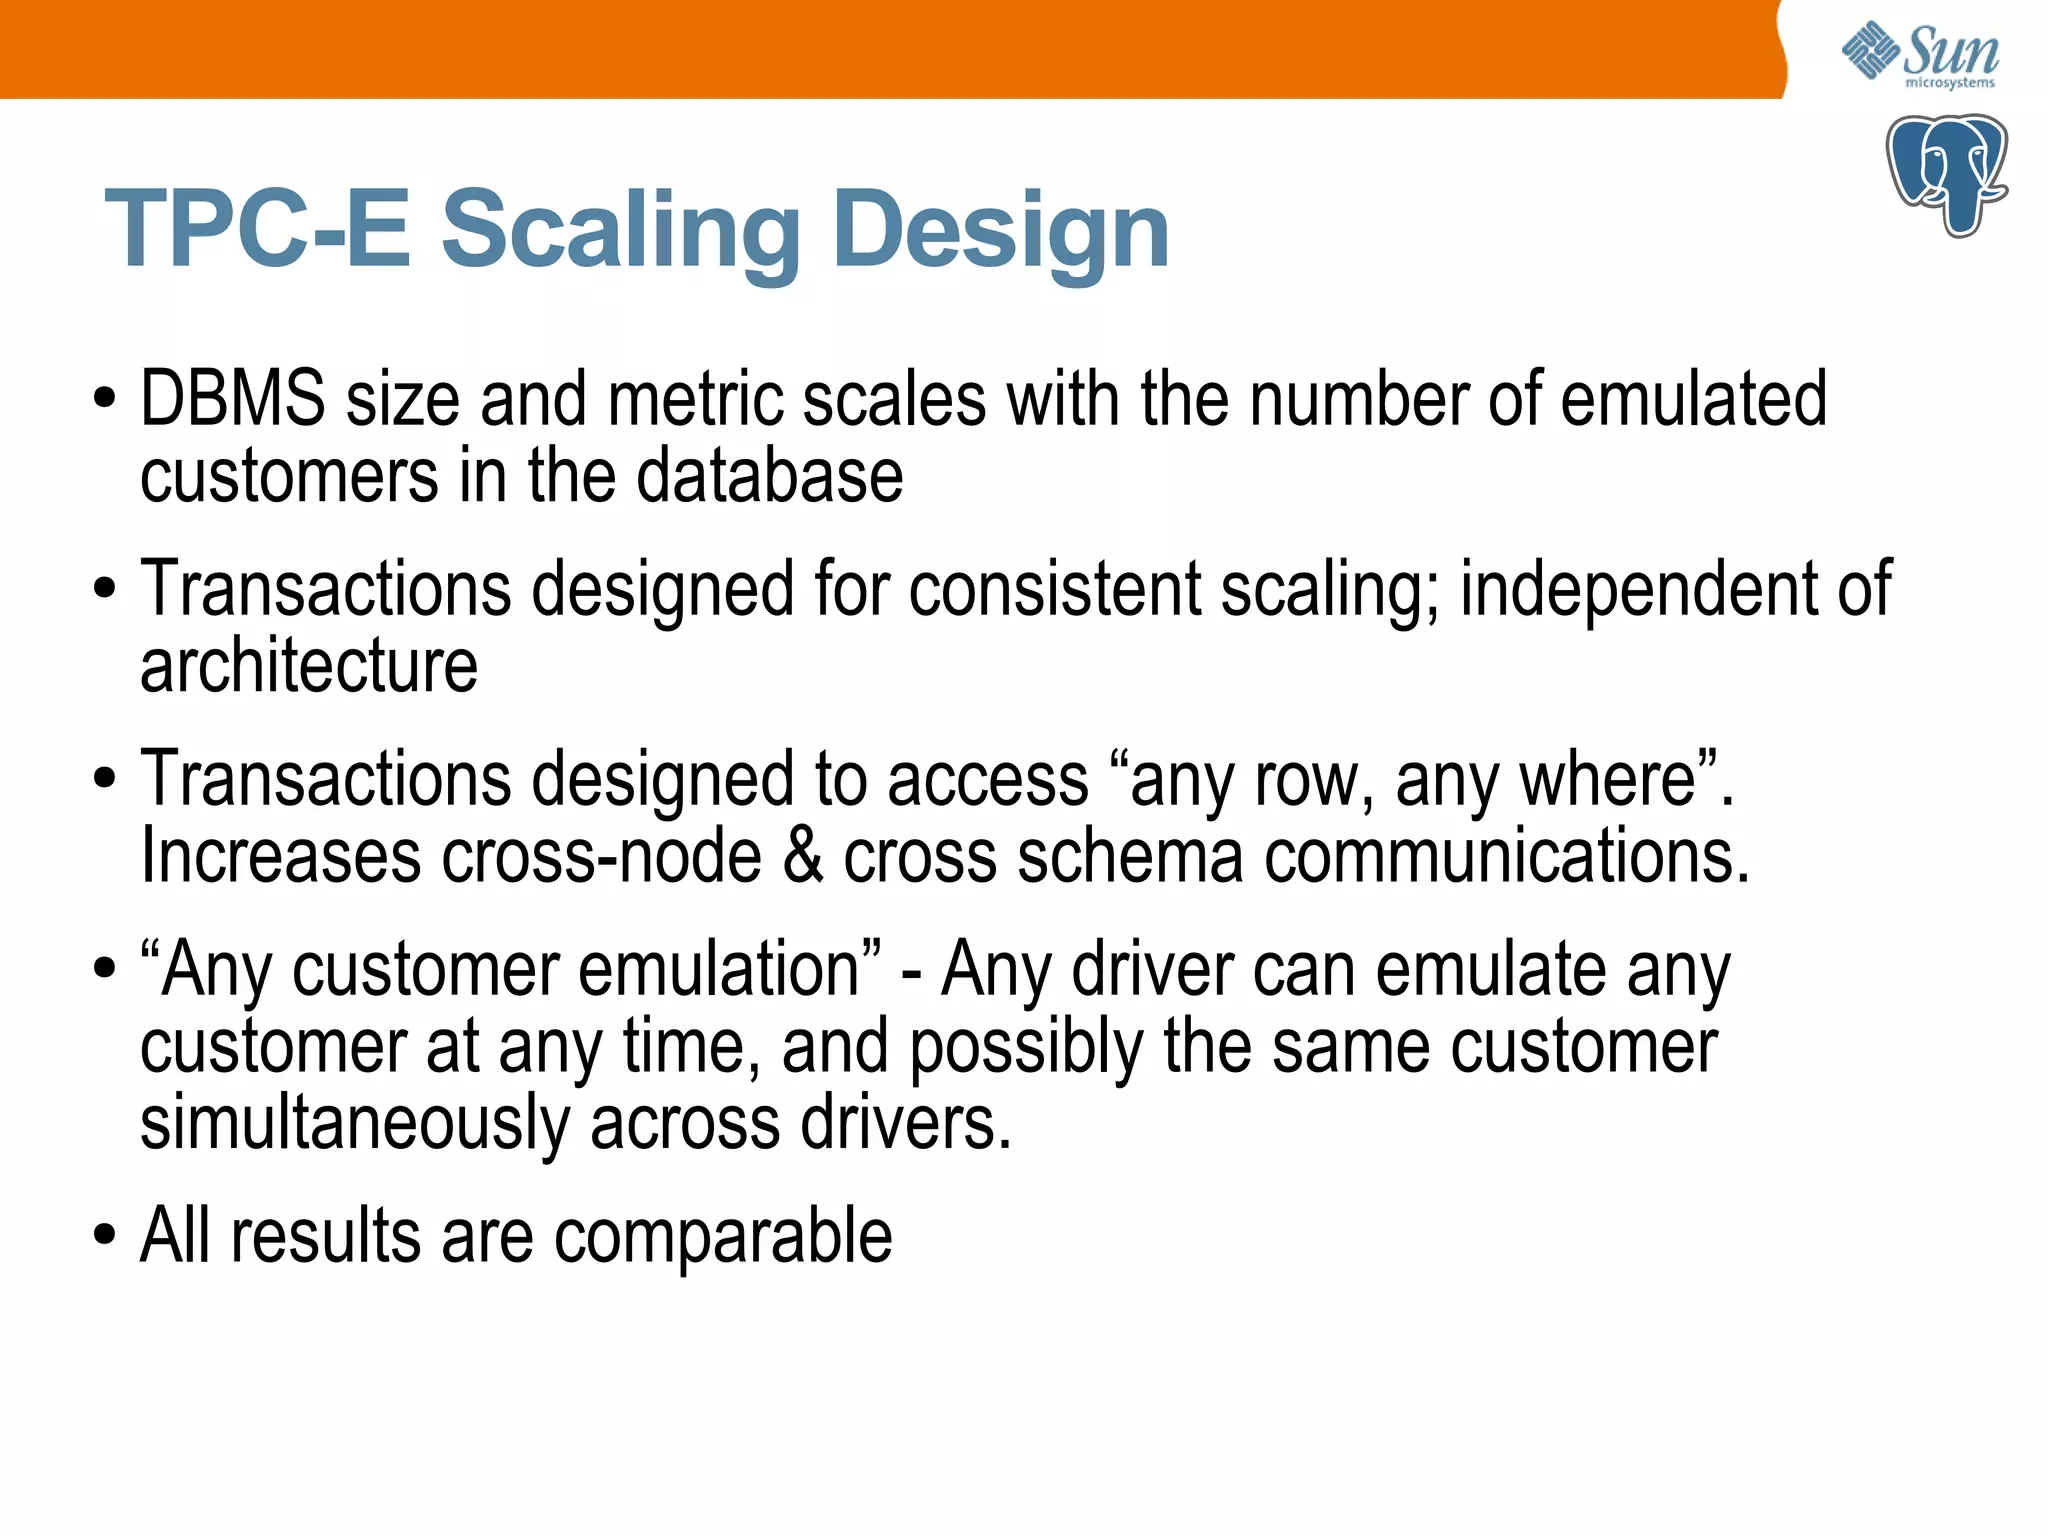
Description of TPC-E scaling design, explaining how metrics scale with database size and customer emulation.
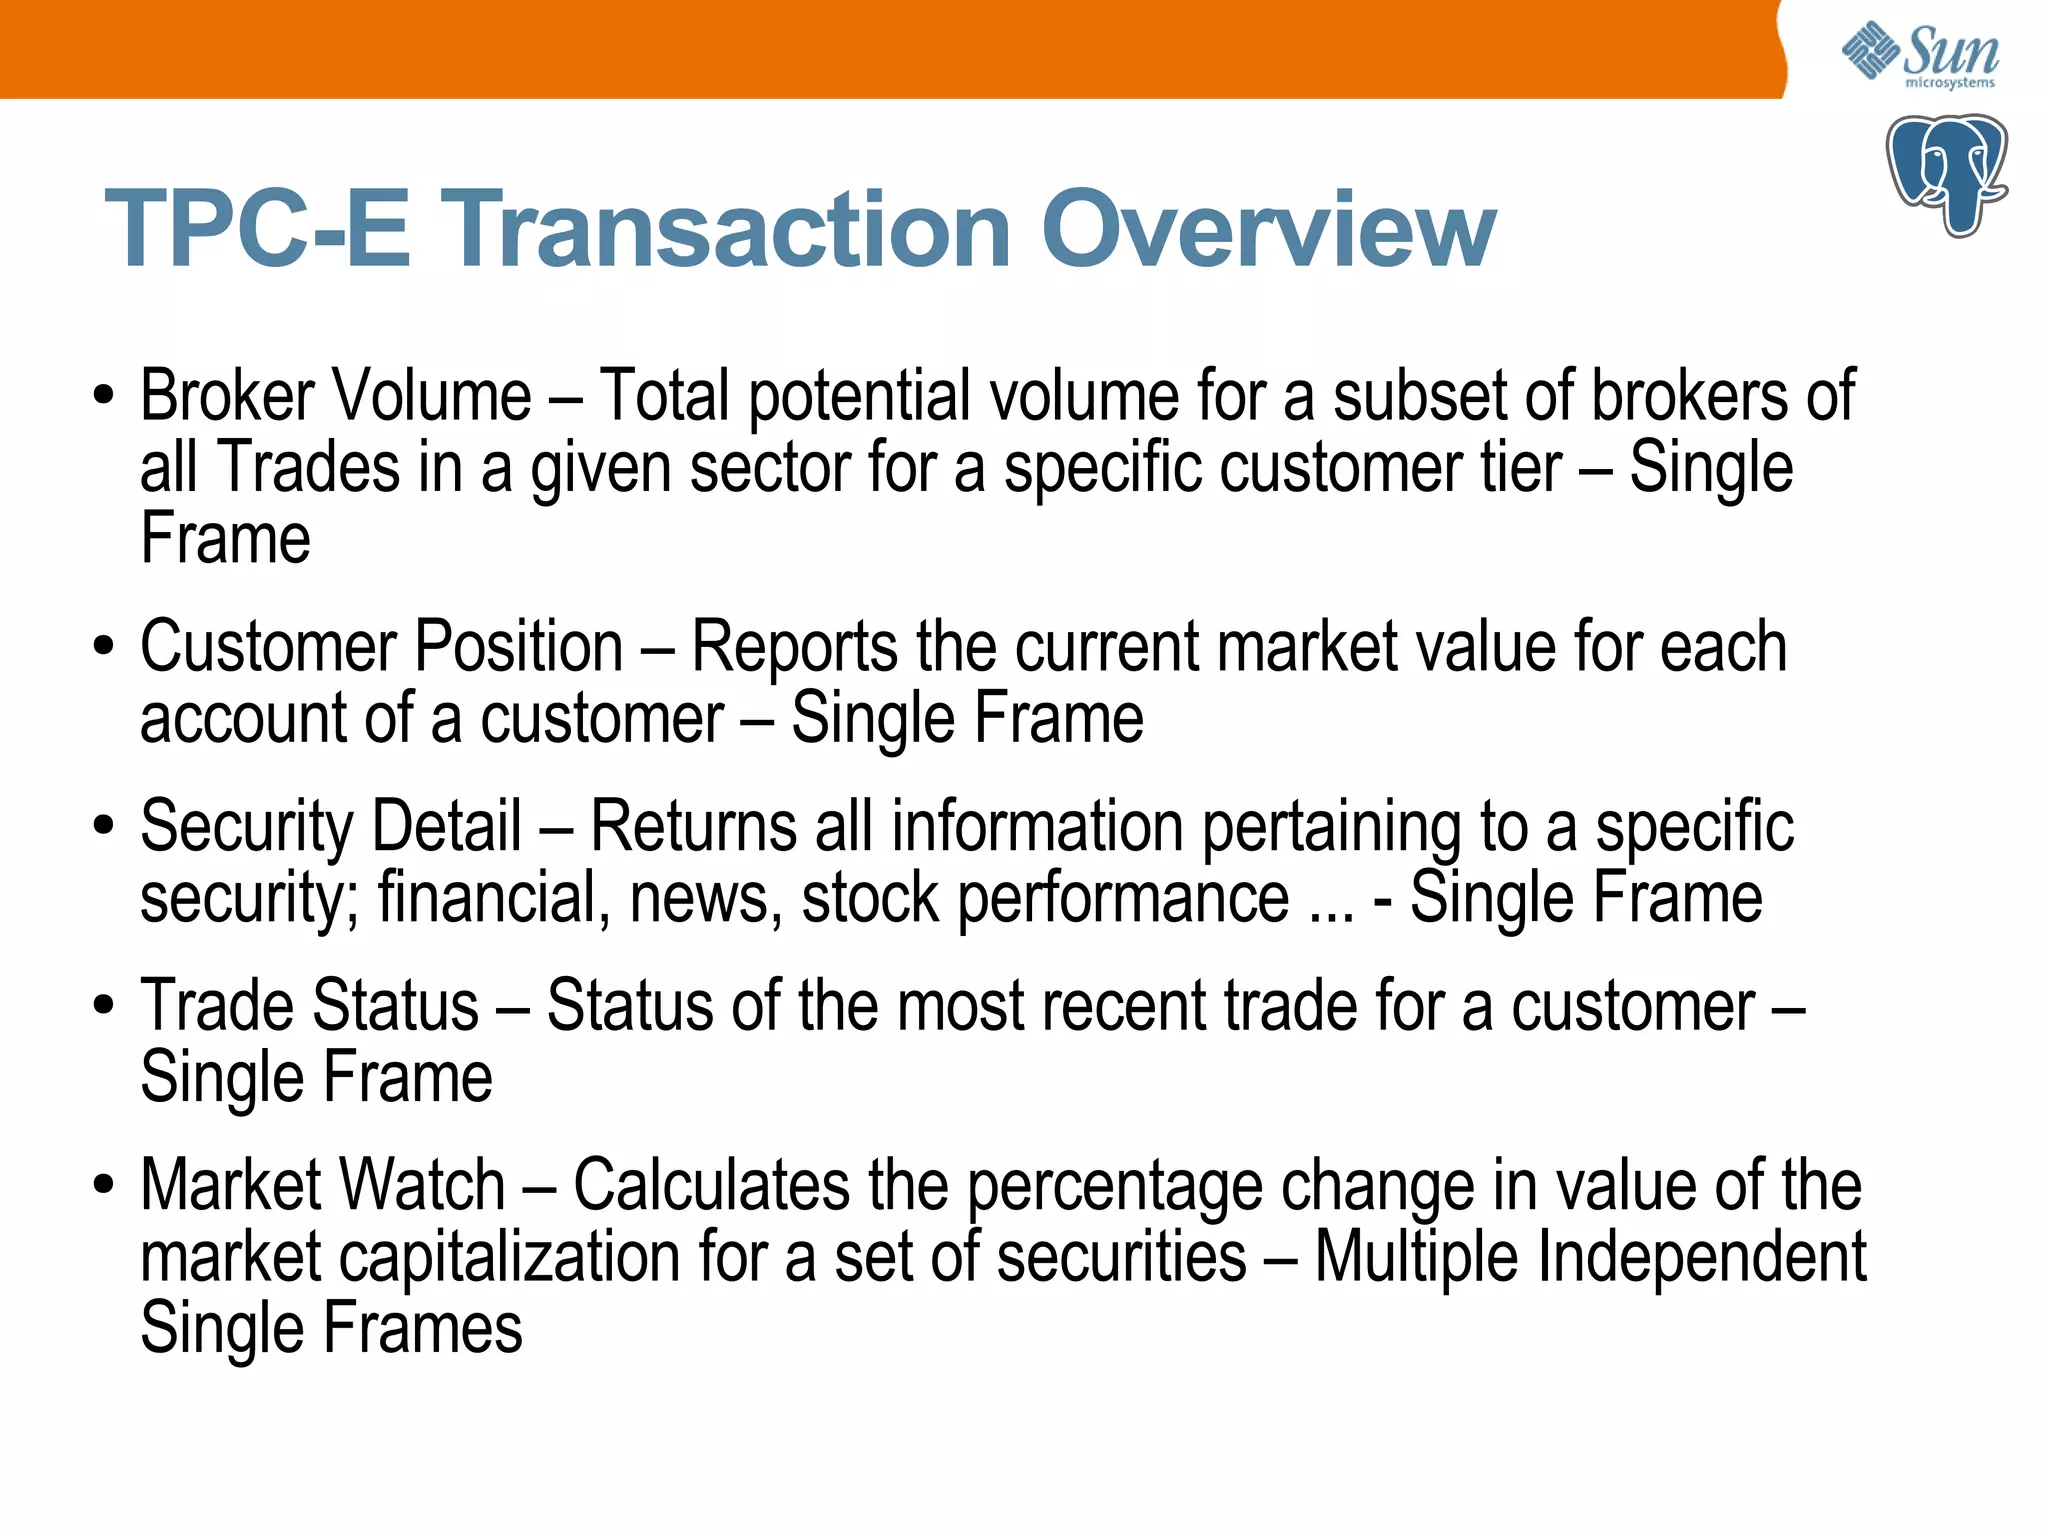
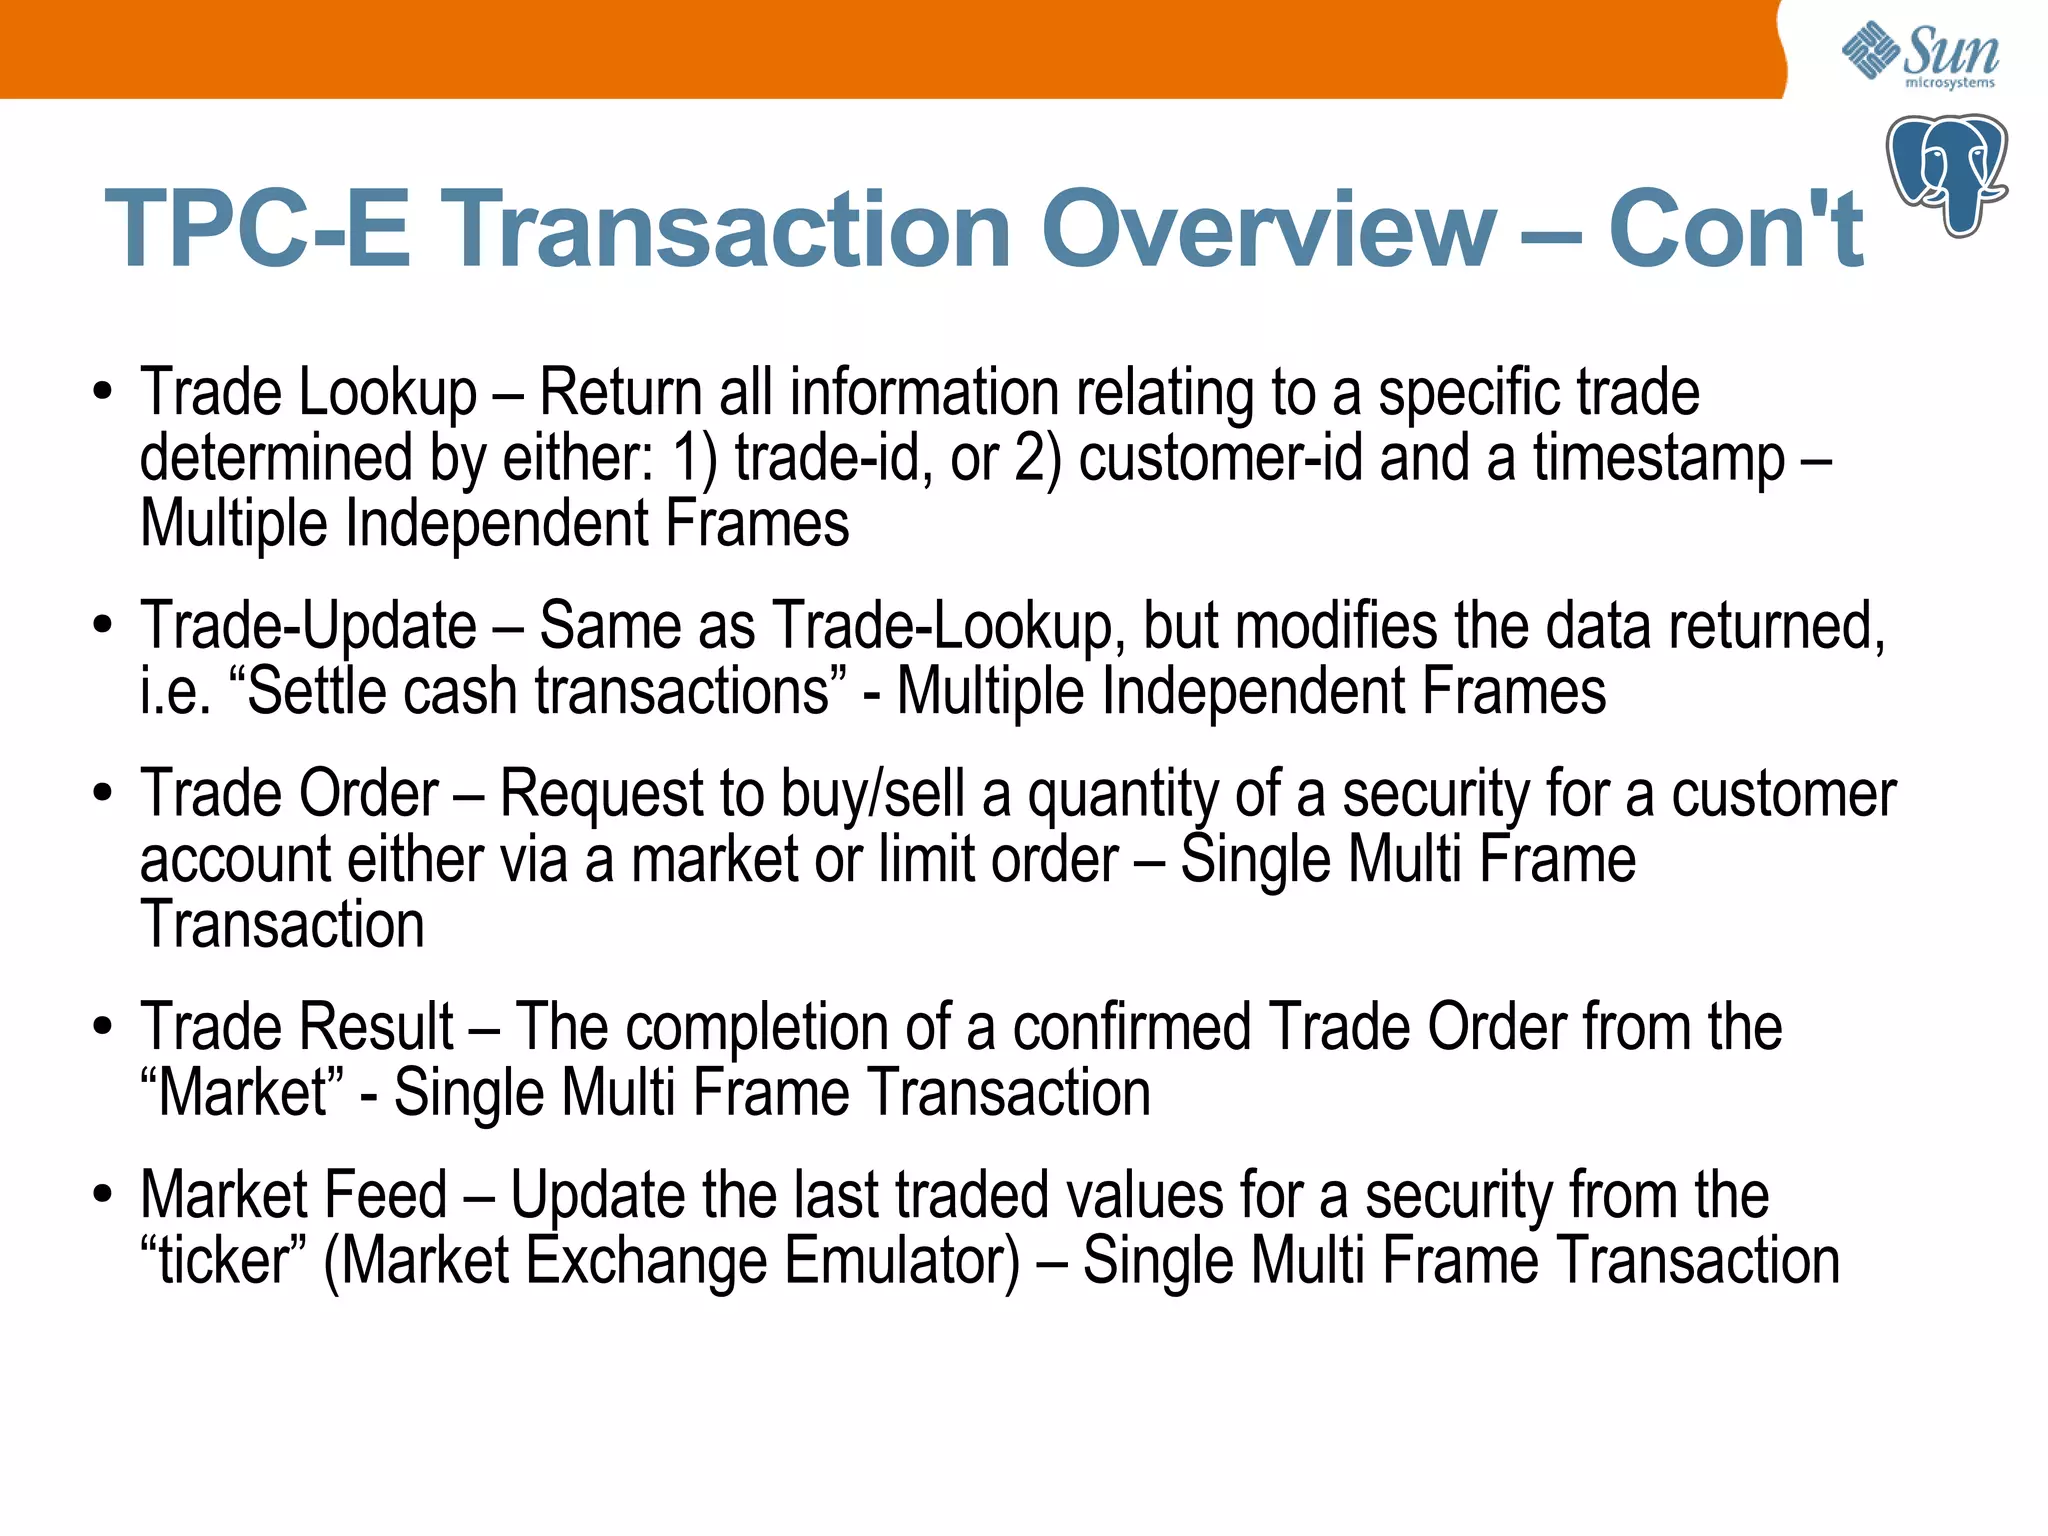
Overview of key transactions in TPC-E, detailing customer interactions and trade processes.
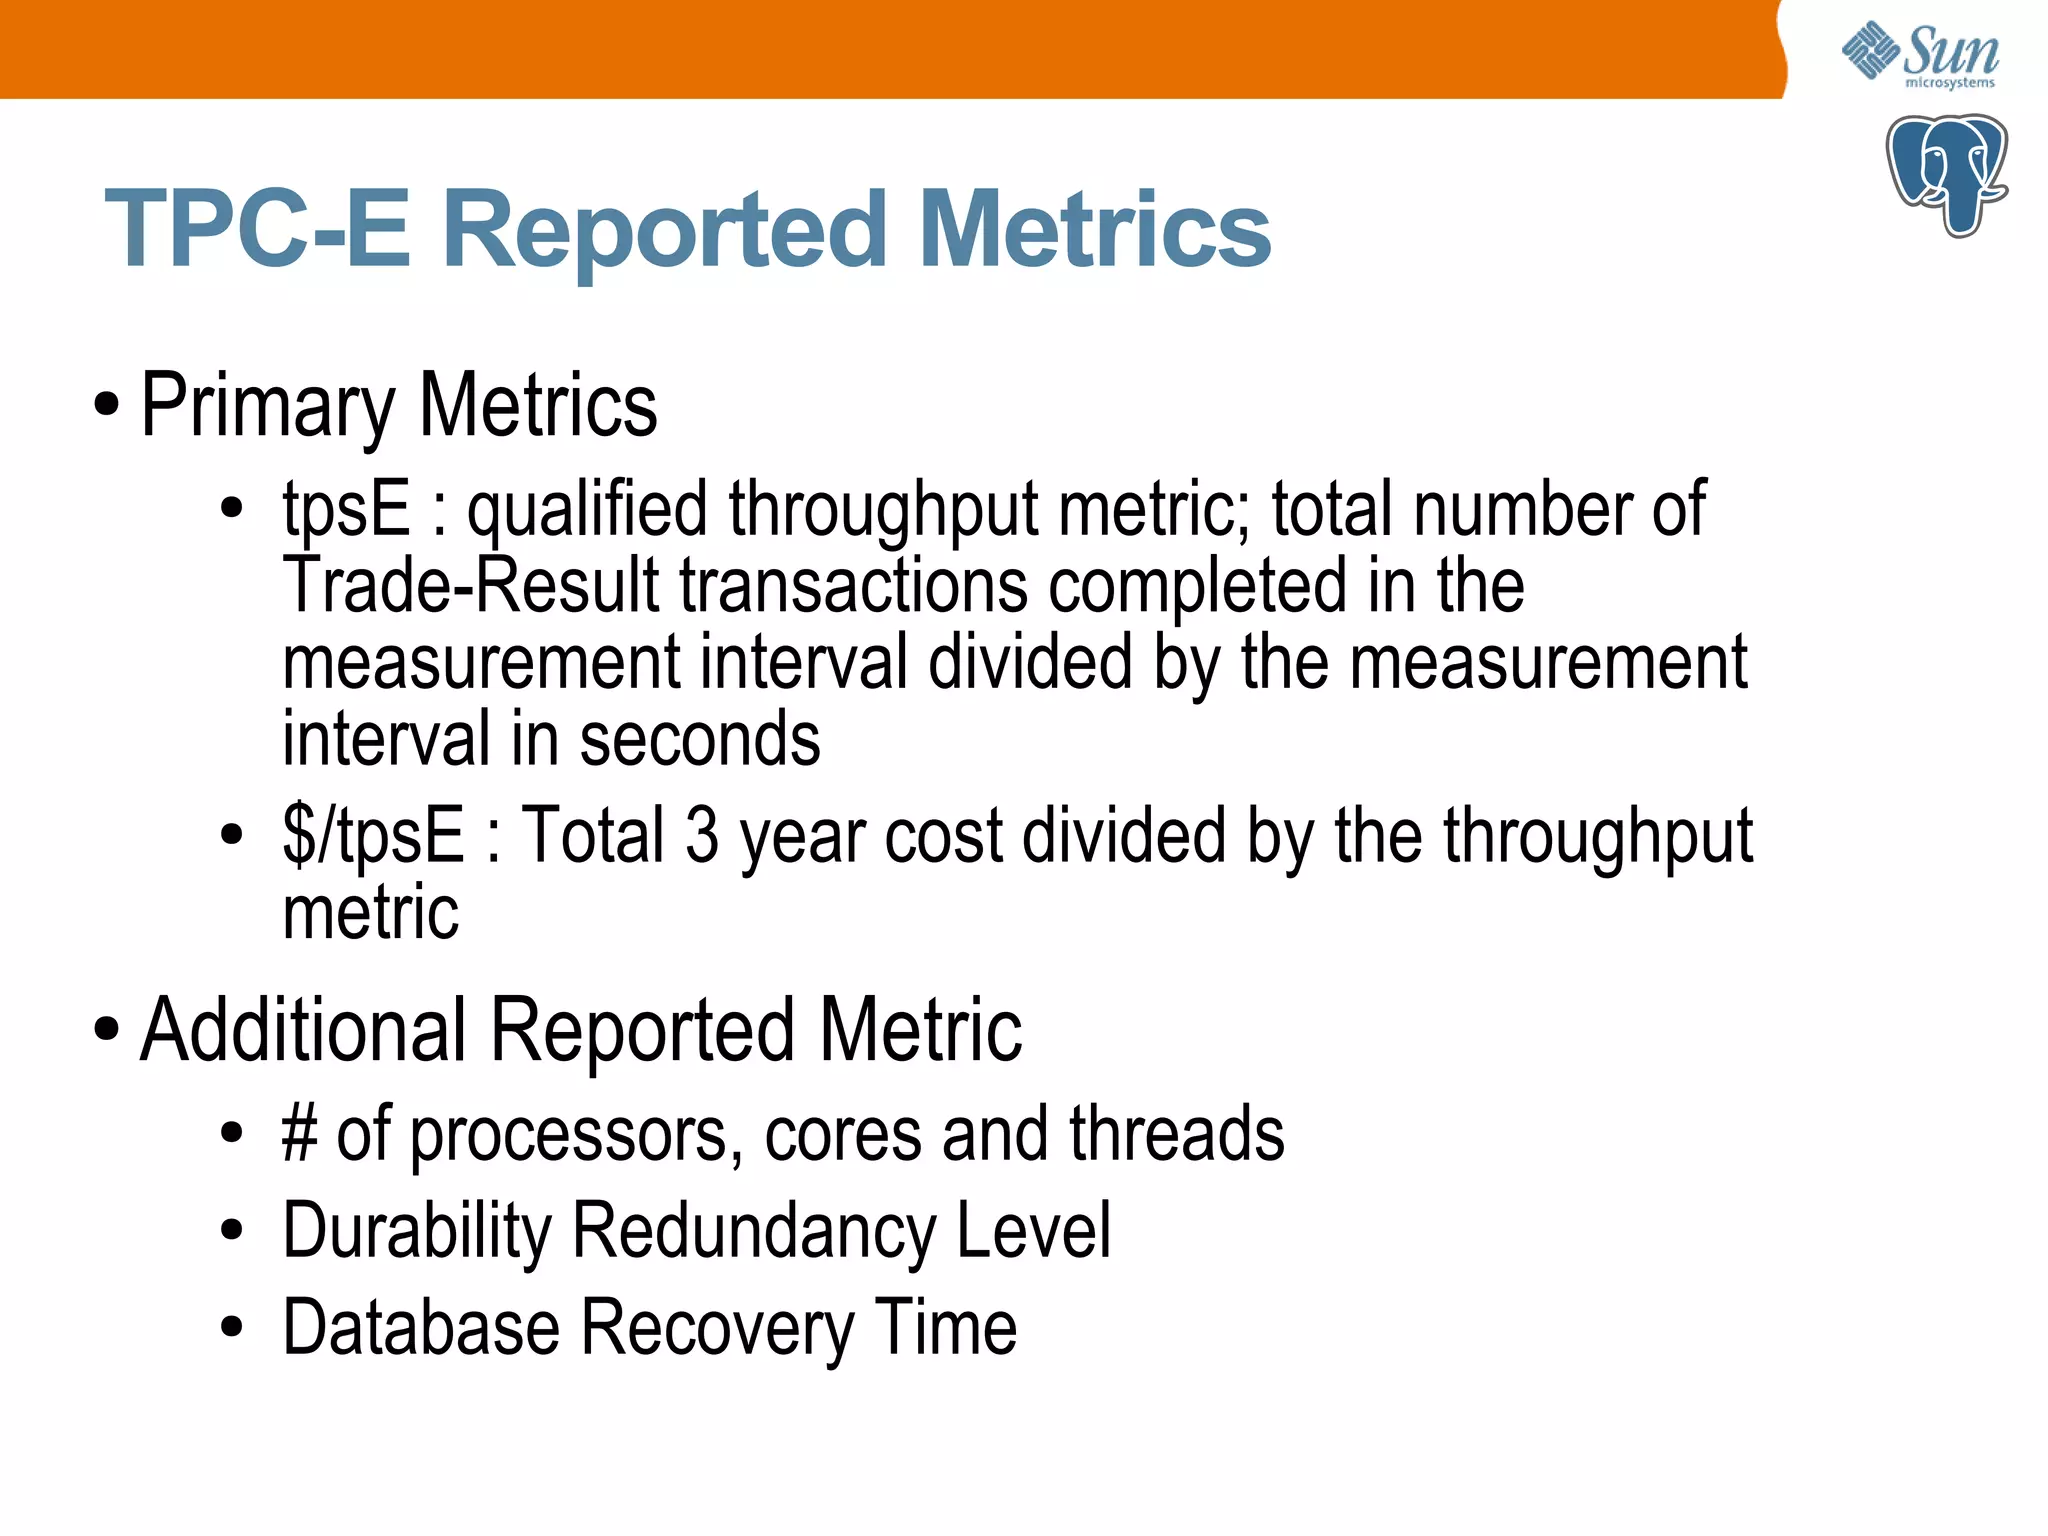
Introduction to key metrics for TPC-E reporting, focusing on throughput and performance evaluation.
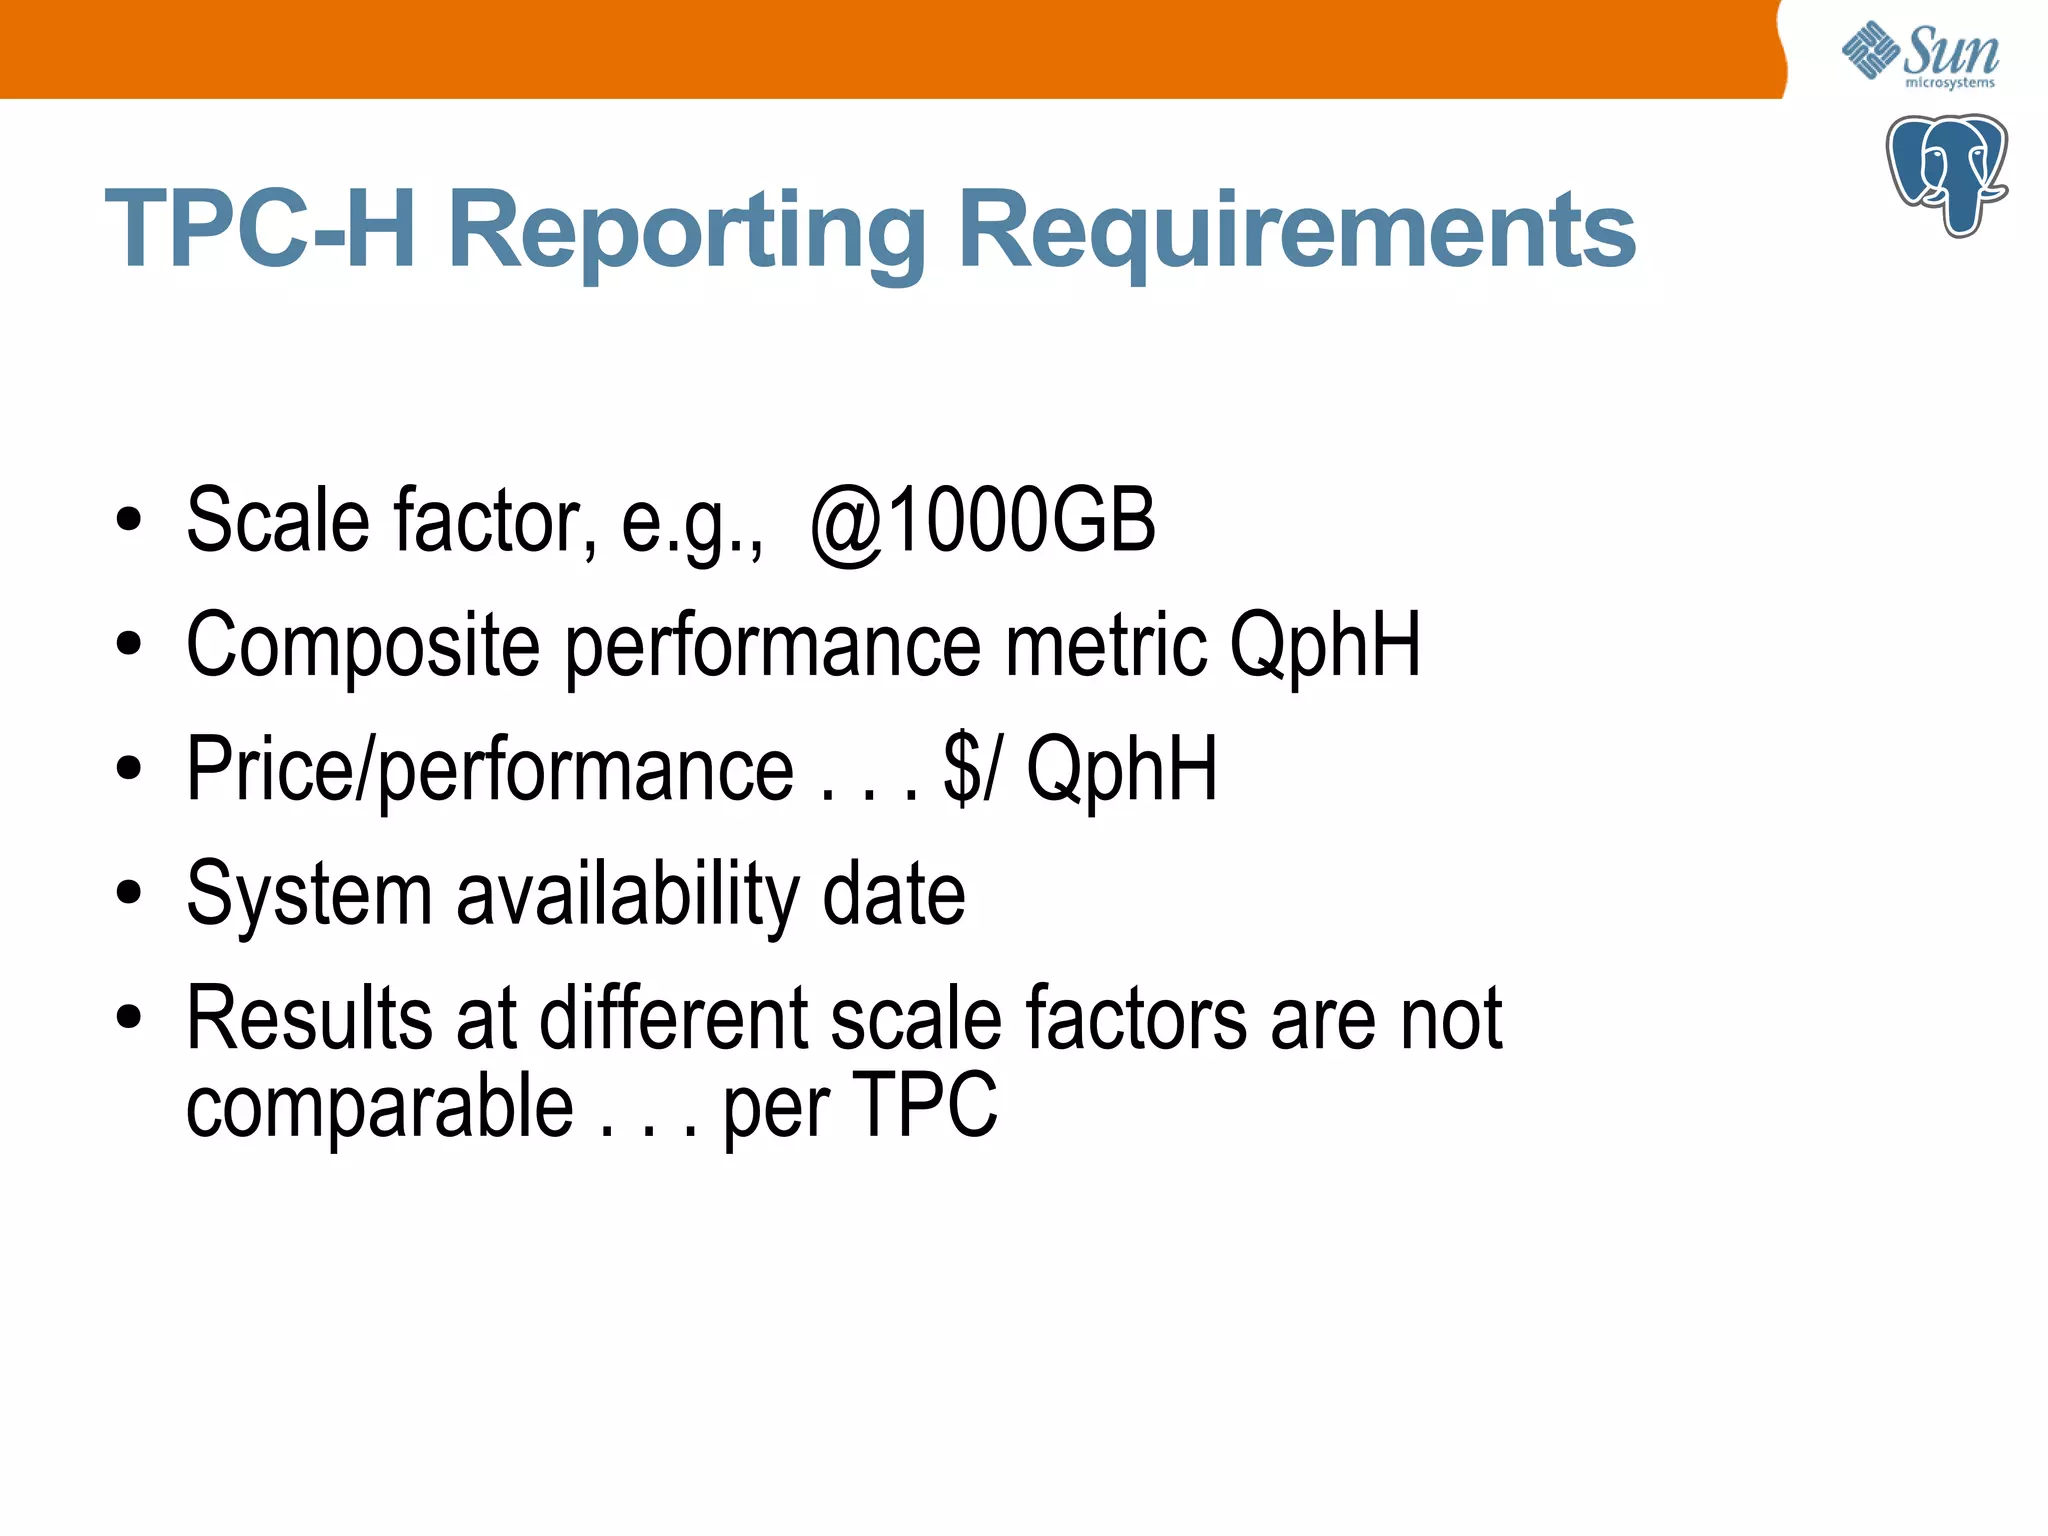
Specifications needed for TPC-H reporting, emphasizing scale factors and performance metrics.
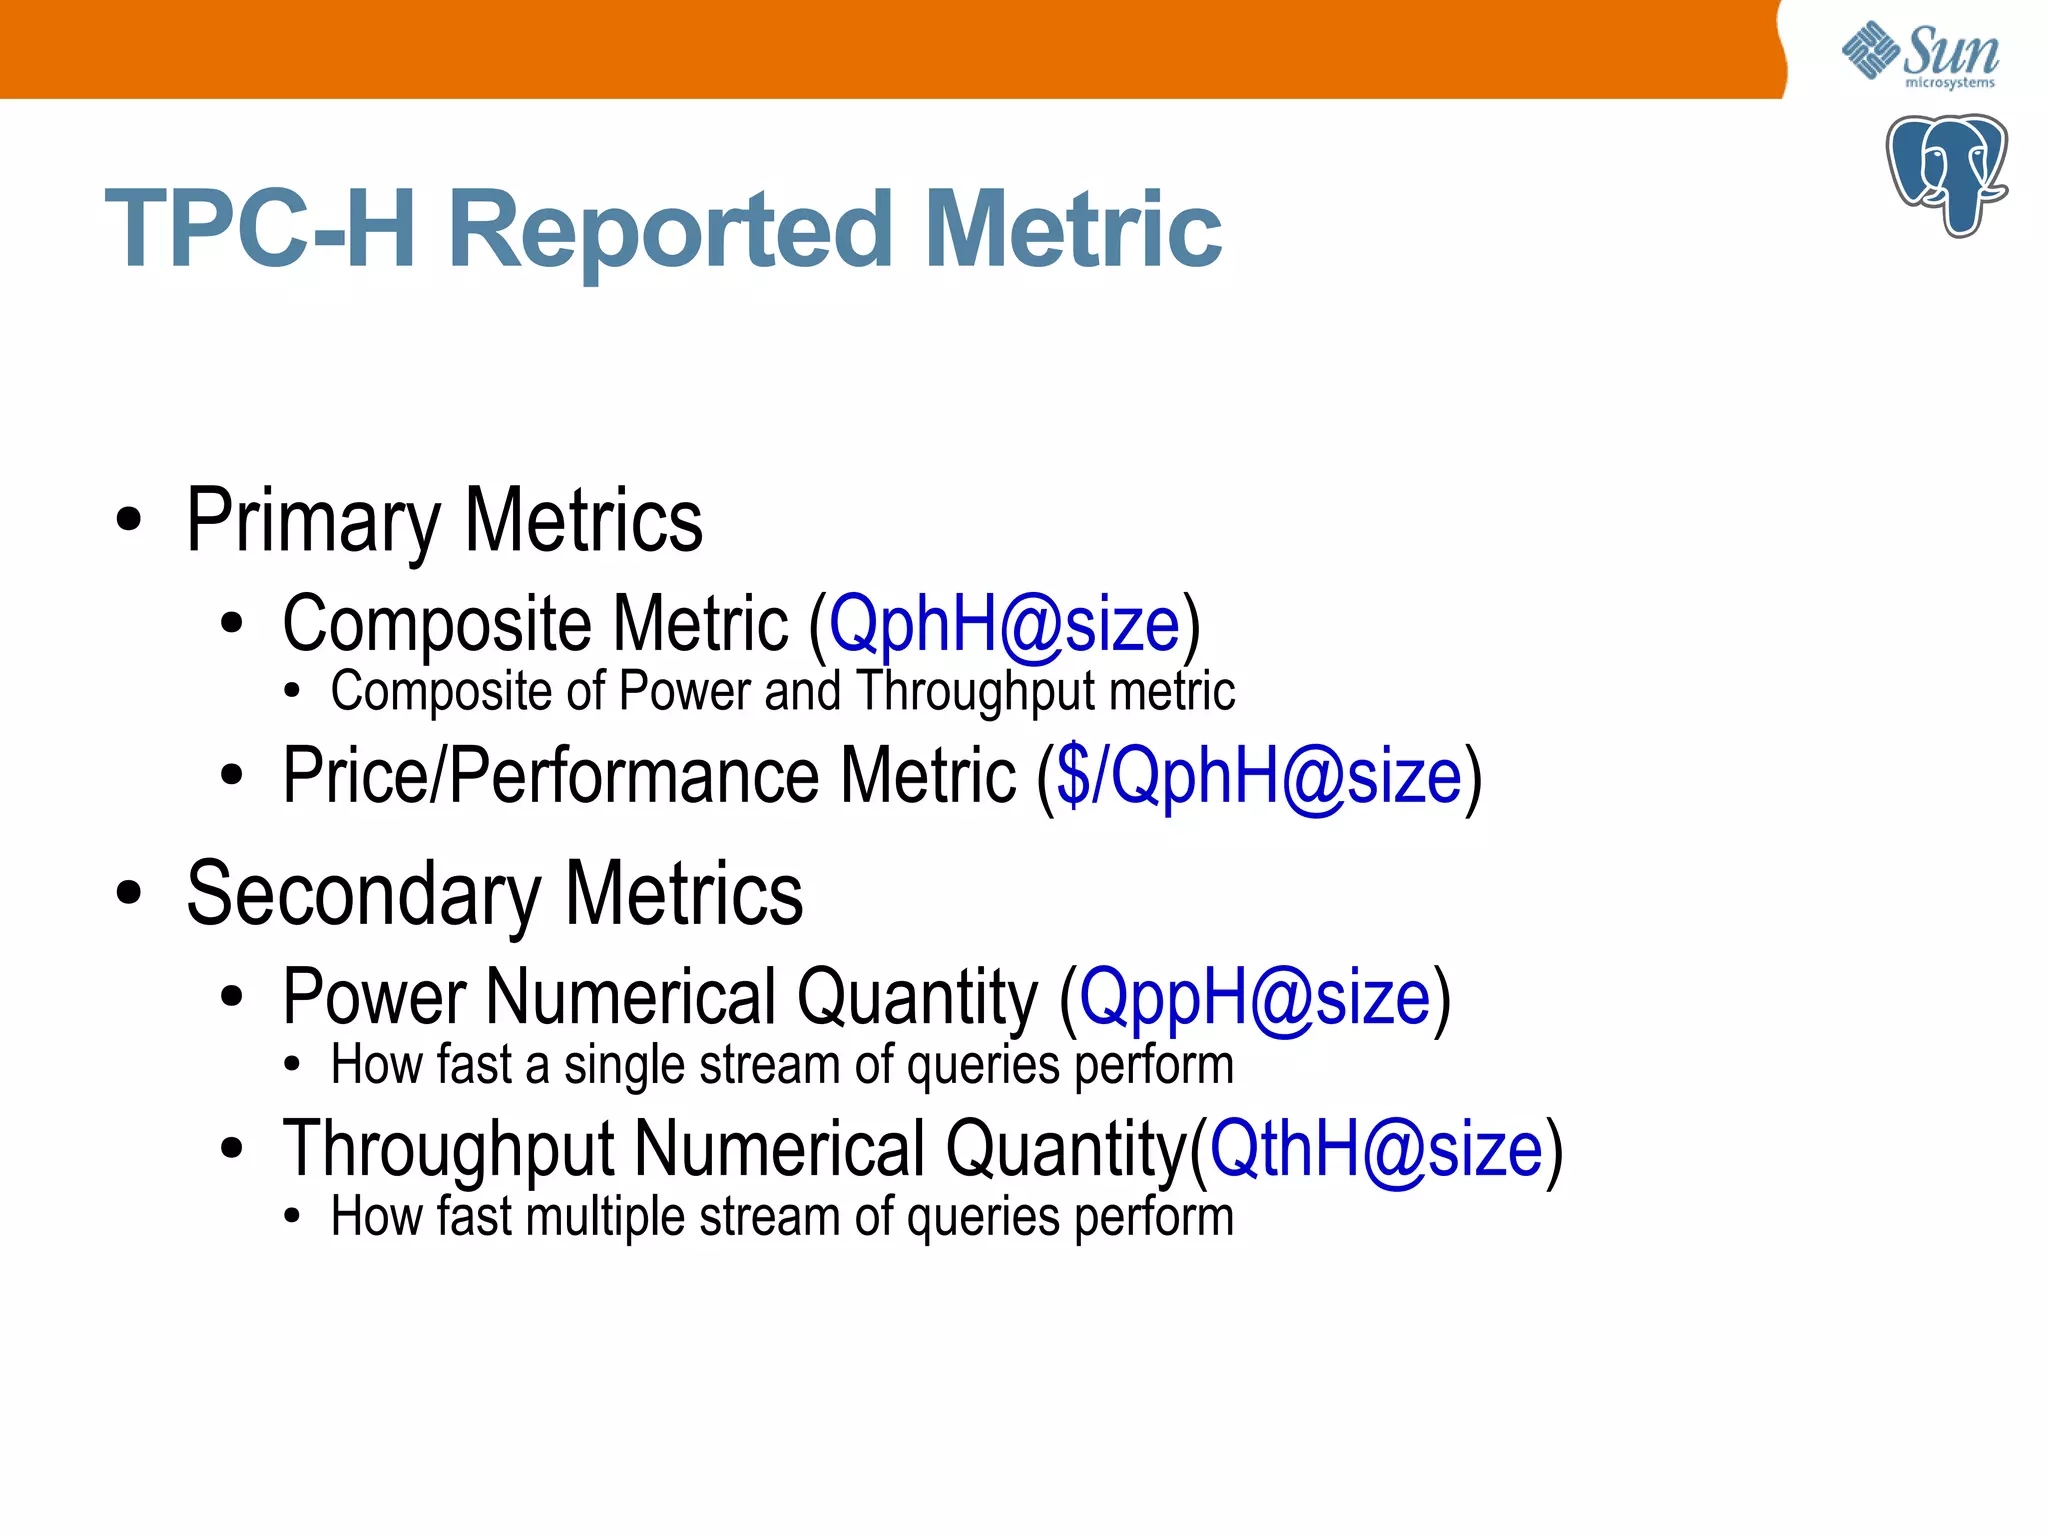
Descriptions of performance metrics for TPC-H, including composite metrics for throughput and power.