Downloaded 106 times

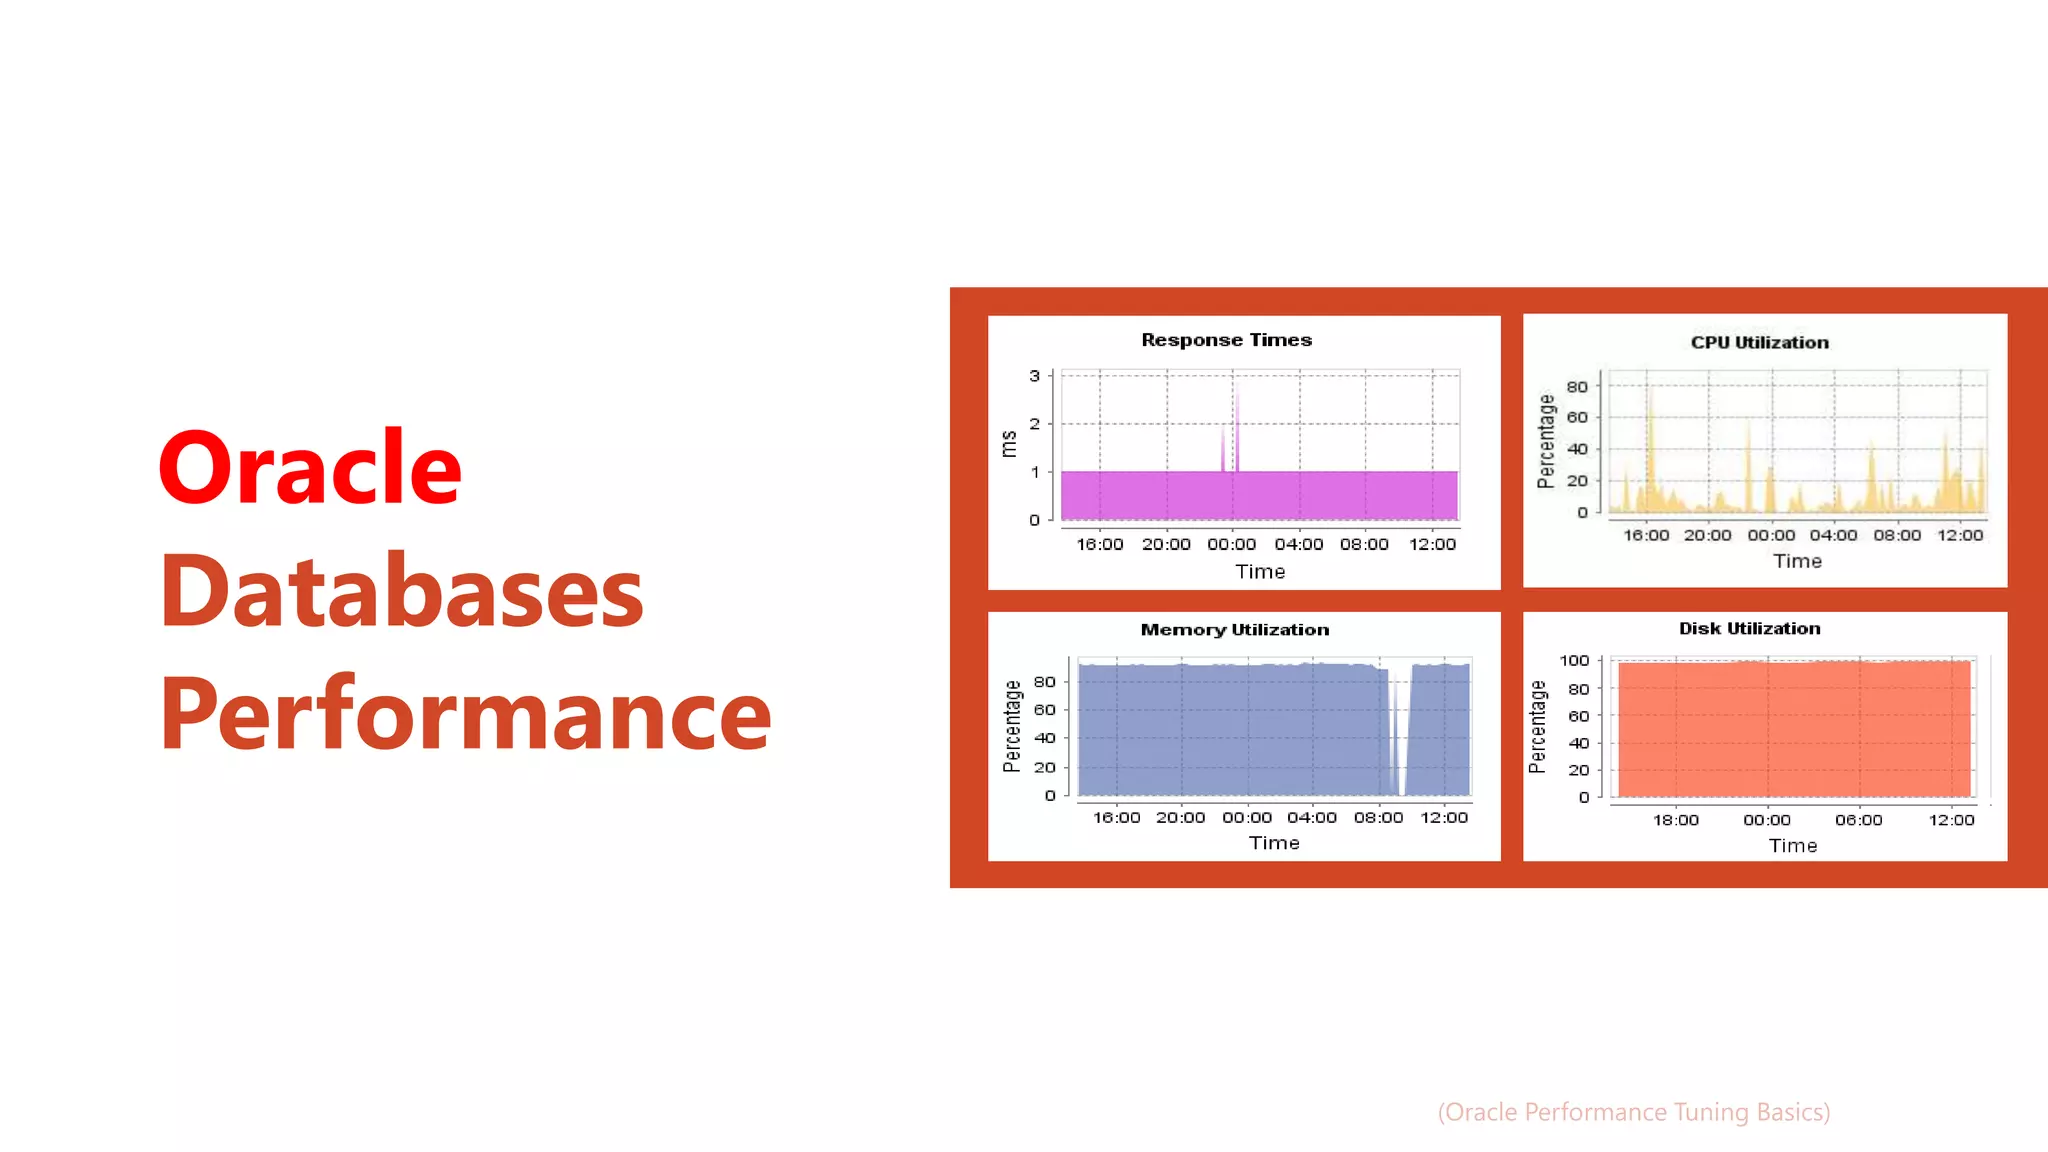

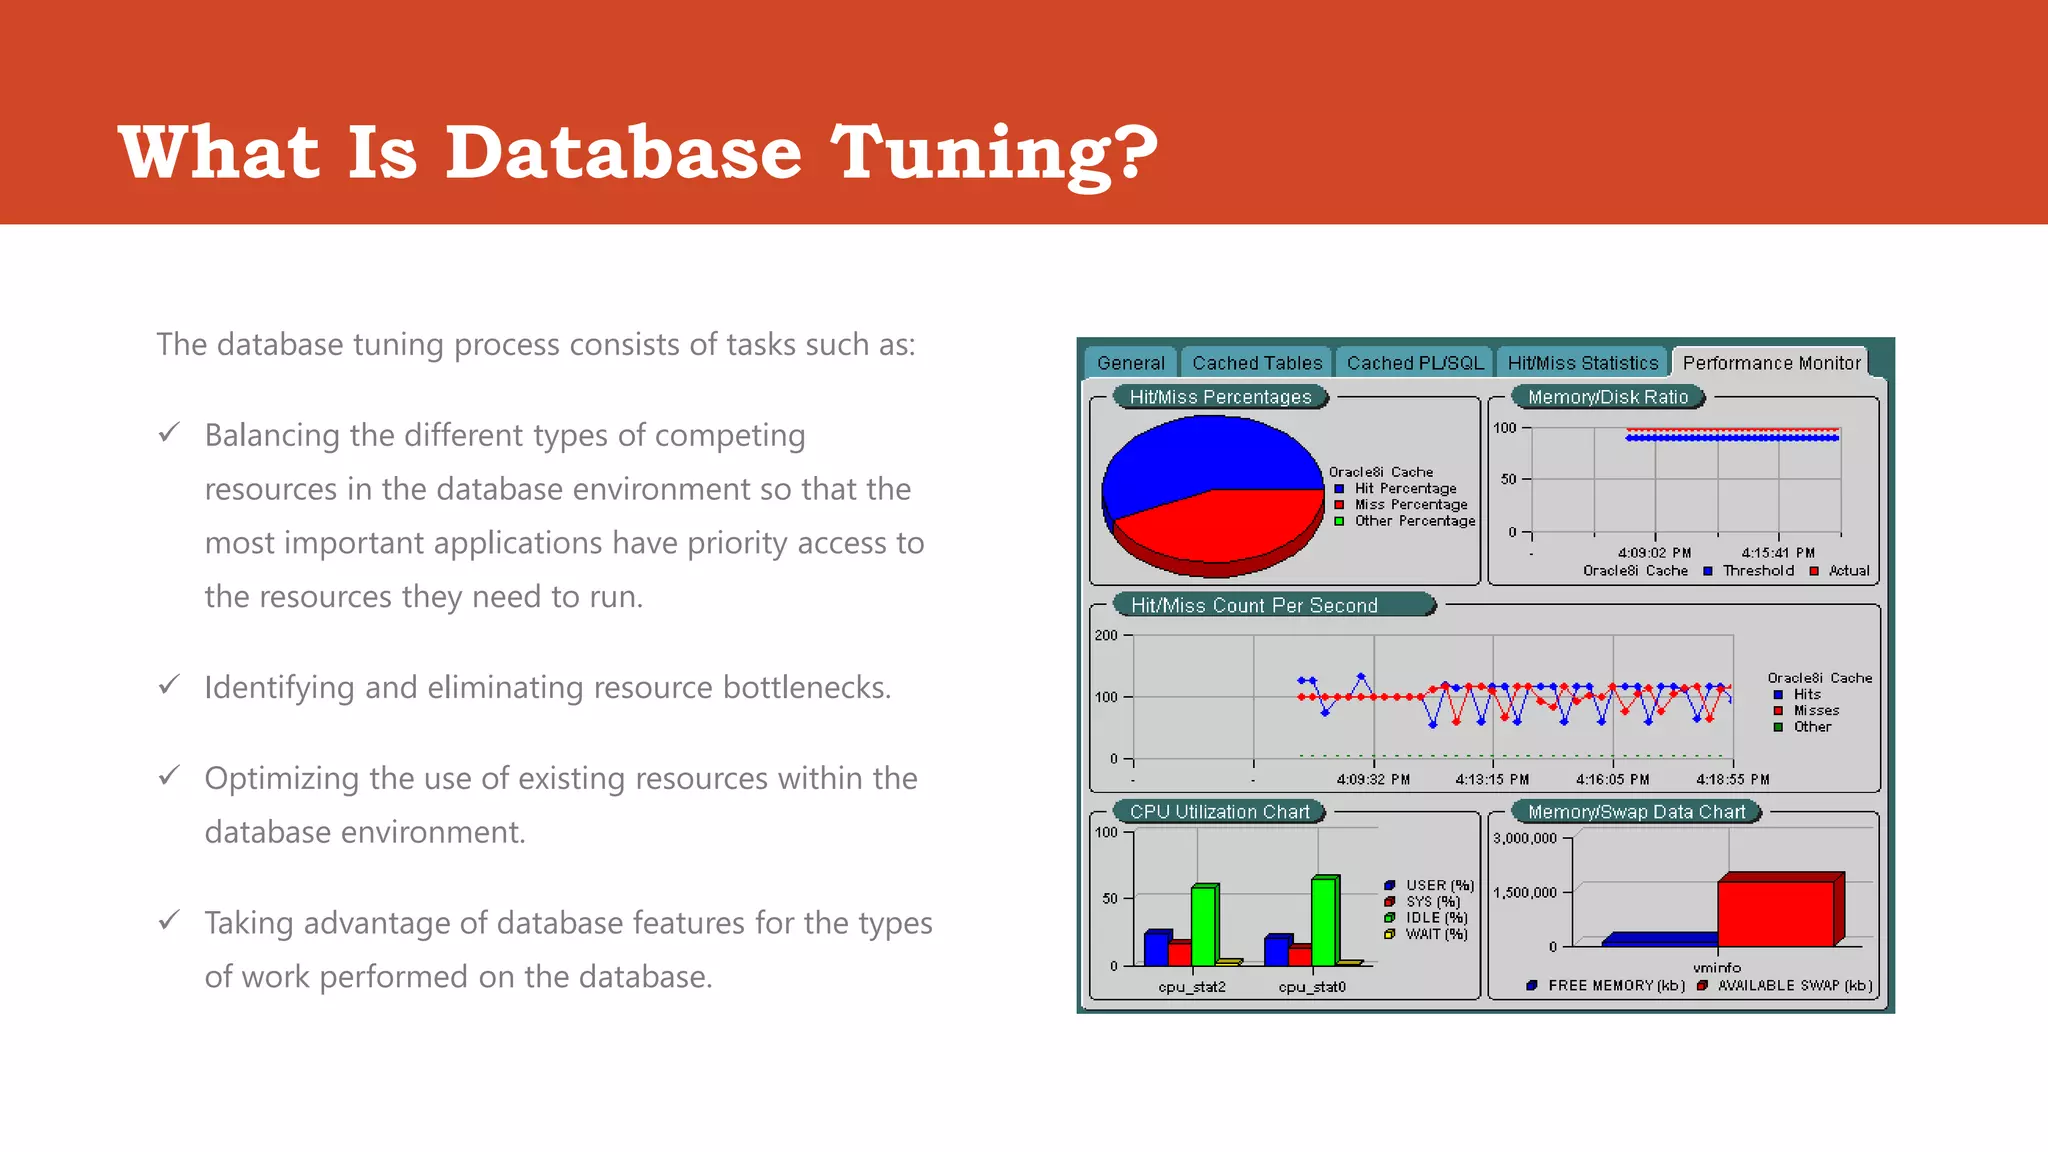
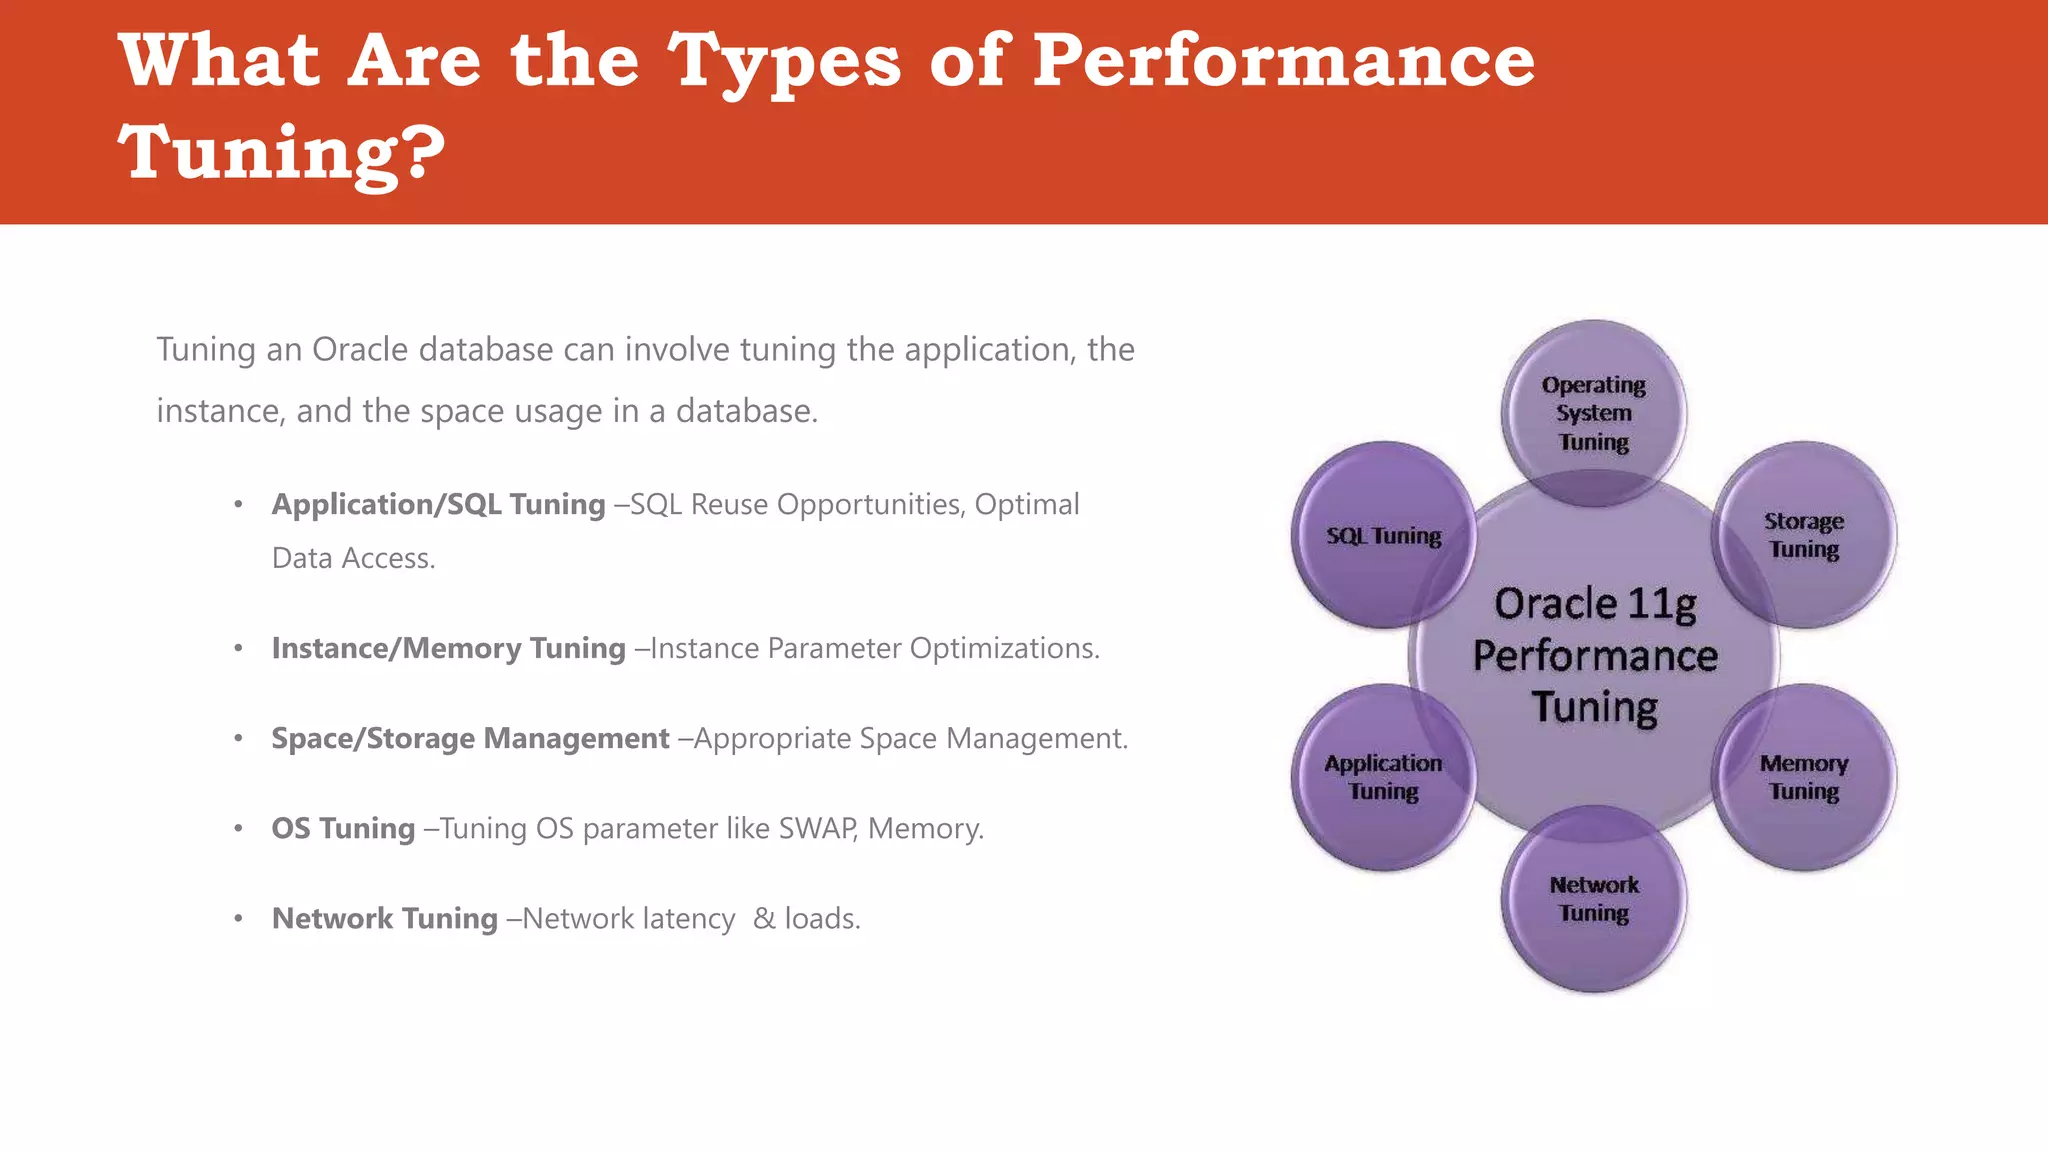
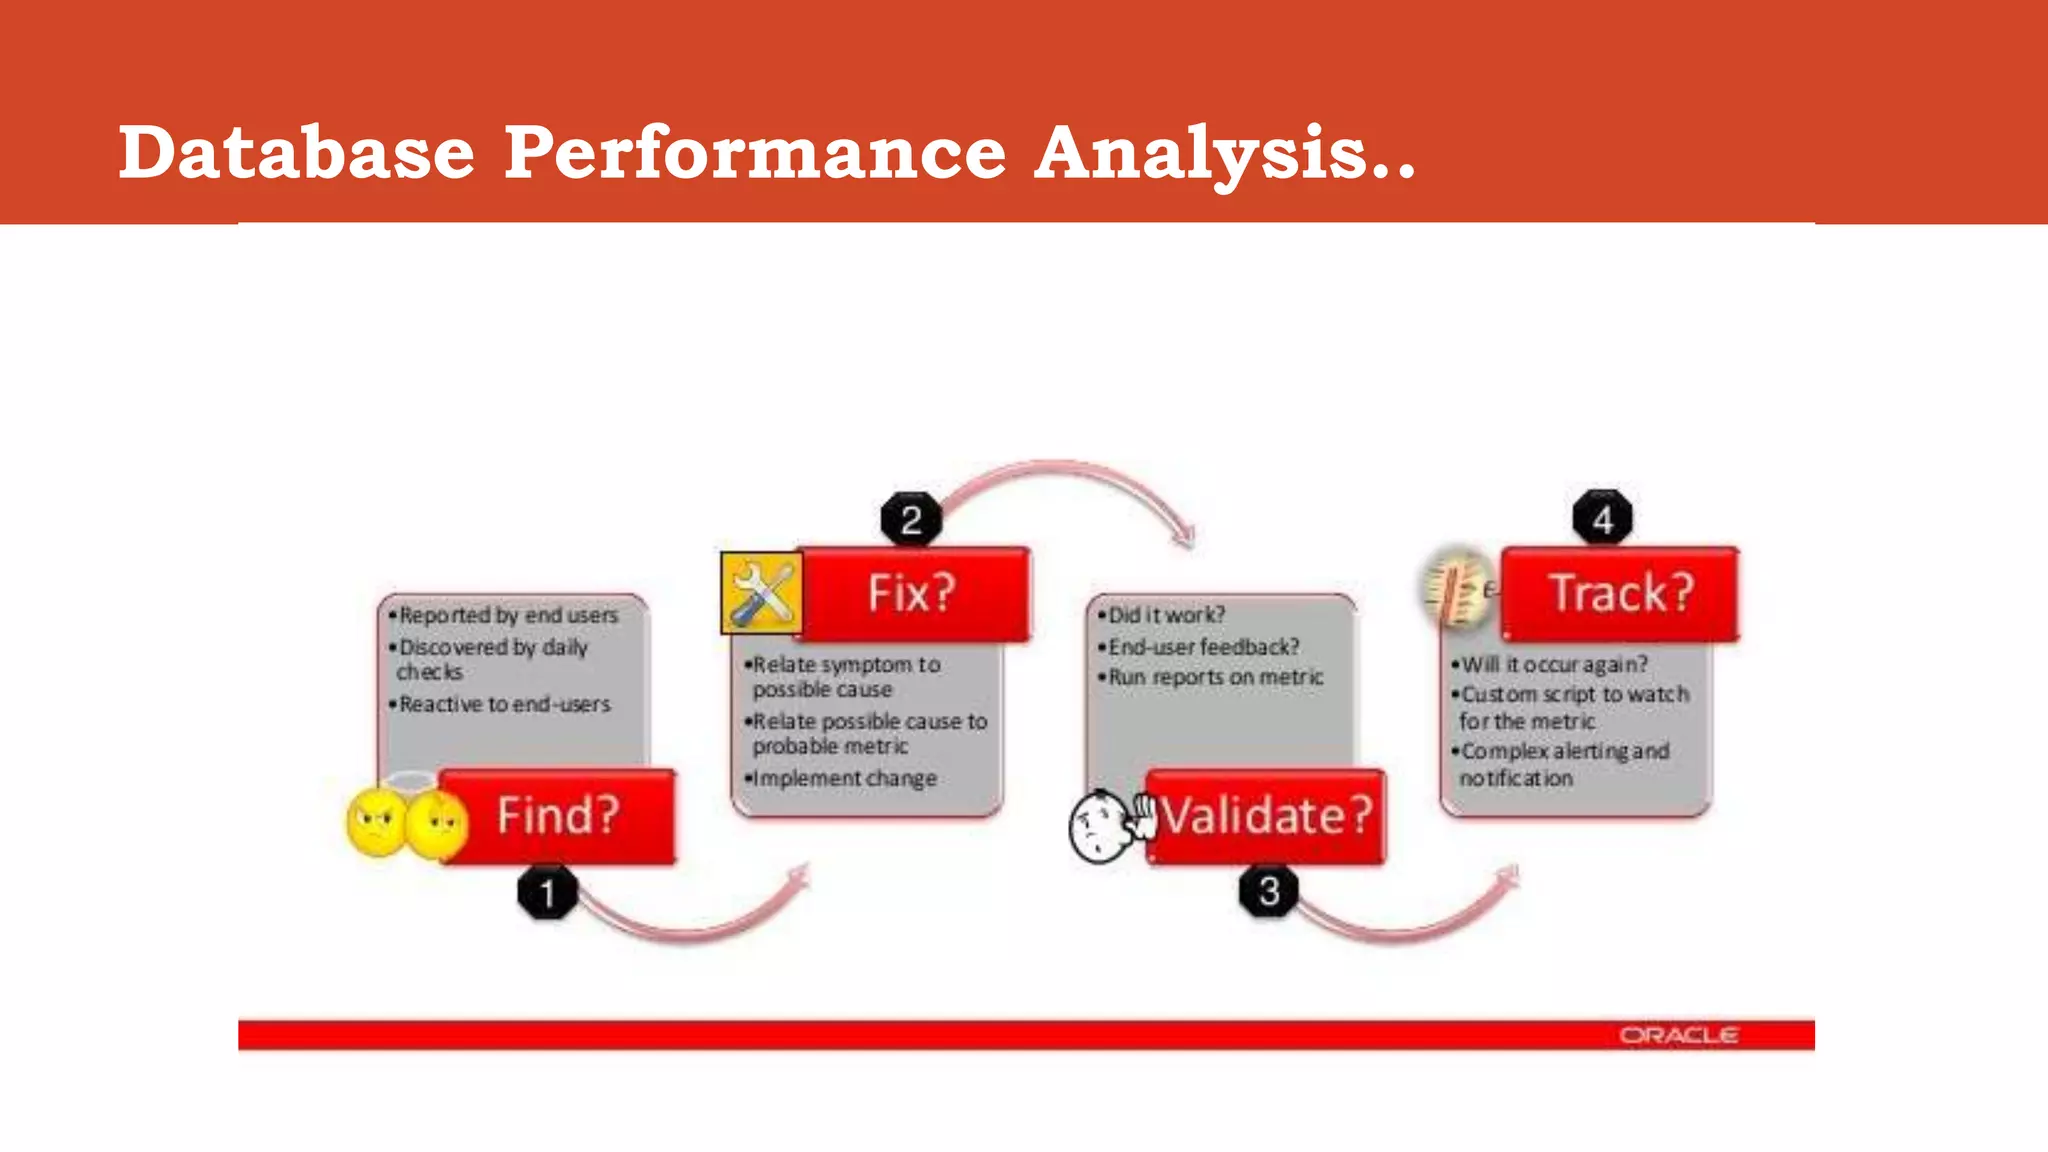

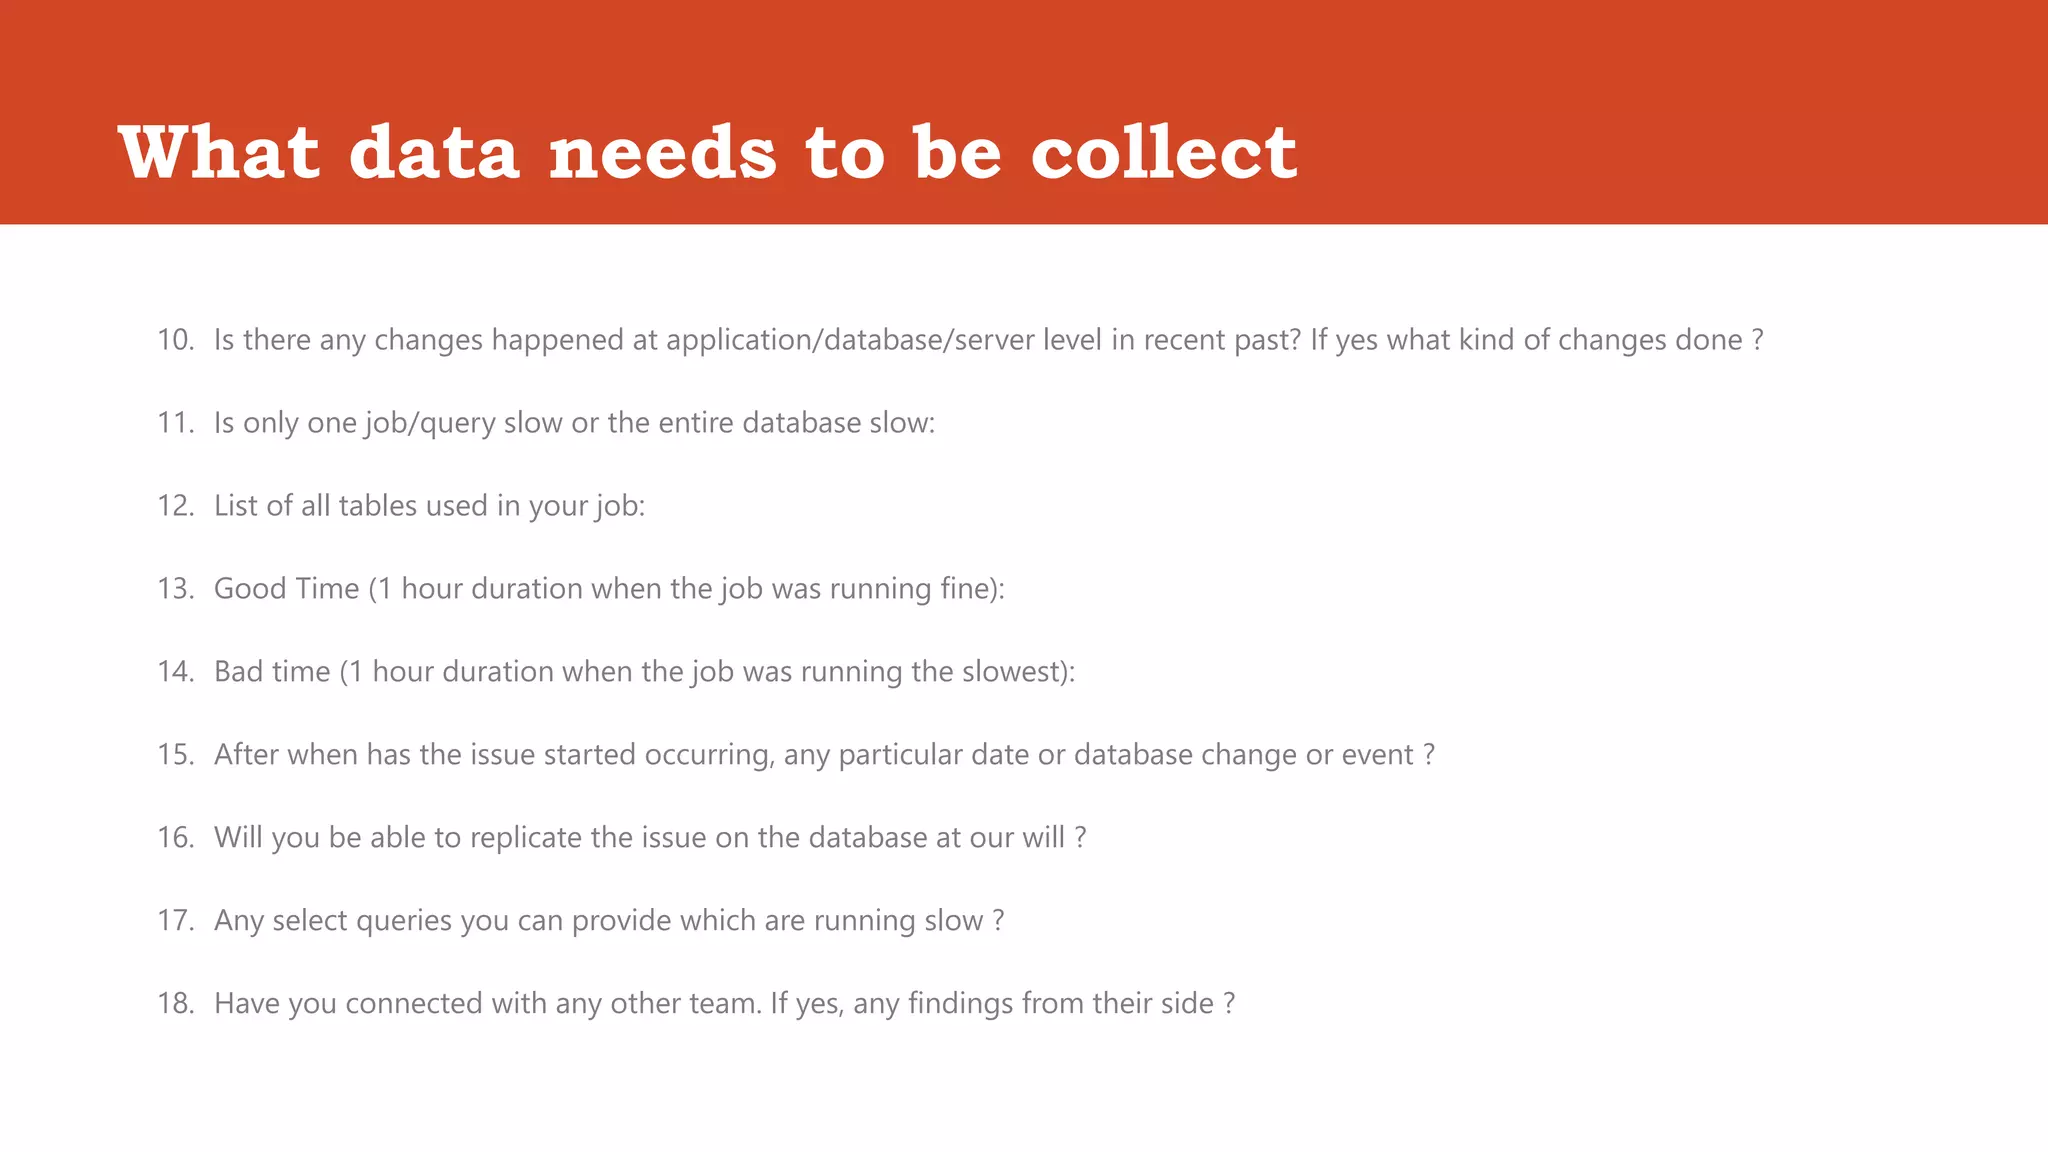
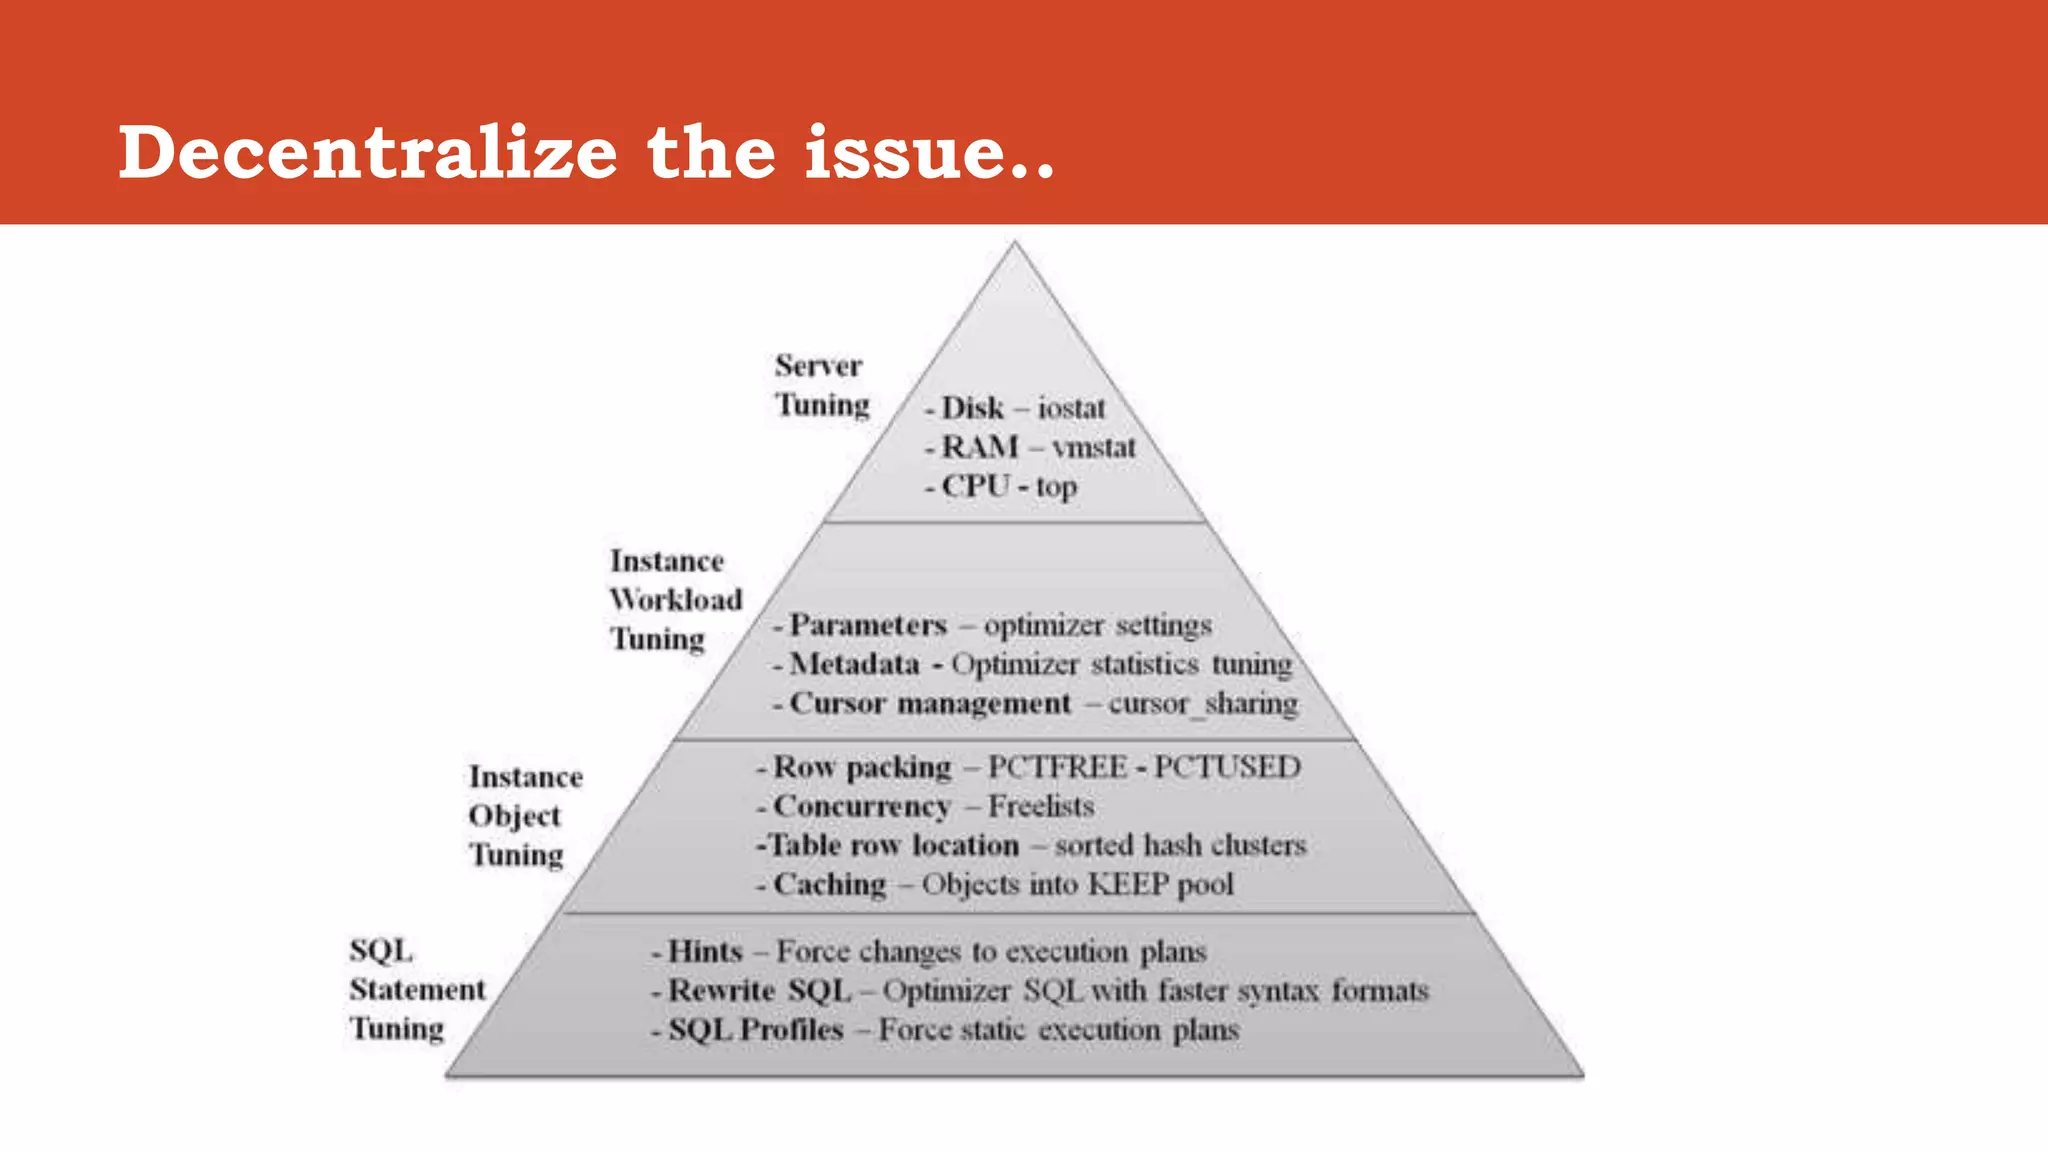
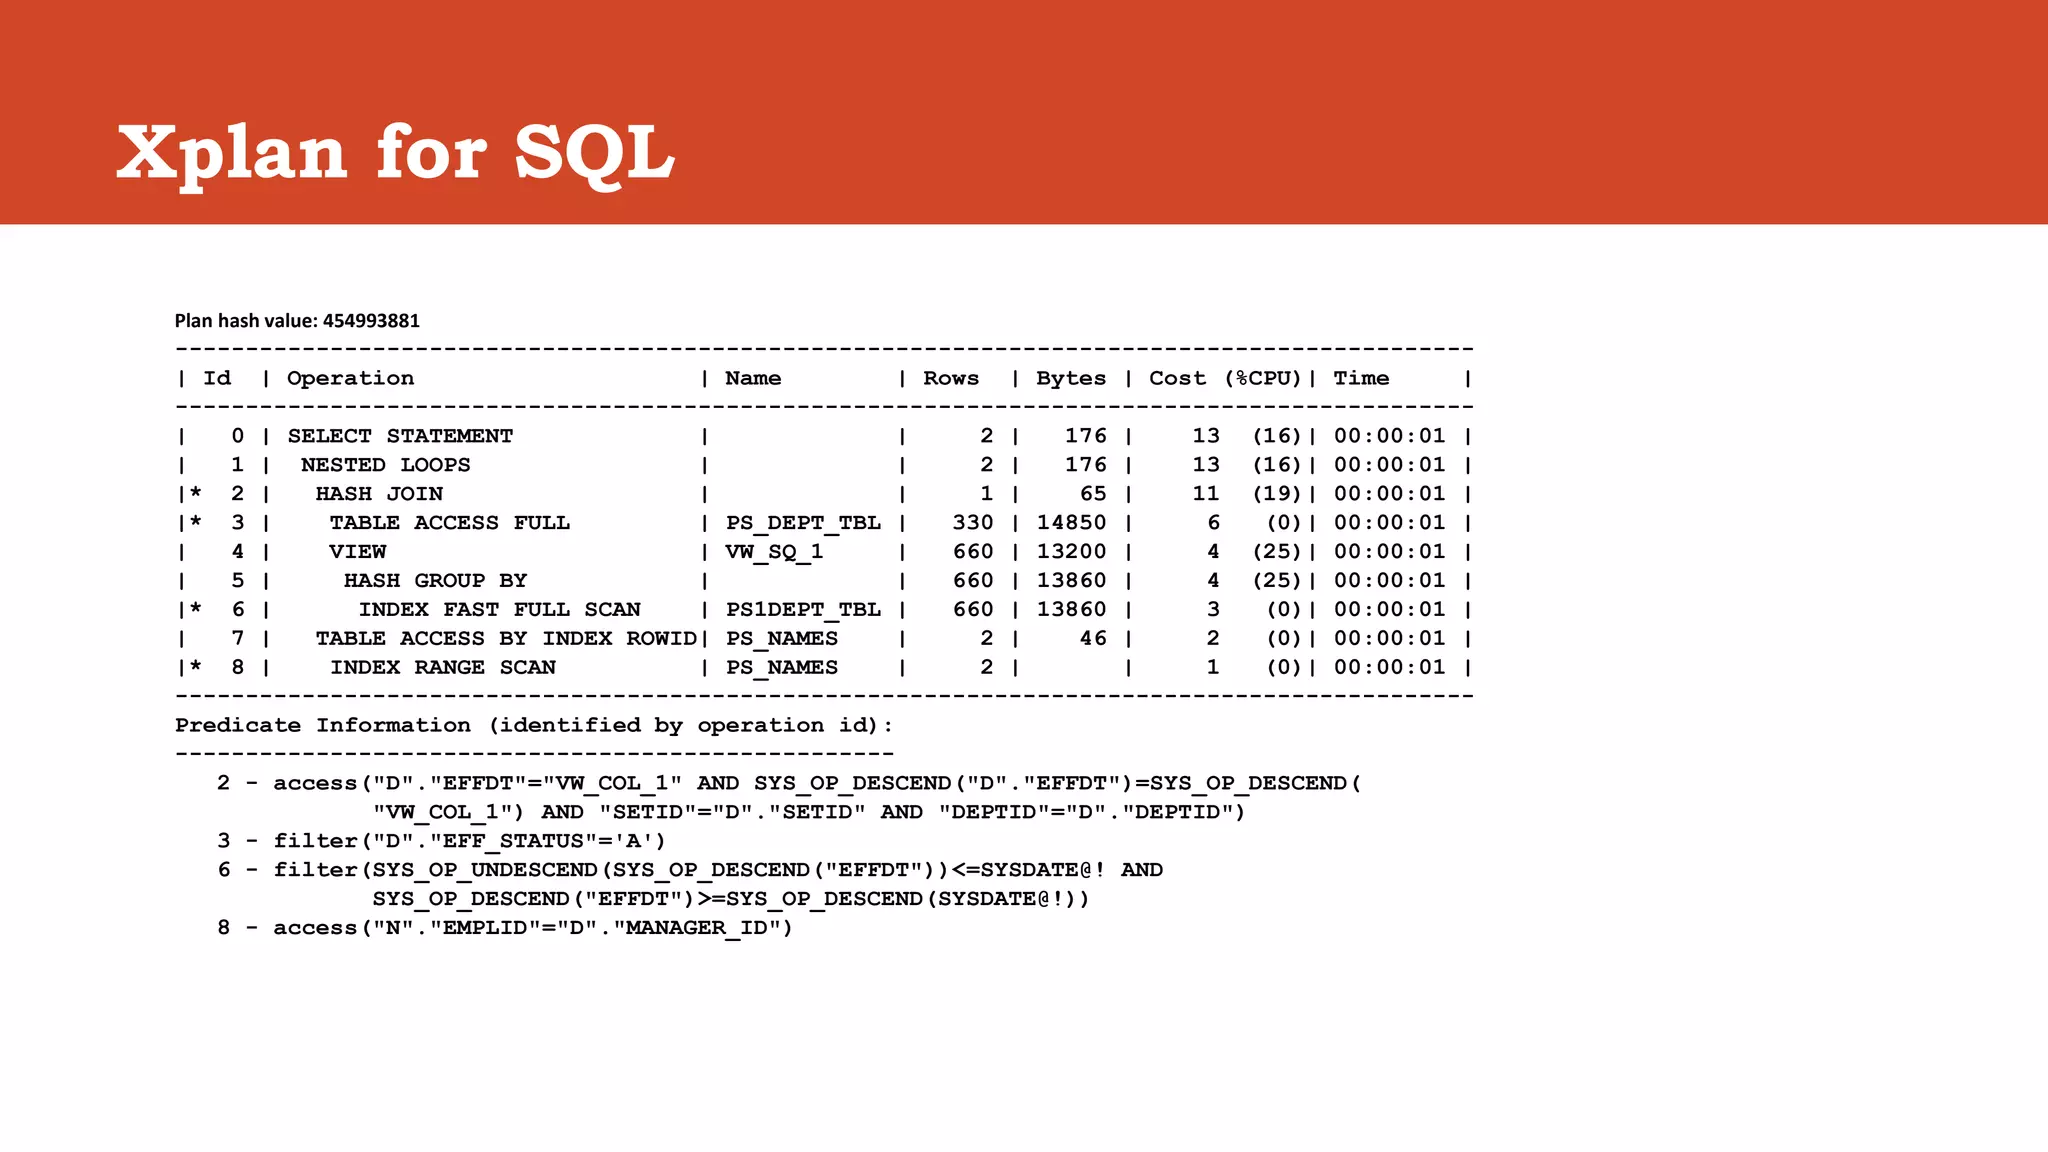
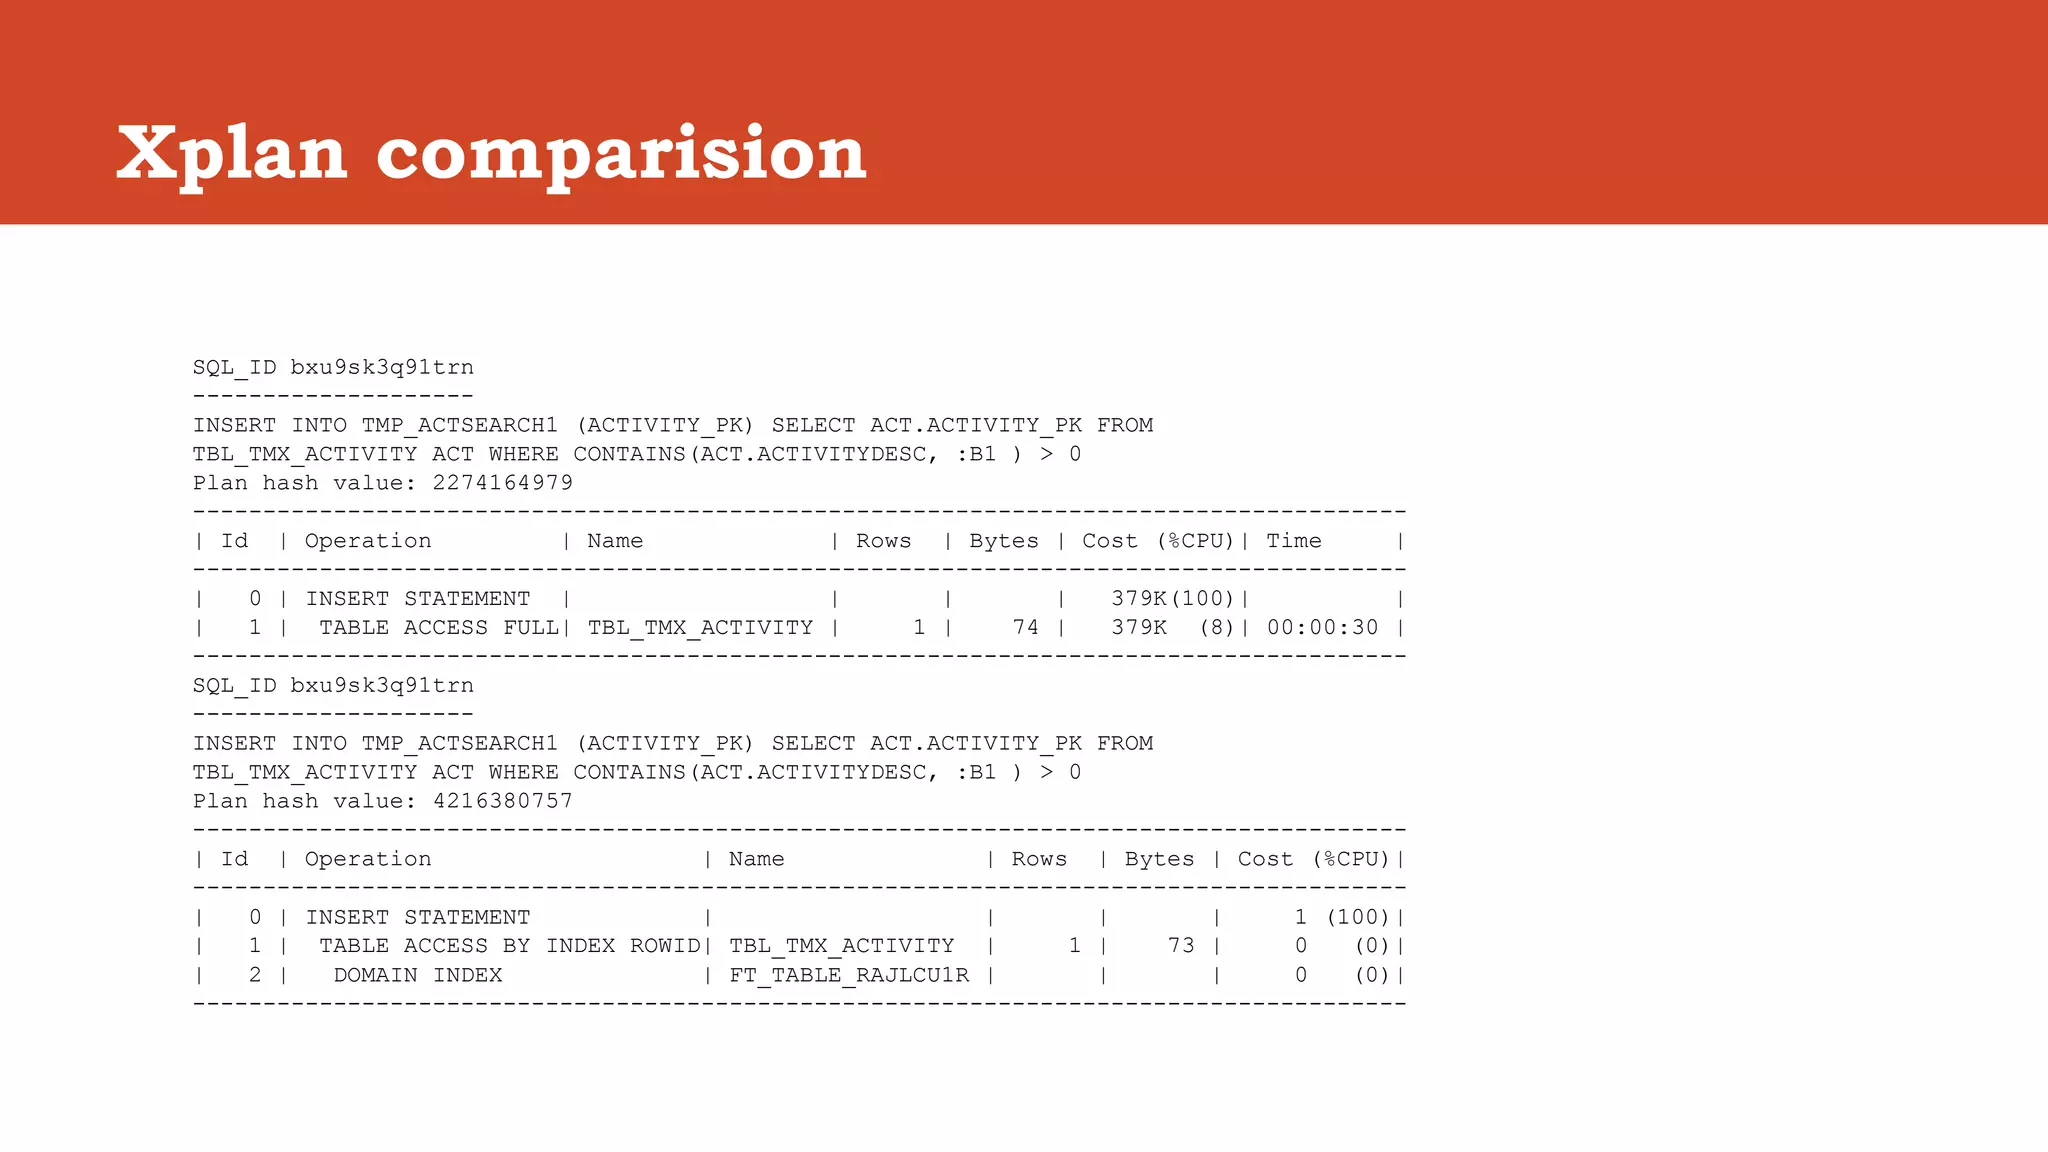
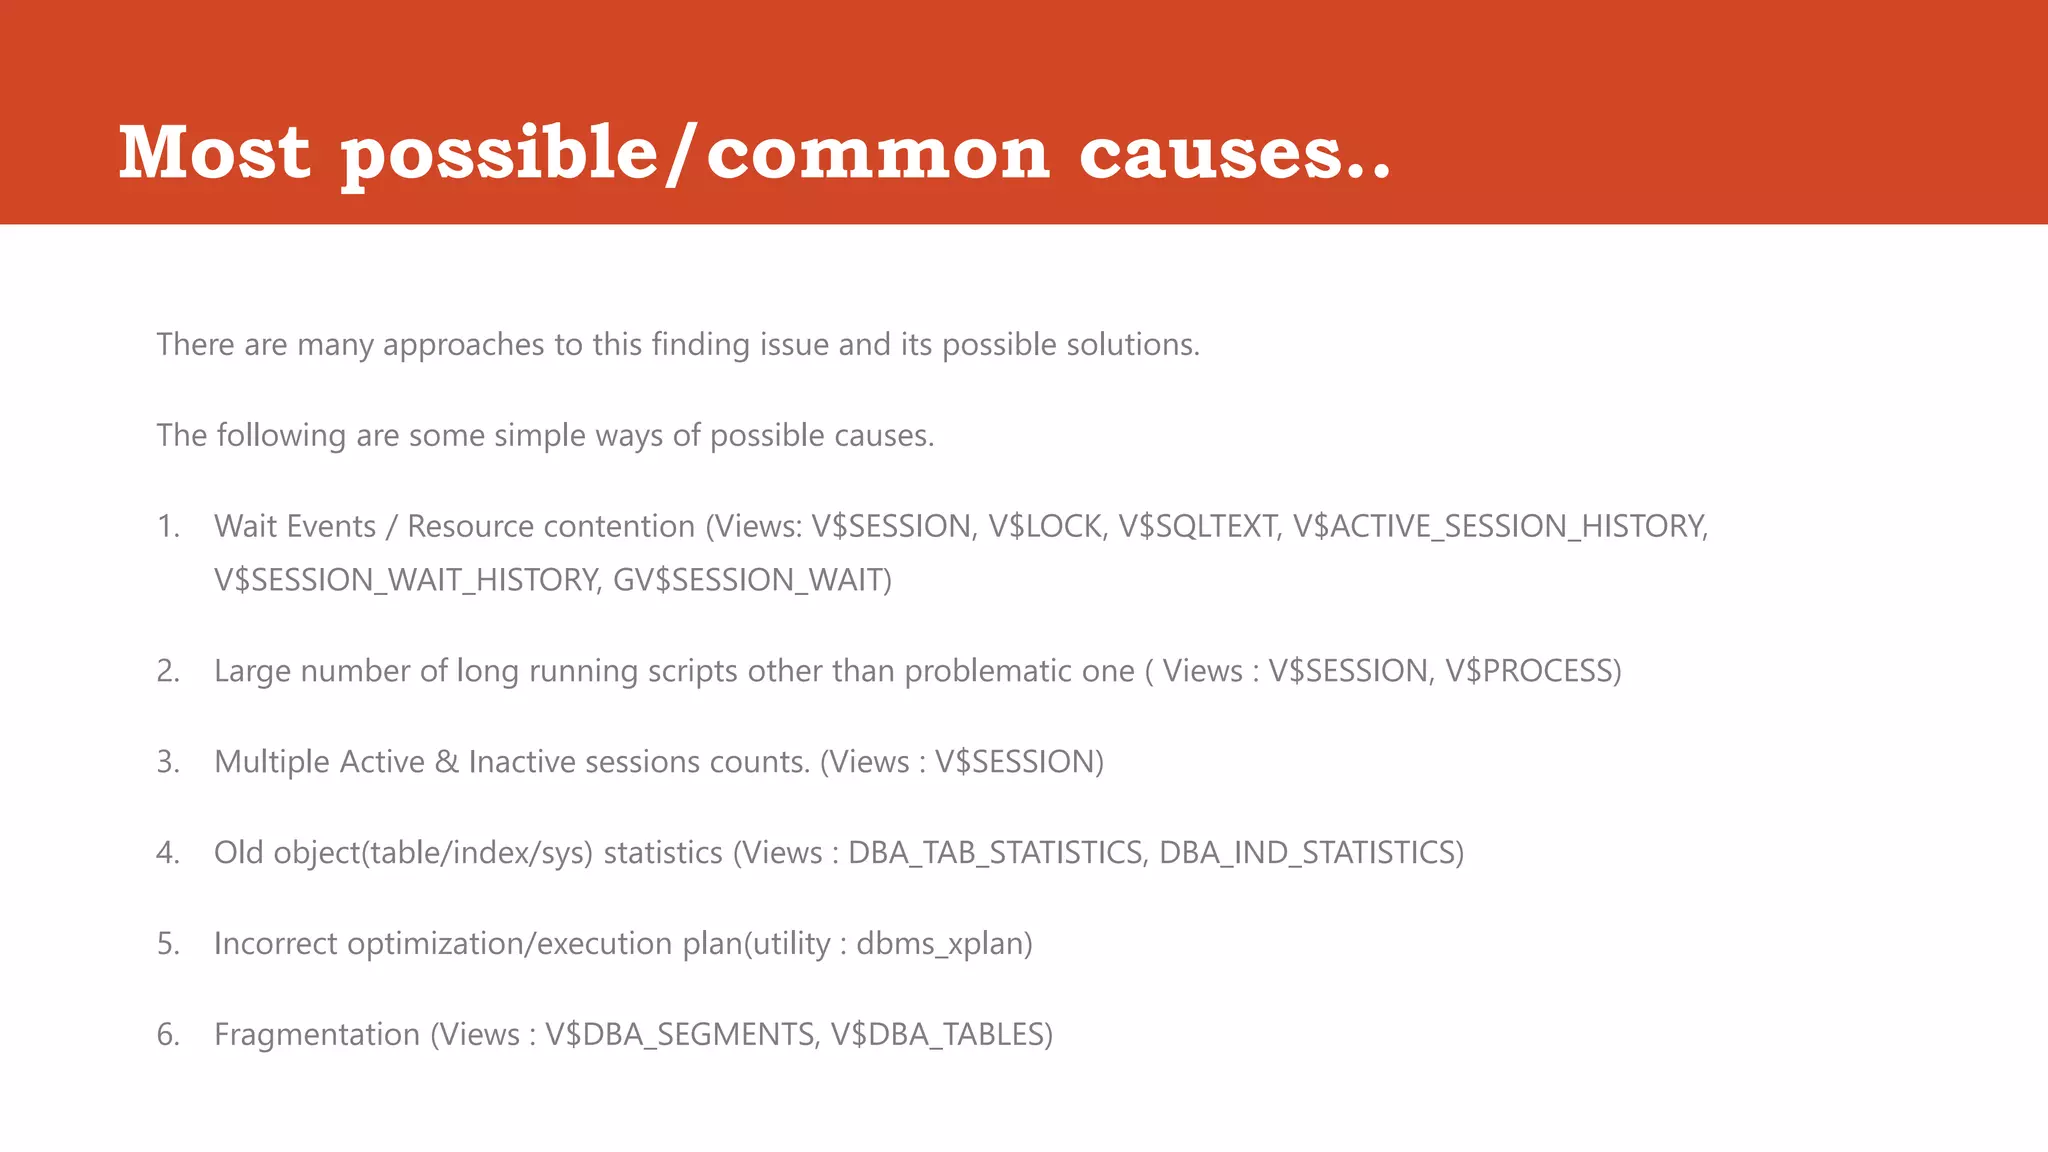
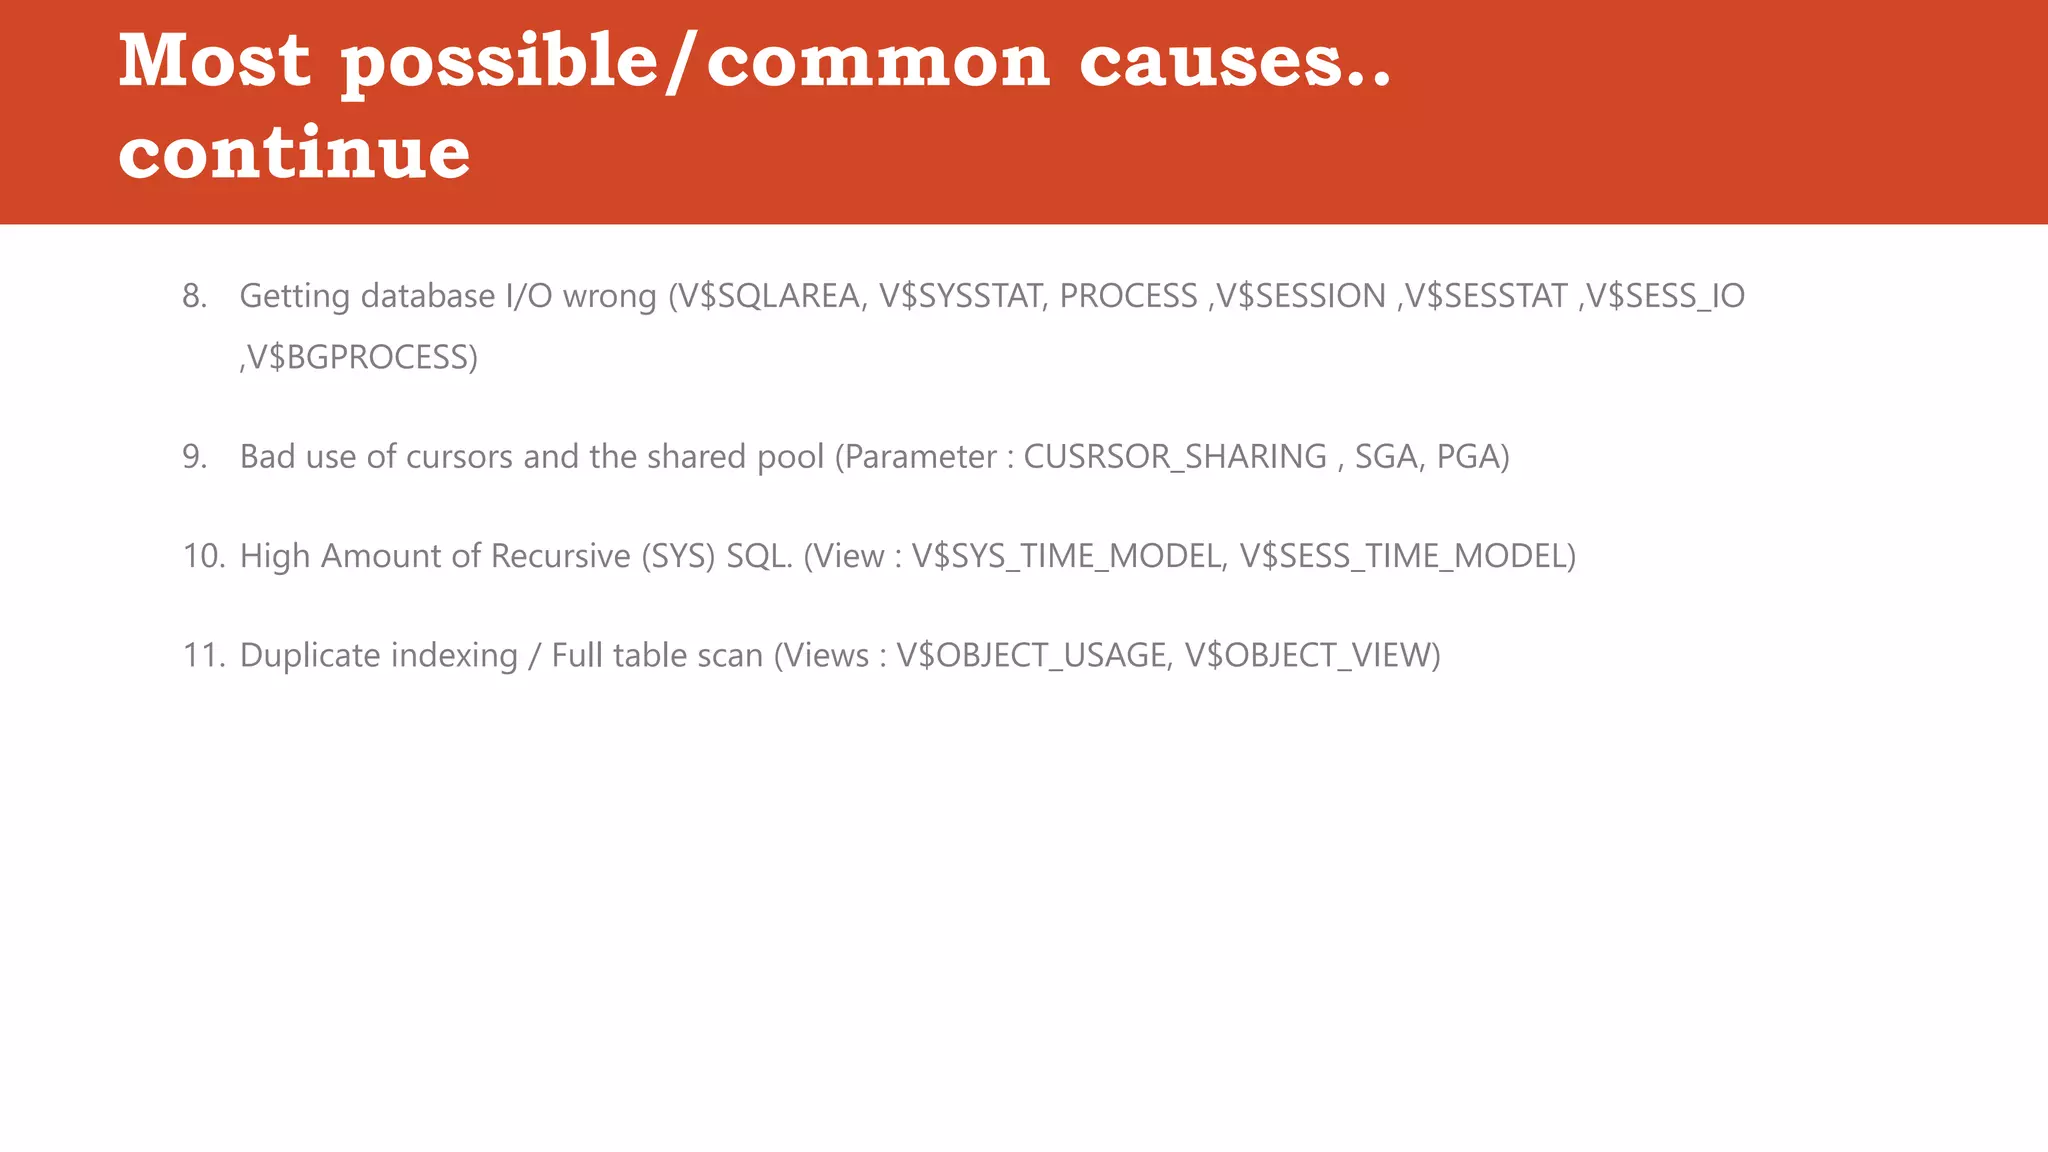
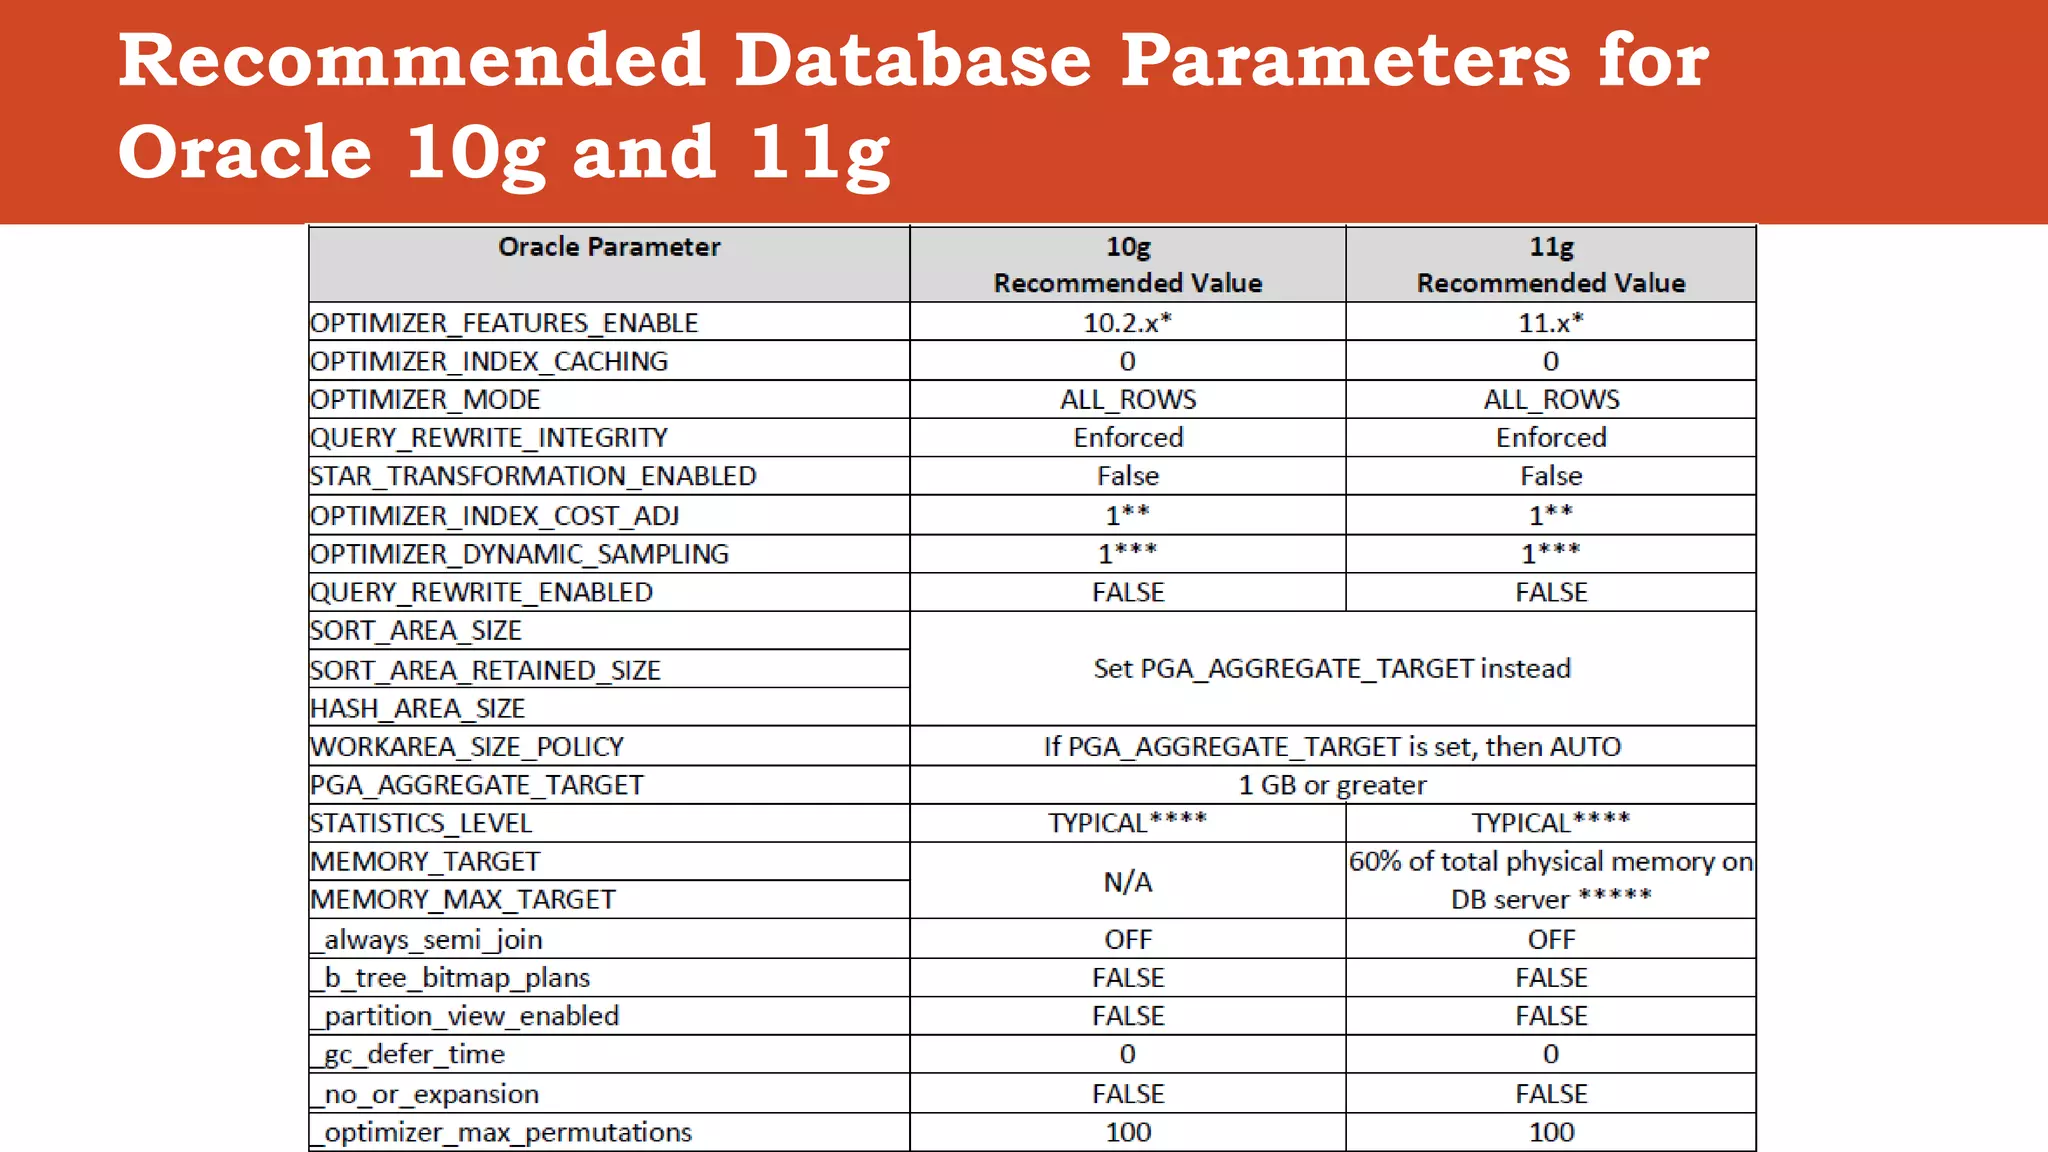
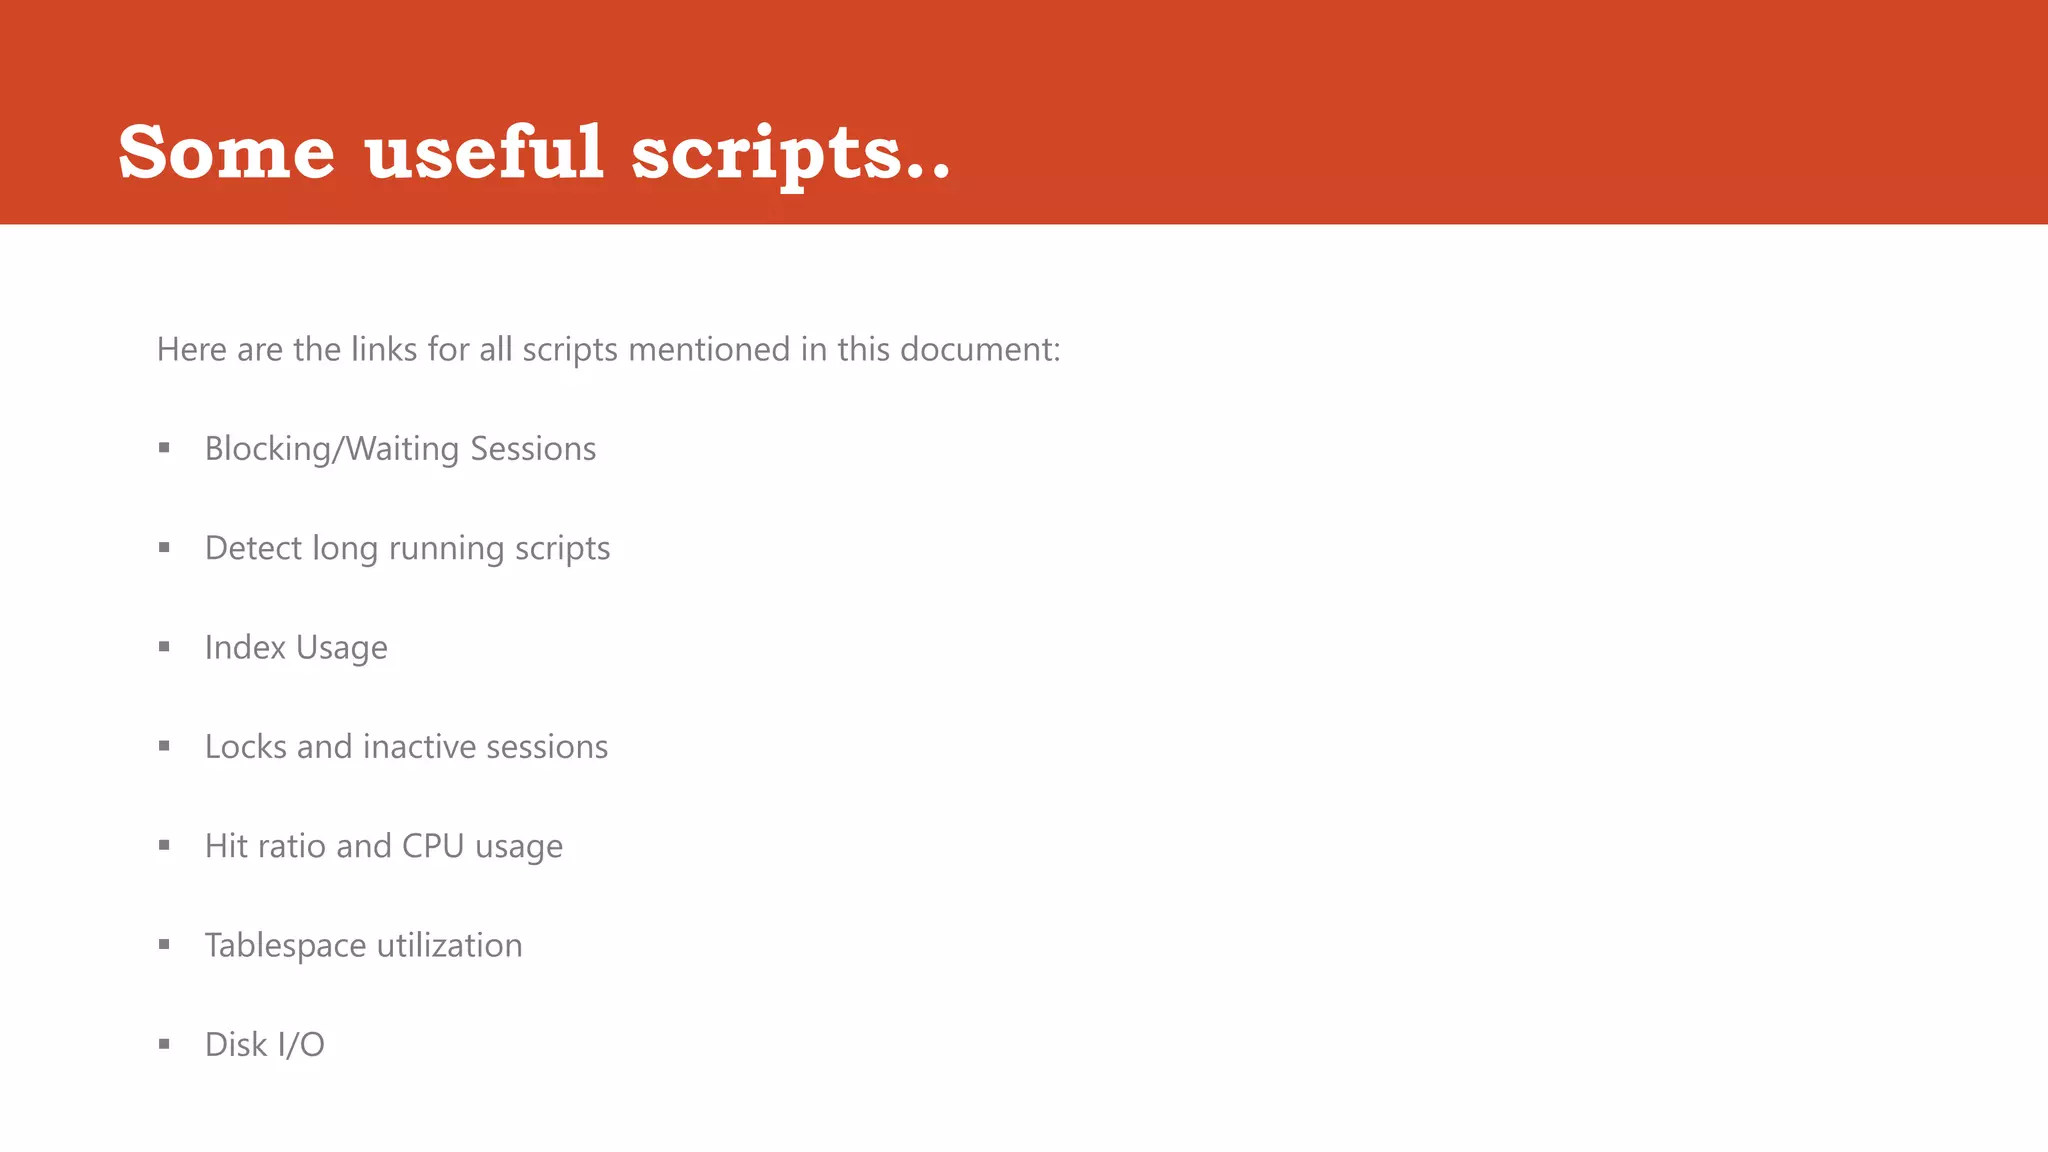
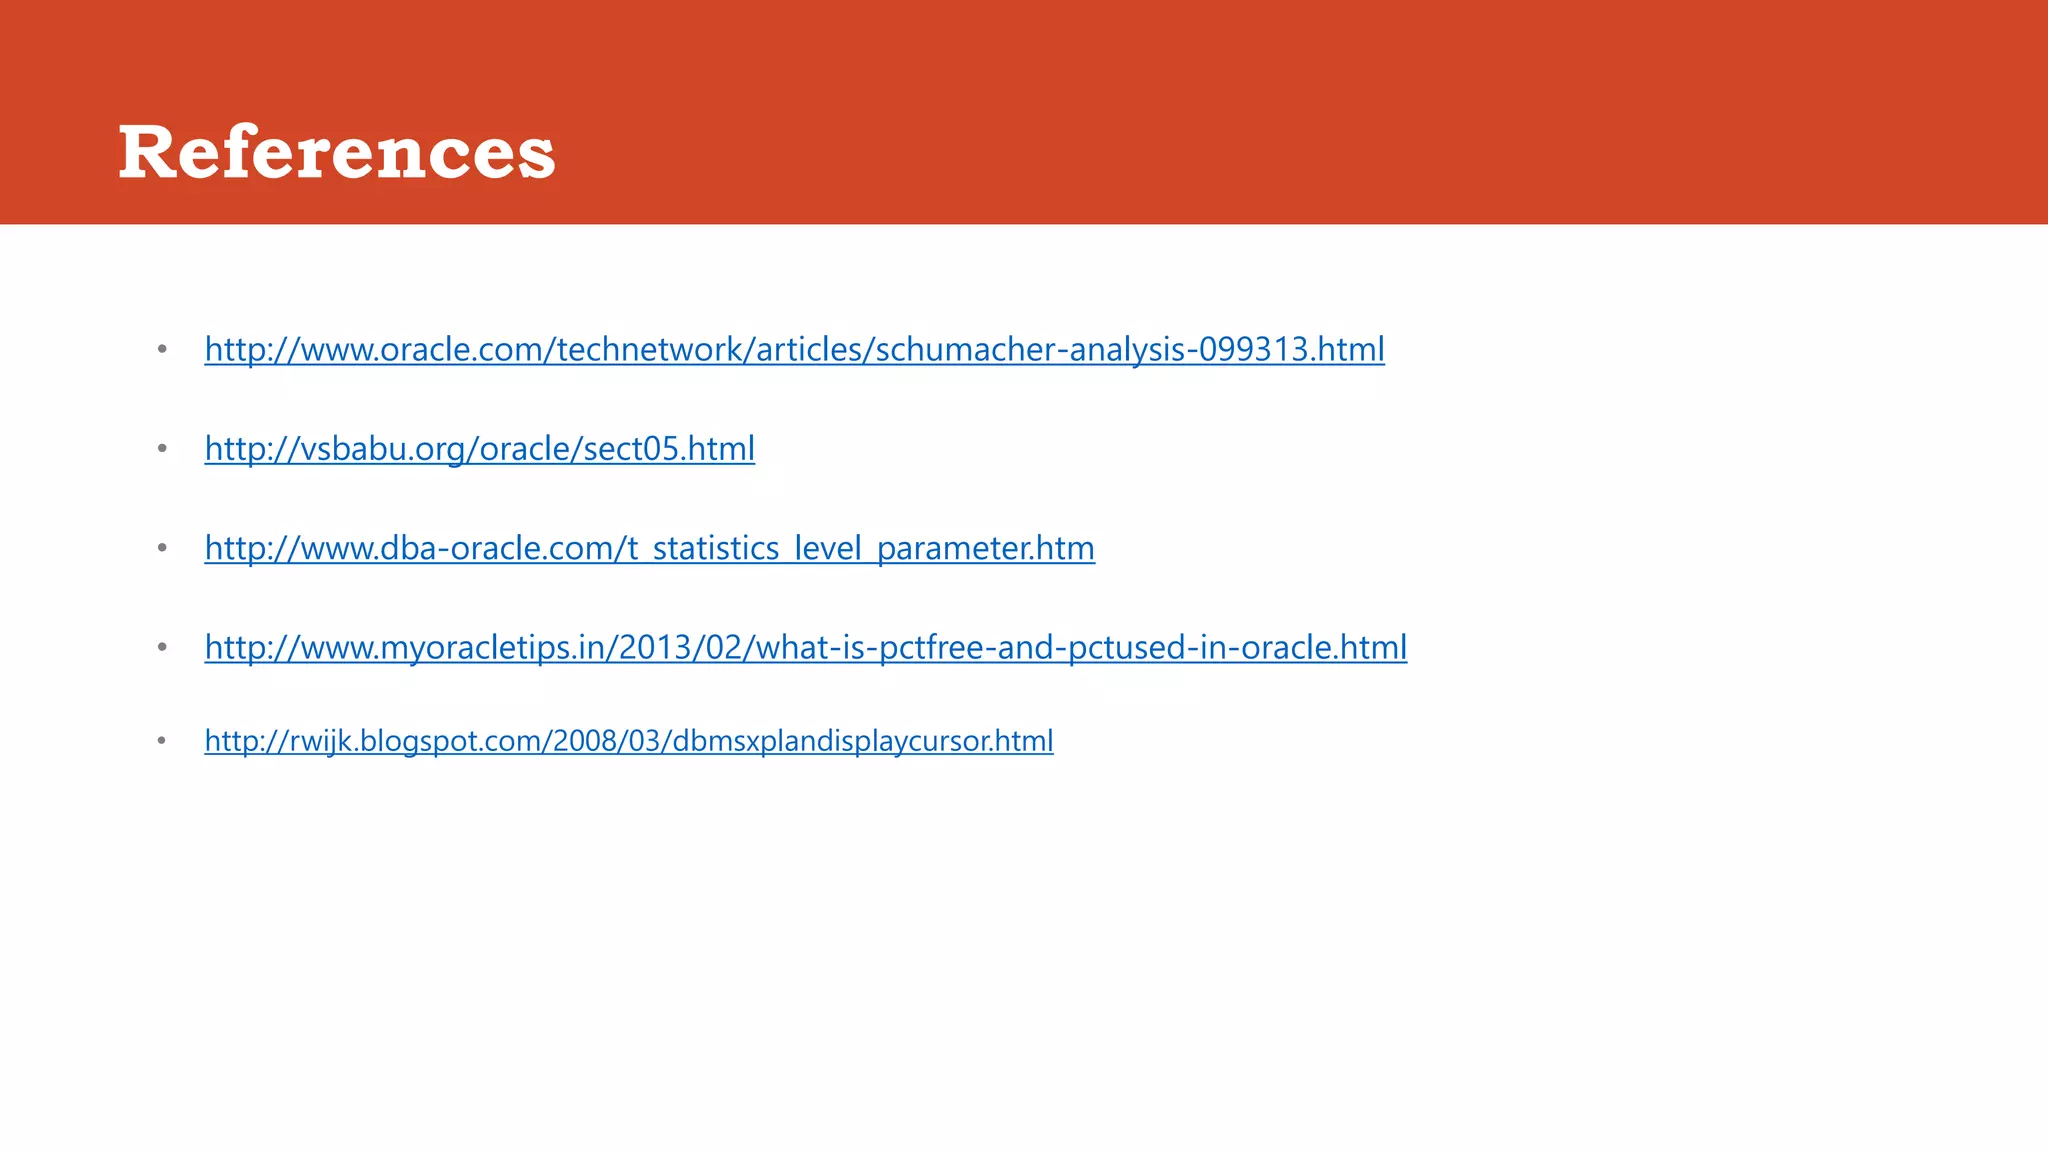

The document discusses Oracle database performance tuning. It covers identifying and resolving performance issues through tools like AWR and ASH reports. Common causes of performance problems include wait events, old statistics, incorrect execution plans, and I/O issues. The document recommends collecting specific data when analyzing problems and provides references and scripts for further tuning tasks.