Downloaded 1,612 times


![JRockit Mission Control • Memory Leak Detector • Shows overall trend • The growth rate of each type (class) is shown, rather than just the percentage of the heap they take up. • No common classes from showing at the top (like char[] arrays) • Visual representation of hot objects in the heap • By type • See how each class is referenced by other classes • By instance • Can also see how each instance of each class is referenced • Shows where objects are allocated • See stack trace of each method holding an instance and what percentage of instances are held by each method.](https://image.slidesharecdn.com/wlsdiagperfseminar-141112023009-conversion-gate02/75/Oracle-WebLogic-Diagnostics-Perfomance-tuning-52-2048.jpg)


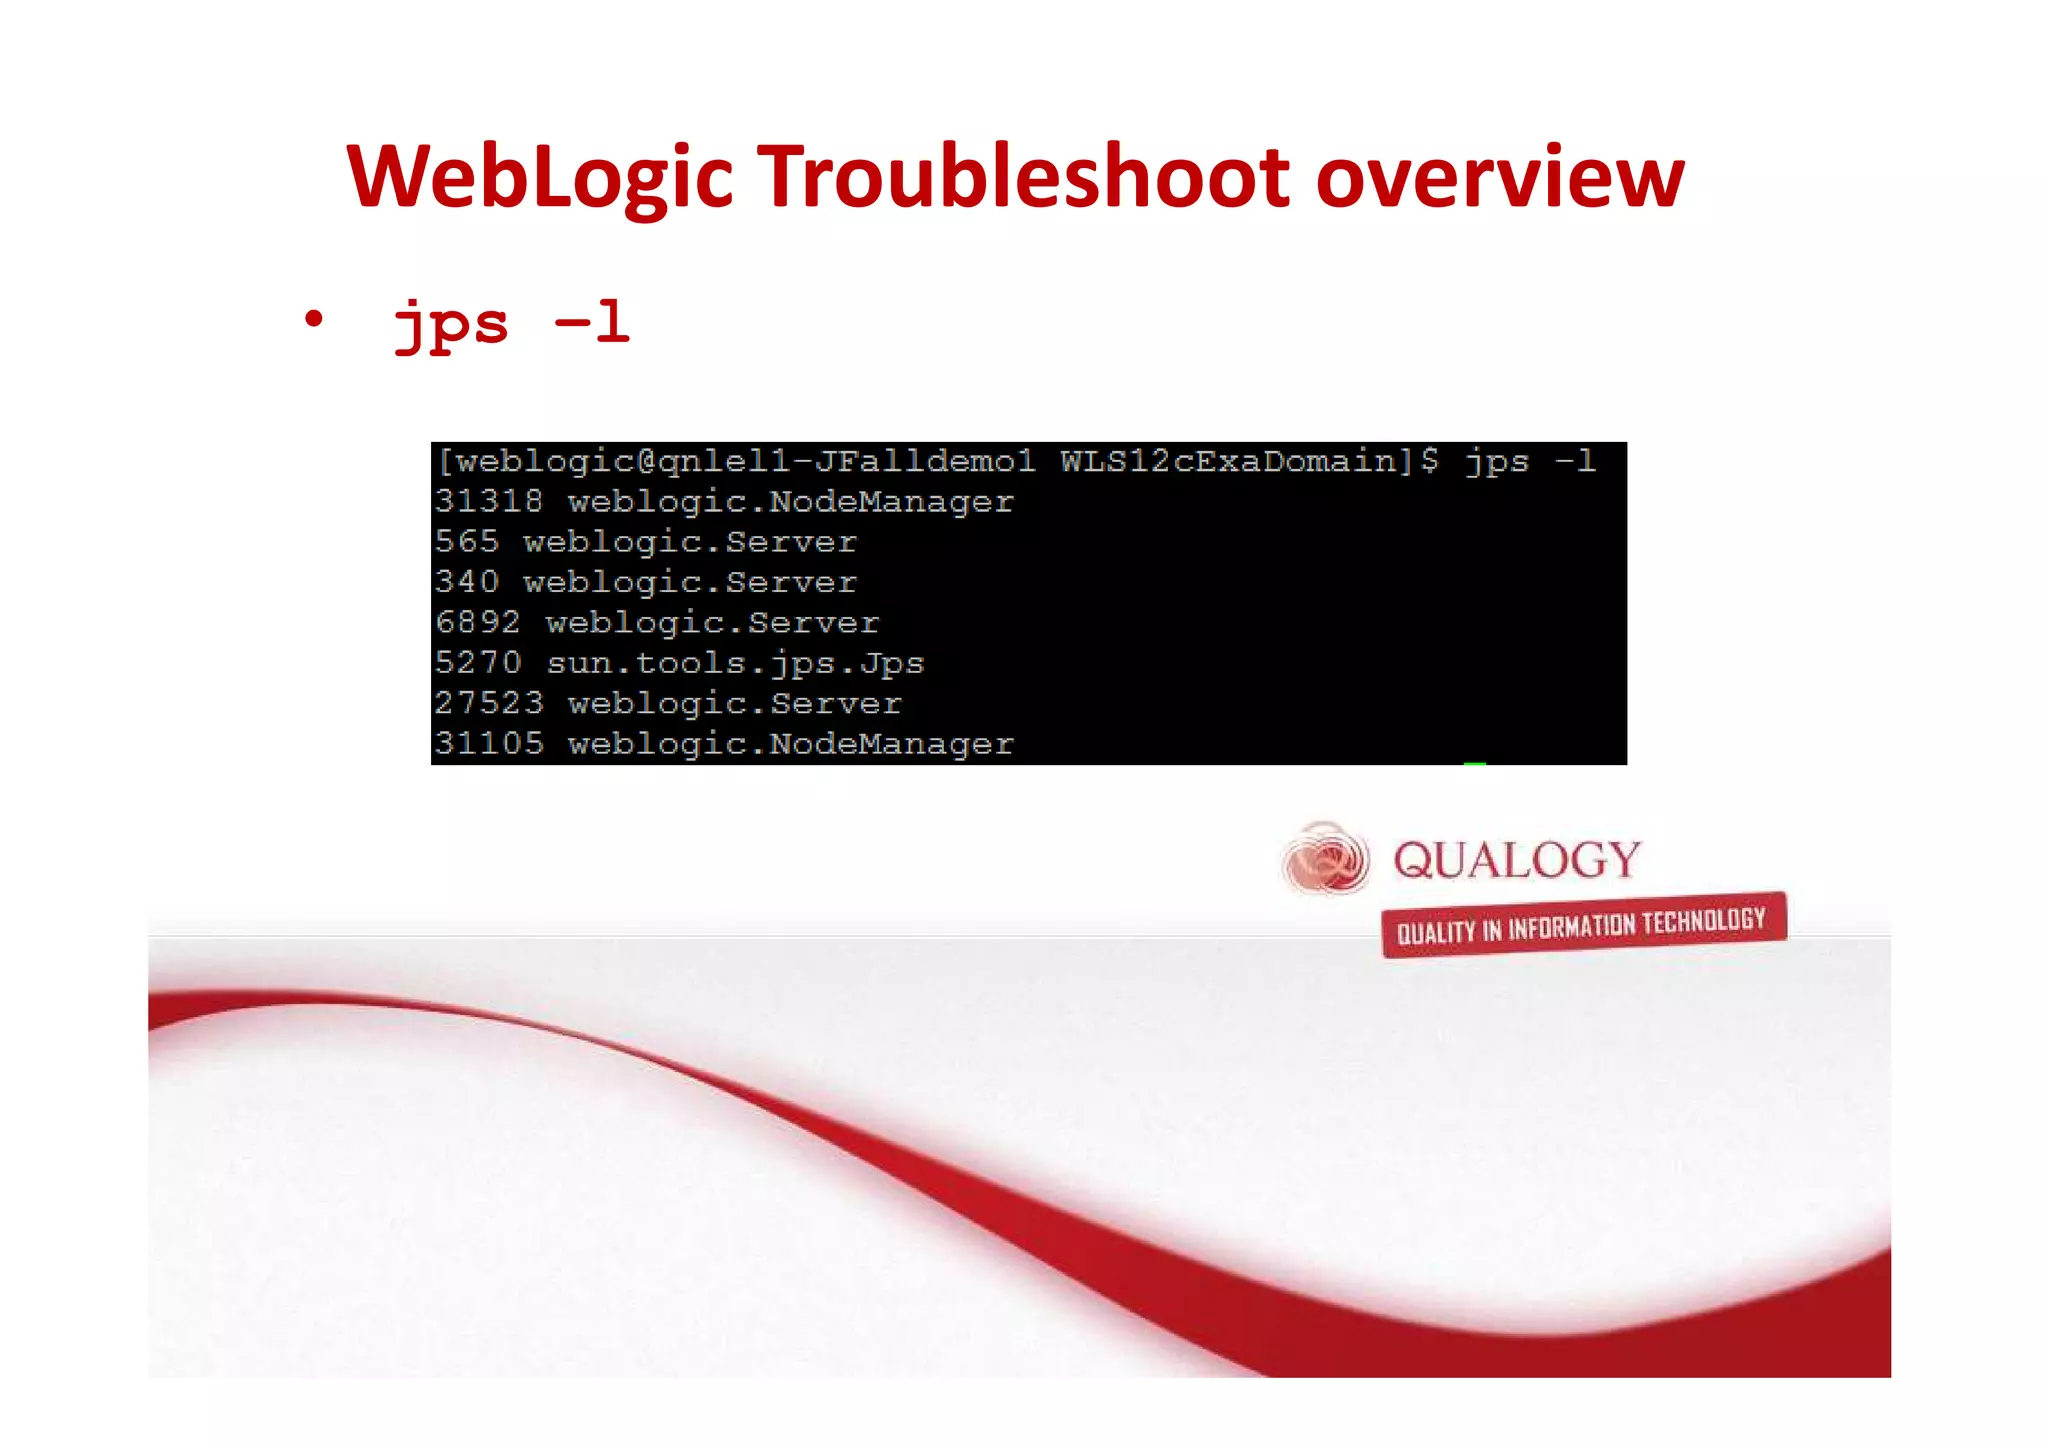
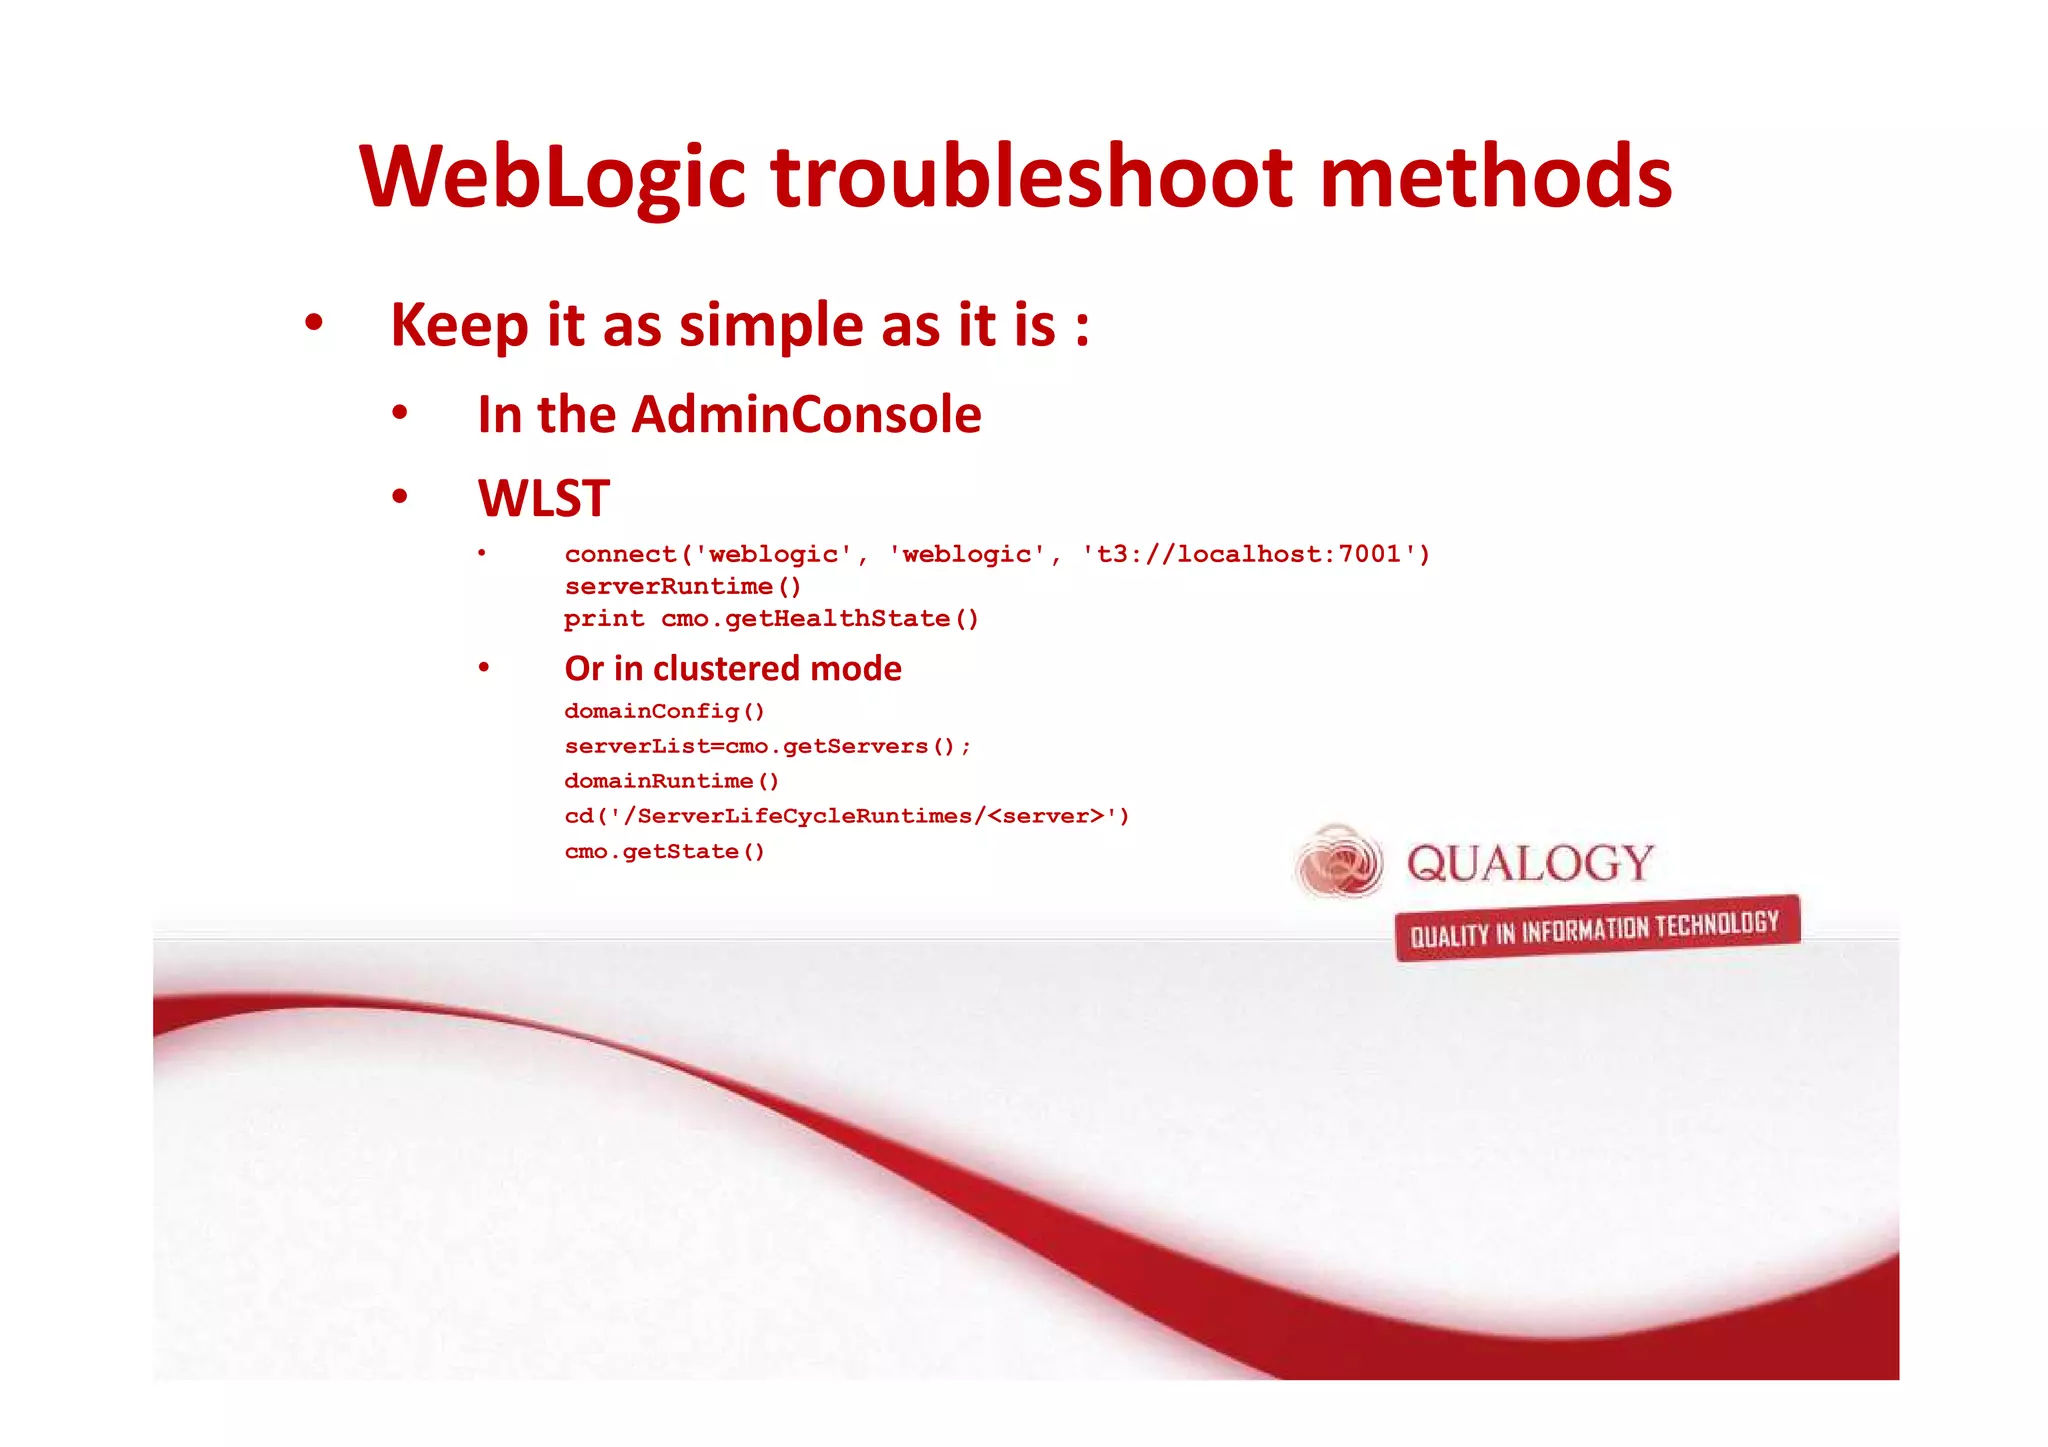
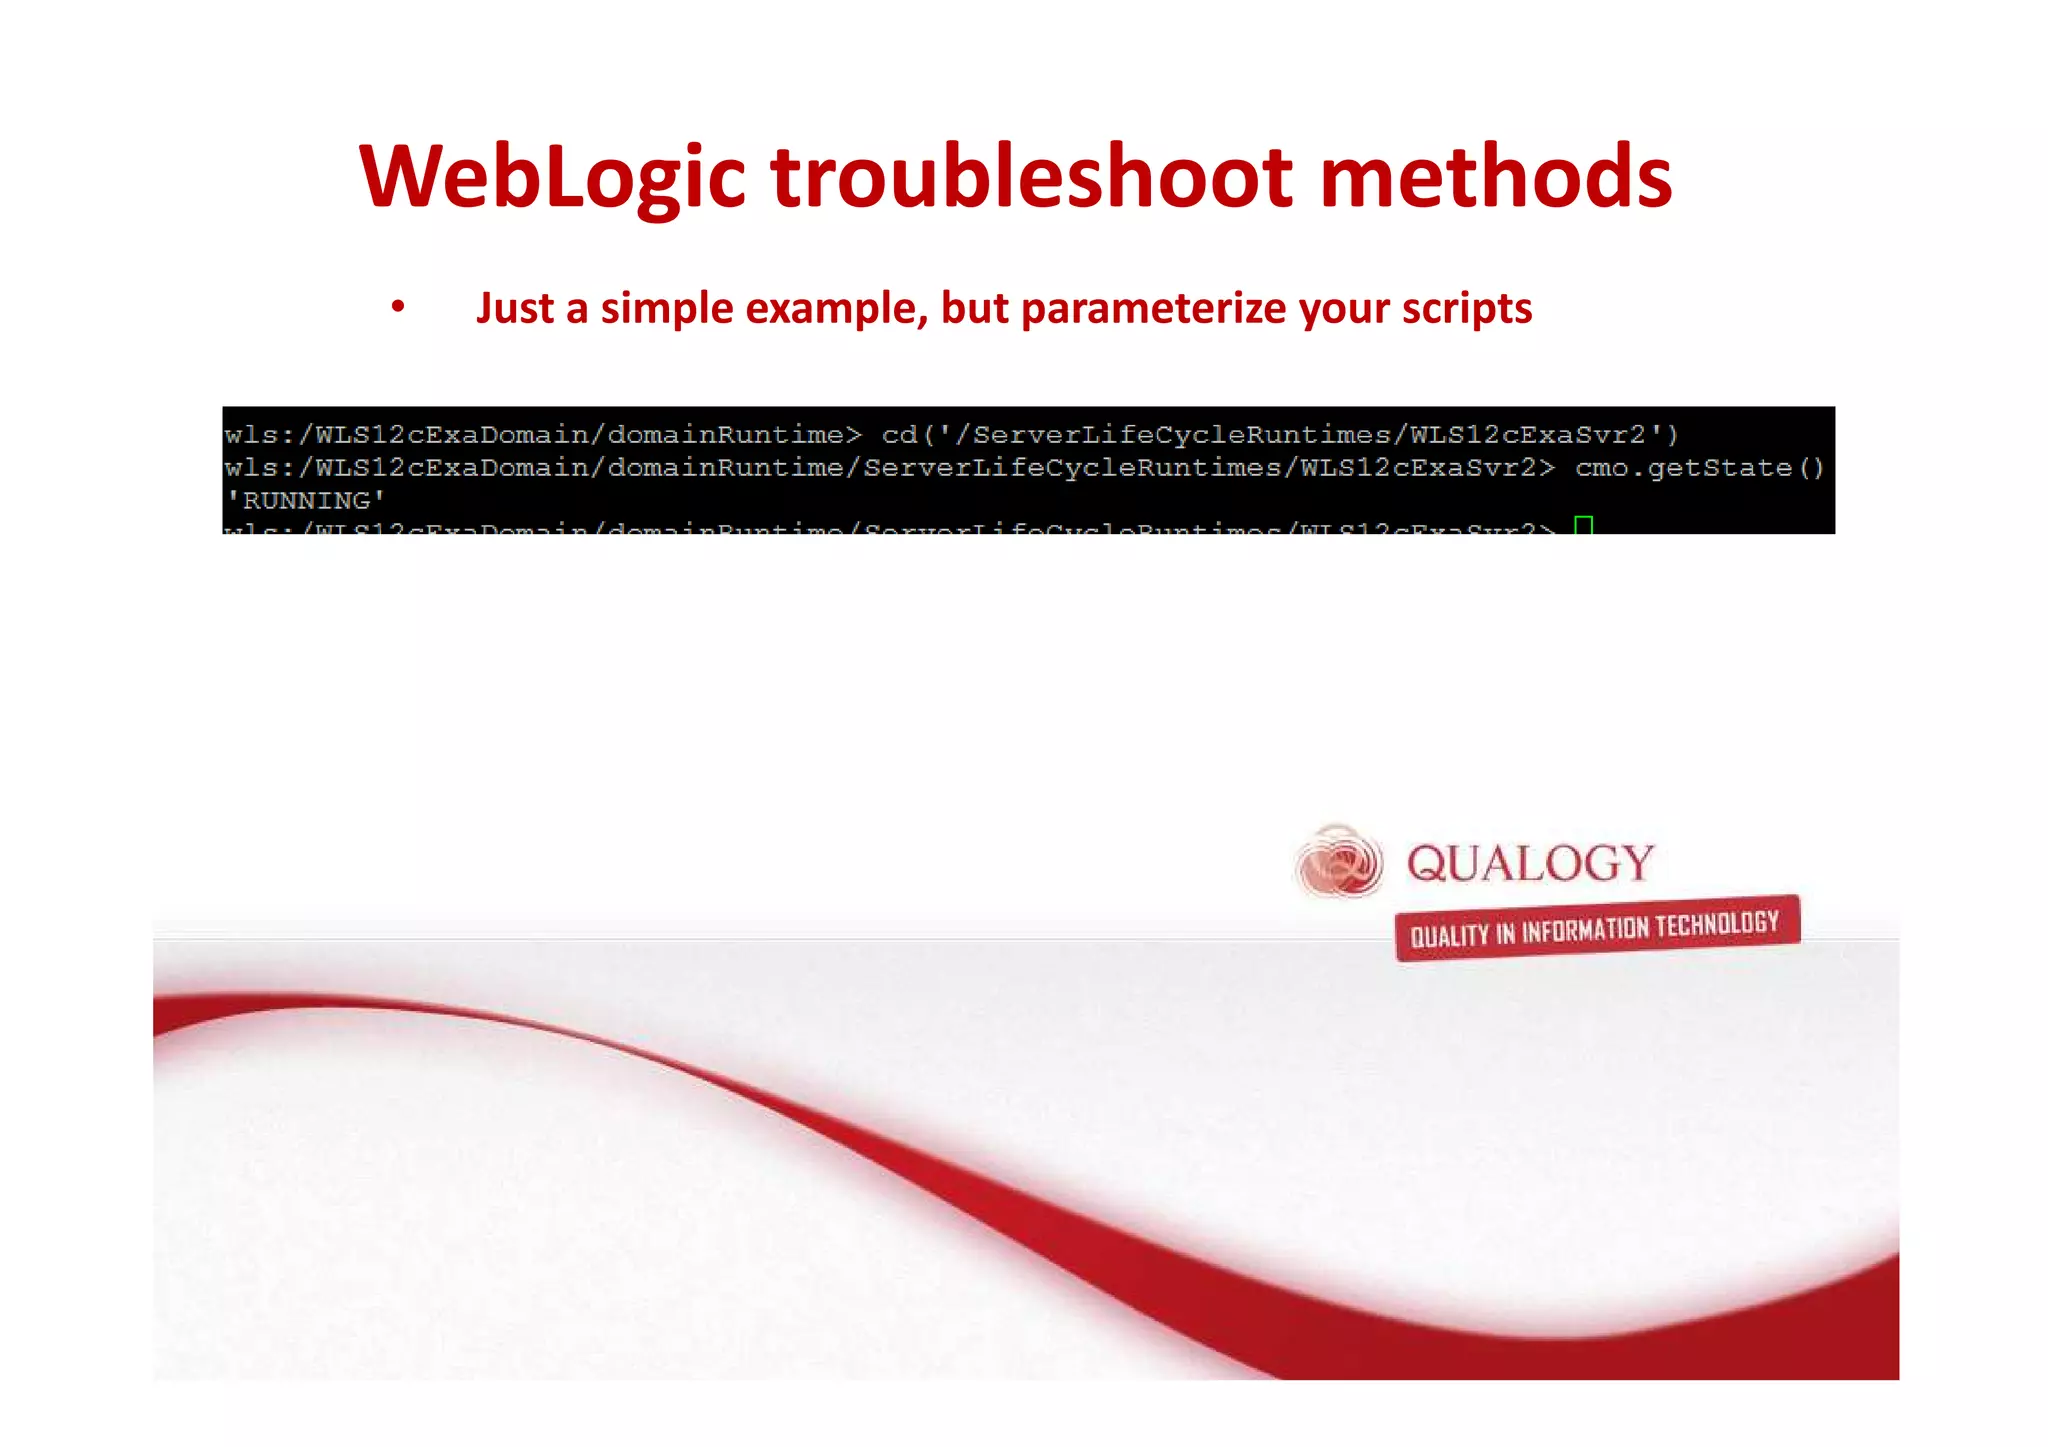
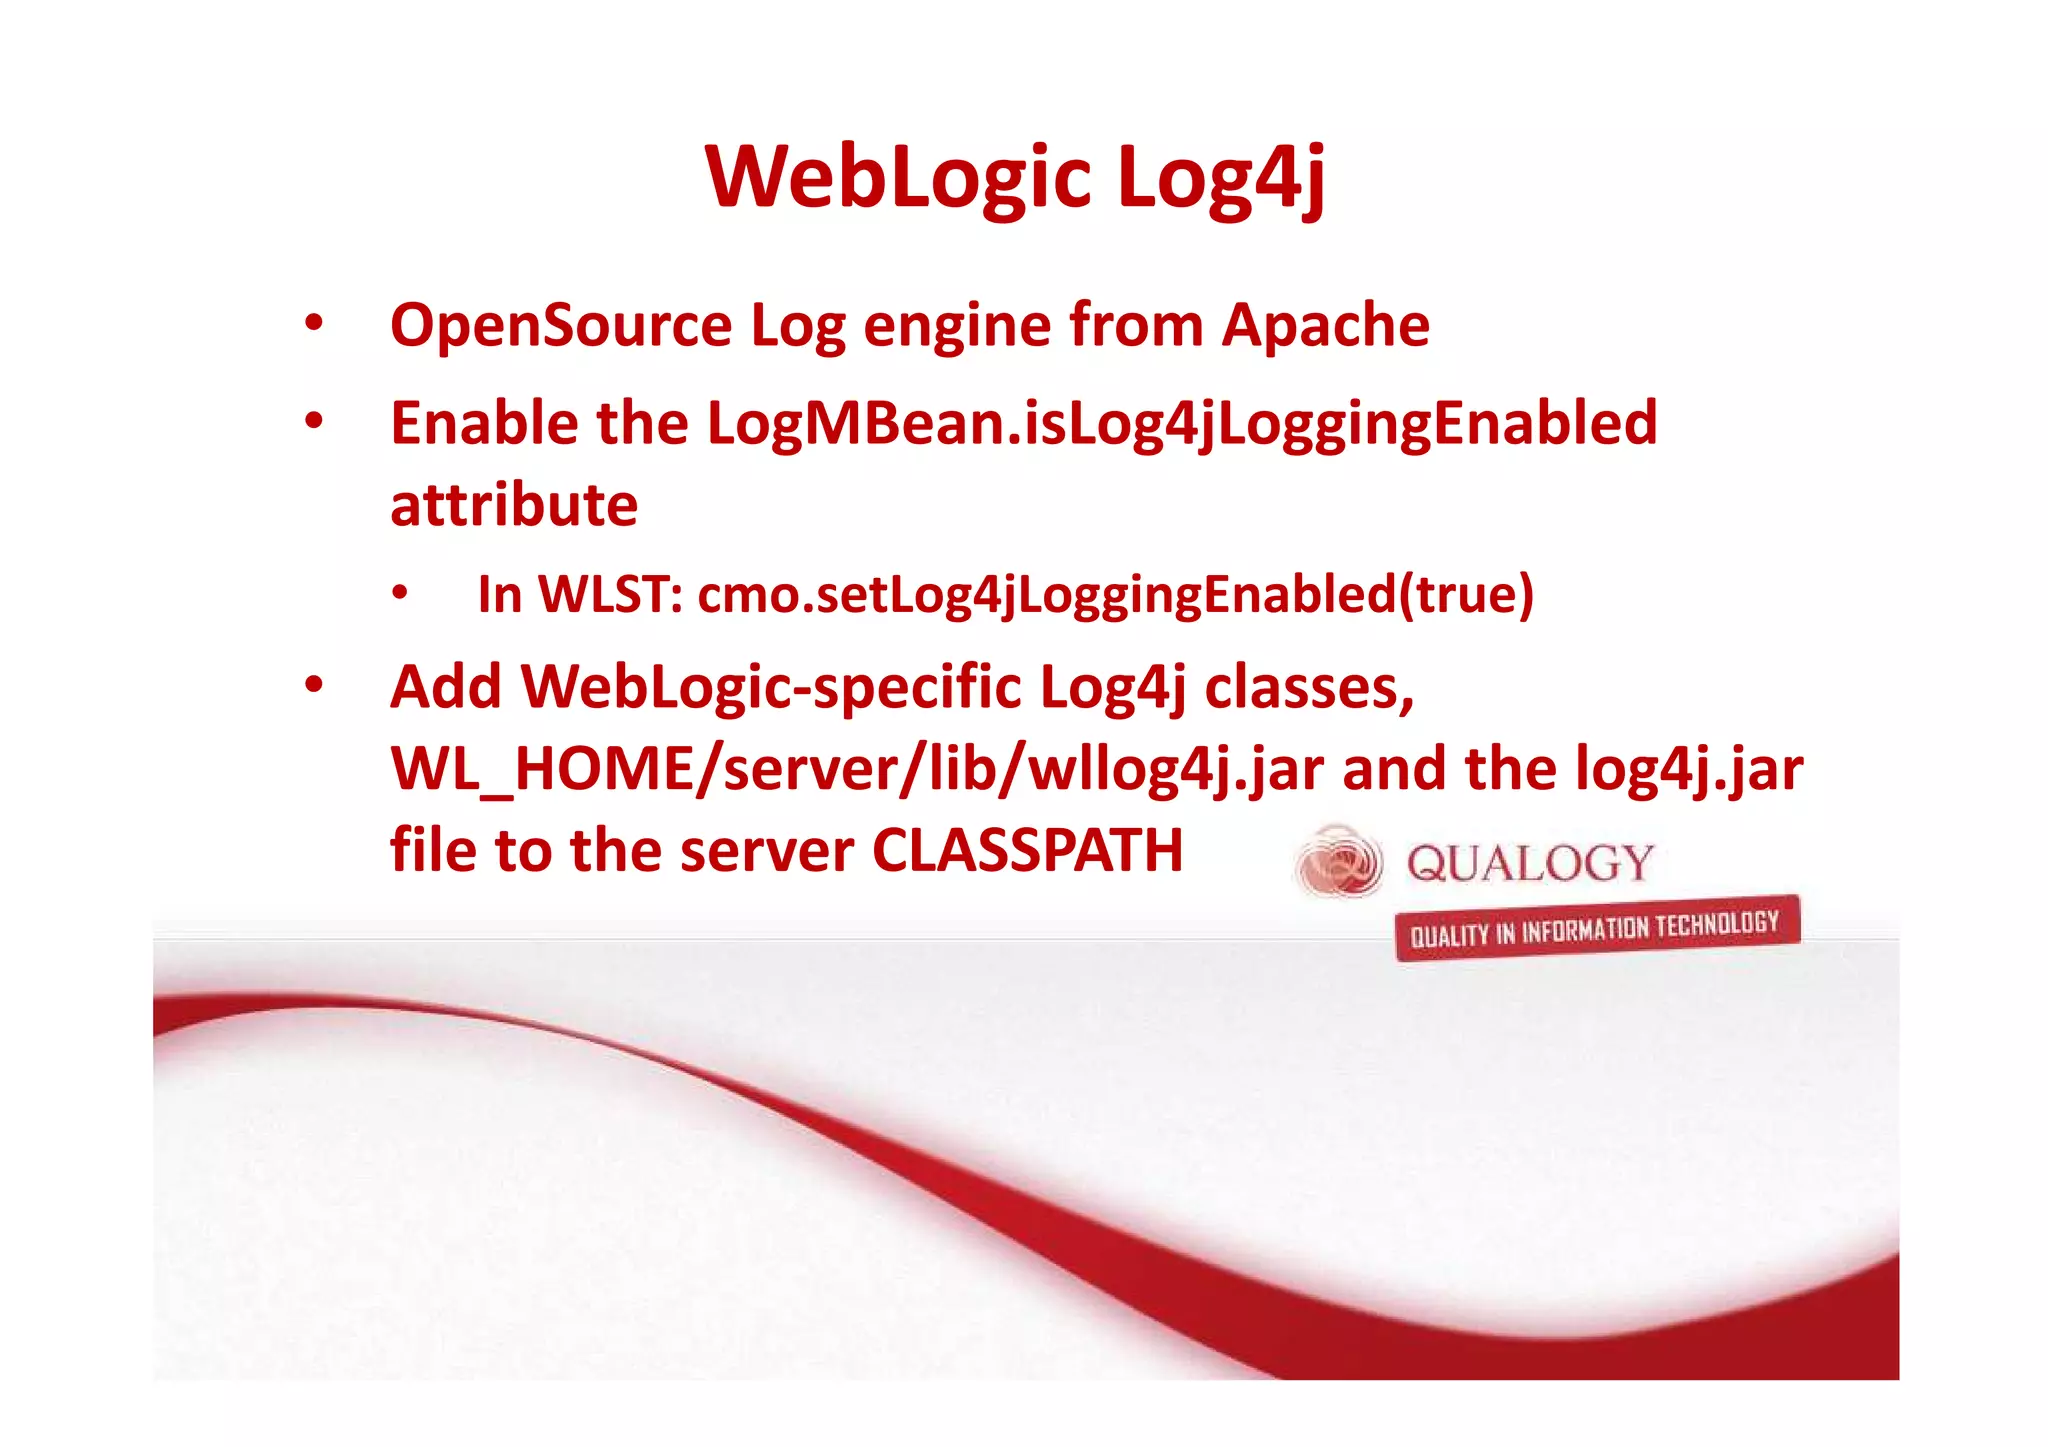
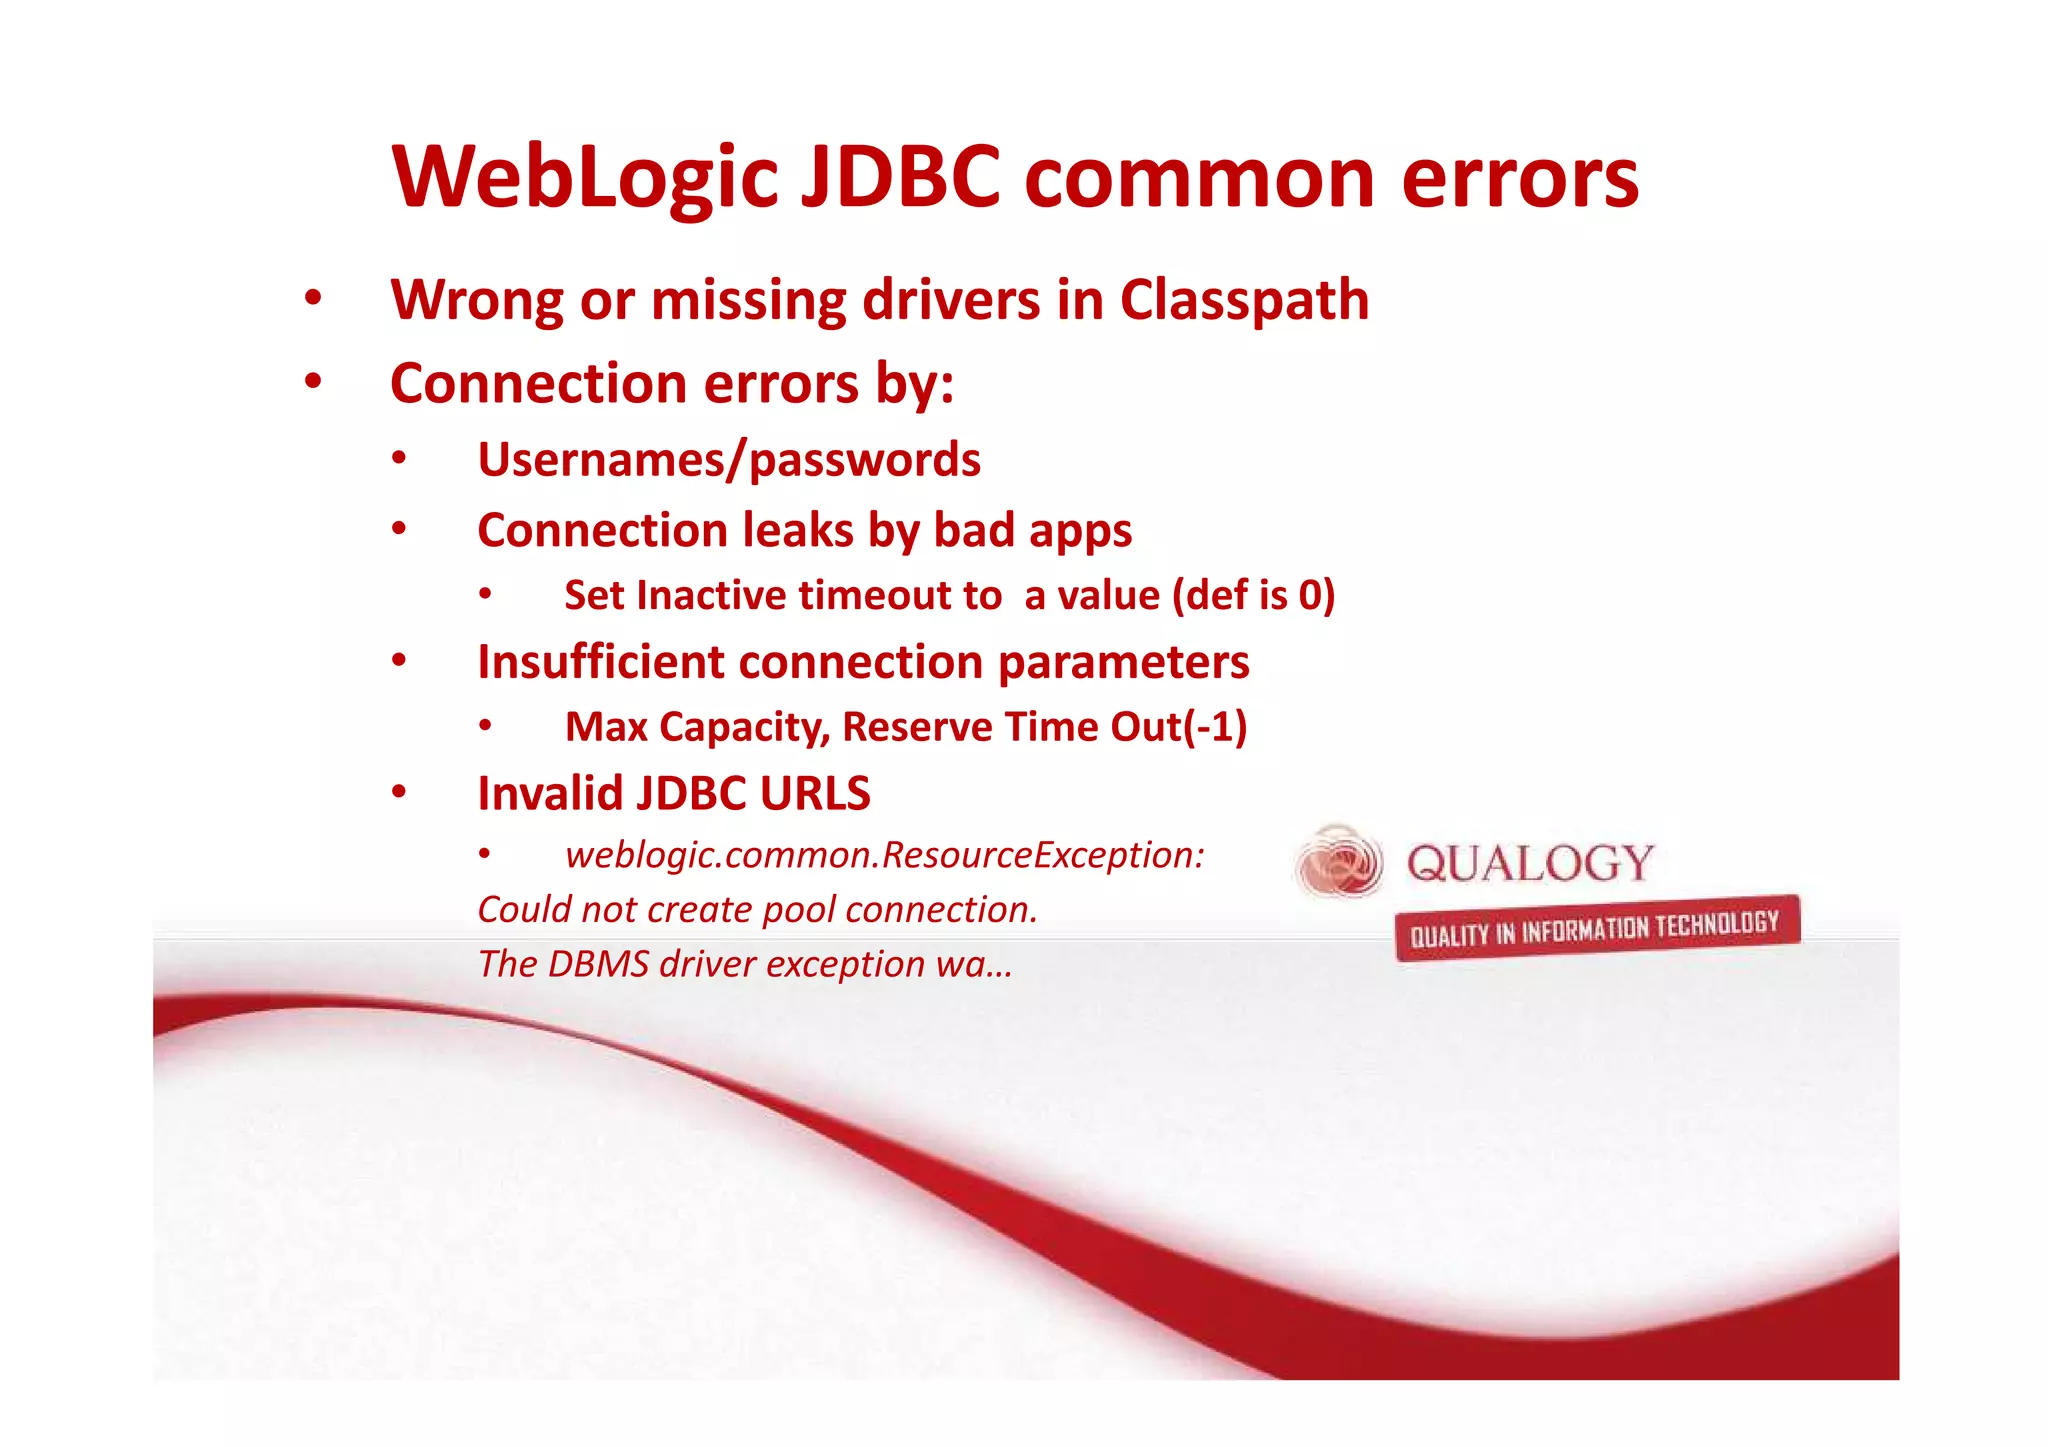
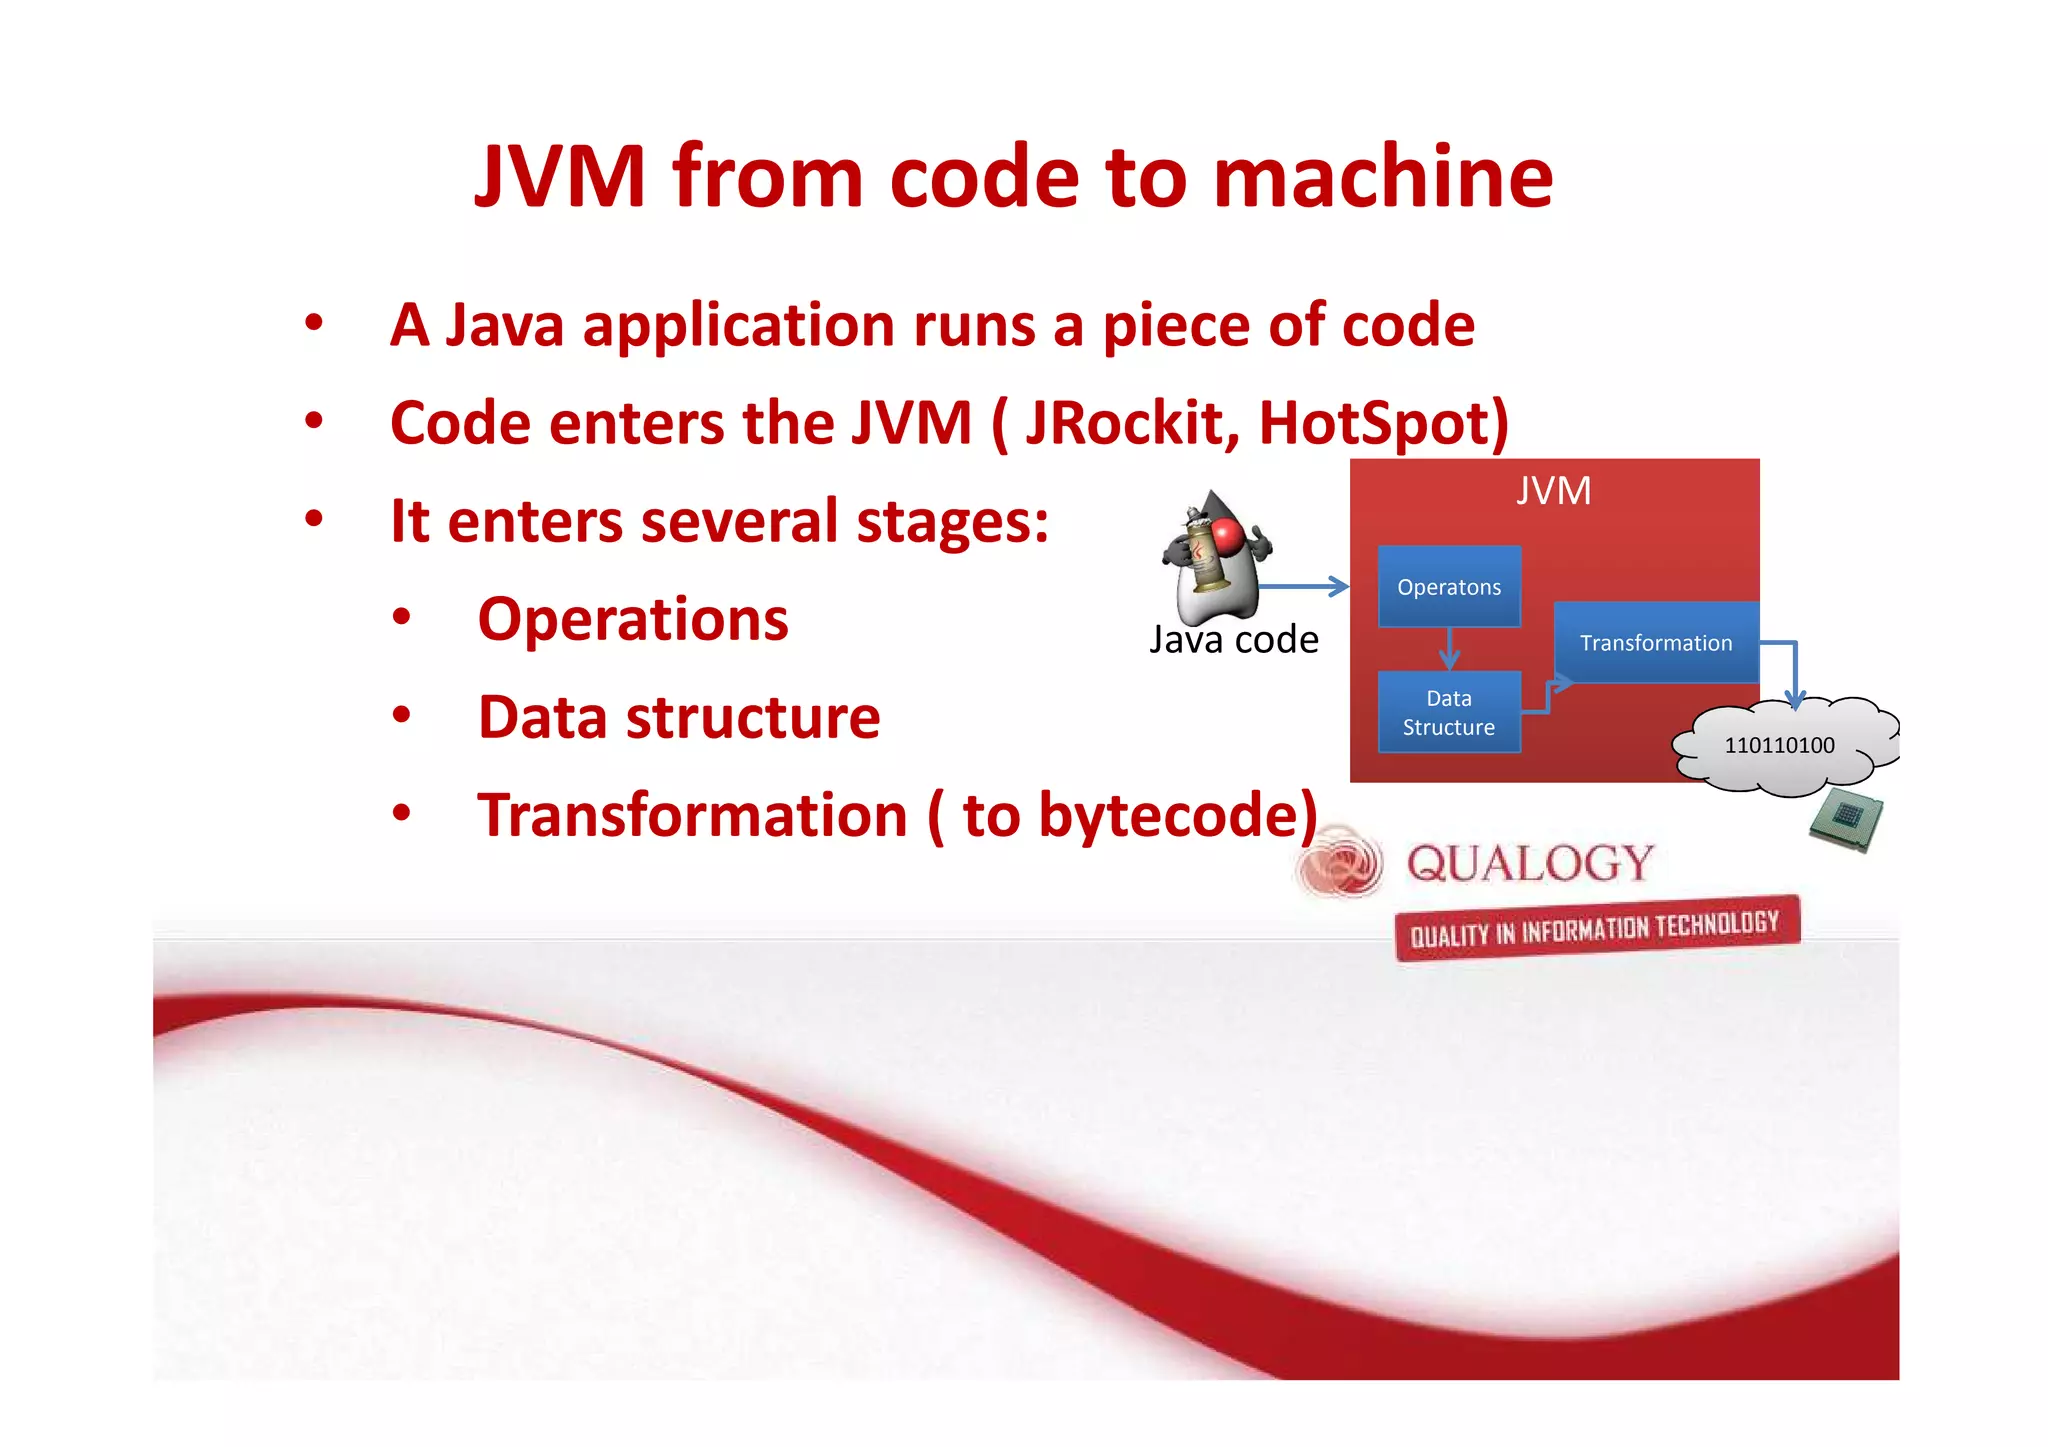
This document discusses troubleshooting Oracle WebLogic performance issues. It outlines various tools that can be used for troubleshooting including operating system tools like sar and vmstat, Java tools like jps and jstat, and WebLogic-specific tools like the WebLogic Diagnostics Framework. It also covers taking thread dumps, configuring WebLogic logging and debugging options, and using the Oracle Diagnostic Logging framework.
Overview of Oracle WebLogic's performance troubleshooting by Michel Schildmeijer, including personal experience.
Introduction to methods for troubleshooting WebLogic Server, including error detection and checks with system tools.
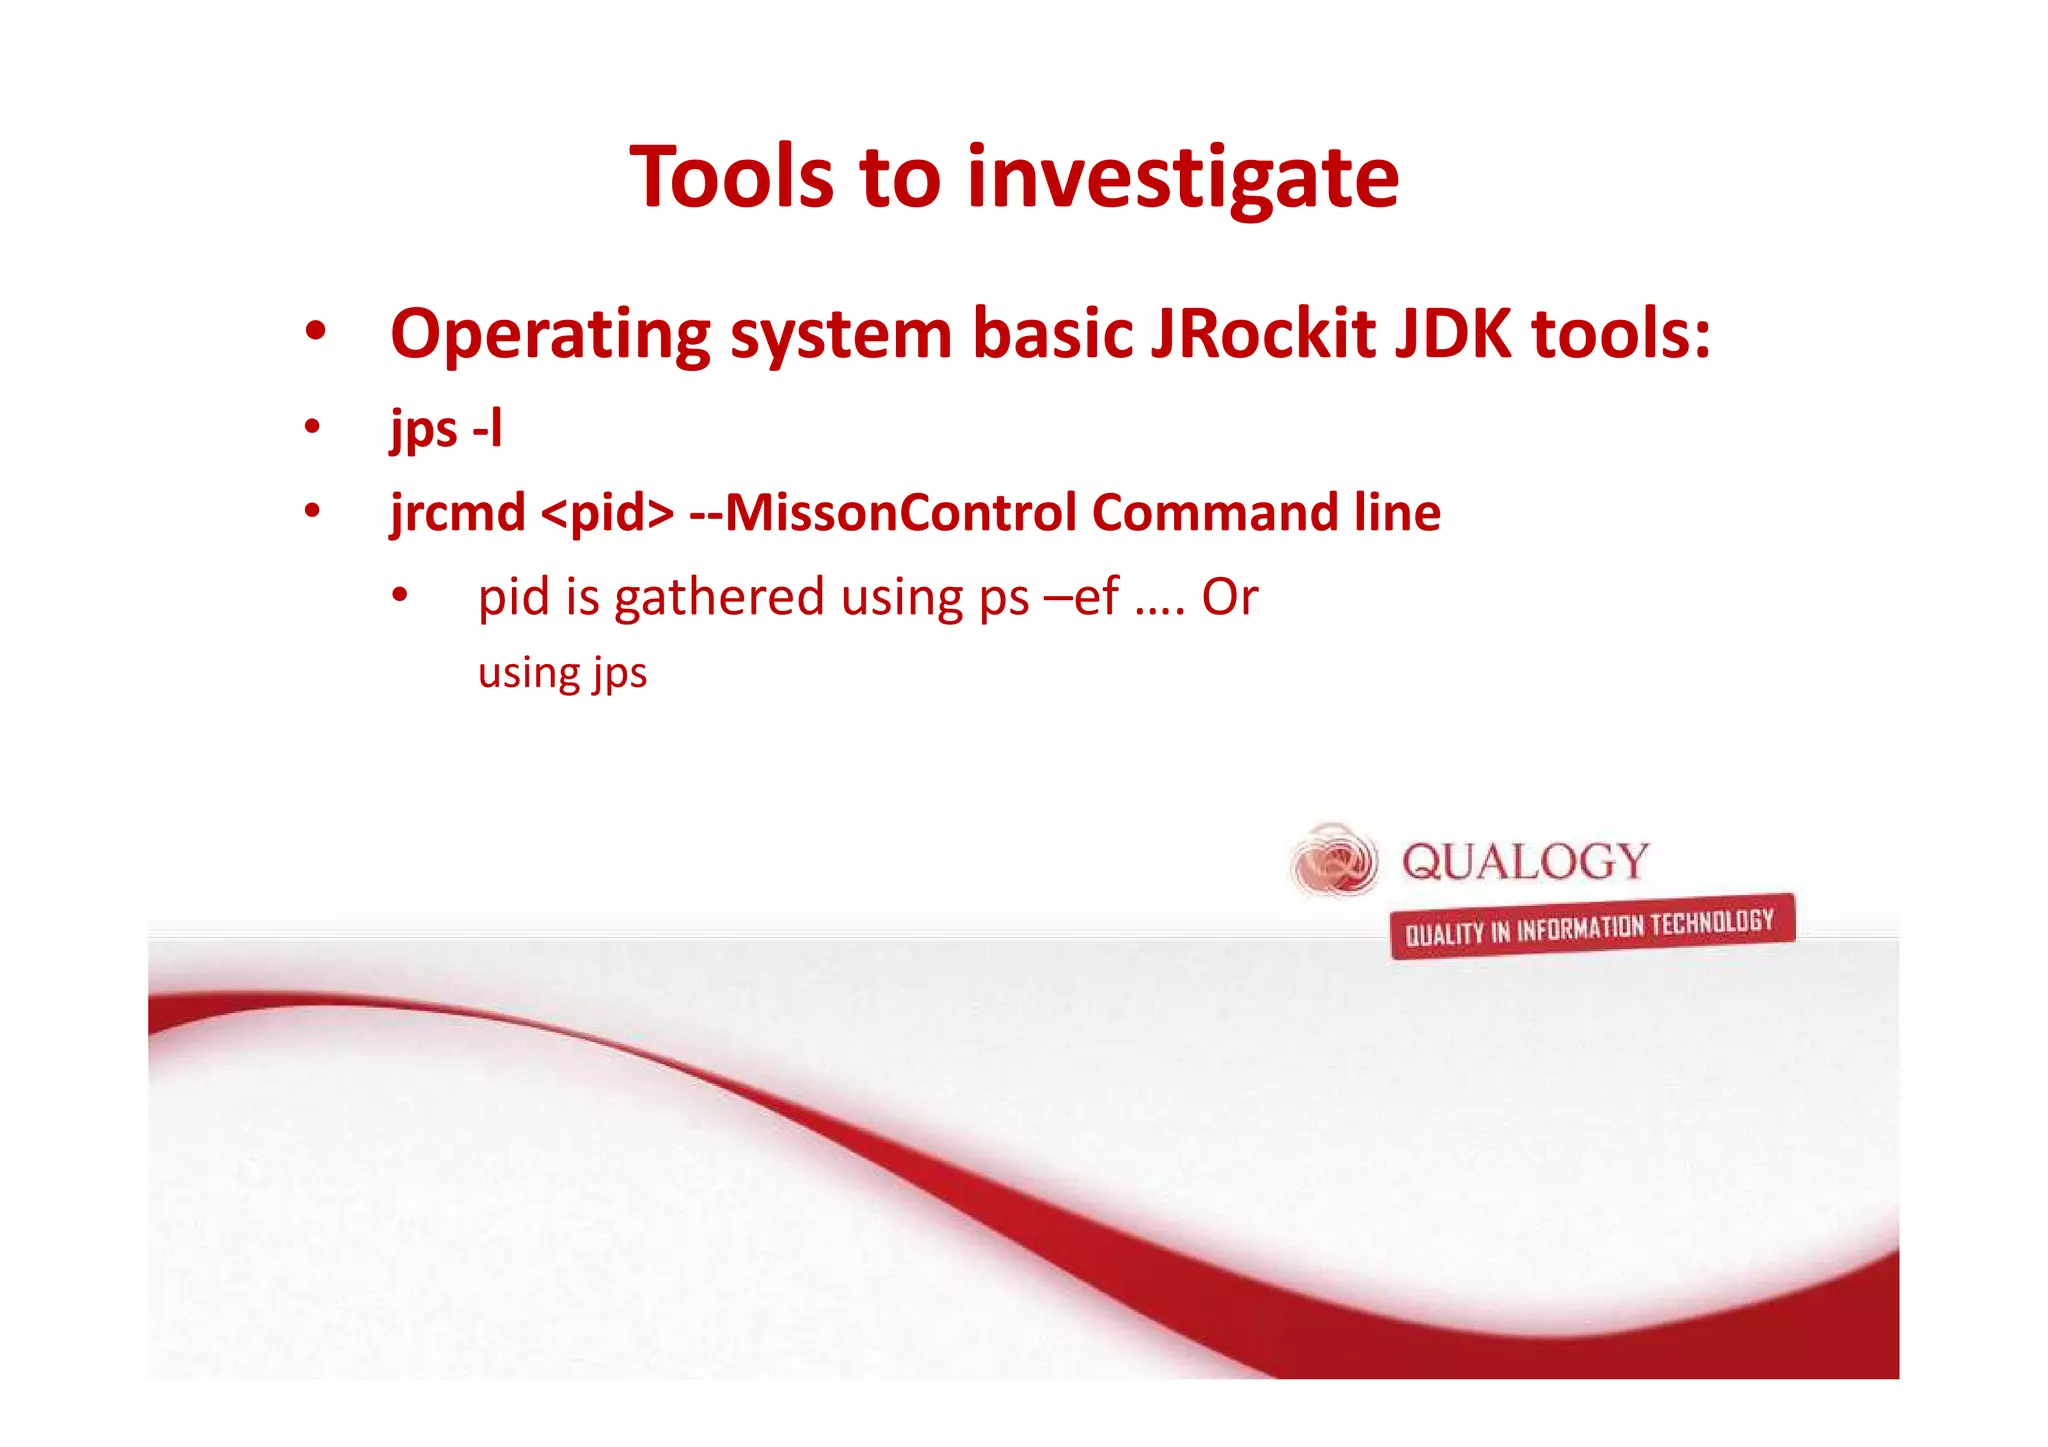
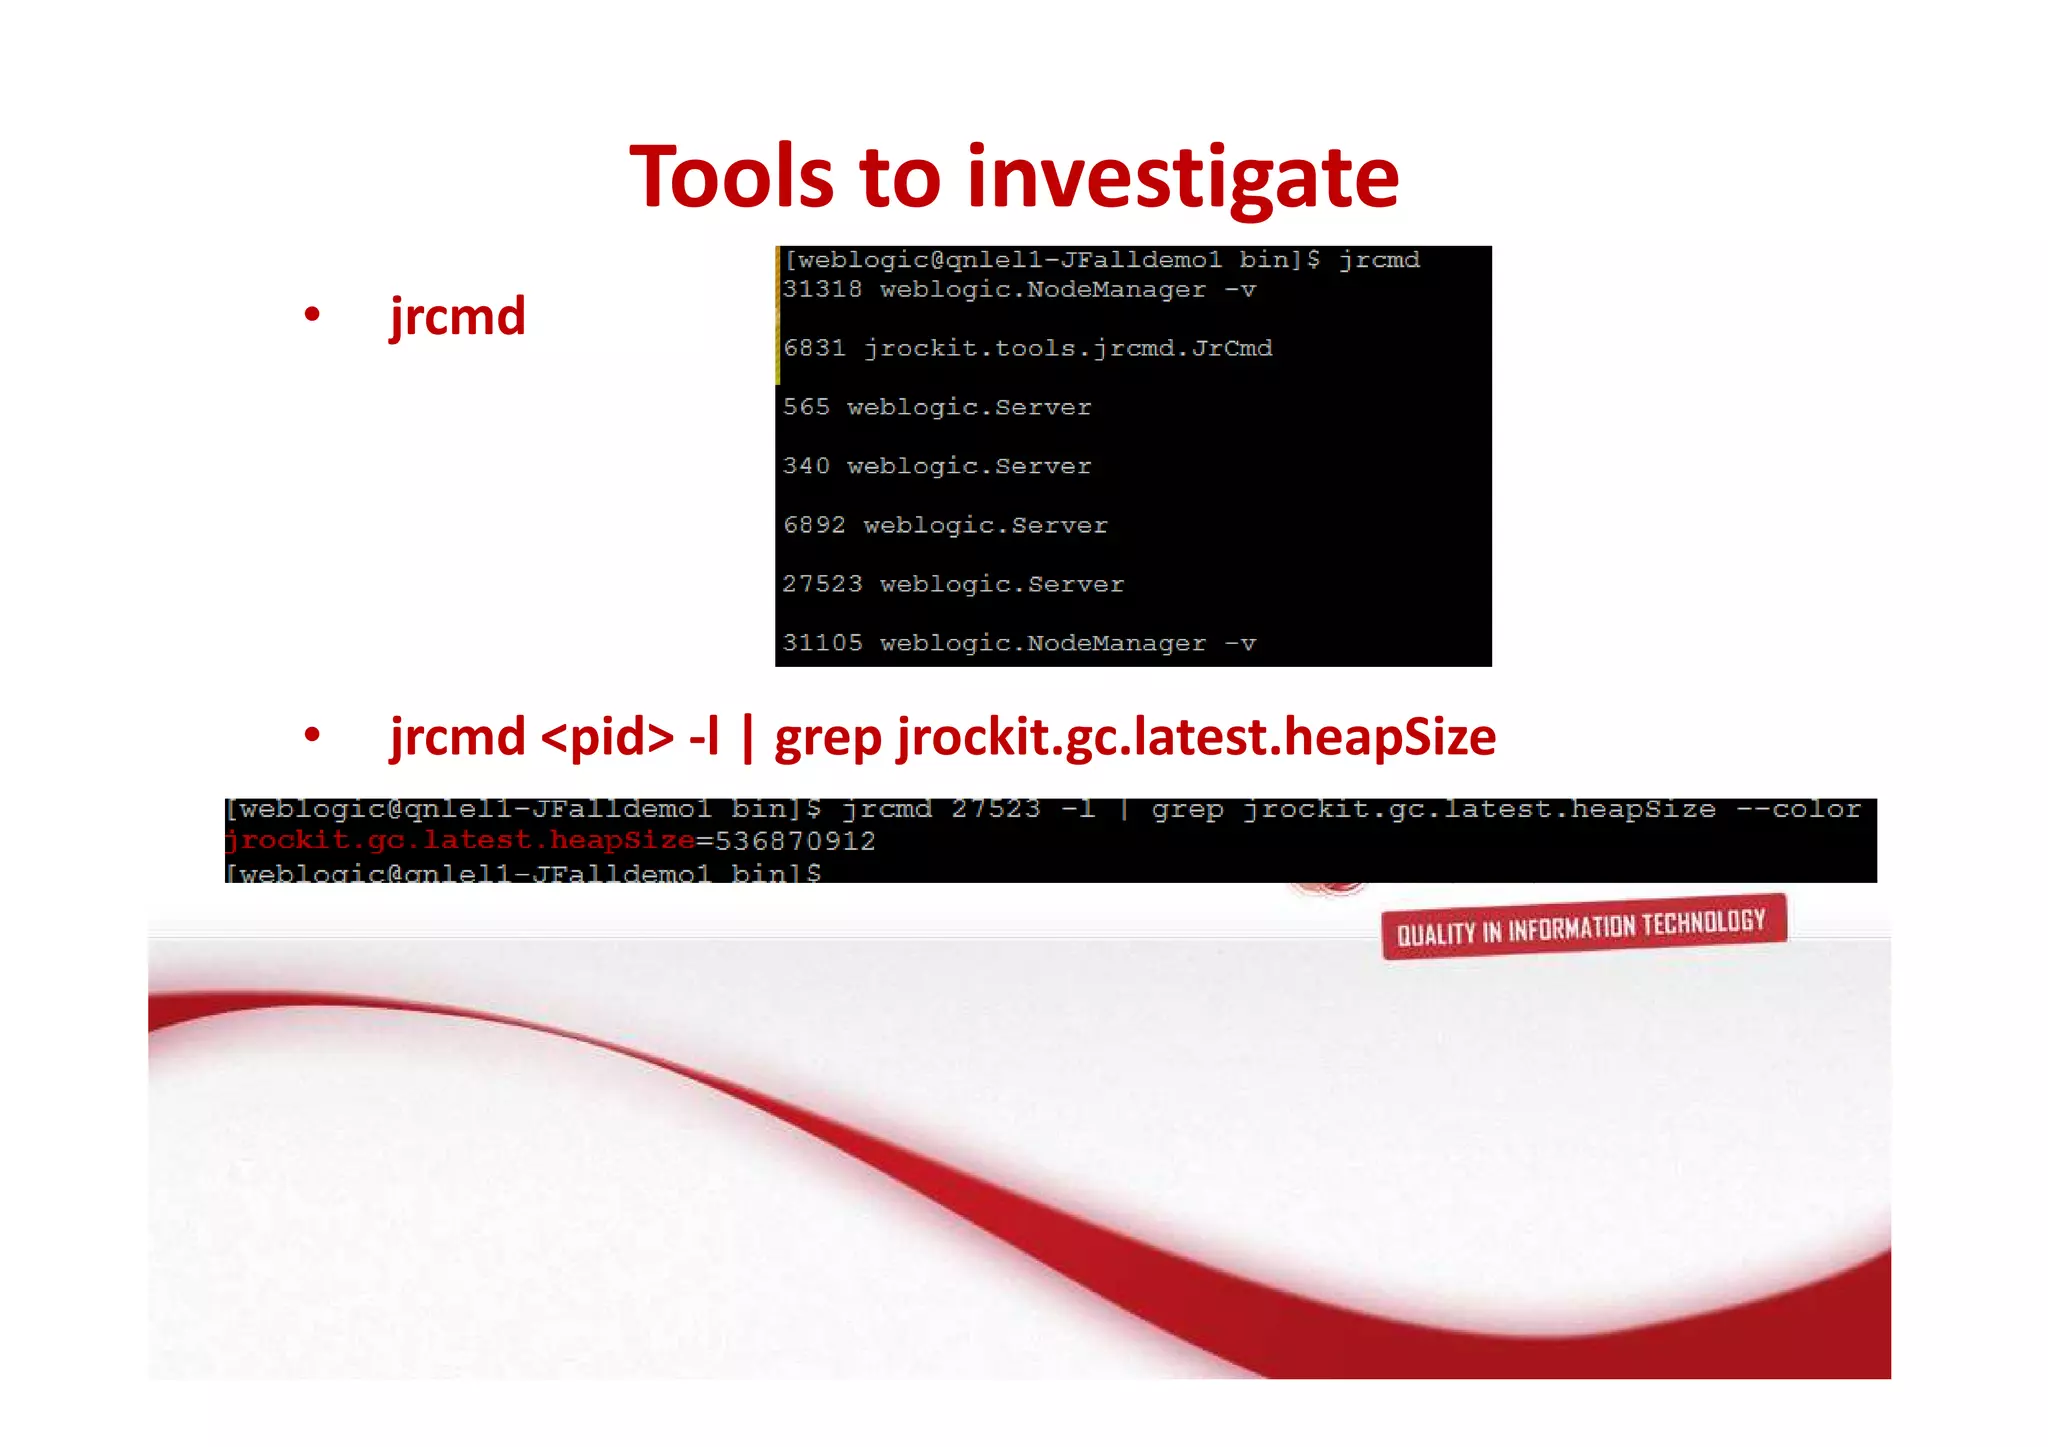
Various tools and commands for investigating performance issues in Oracle WebLogic, including JVM tools and application server insights.
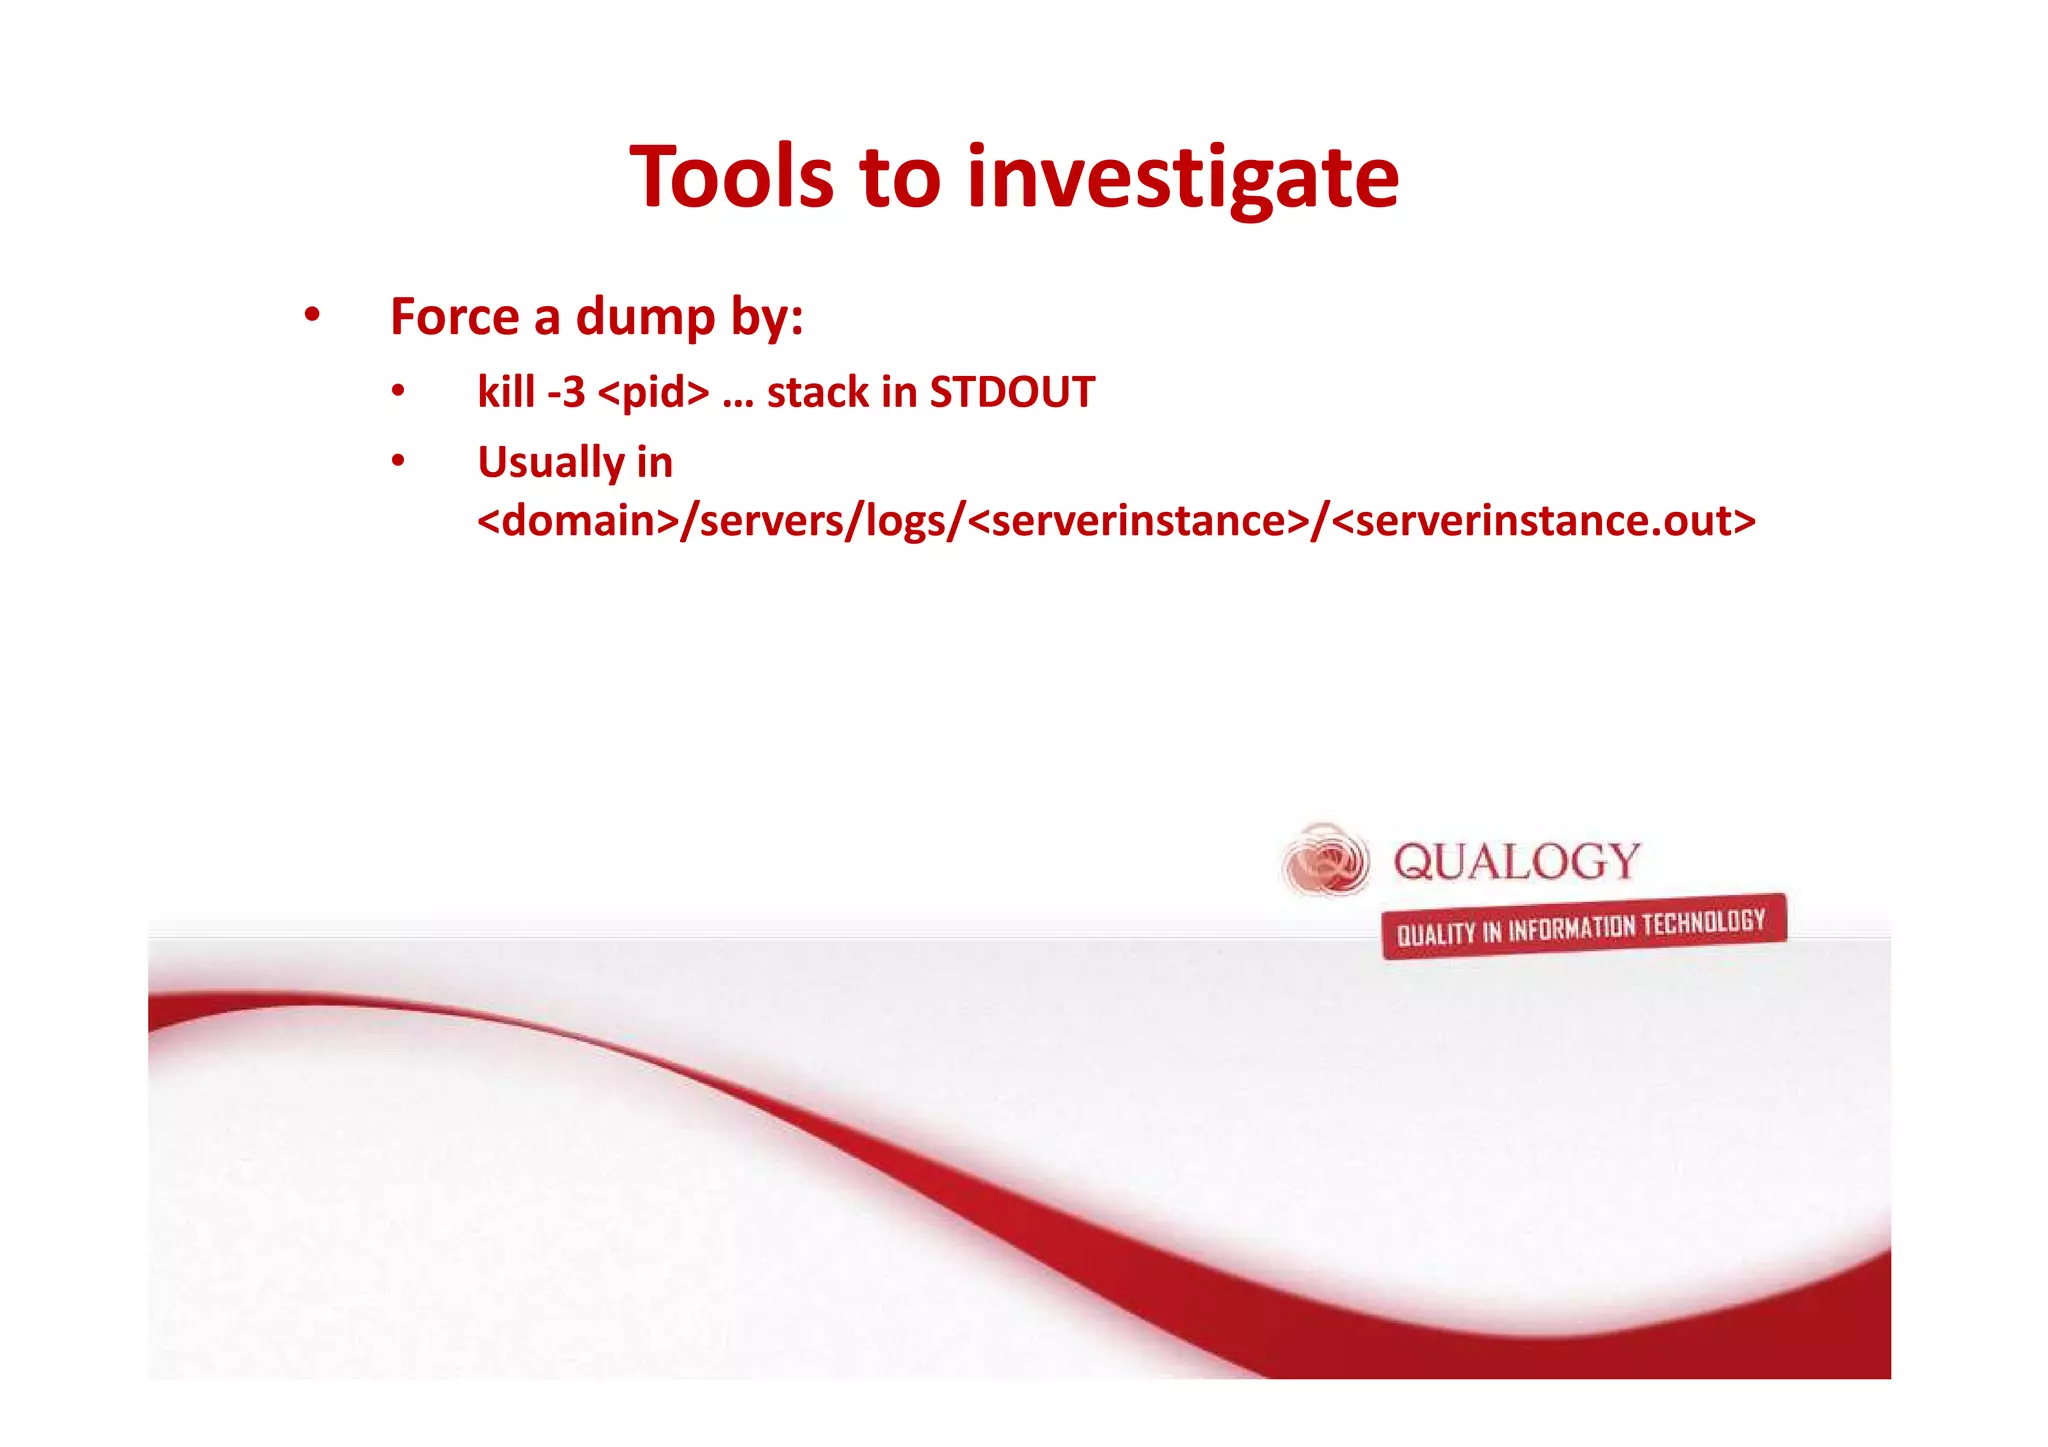
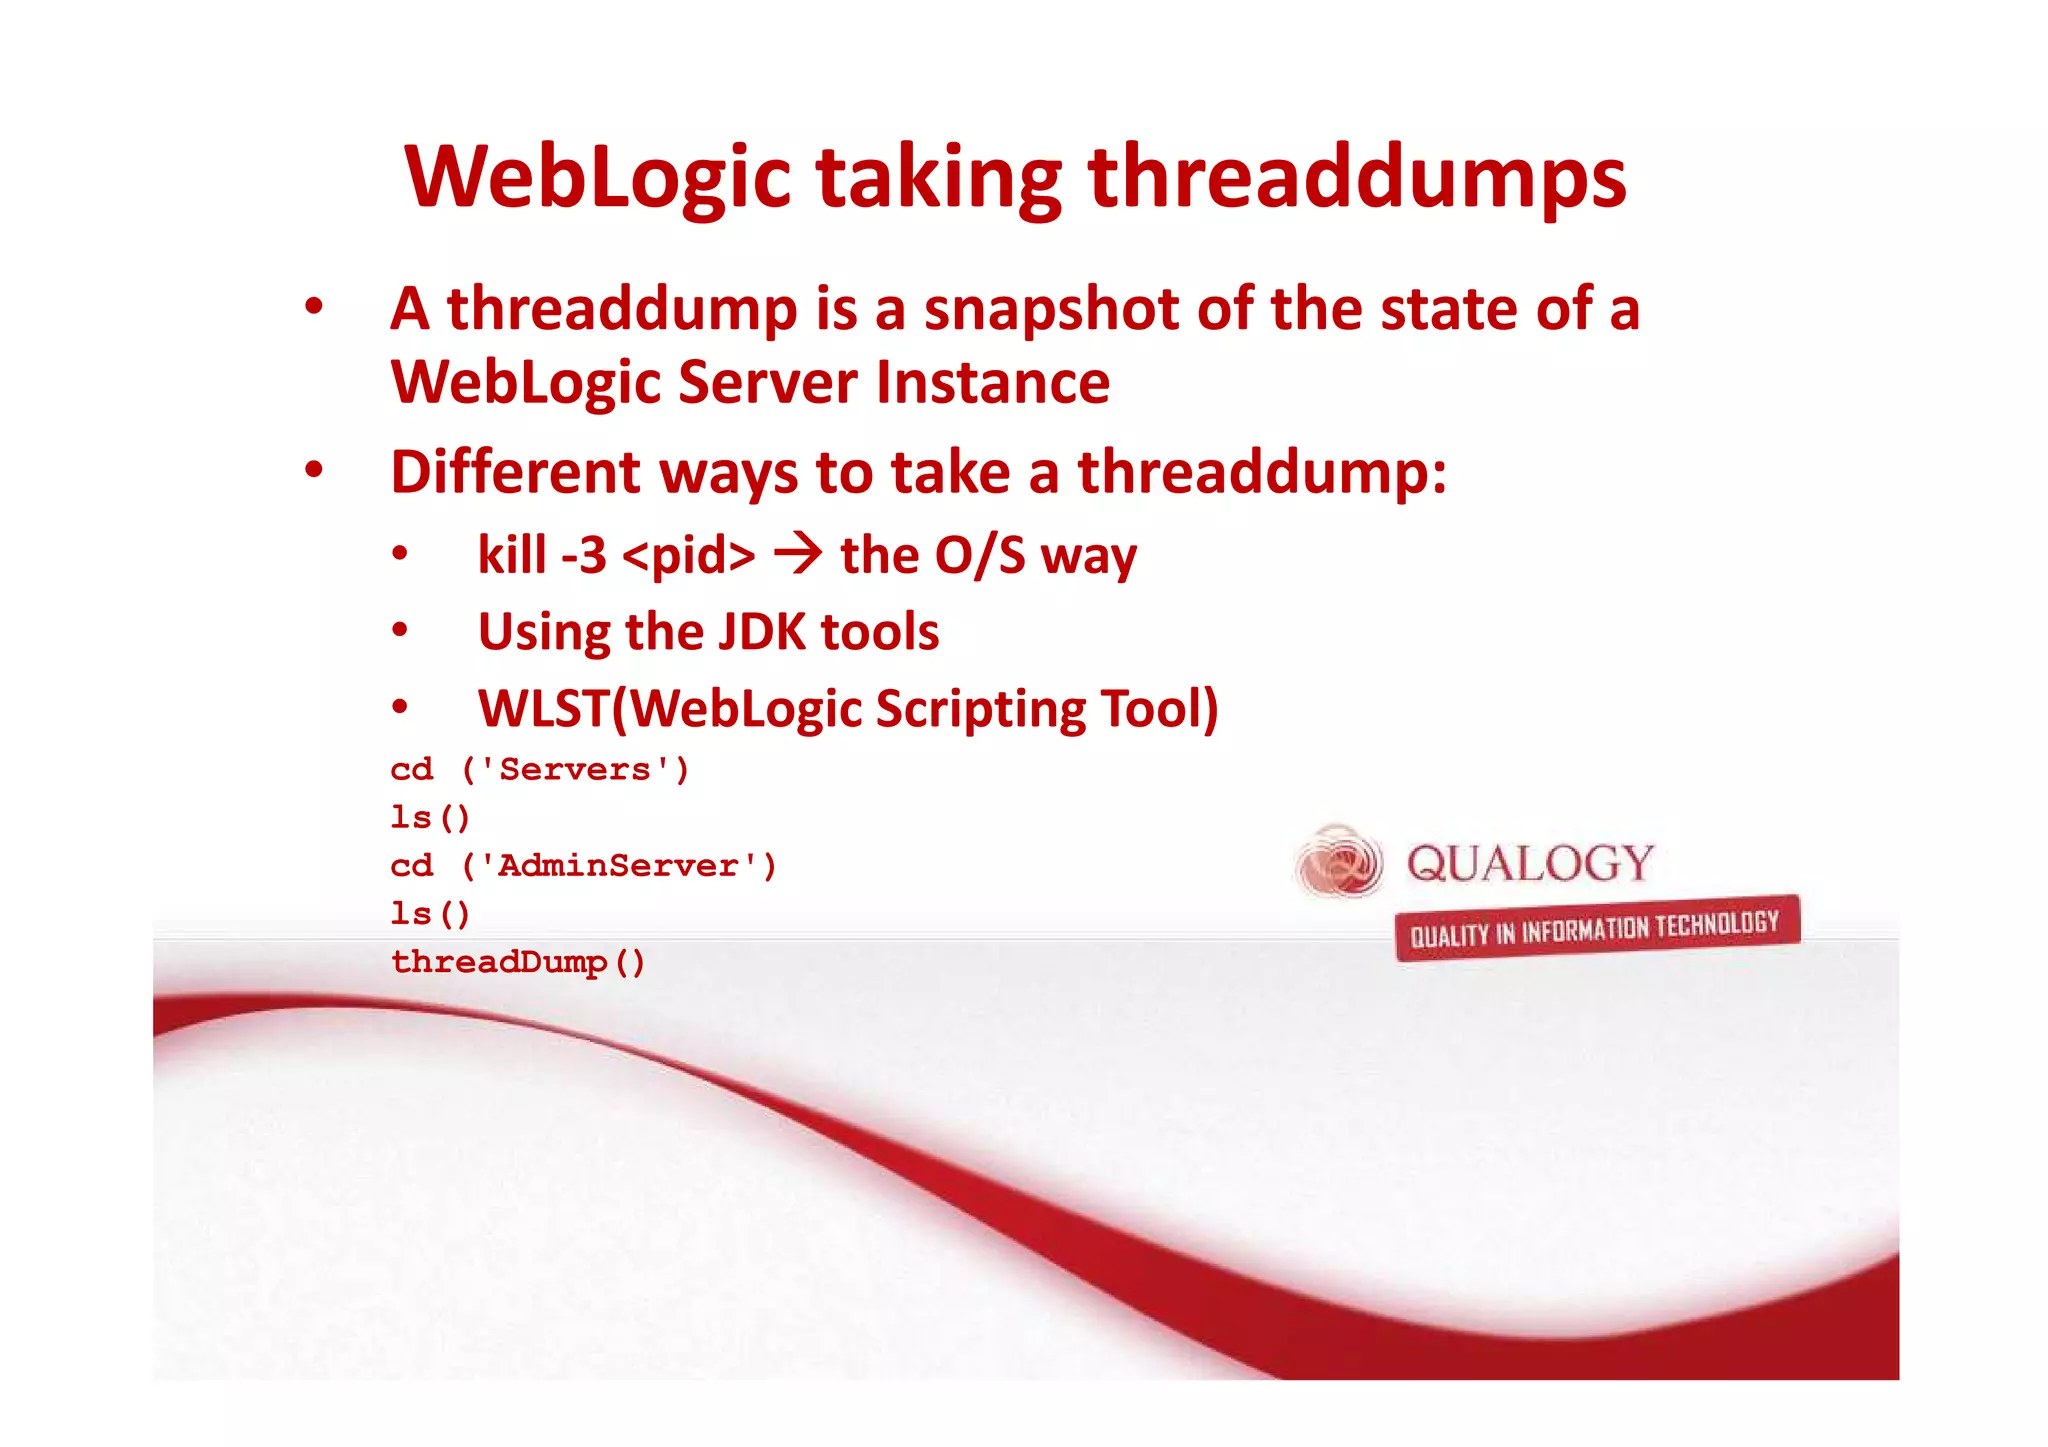
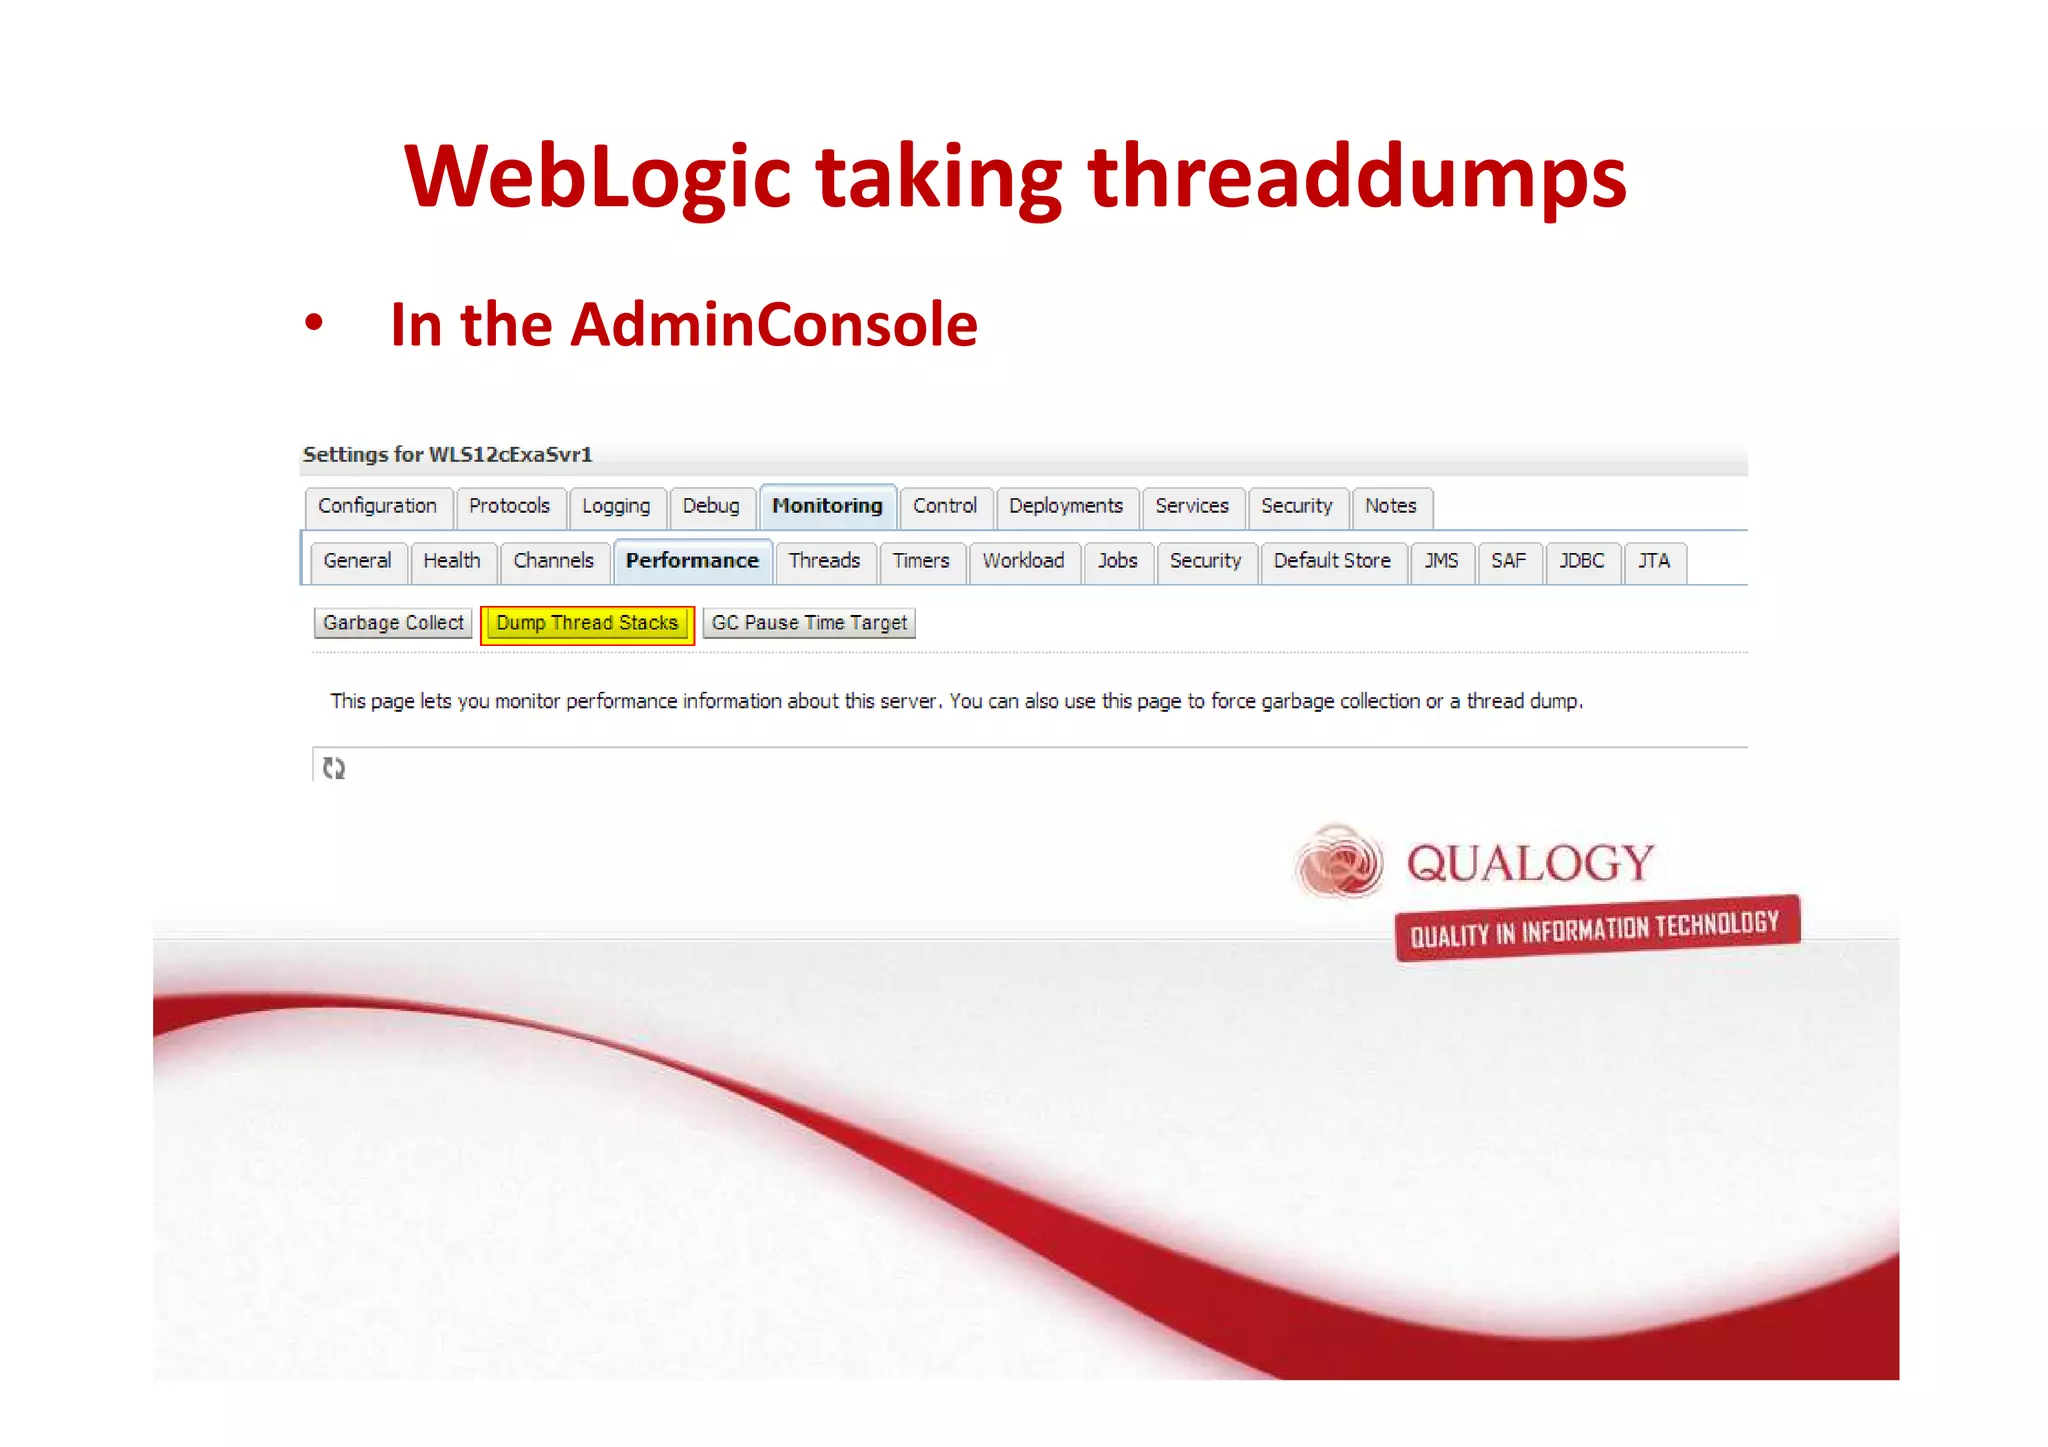
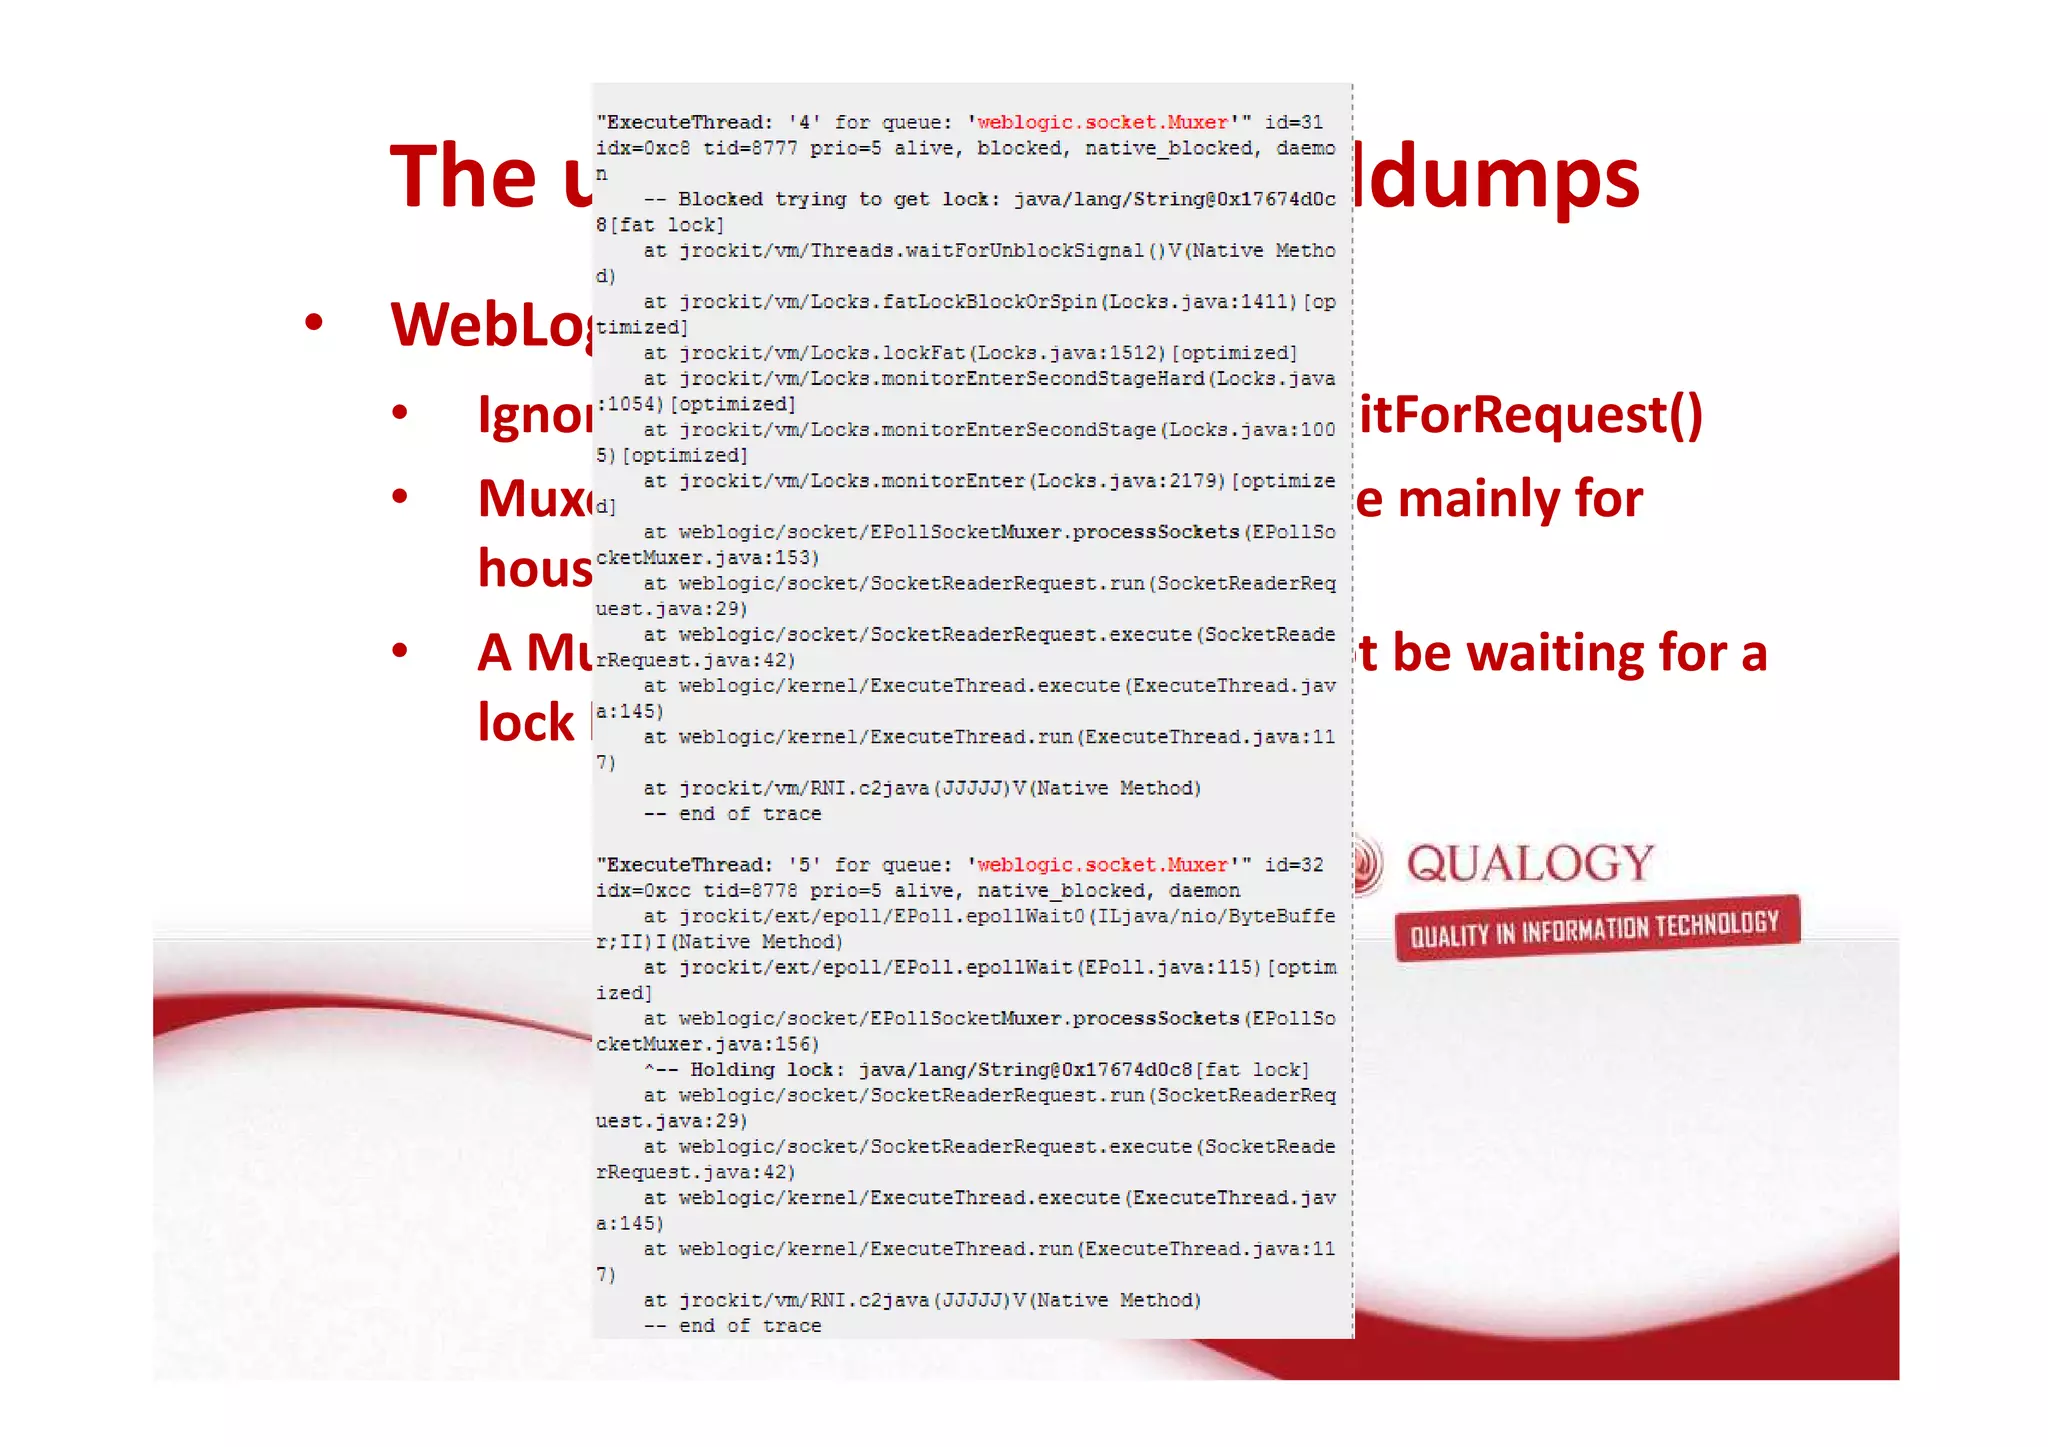
Importance of thread dumps in diagnosing WebLogic performance issues, identifying hotspots, and monitoring thread states.
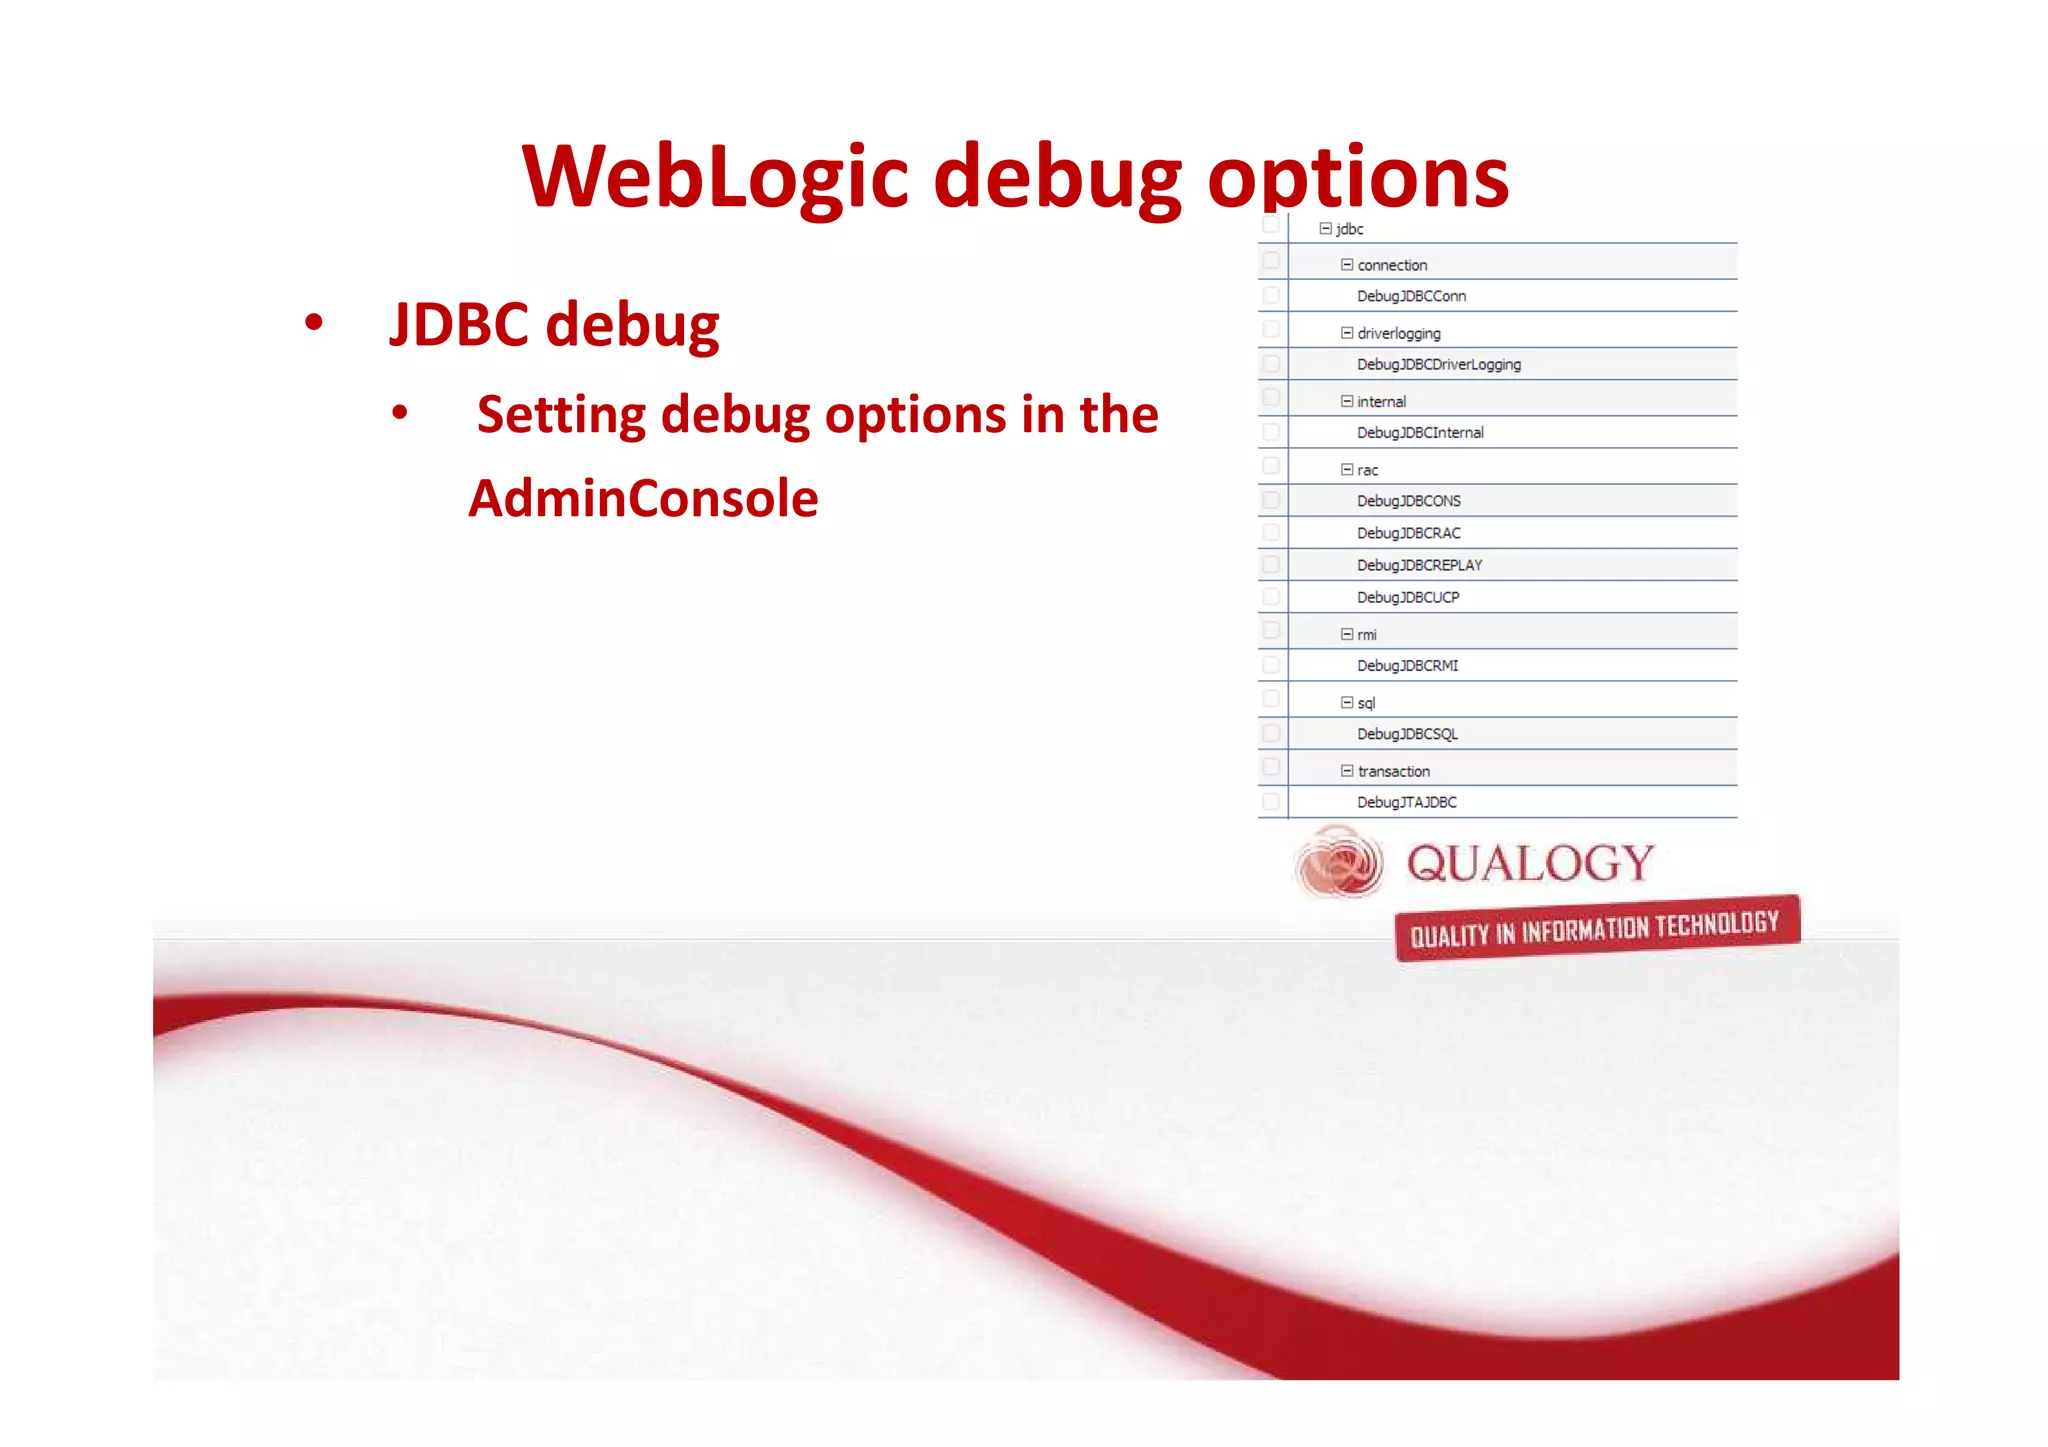
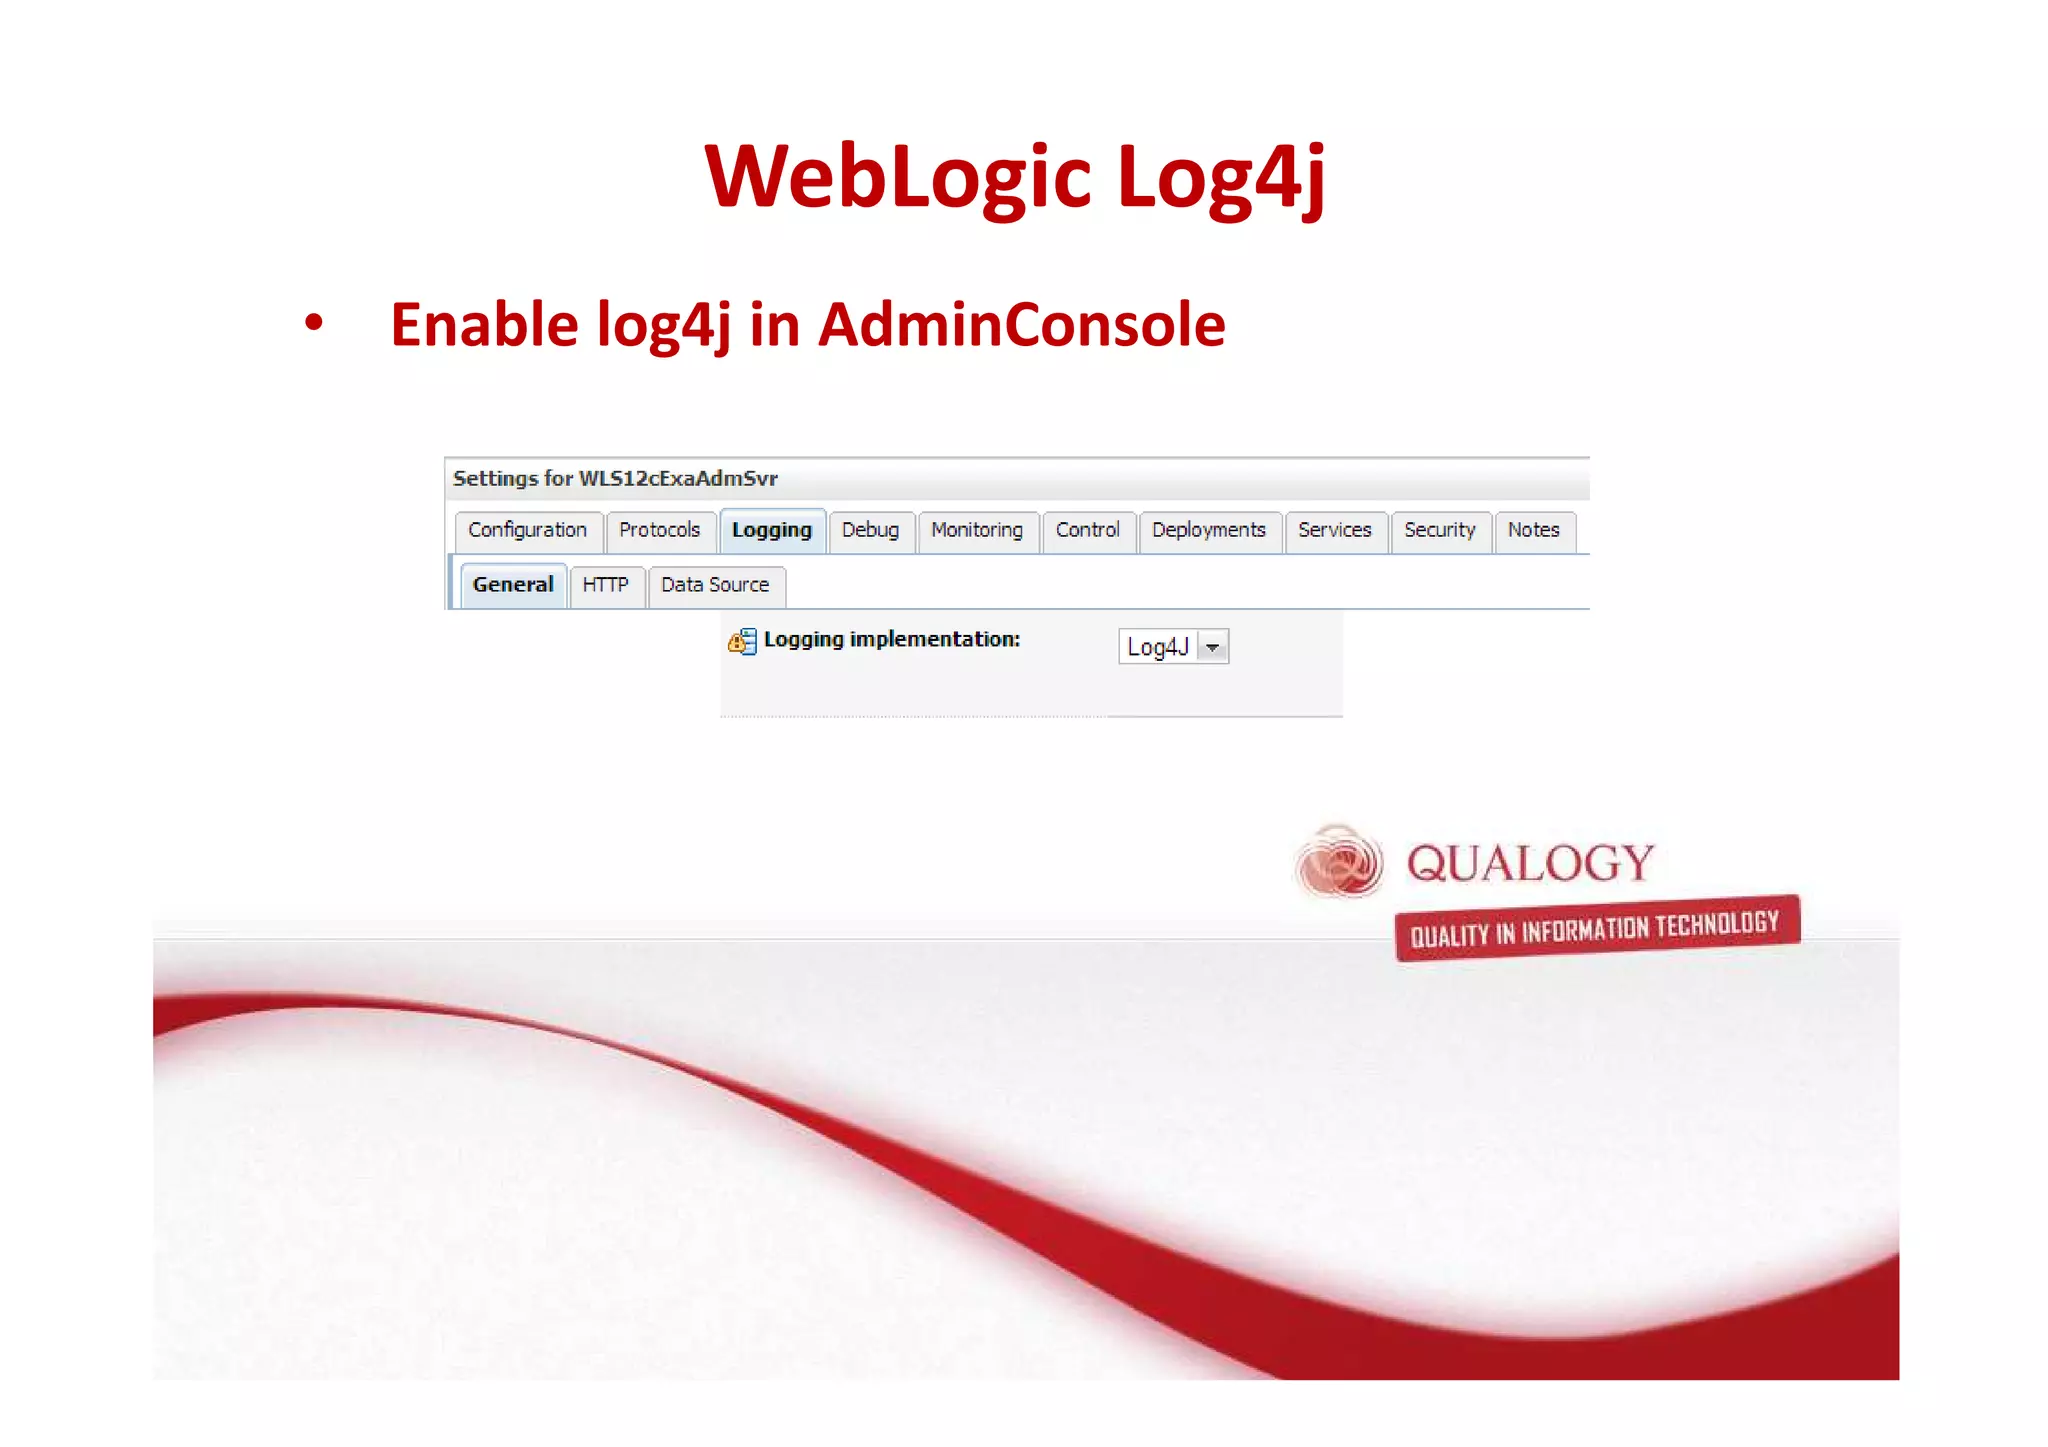
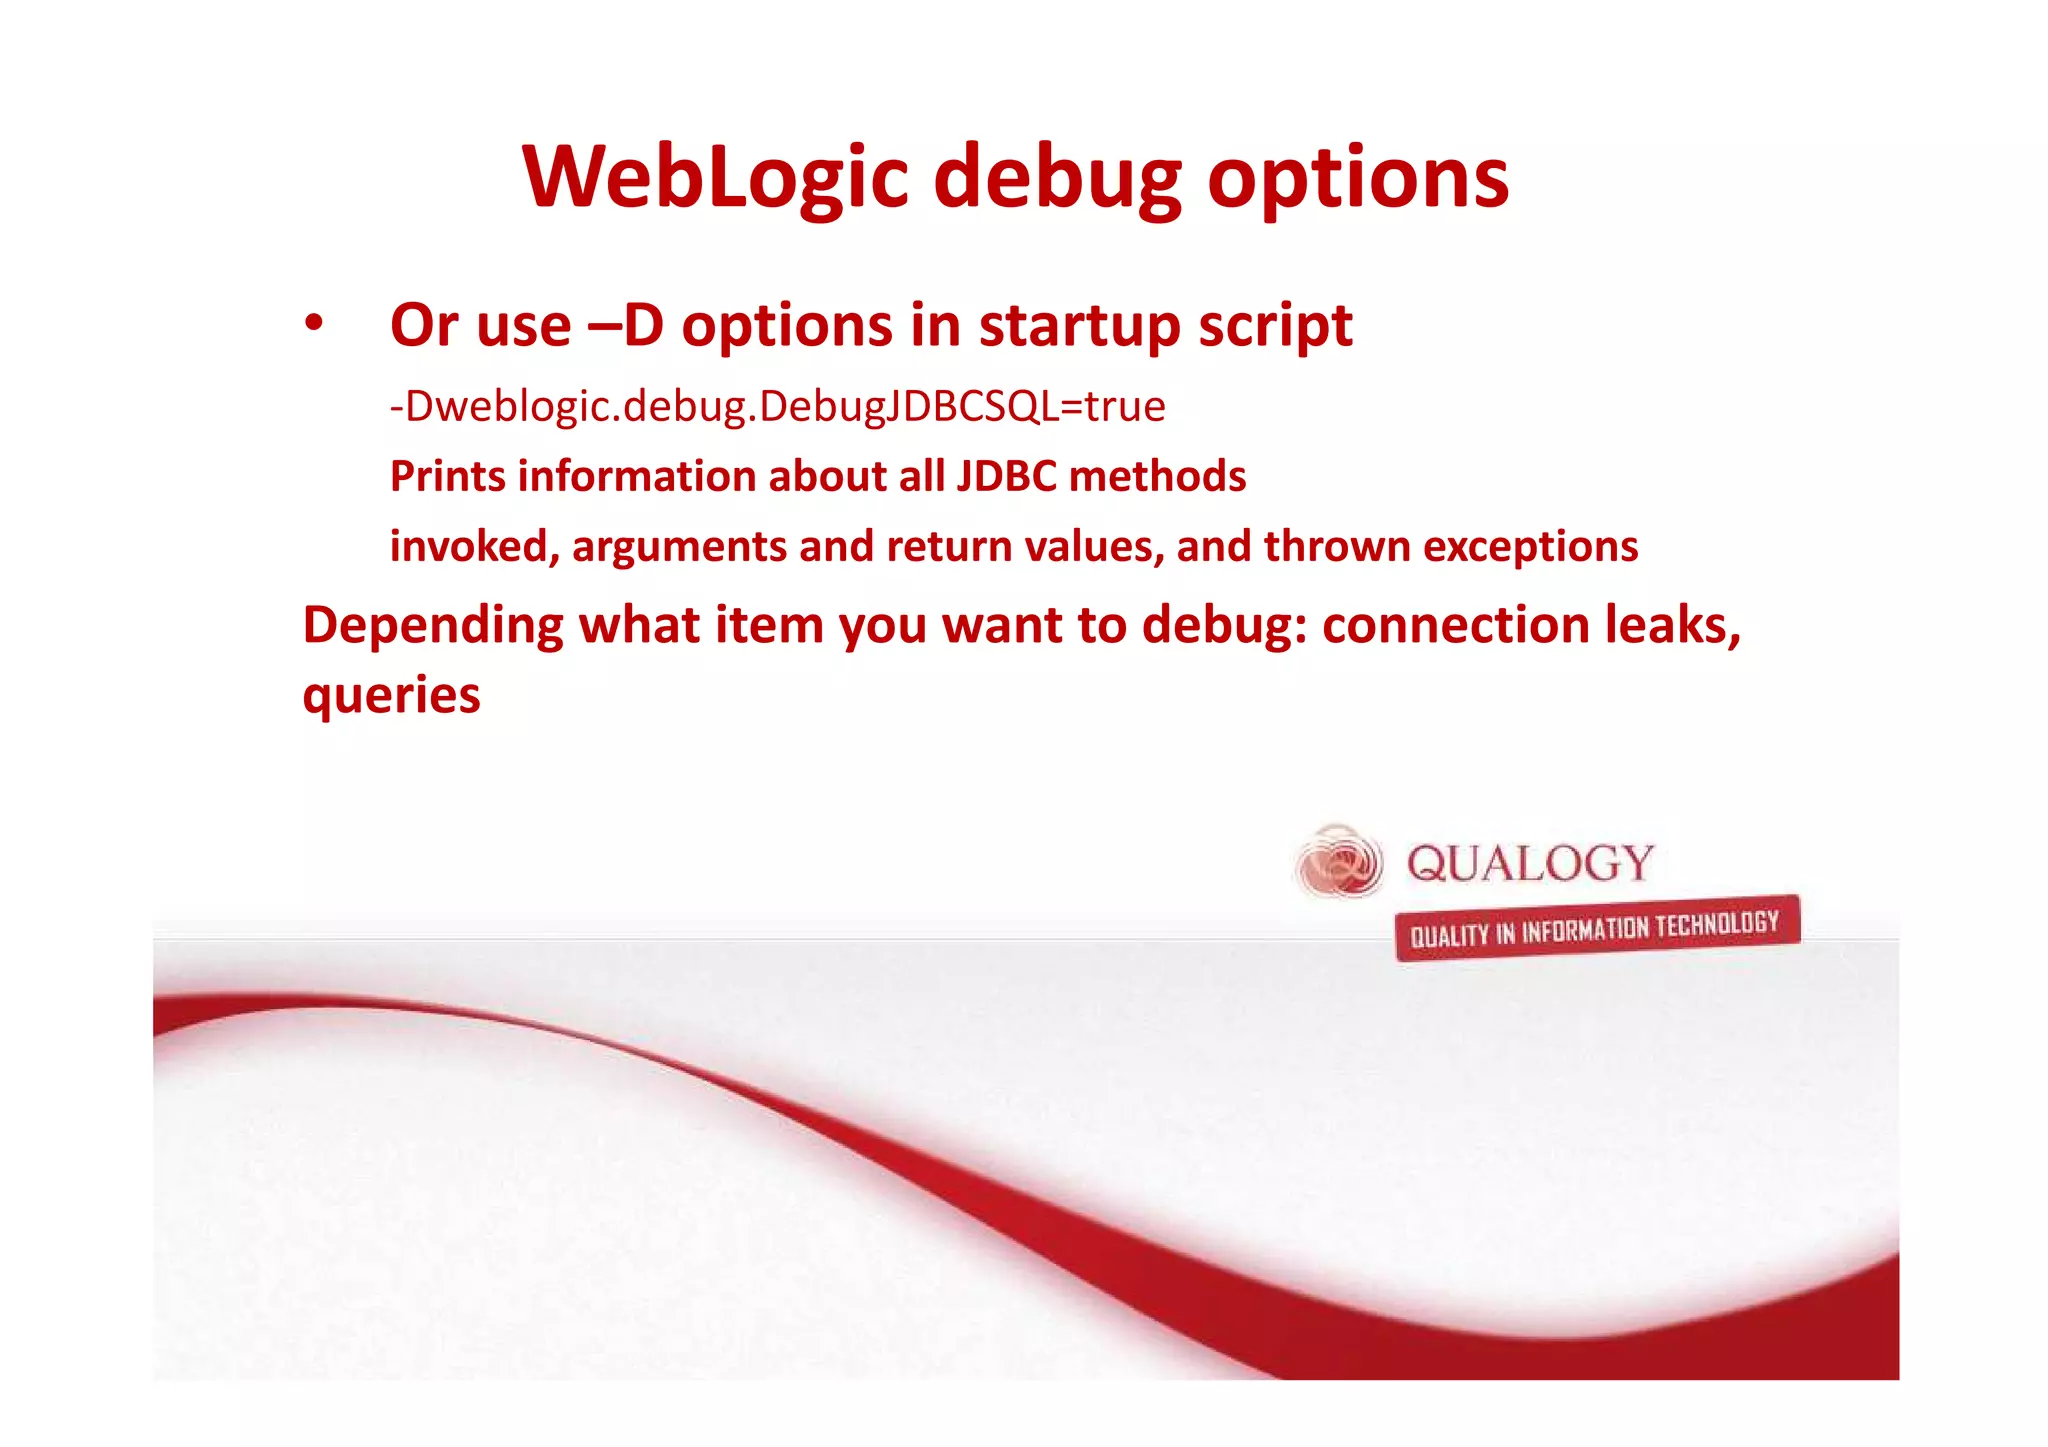
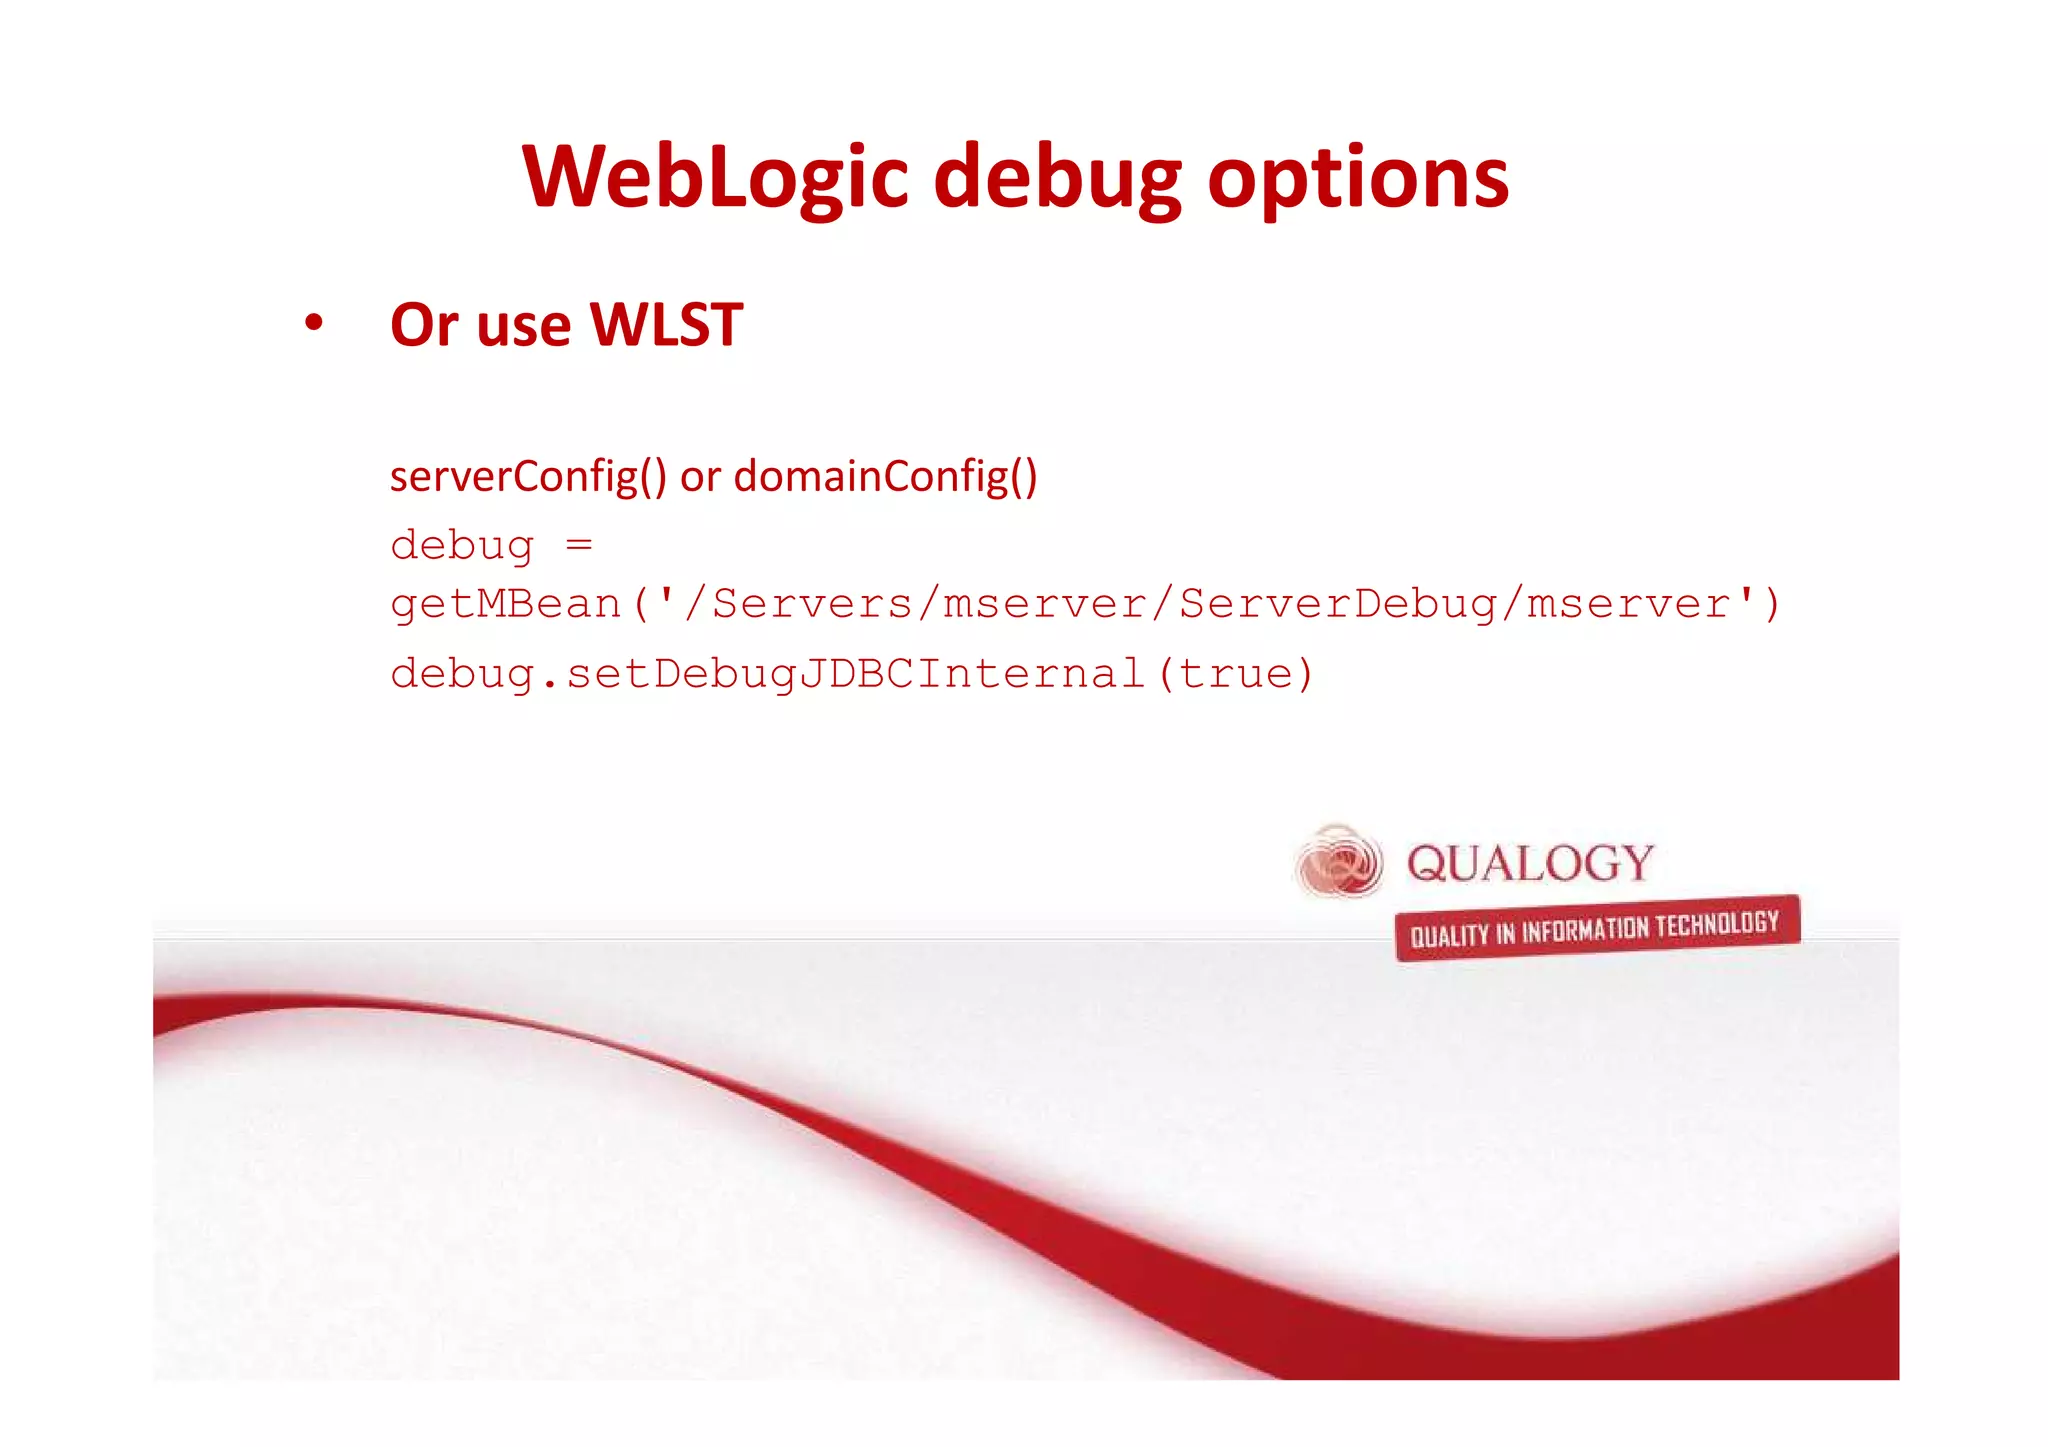
Overview of WebLogic logging and debugging methods, including severity levels and different subsystem logs.
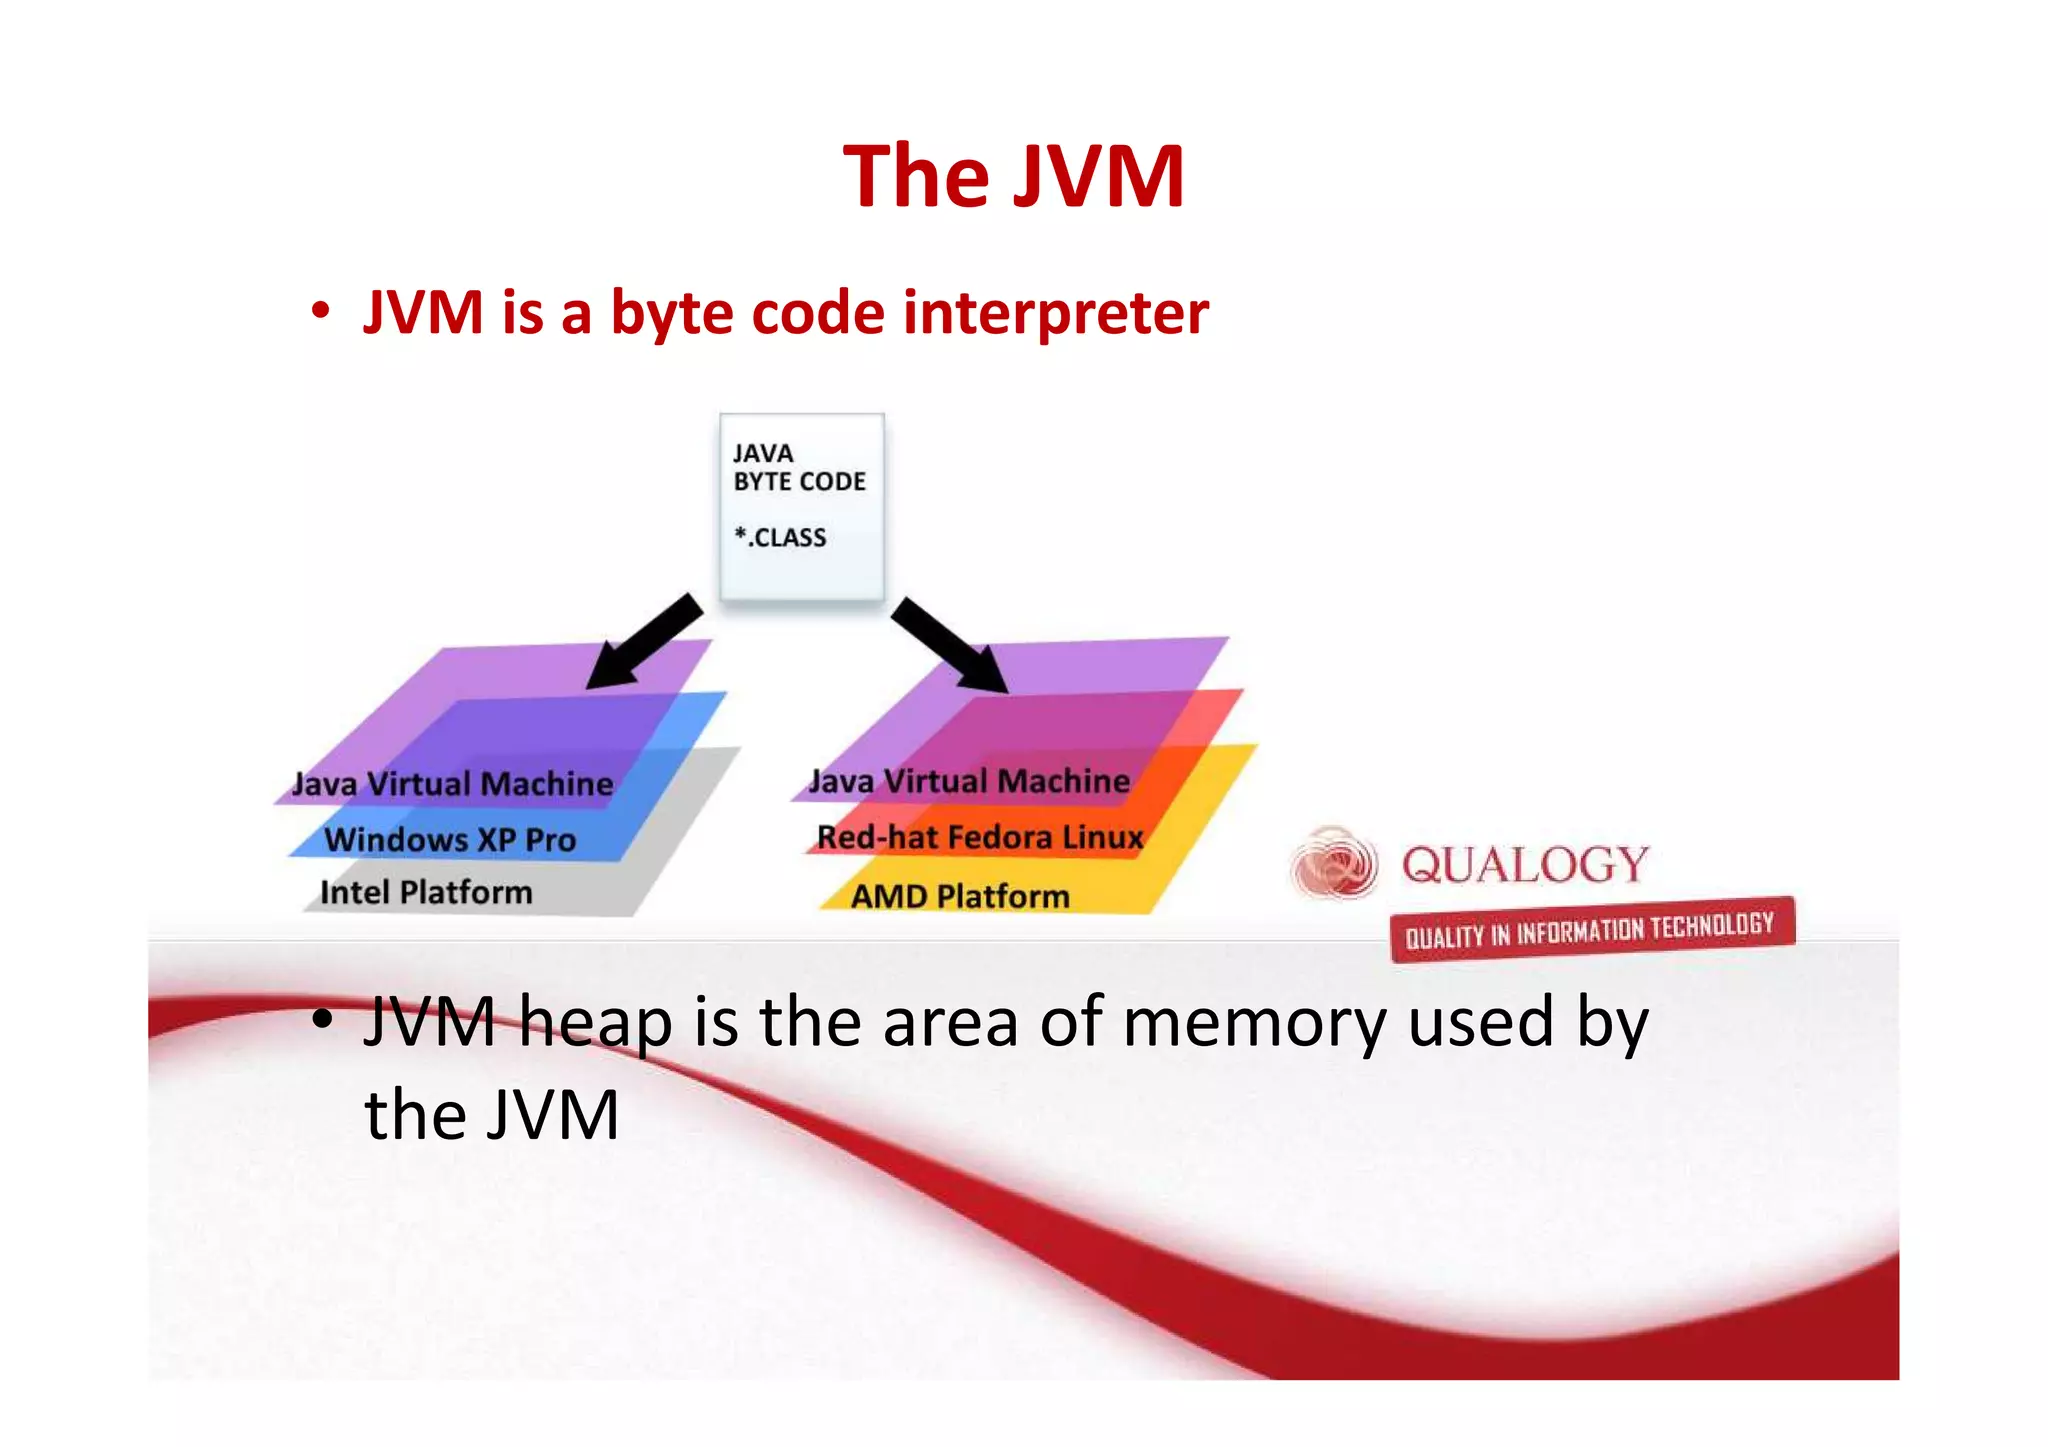
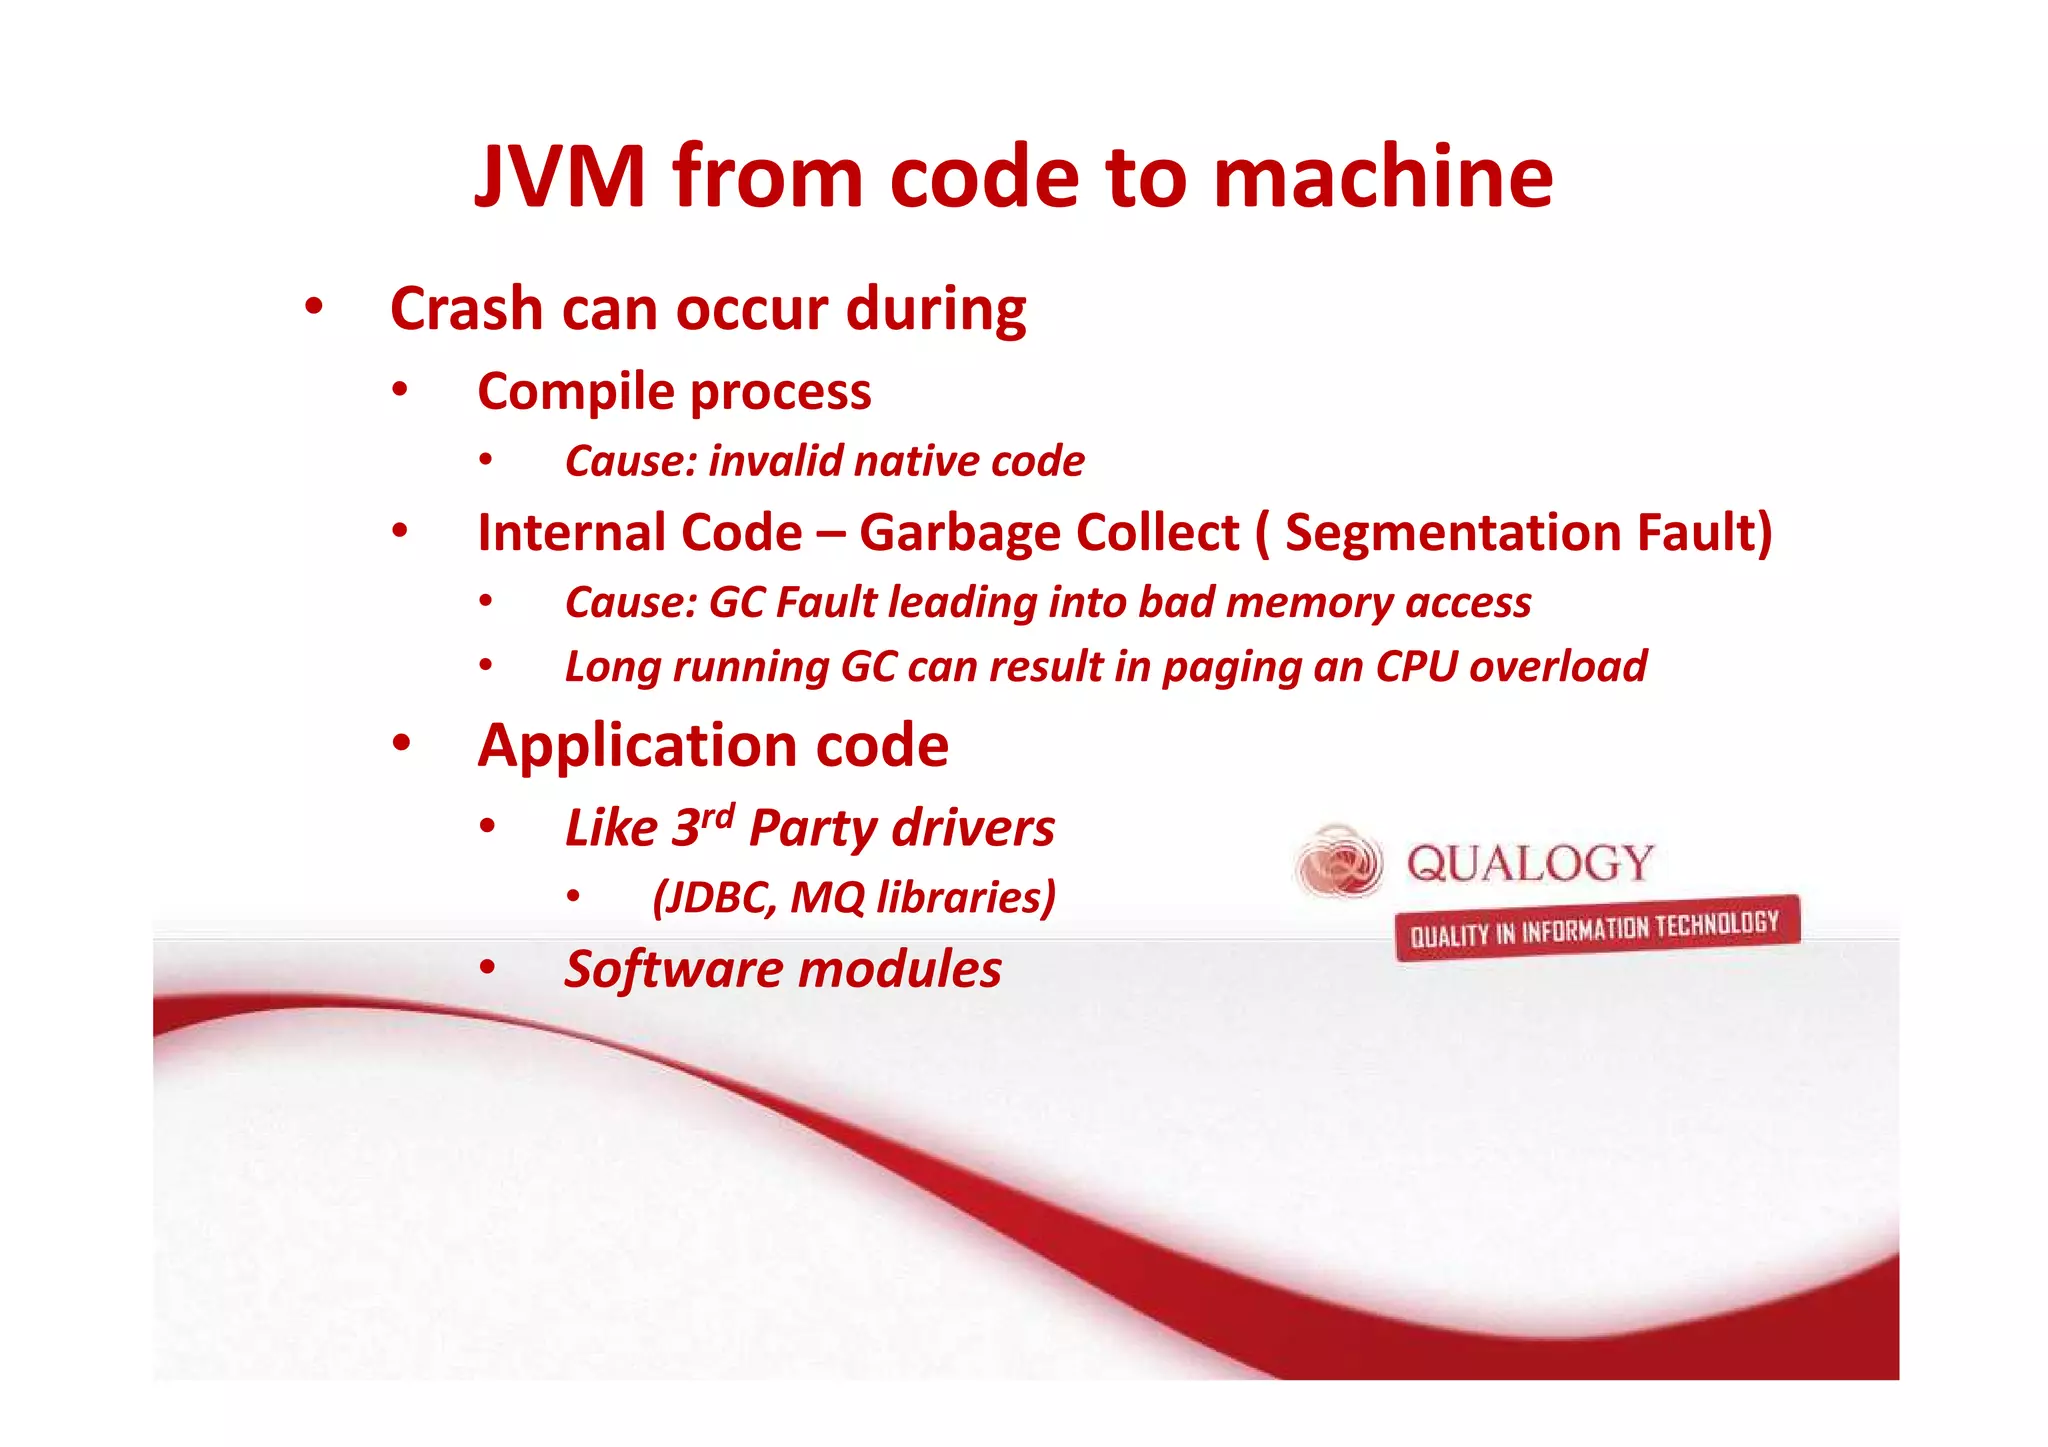
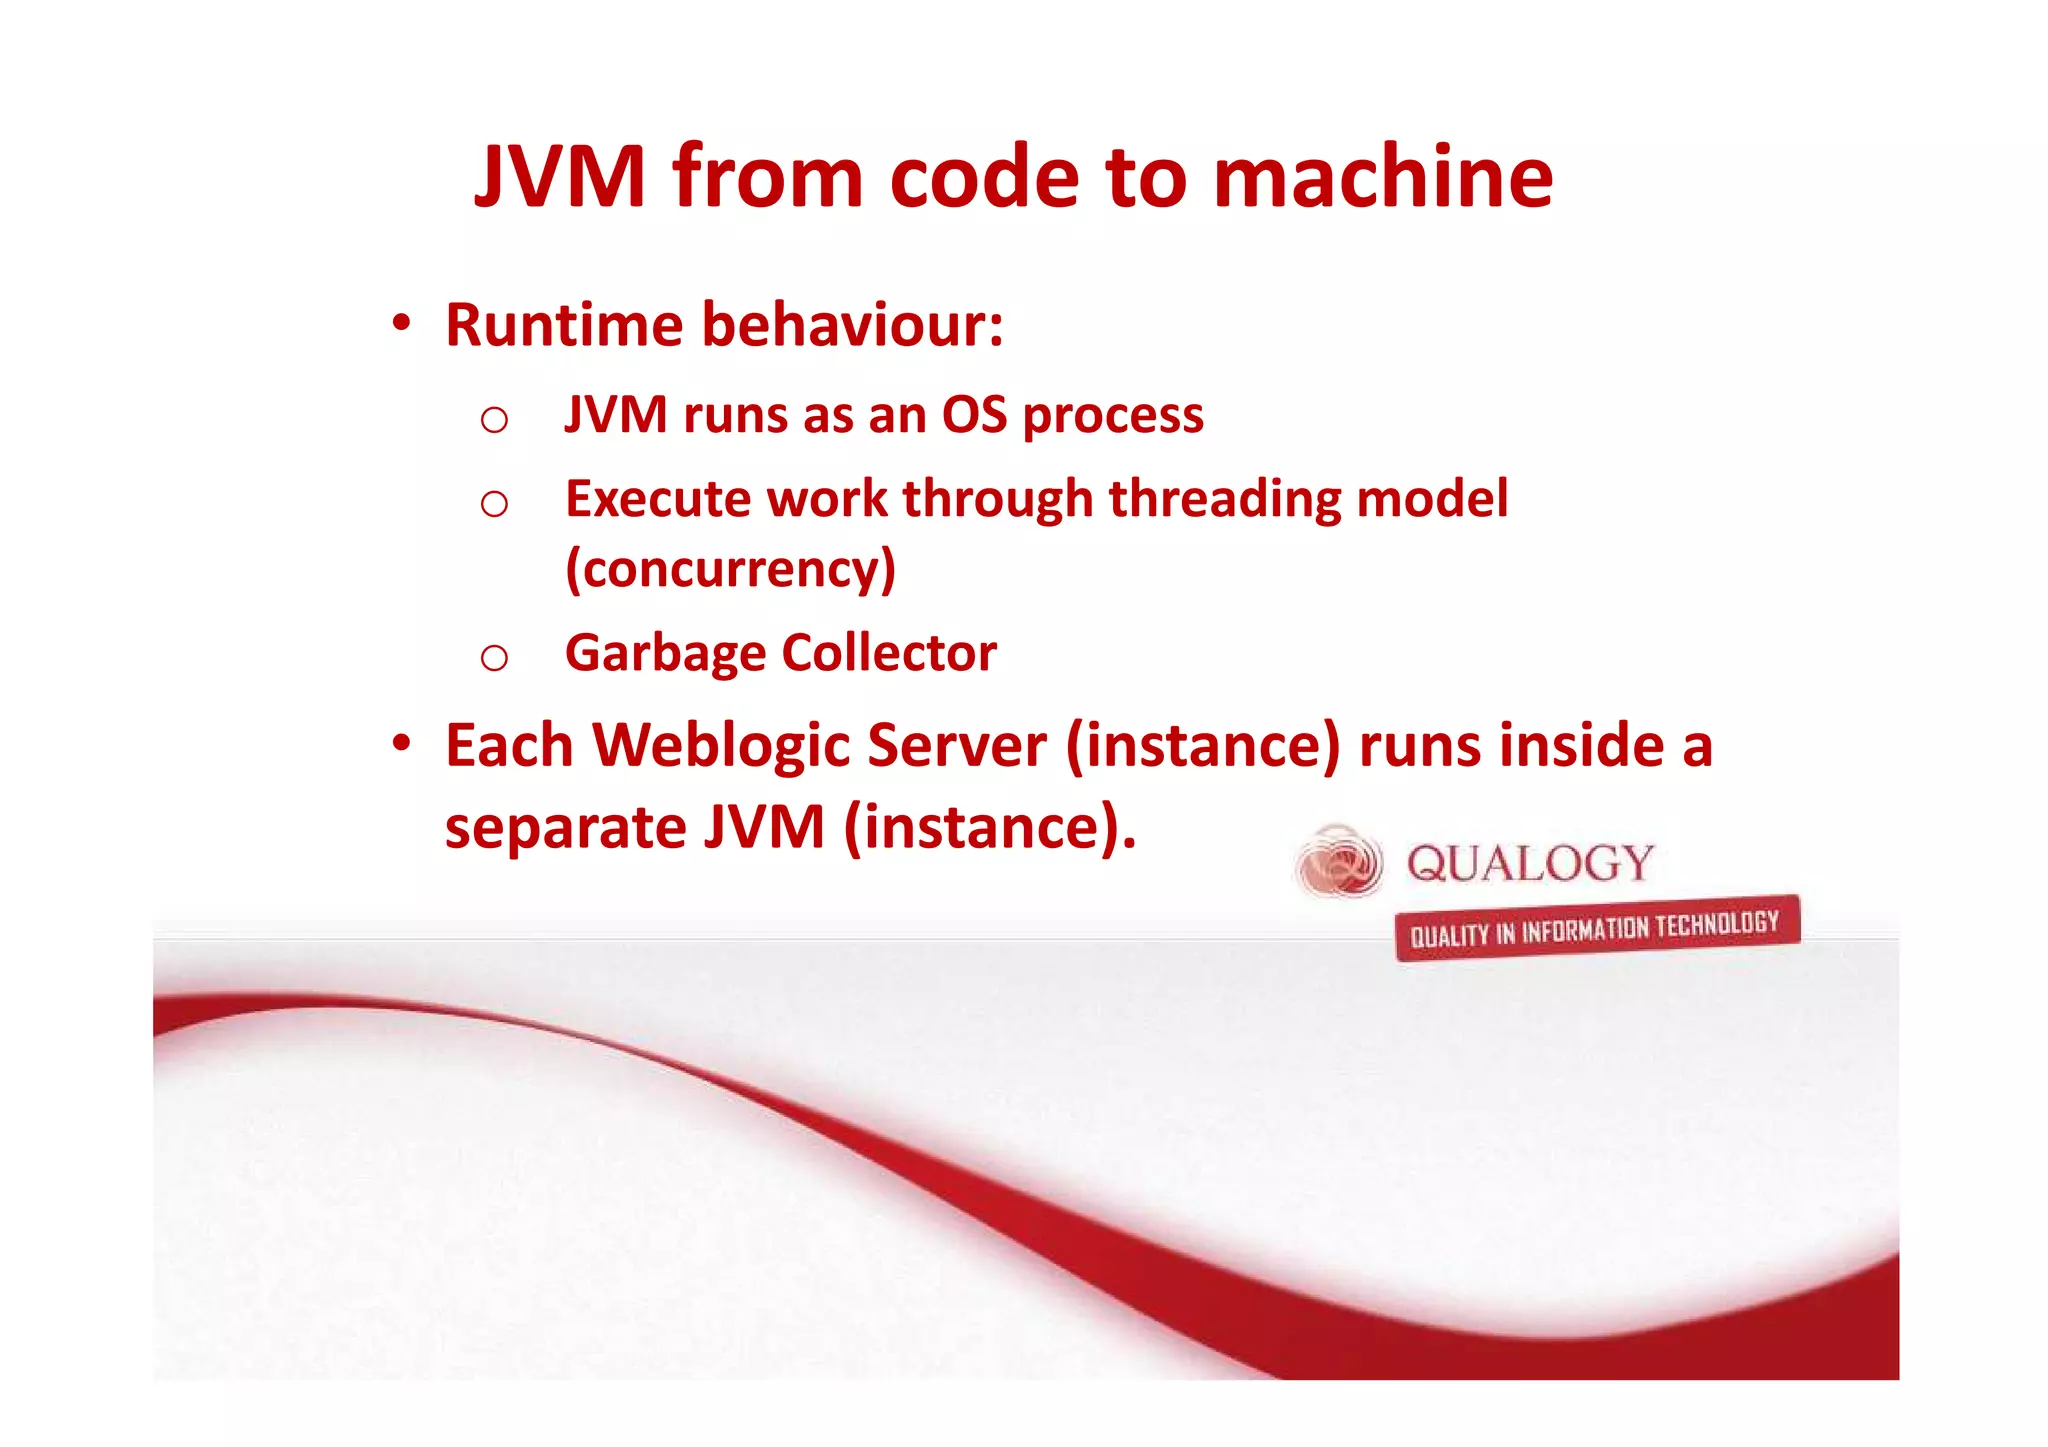
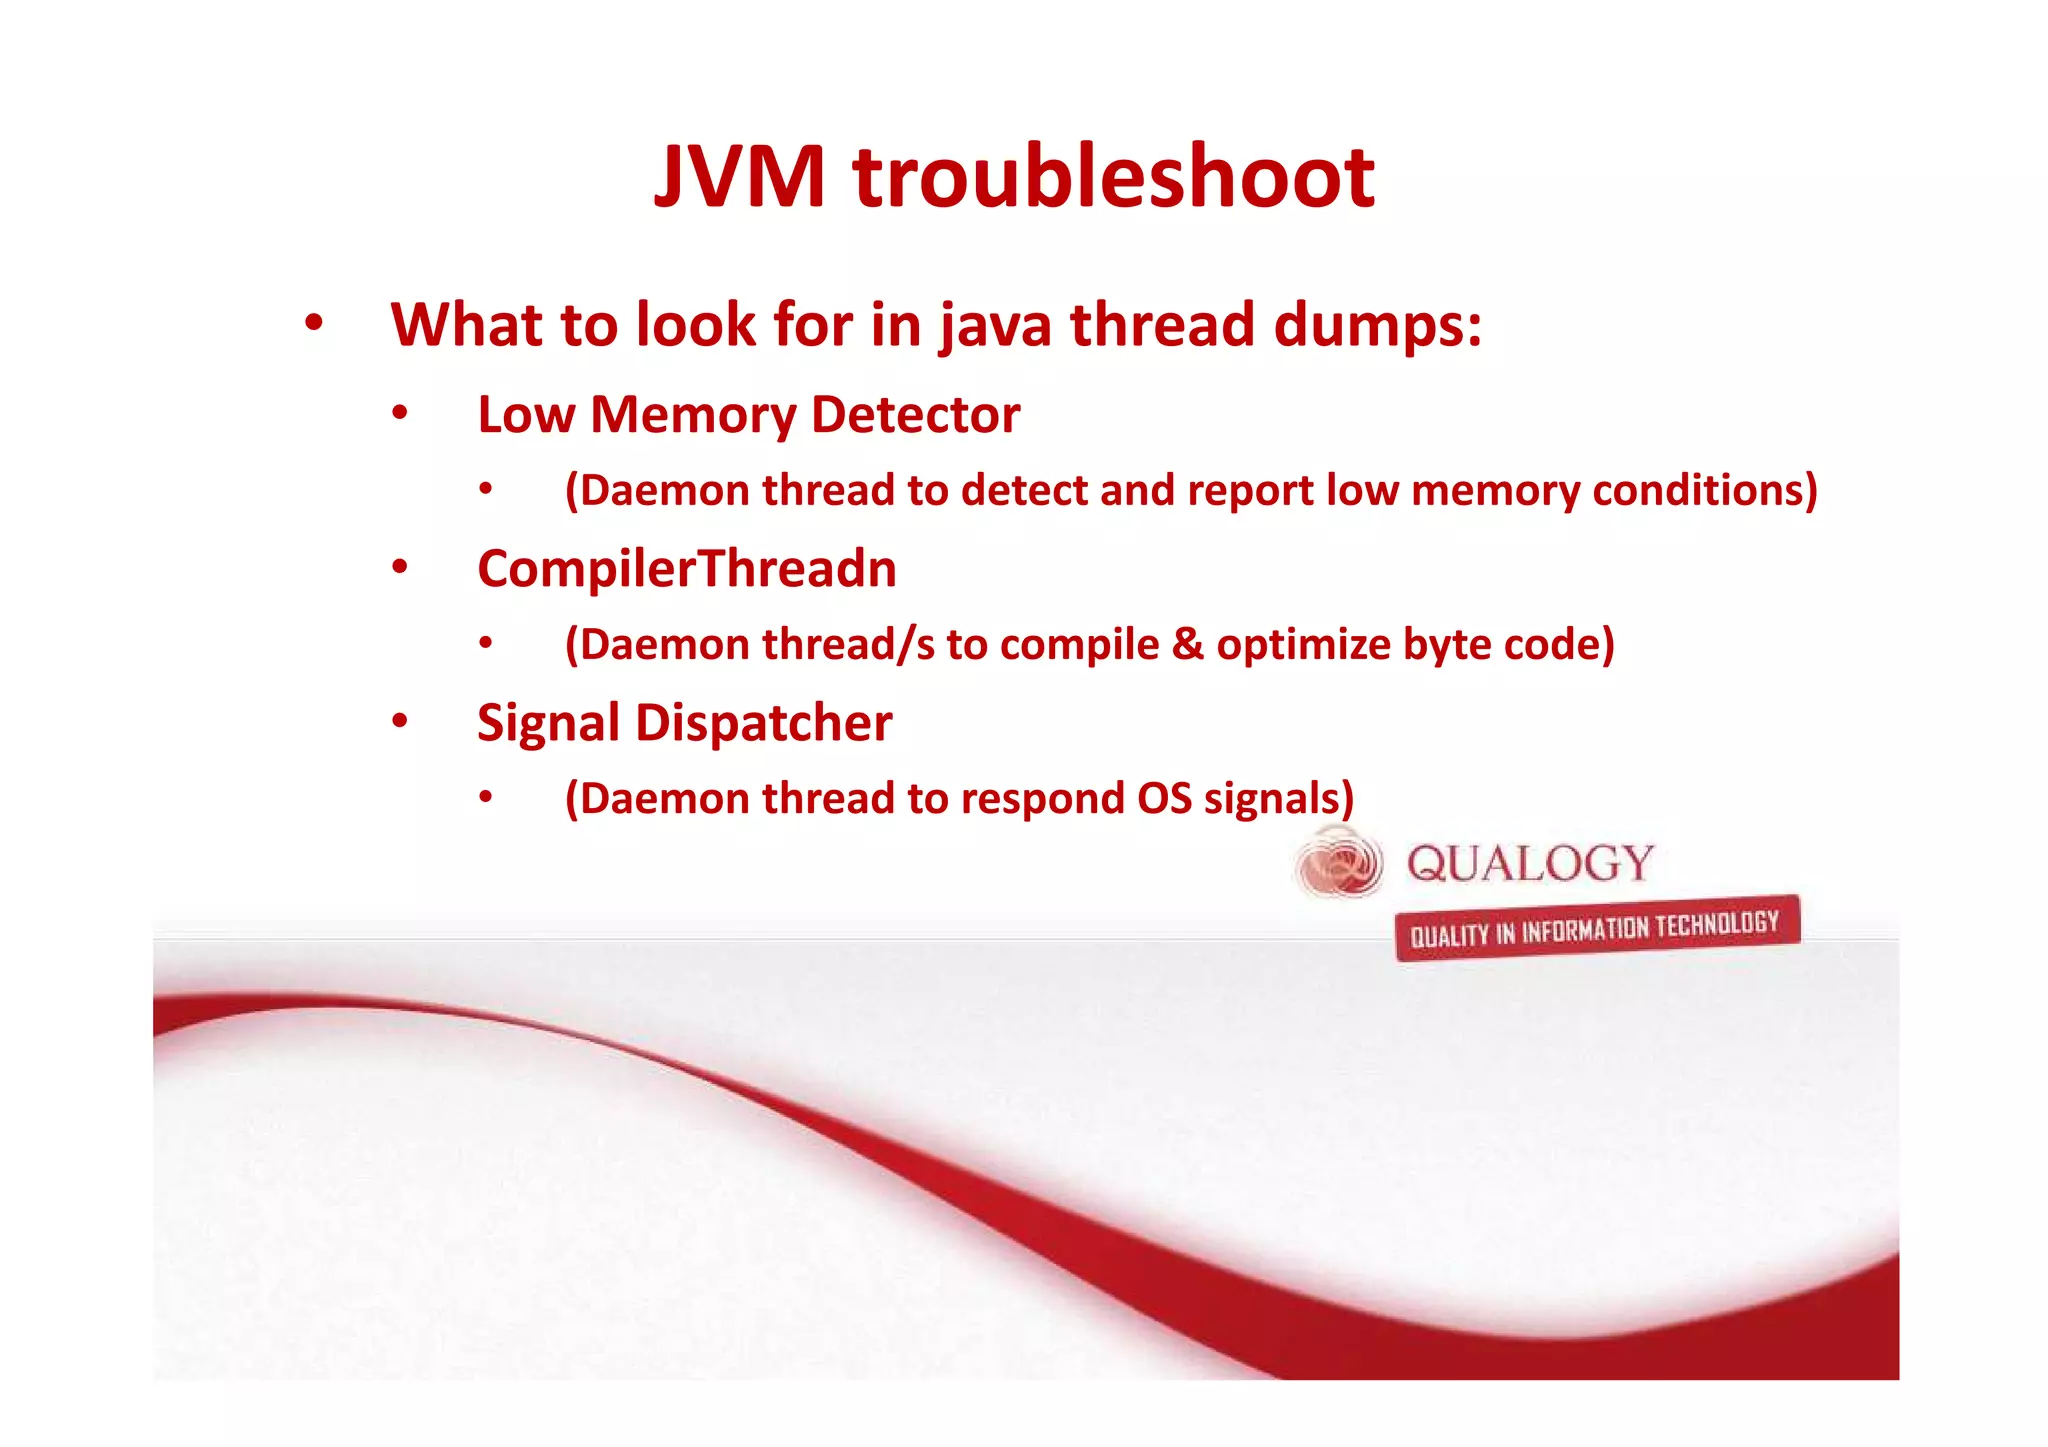
Discussion on JVM characteristics, memory management, and common Java thread types to monitor during troubleshooting.
Introduction to JRockit Mission Control for real-time JVM statistics, memory leak detection, and live metrics monitoring.
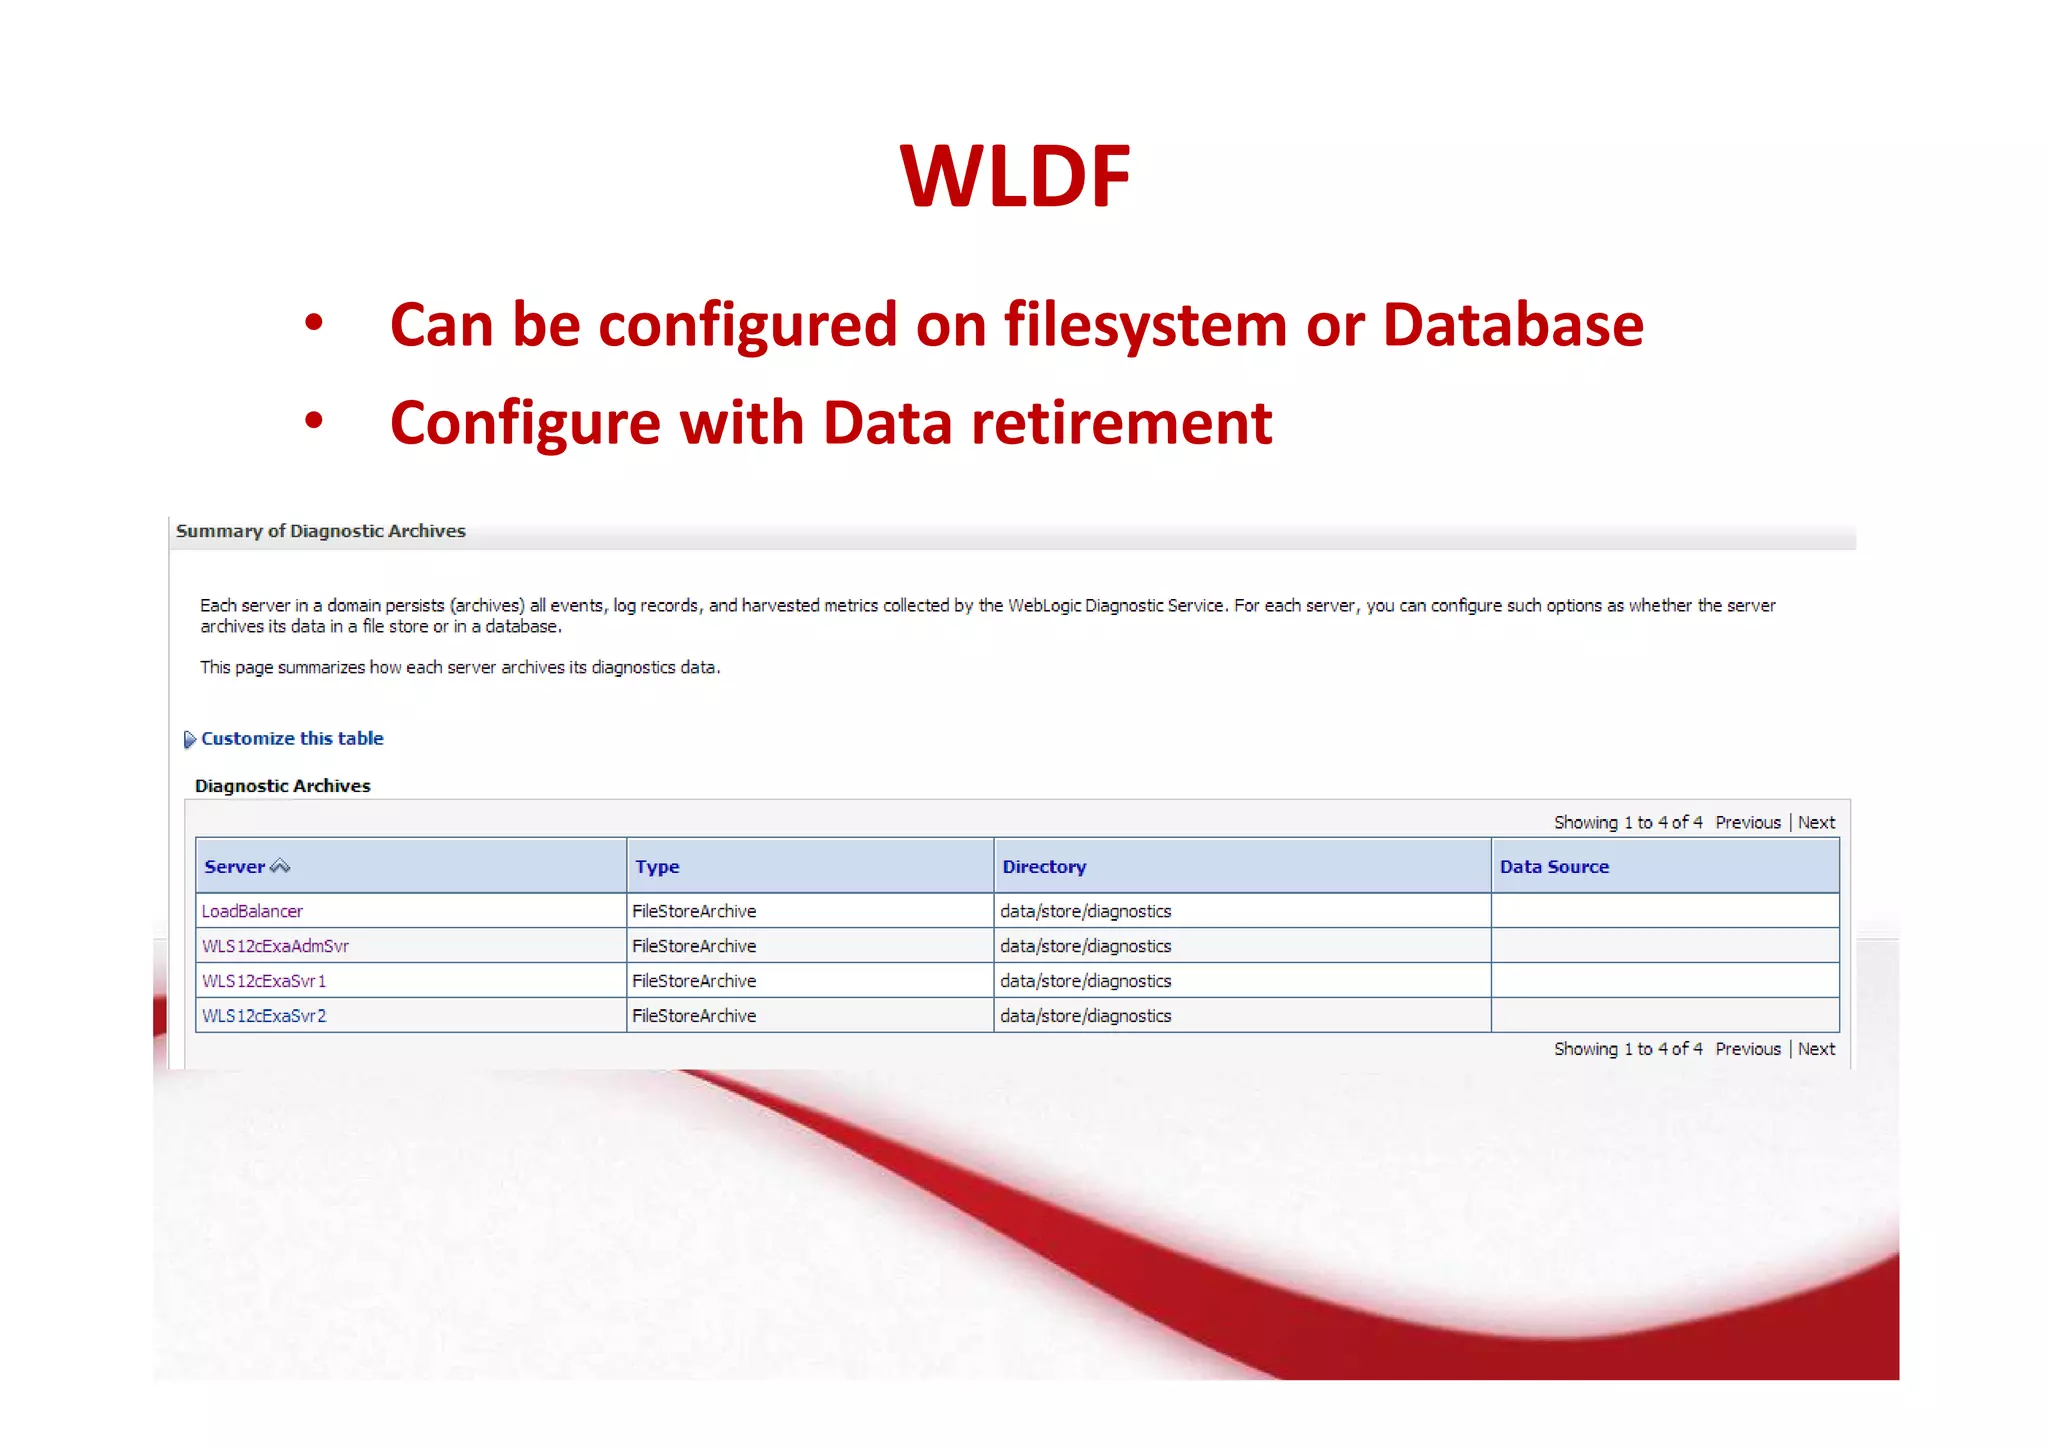
Framework overview for monitoring and diagnostics, including collecting metrics and notifications for diagnostics.
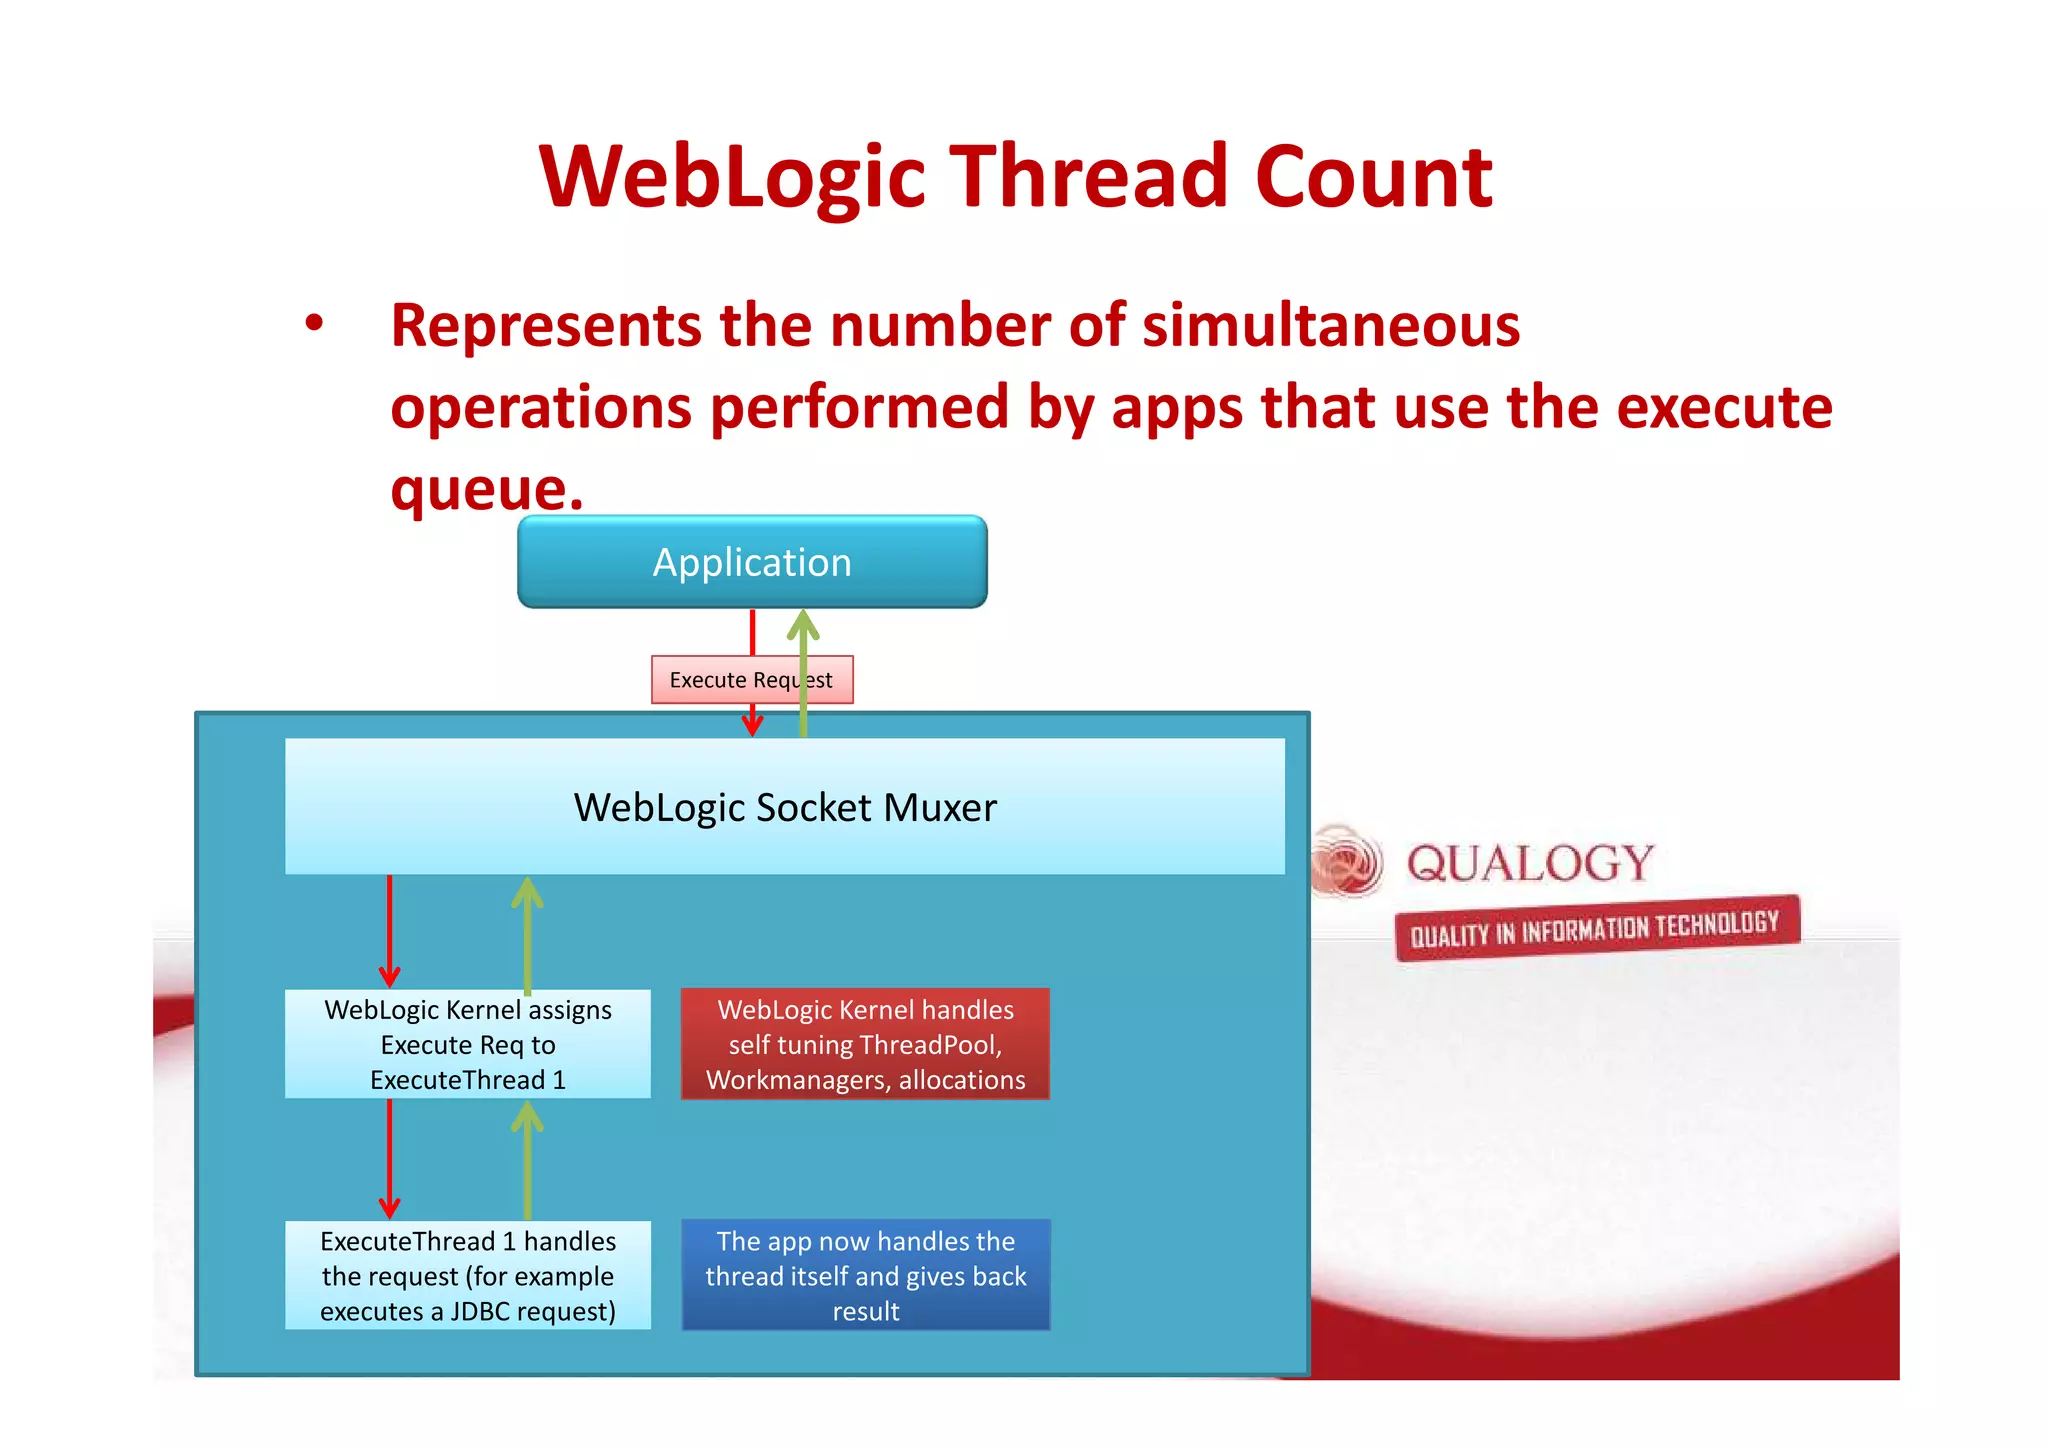
Definitions and objectives related to WebLogic performance, tuning for capacity and scalability, and executing tasks efficiently.
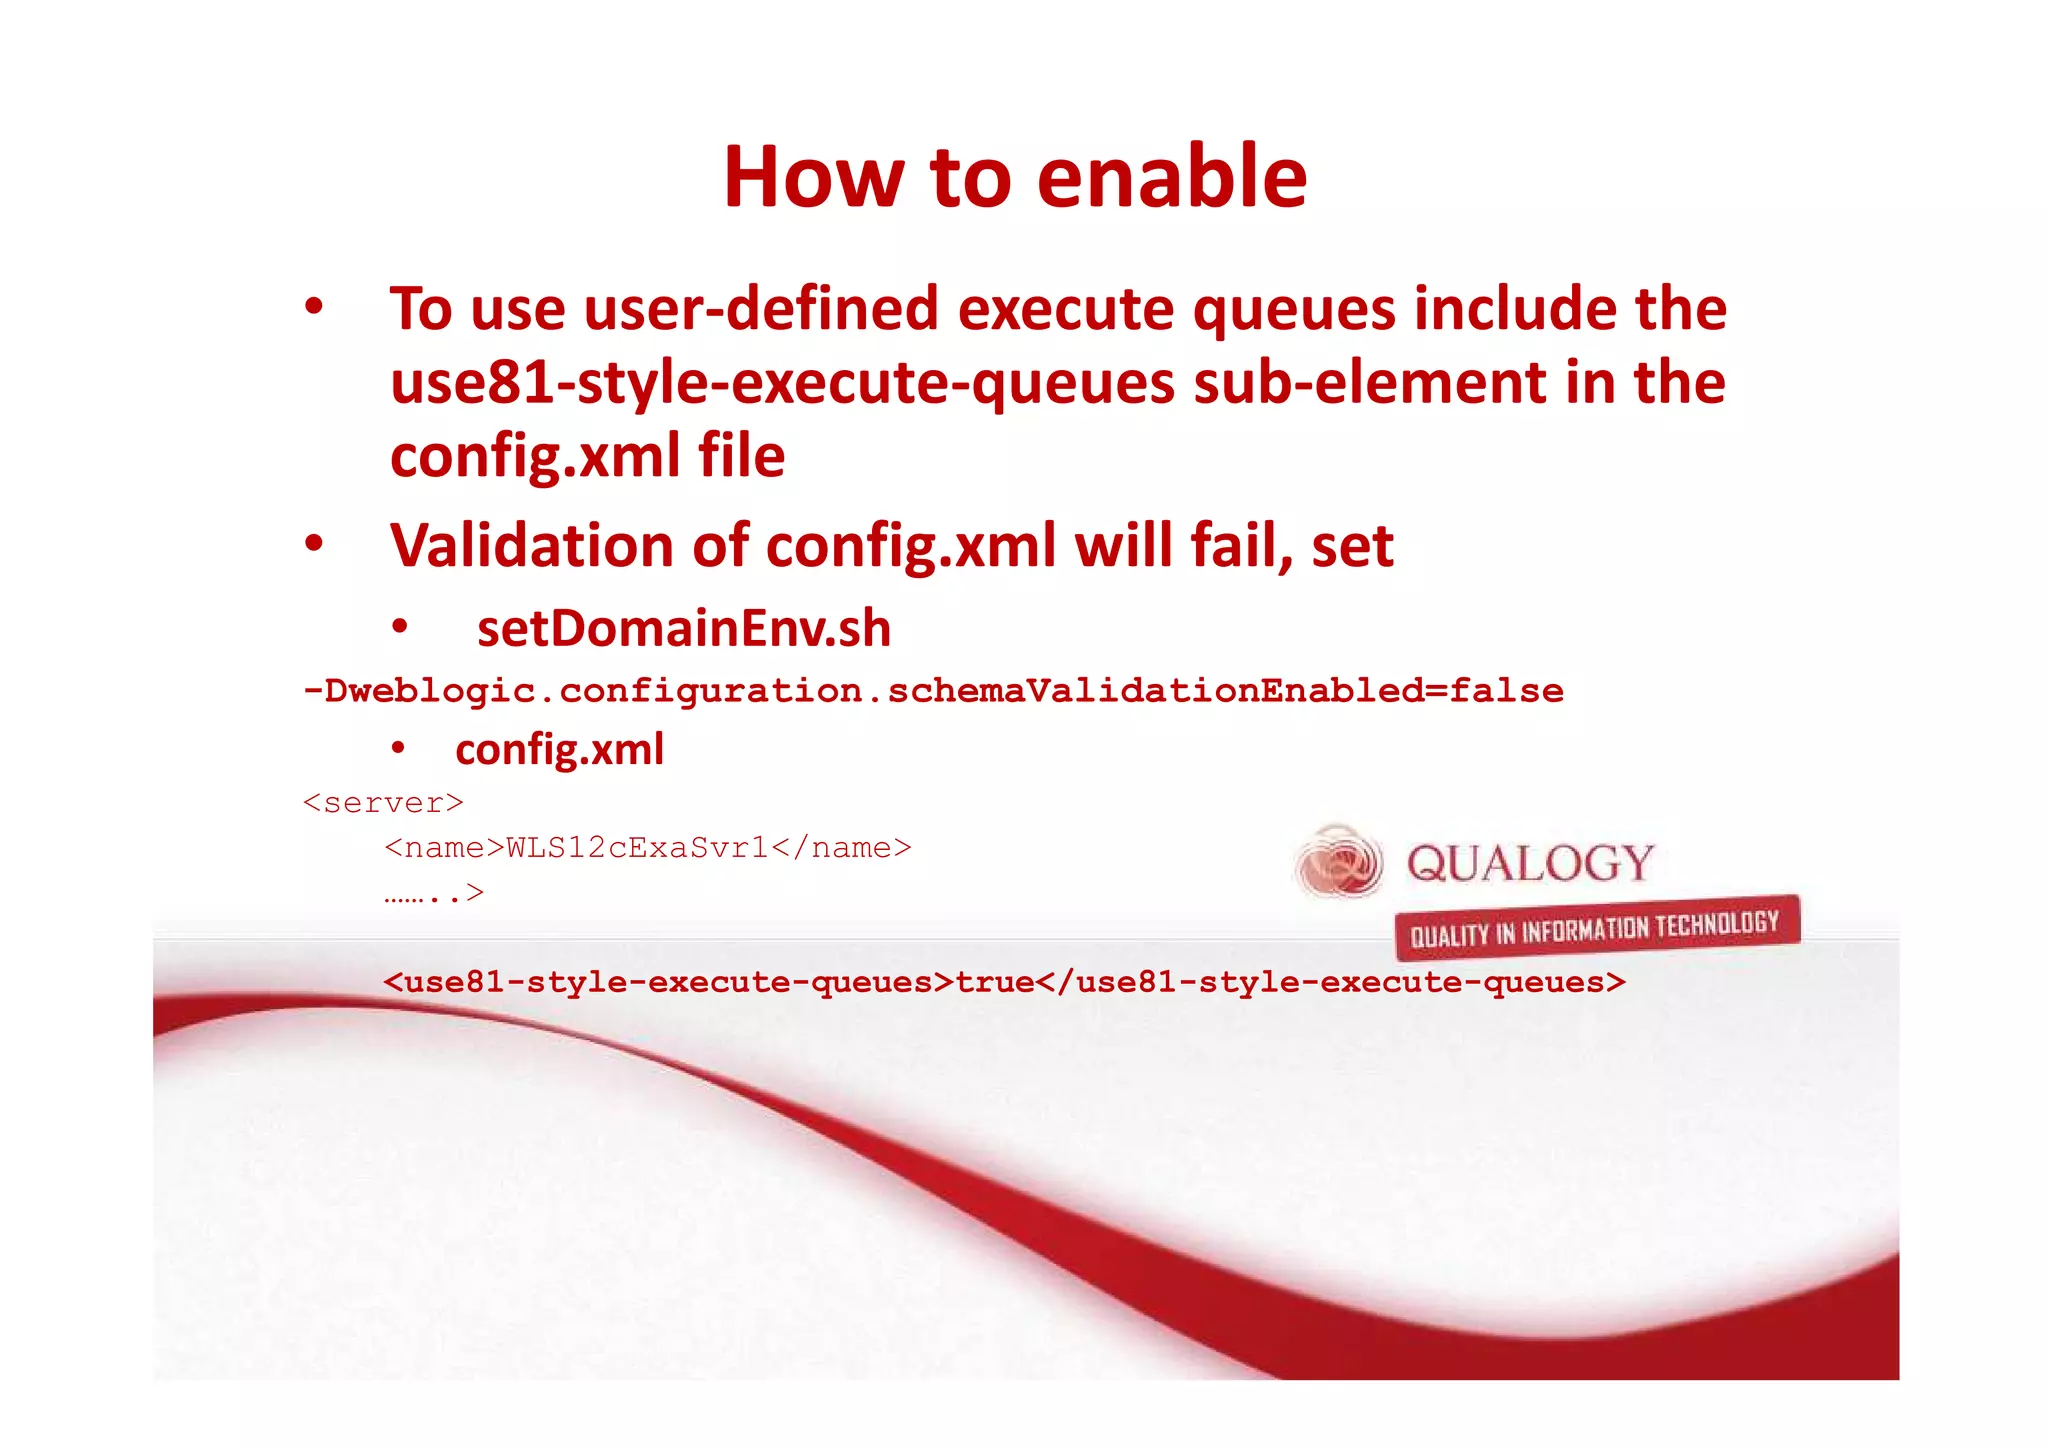
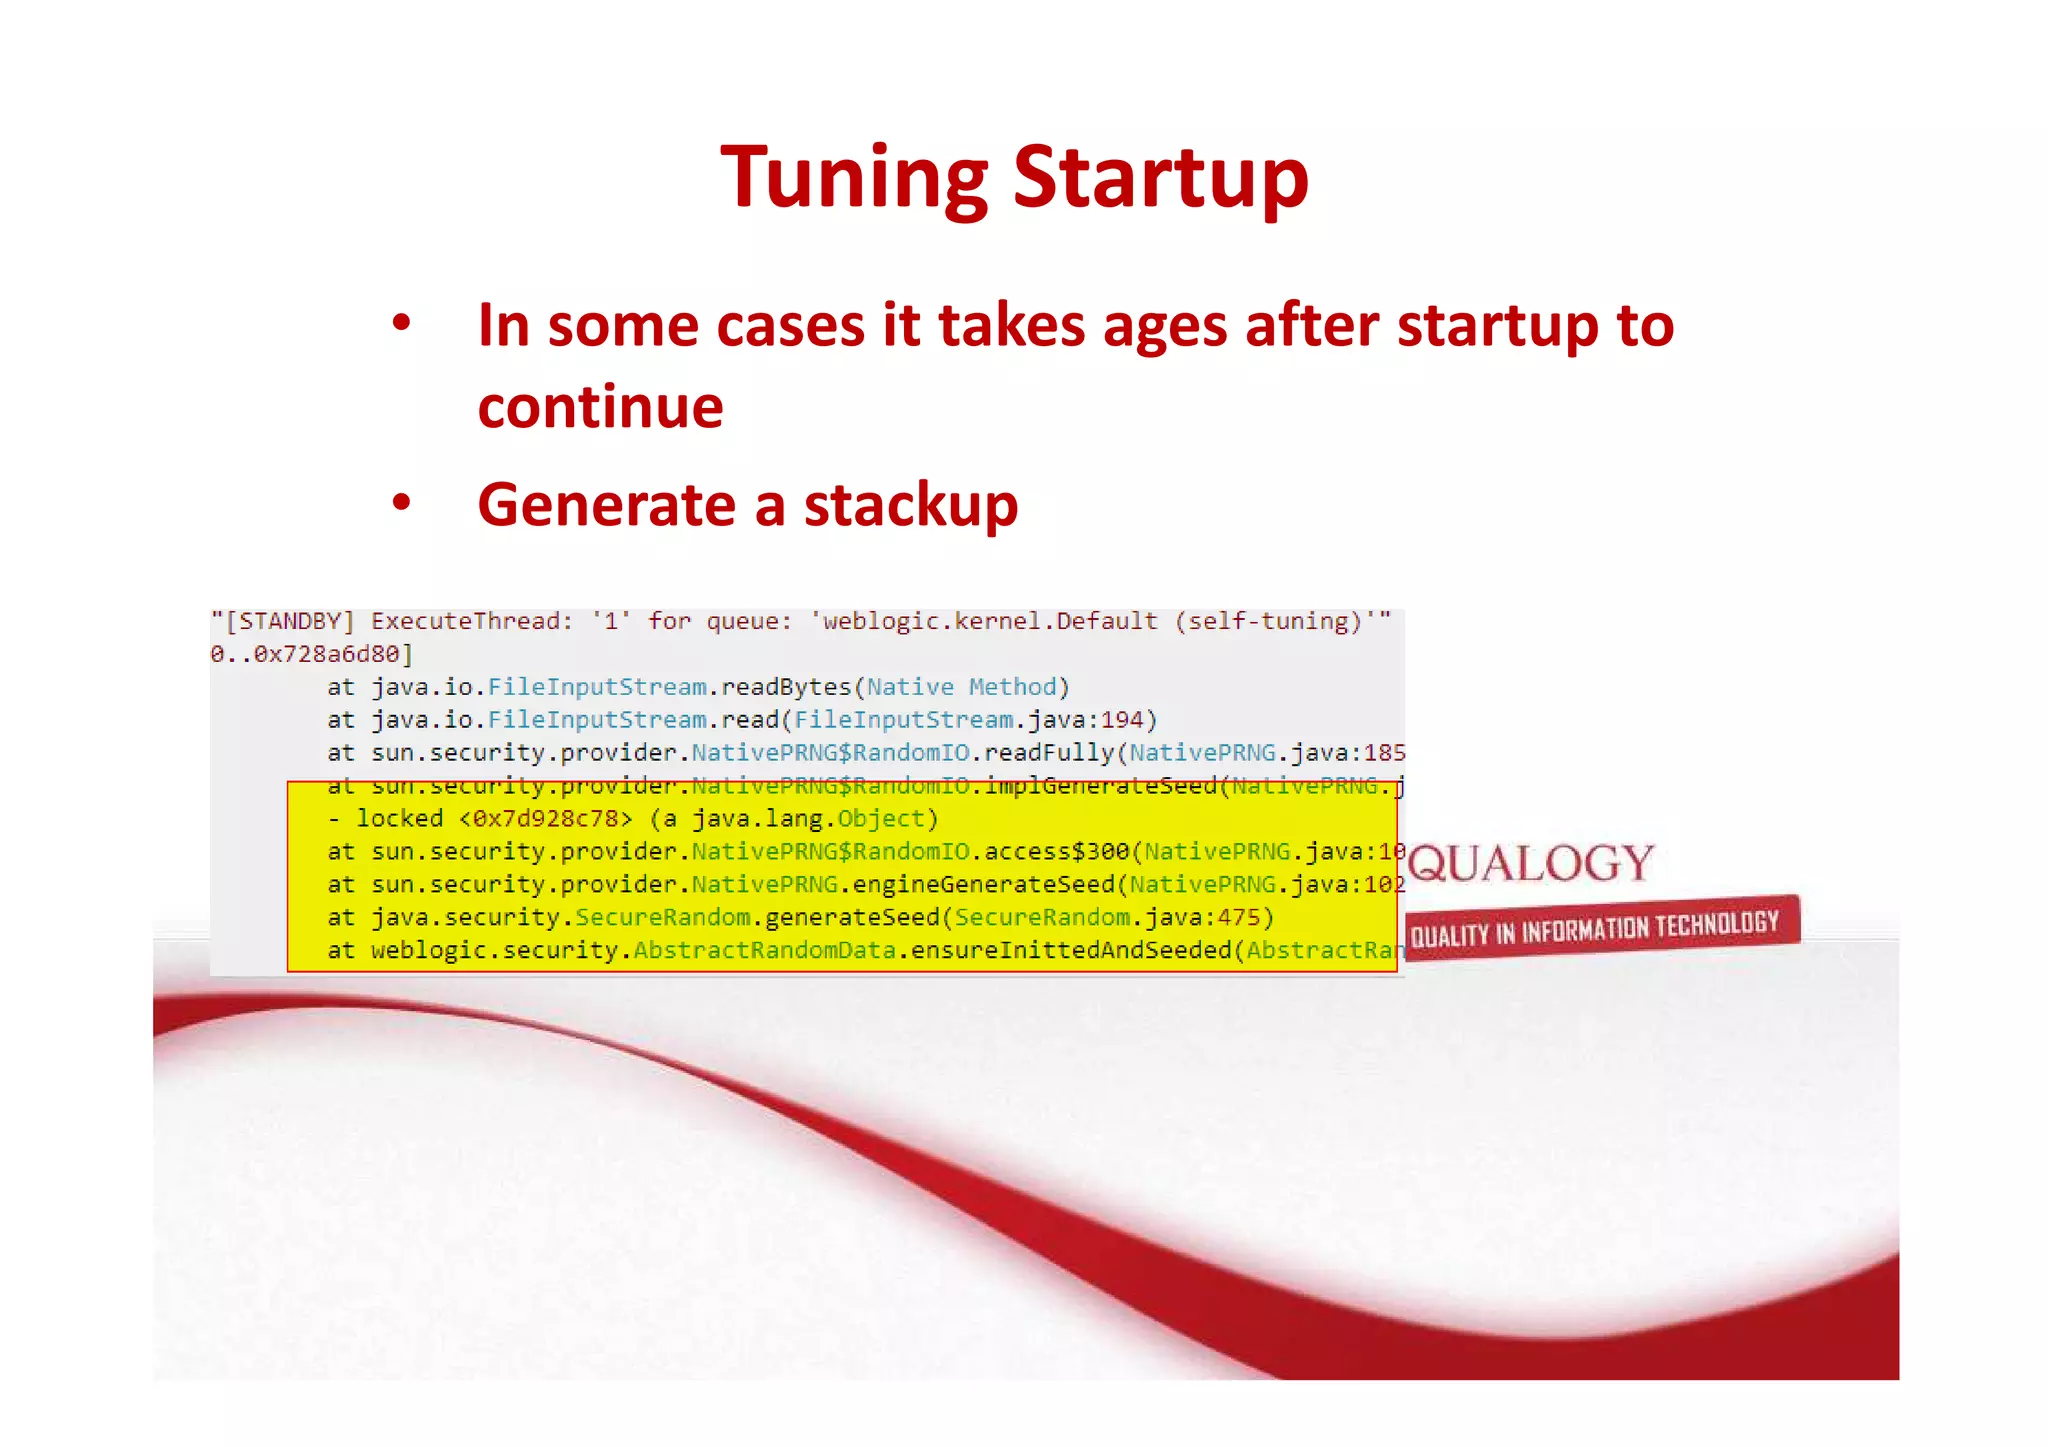
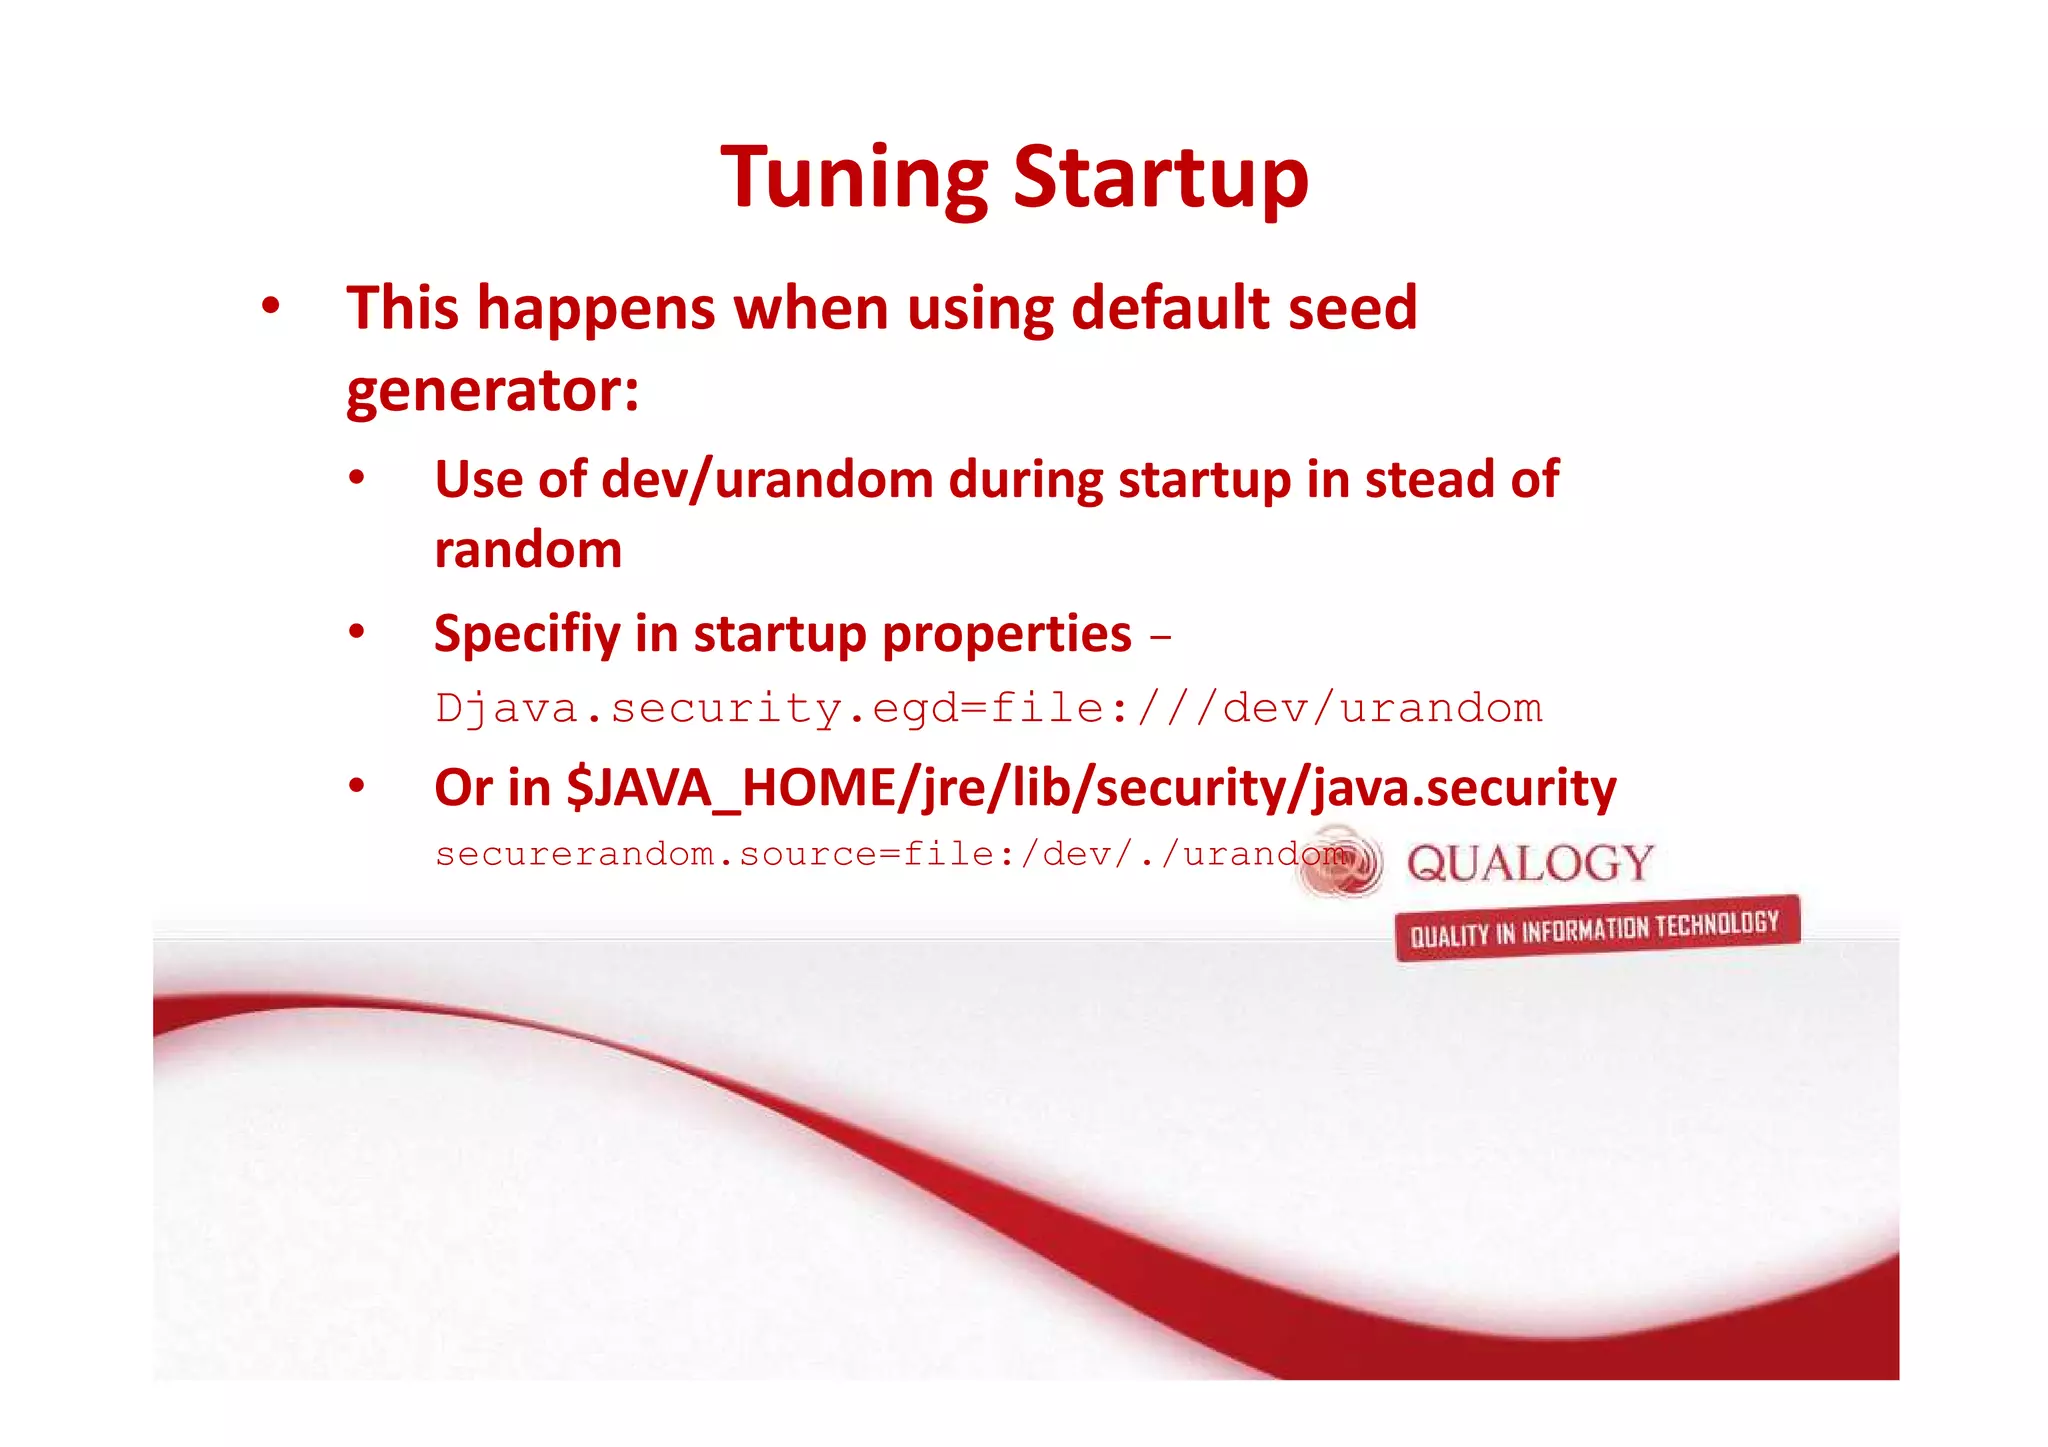
Best practices for configuring execute queues, TCP connections, and other parameters to optimize WebLogic server performance.
Strategies for tuning JVM for optimal performance: garbage collection, heap size management, and settings for efficient operation.
Encouragement to connect for further insights into application server concepts and Oracle Fusion Middleware.