Downloaded 170 times


The document details a presentation by Peter Lawrey on low-latency Java programming, focusing on high-frequency trading and open-source tools like Chronicle for data persistence and efficient communication. It outlines various performance optimization techniques for Java, including garbage collection management and memory access strategies. Key takeaways include the importance of measuring and profiling performance, reducing garbage production, and utilizing low-latency network connections.
Introduction to Low Latency Java with OpenHFT by CEO Peter Lawrey, expert in Java Performance.
The issue is fast reading/writing to distributed systems. Agenda covers use of Open Source products.
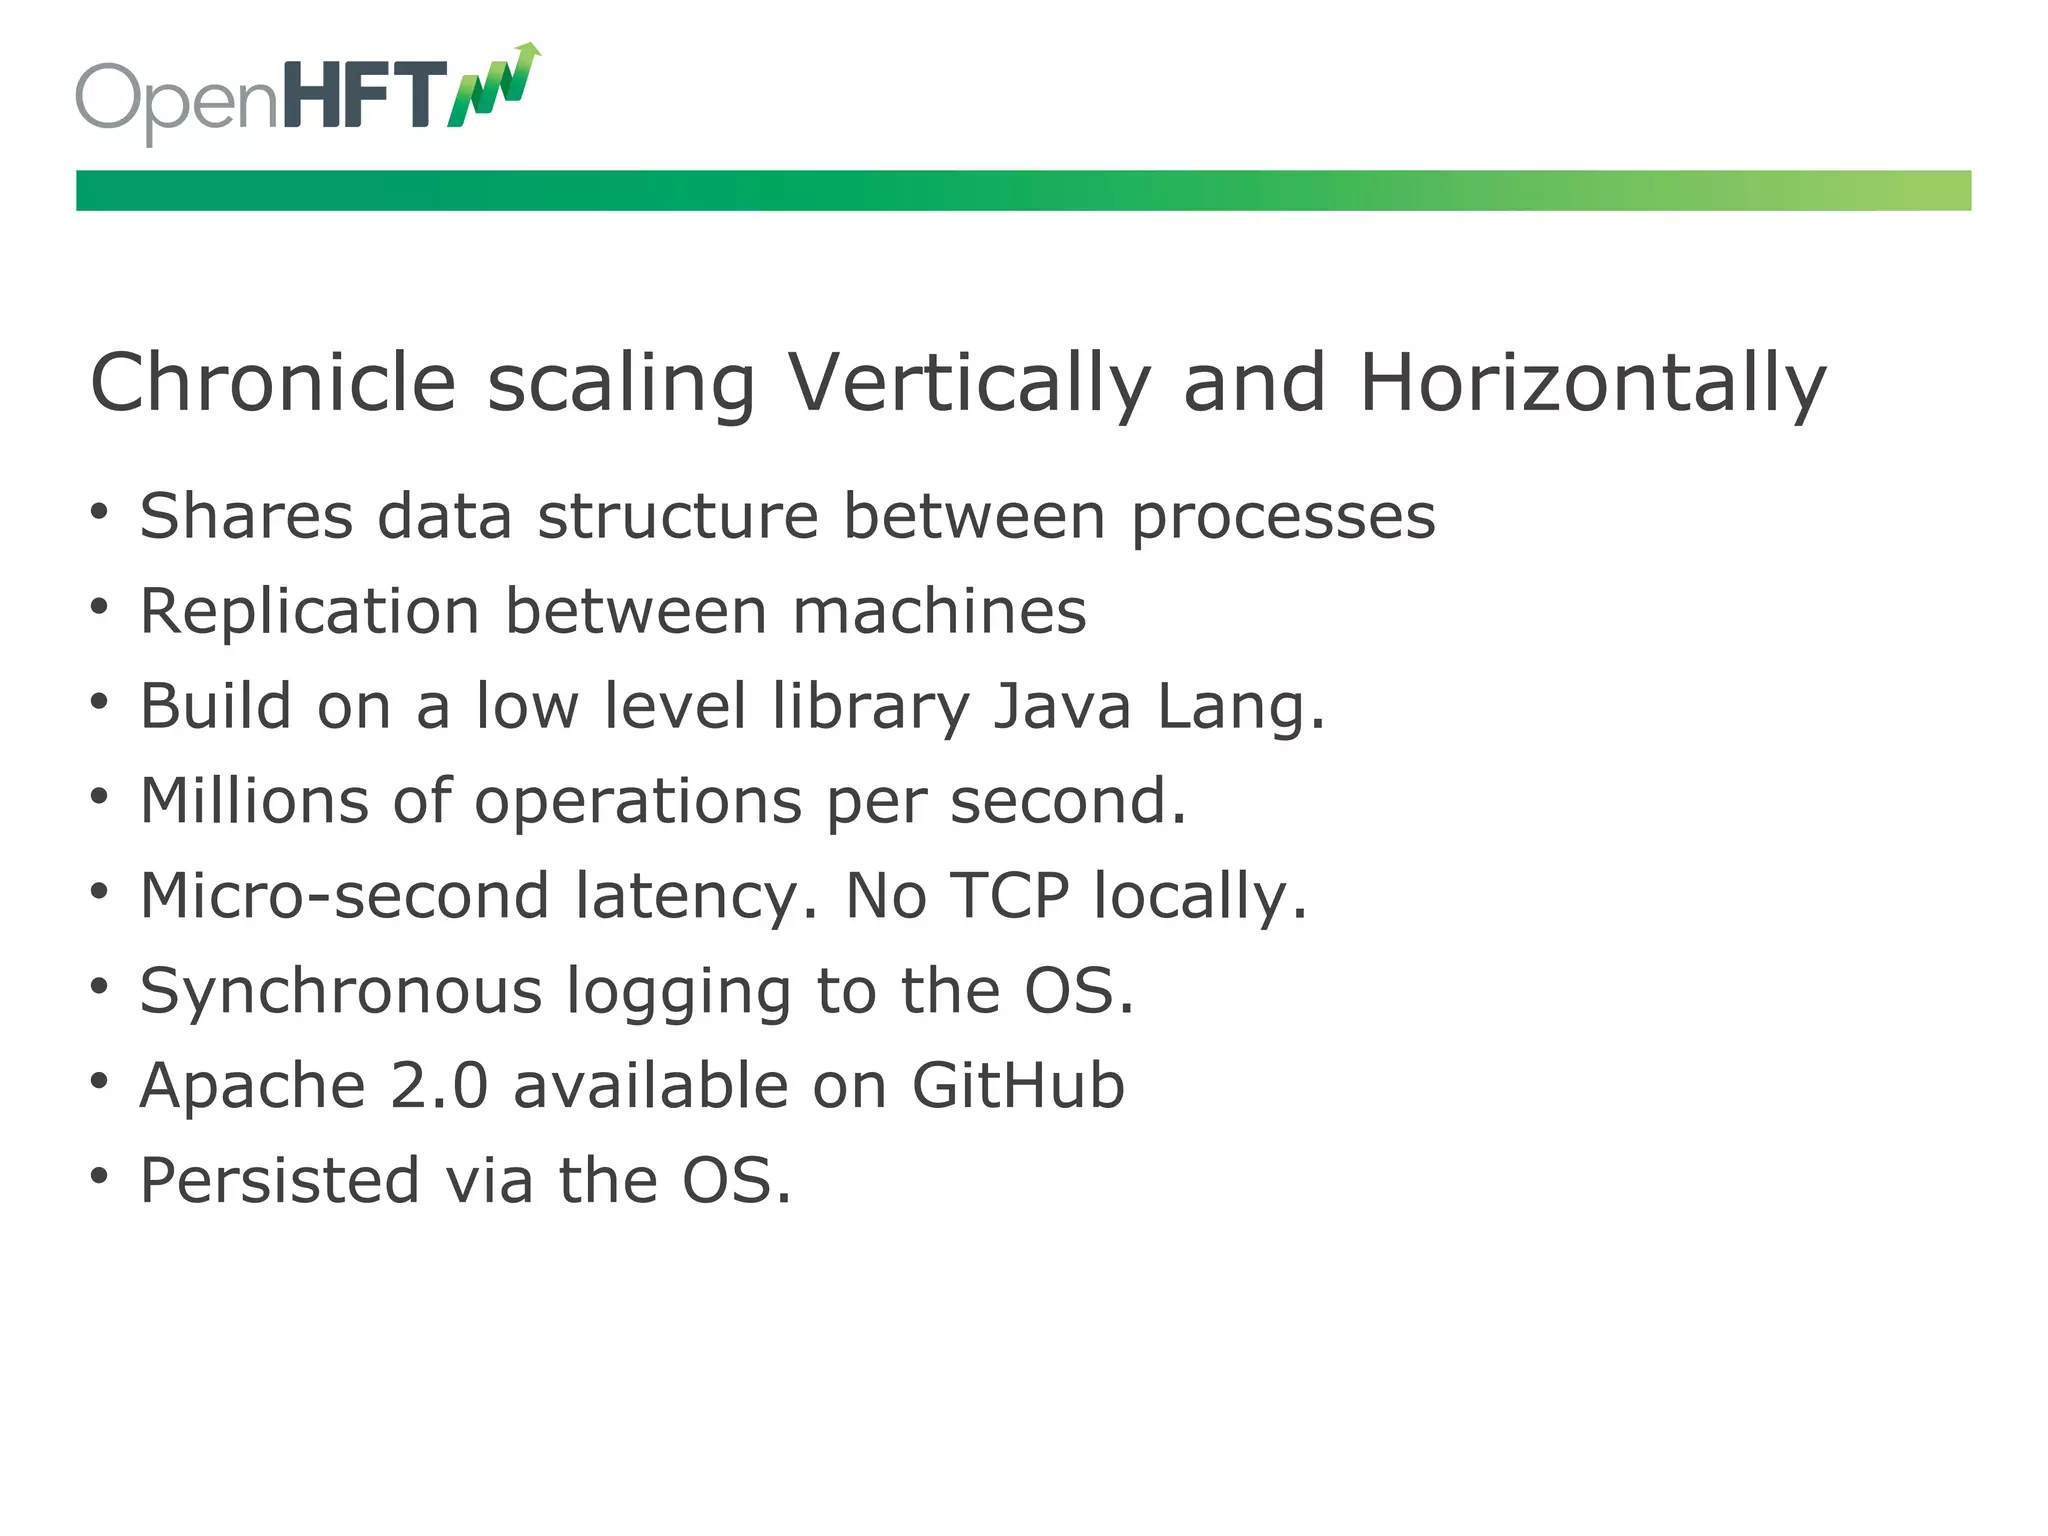
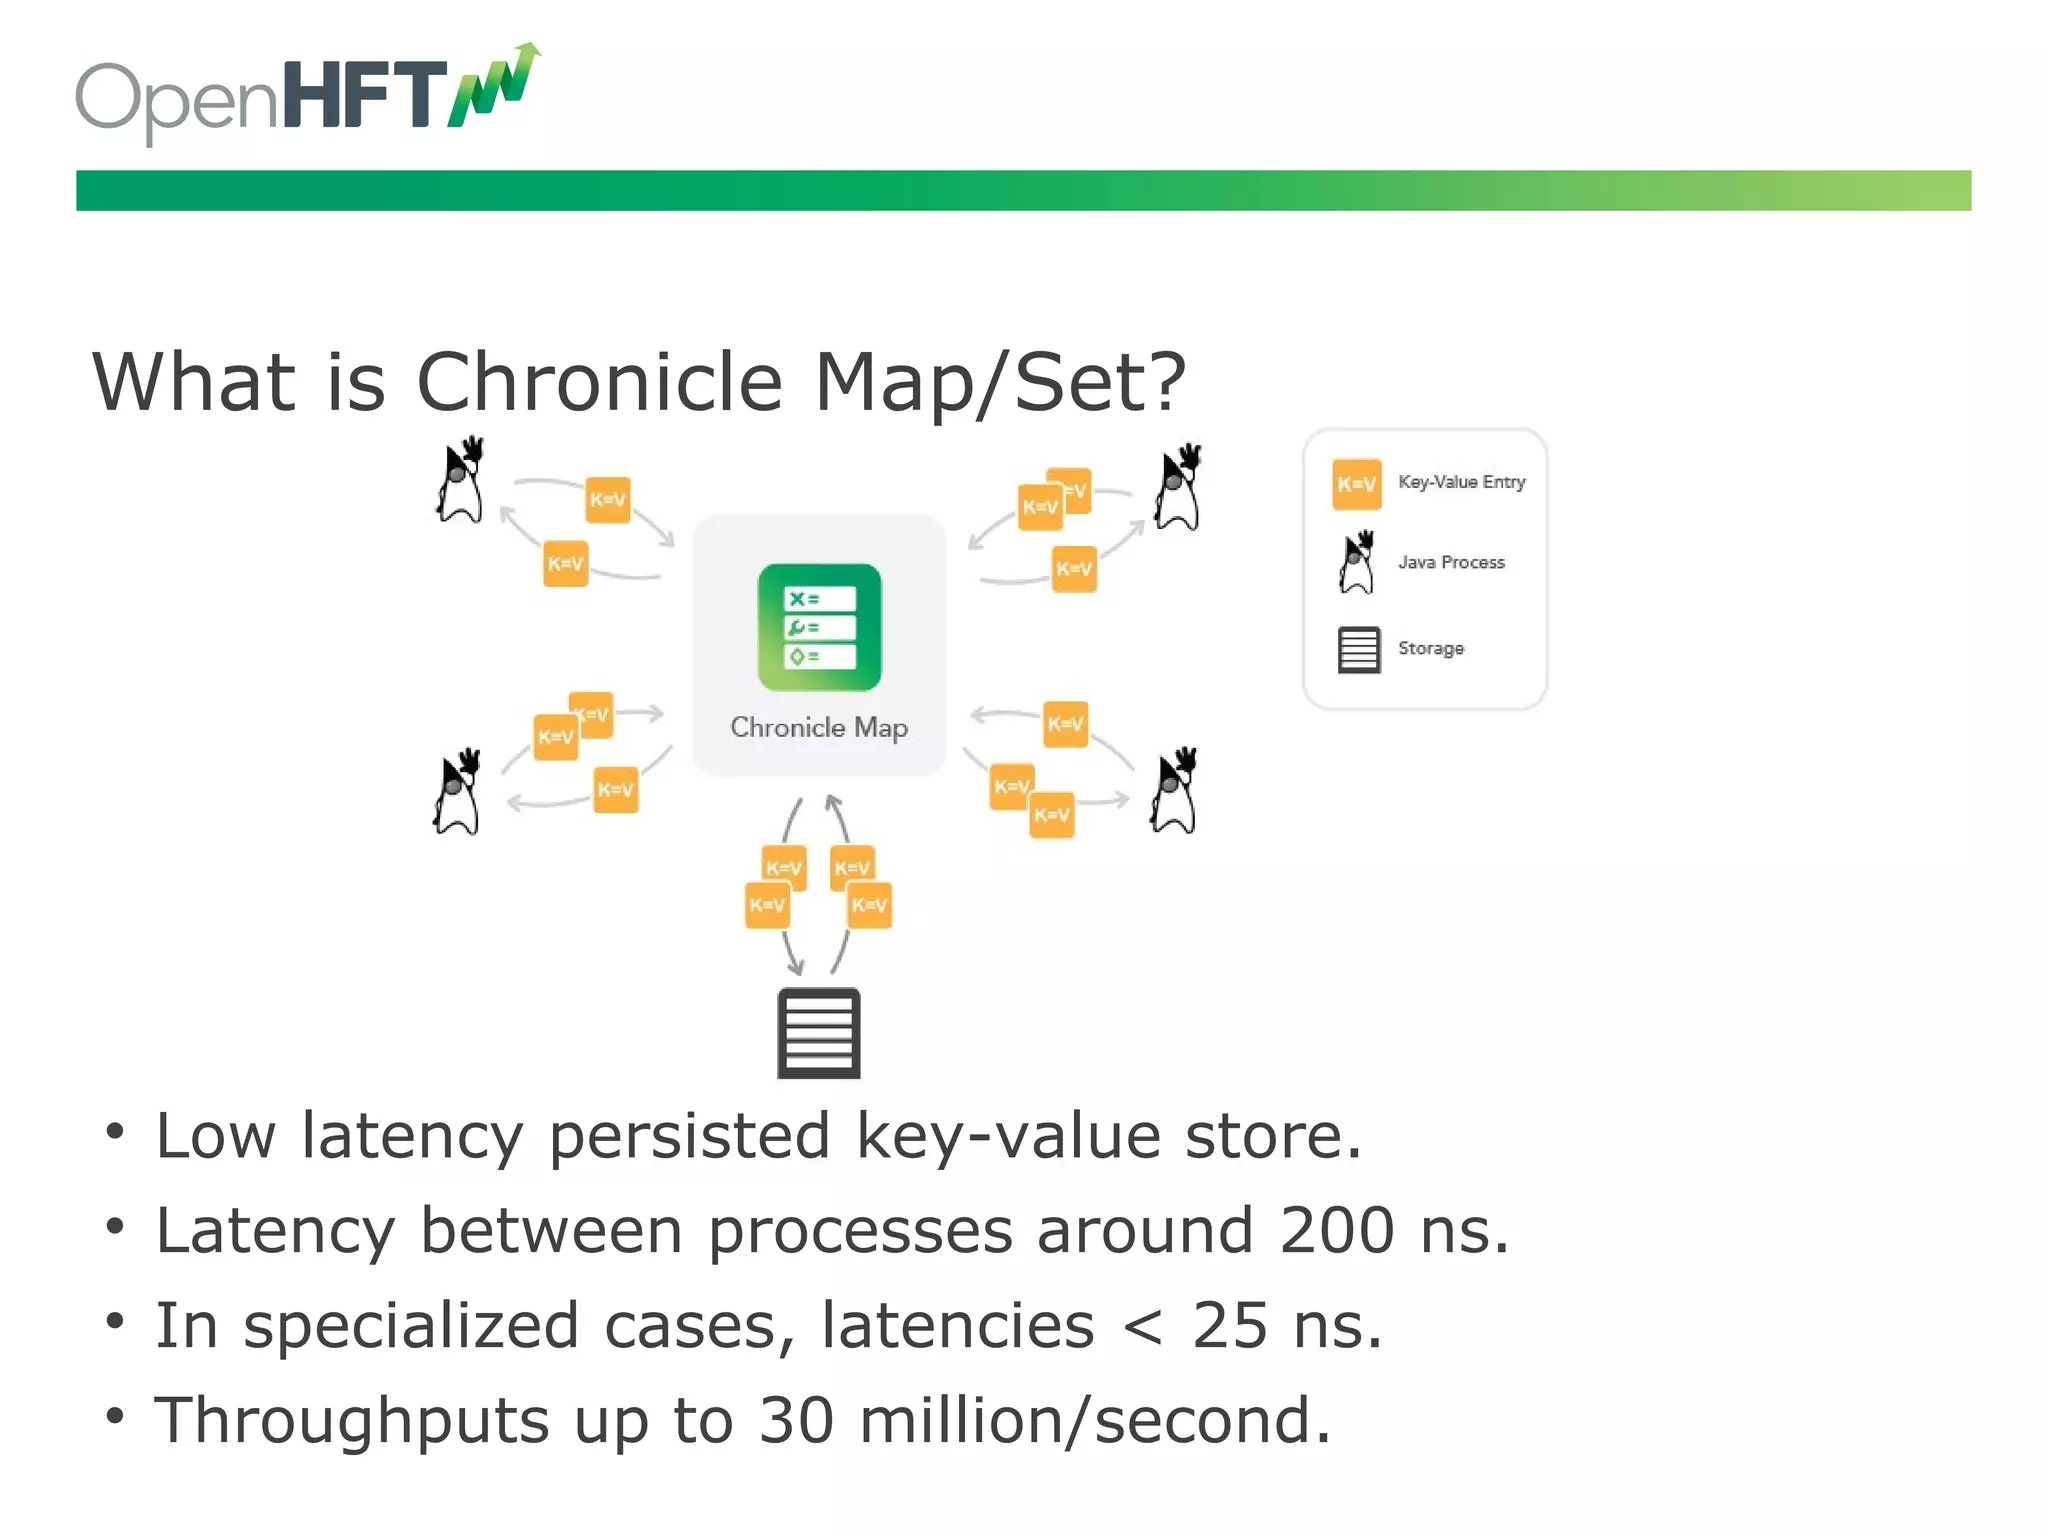
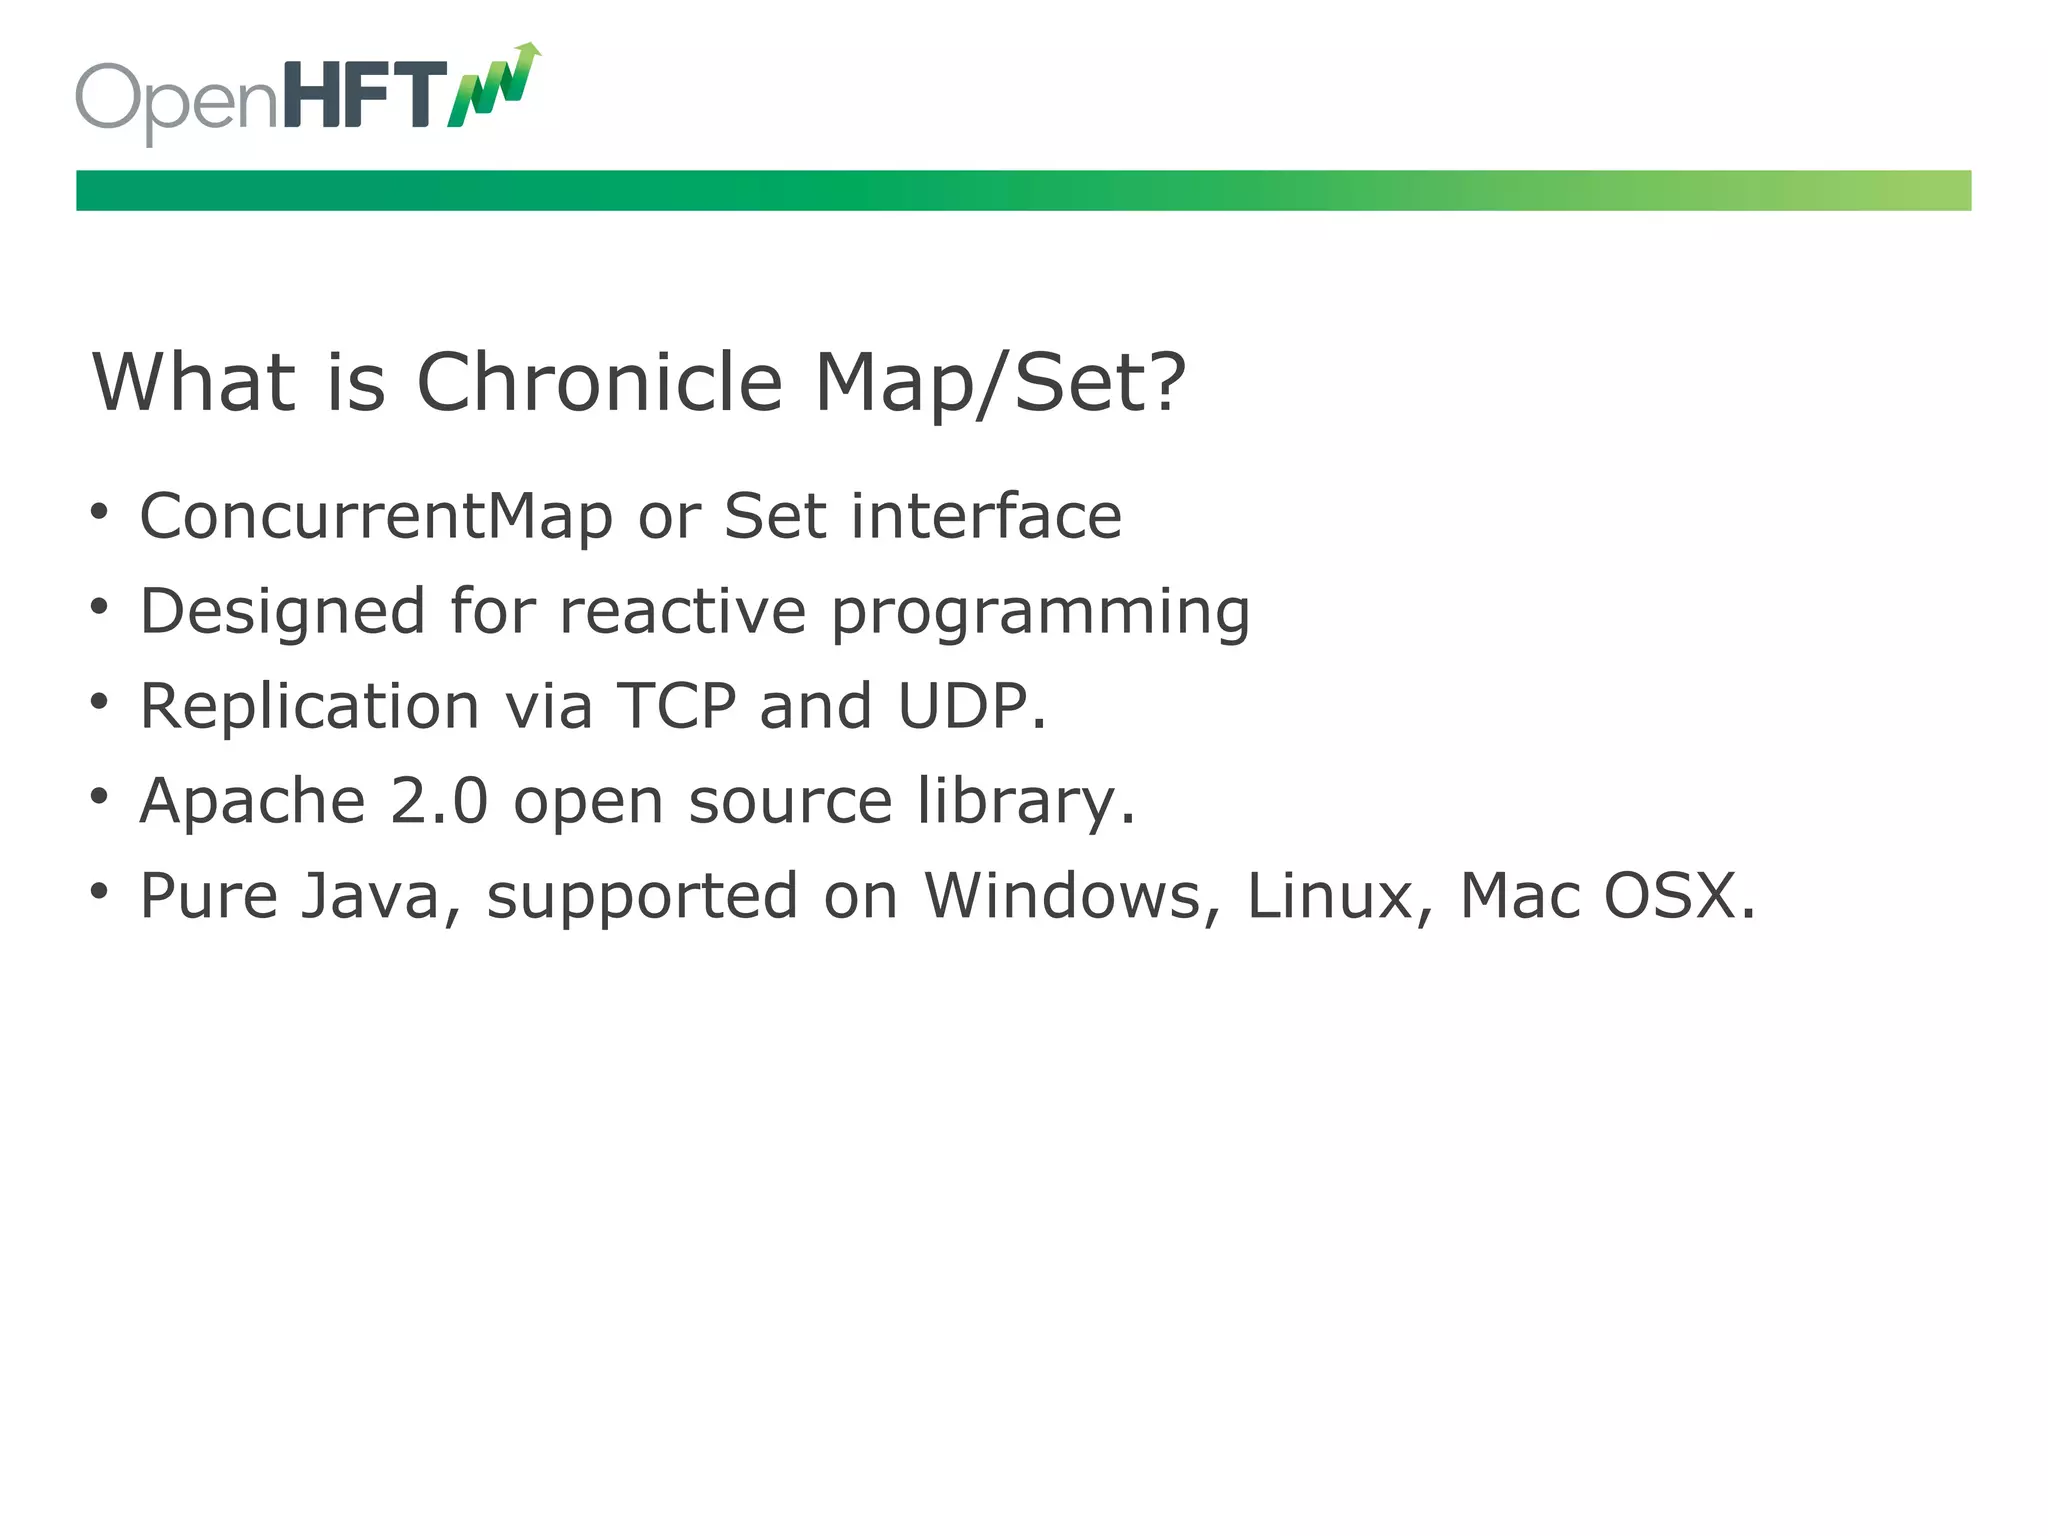
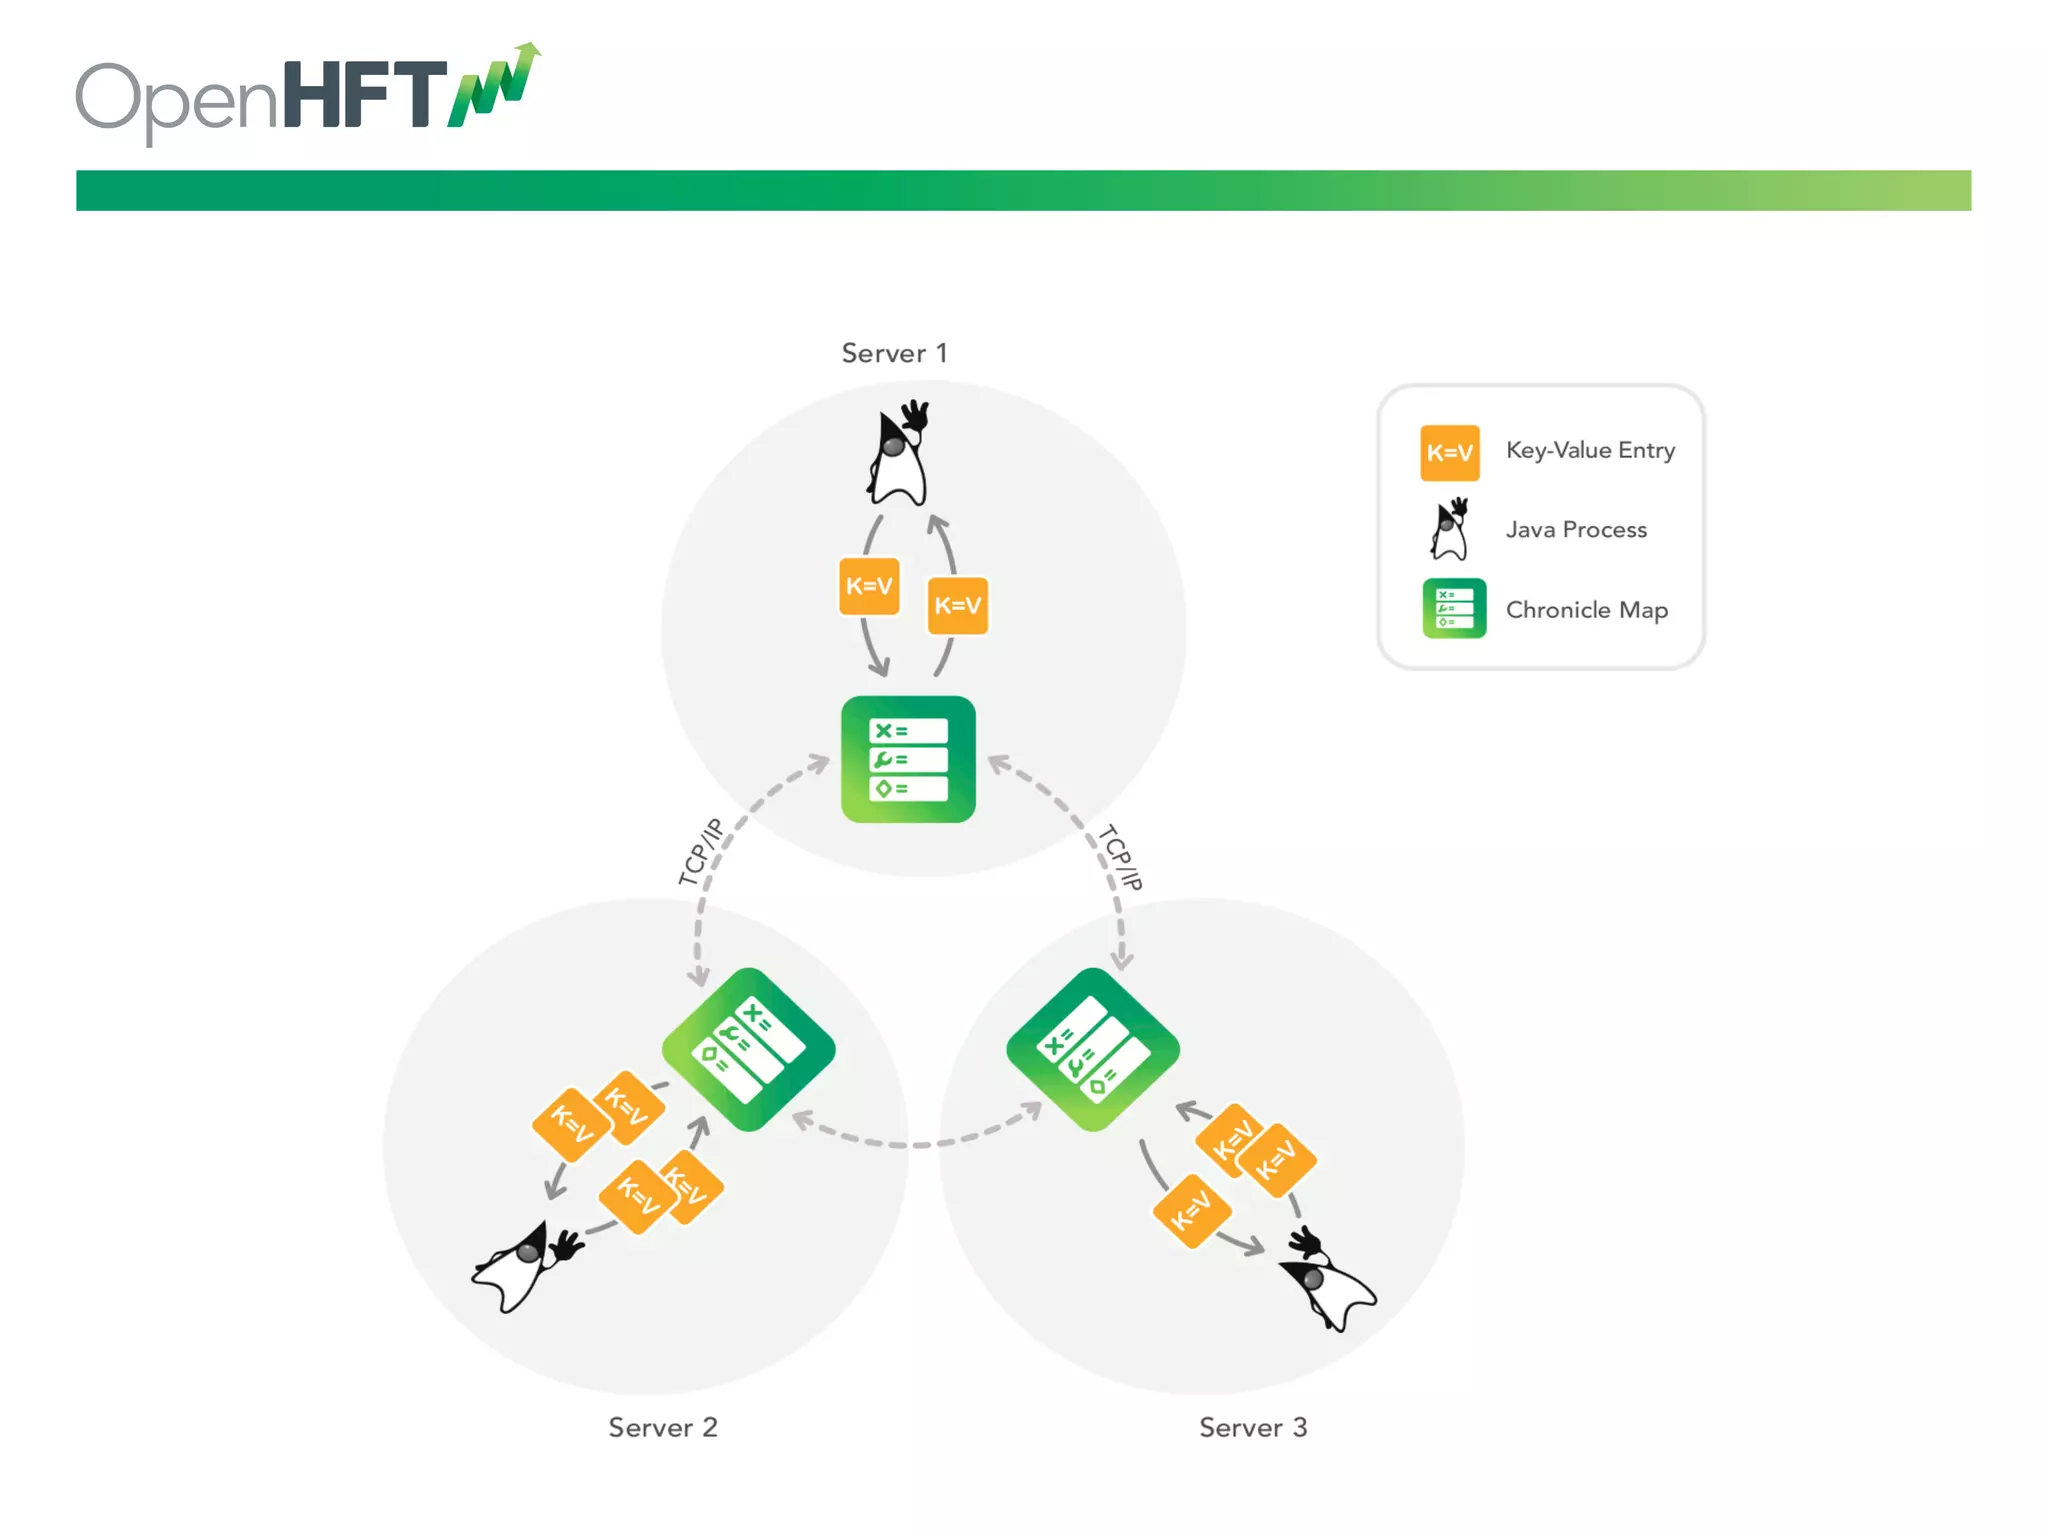
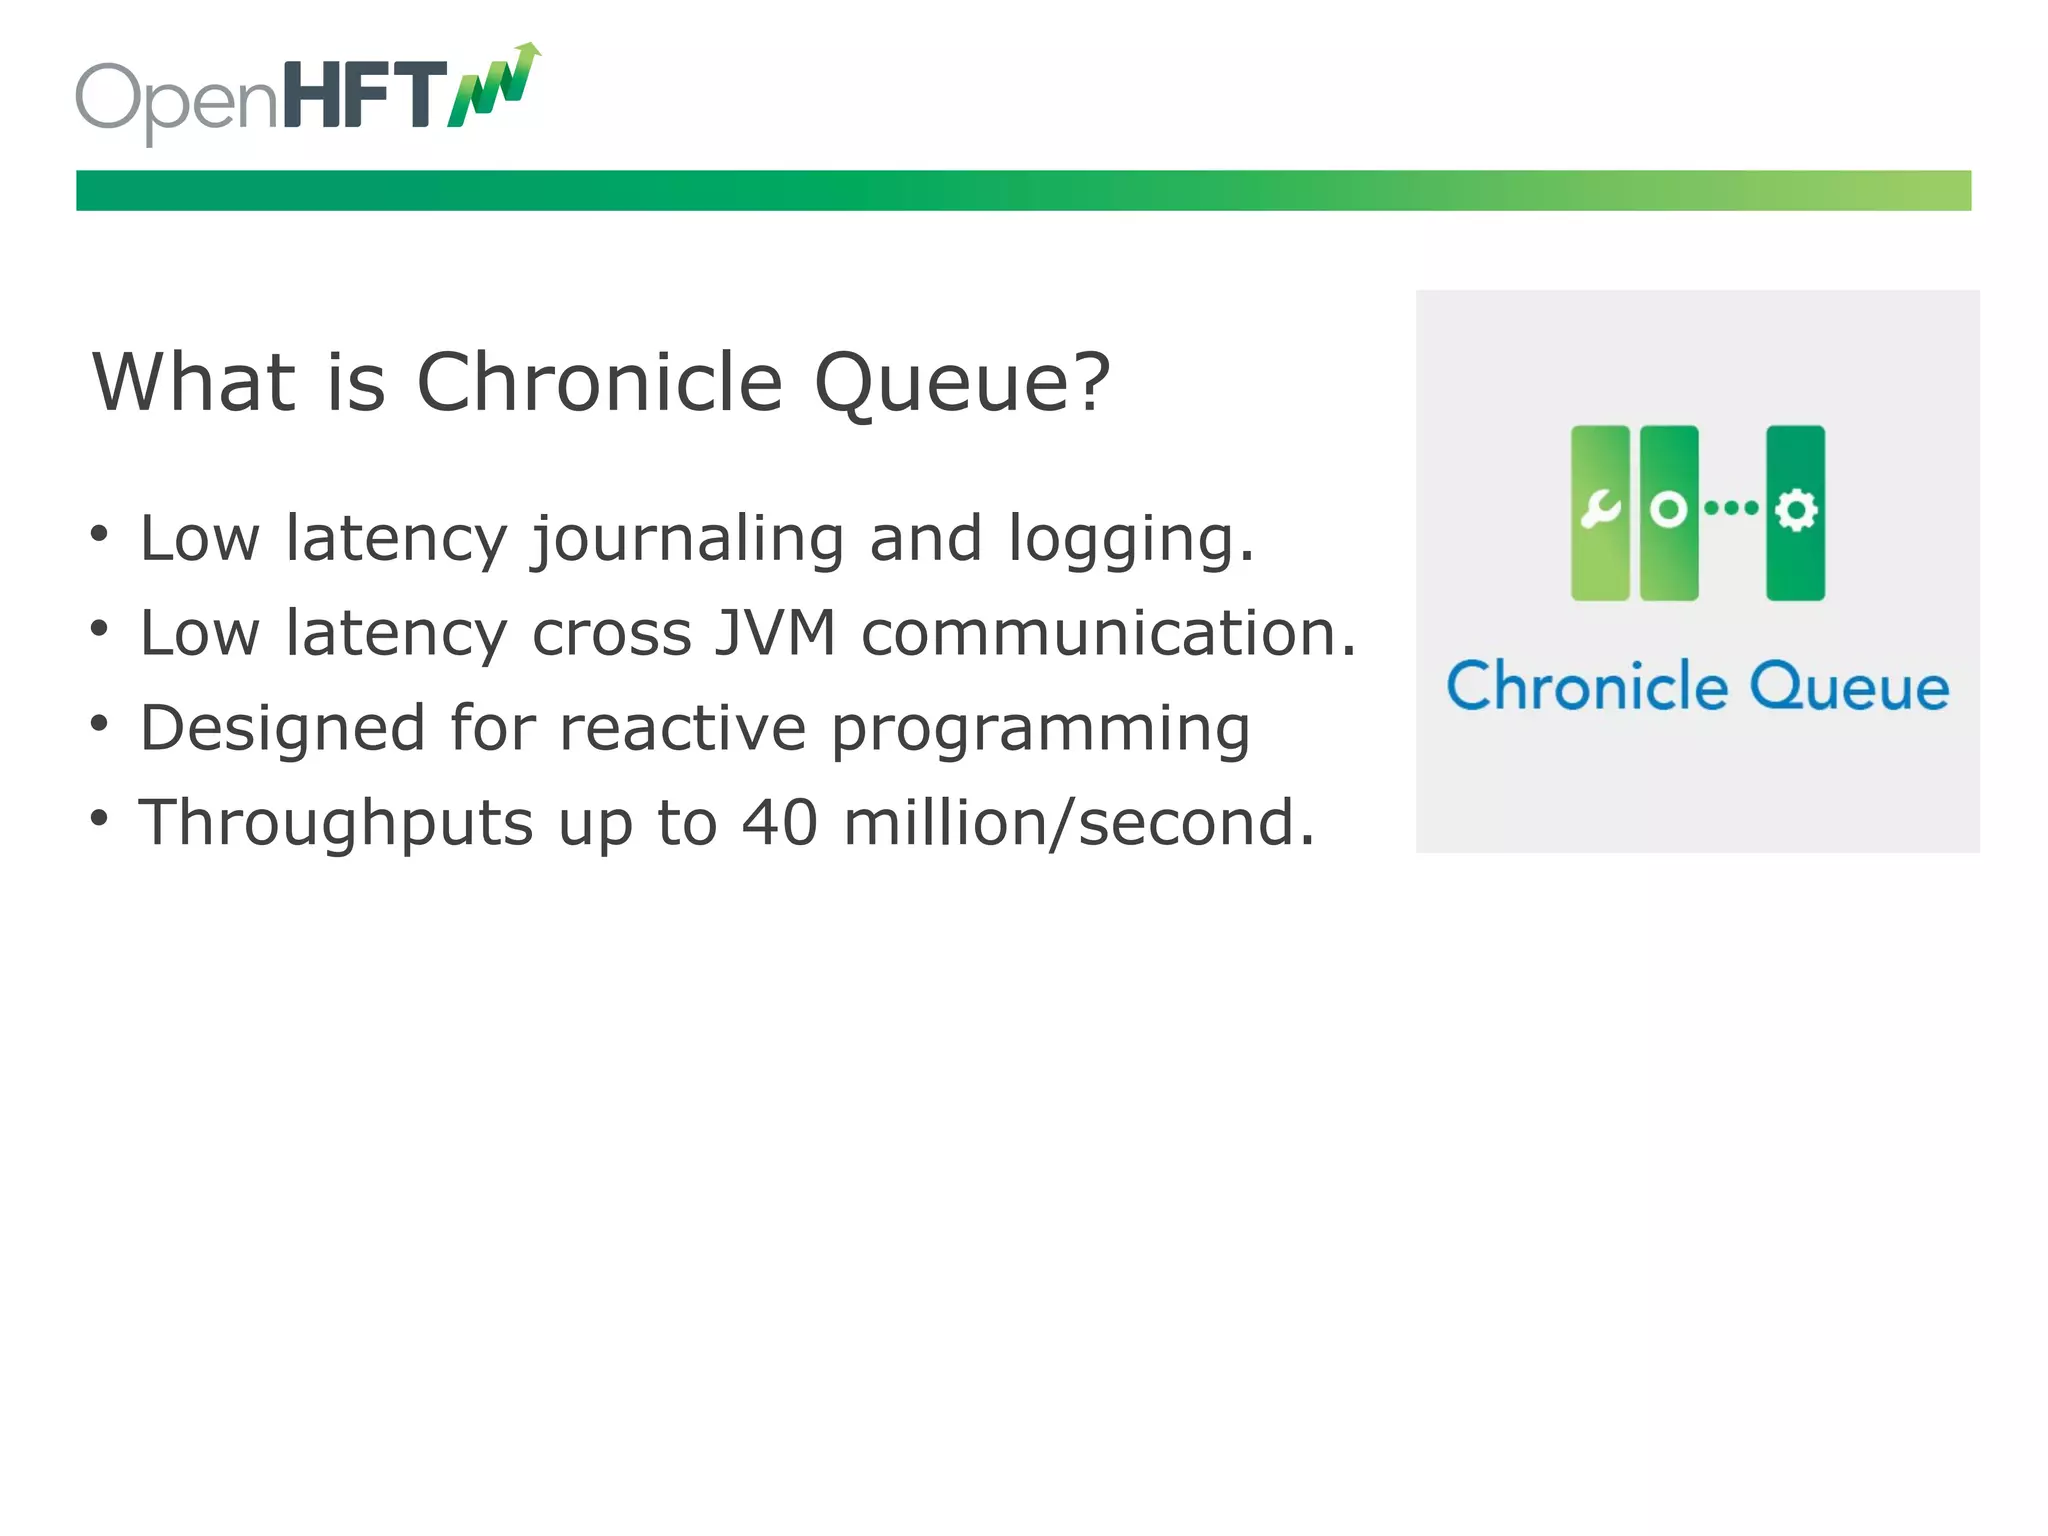
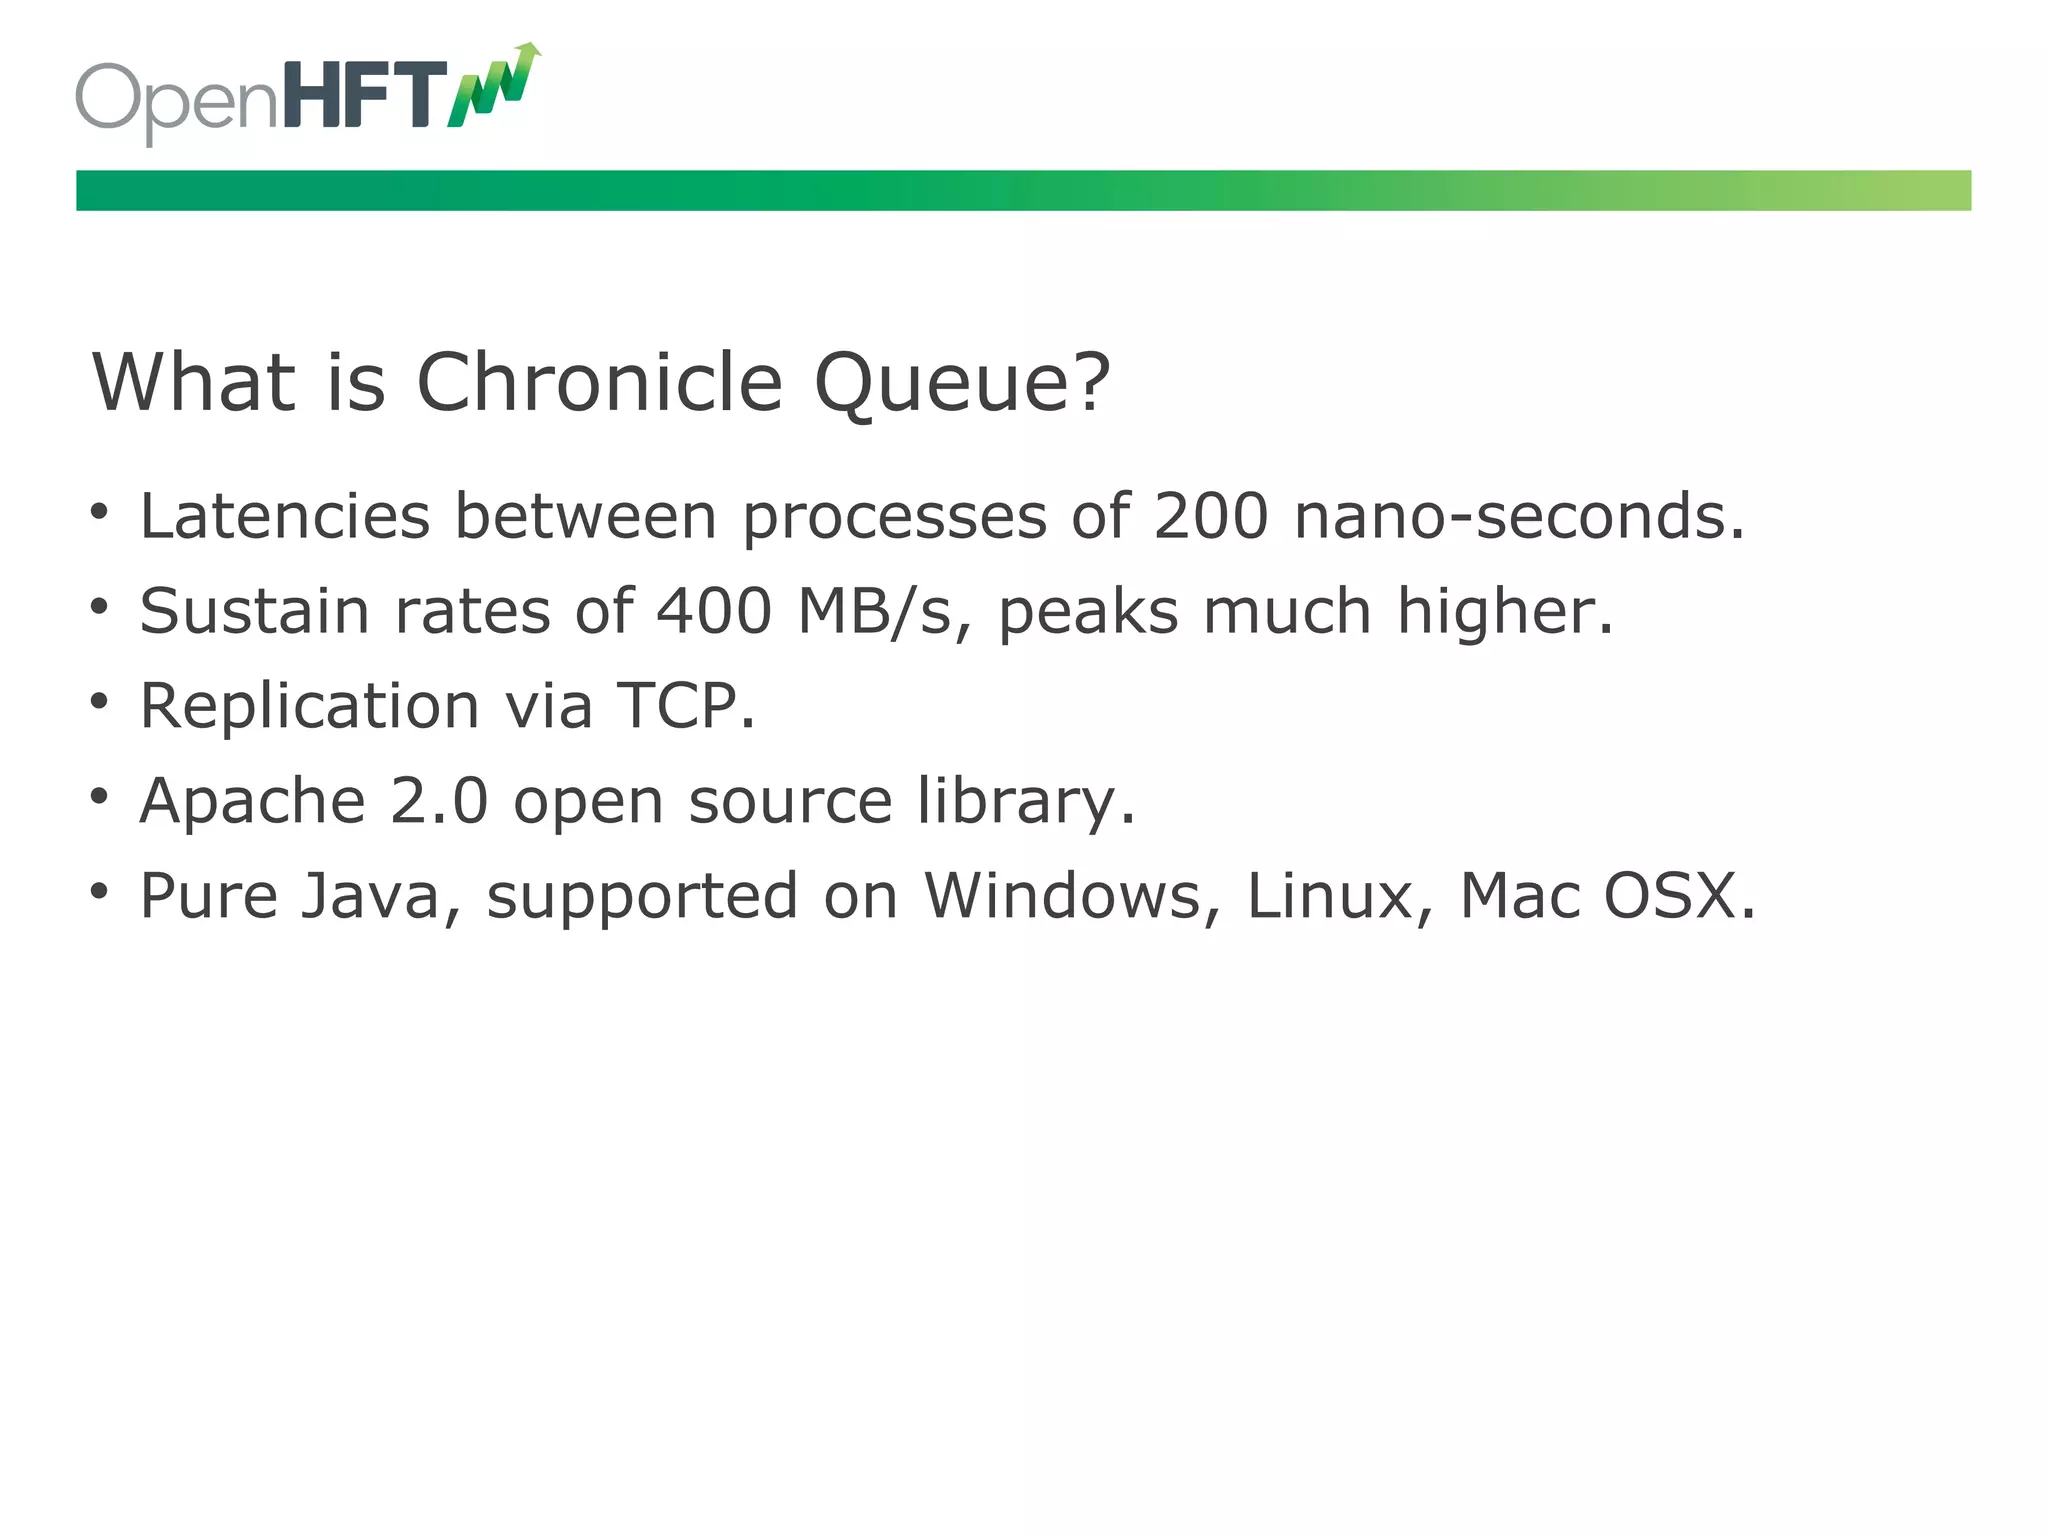
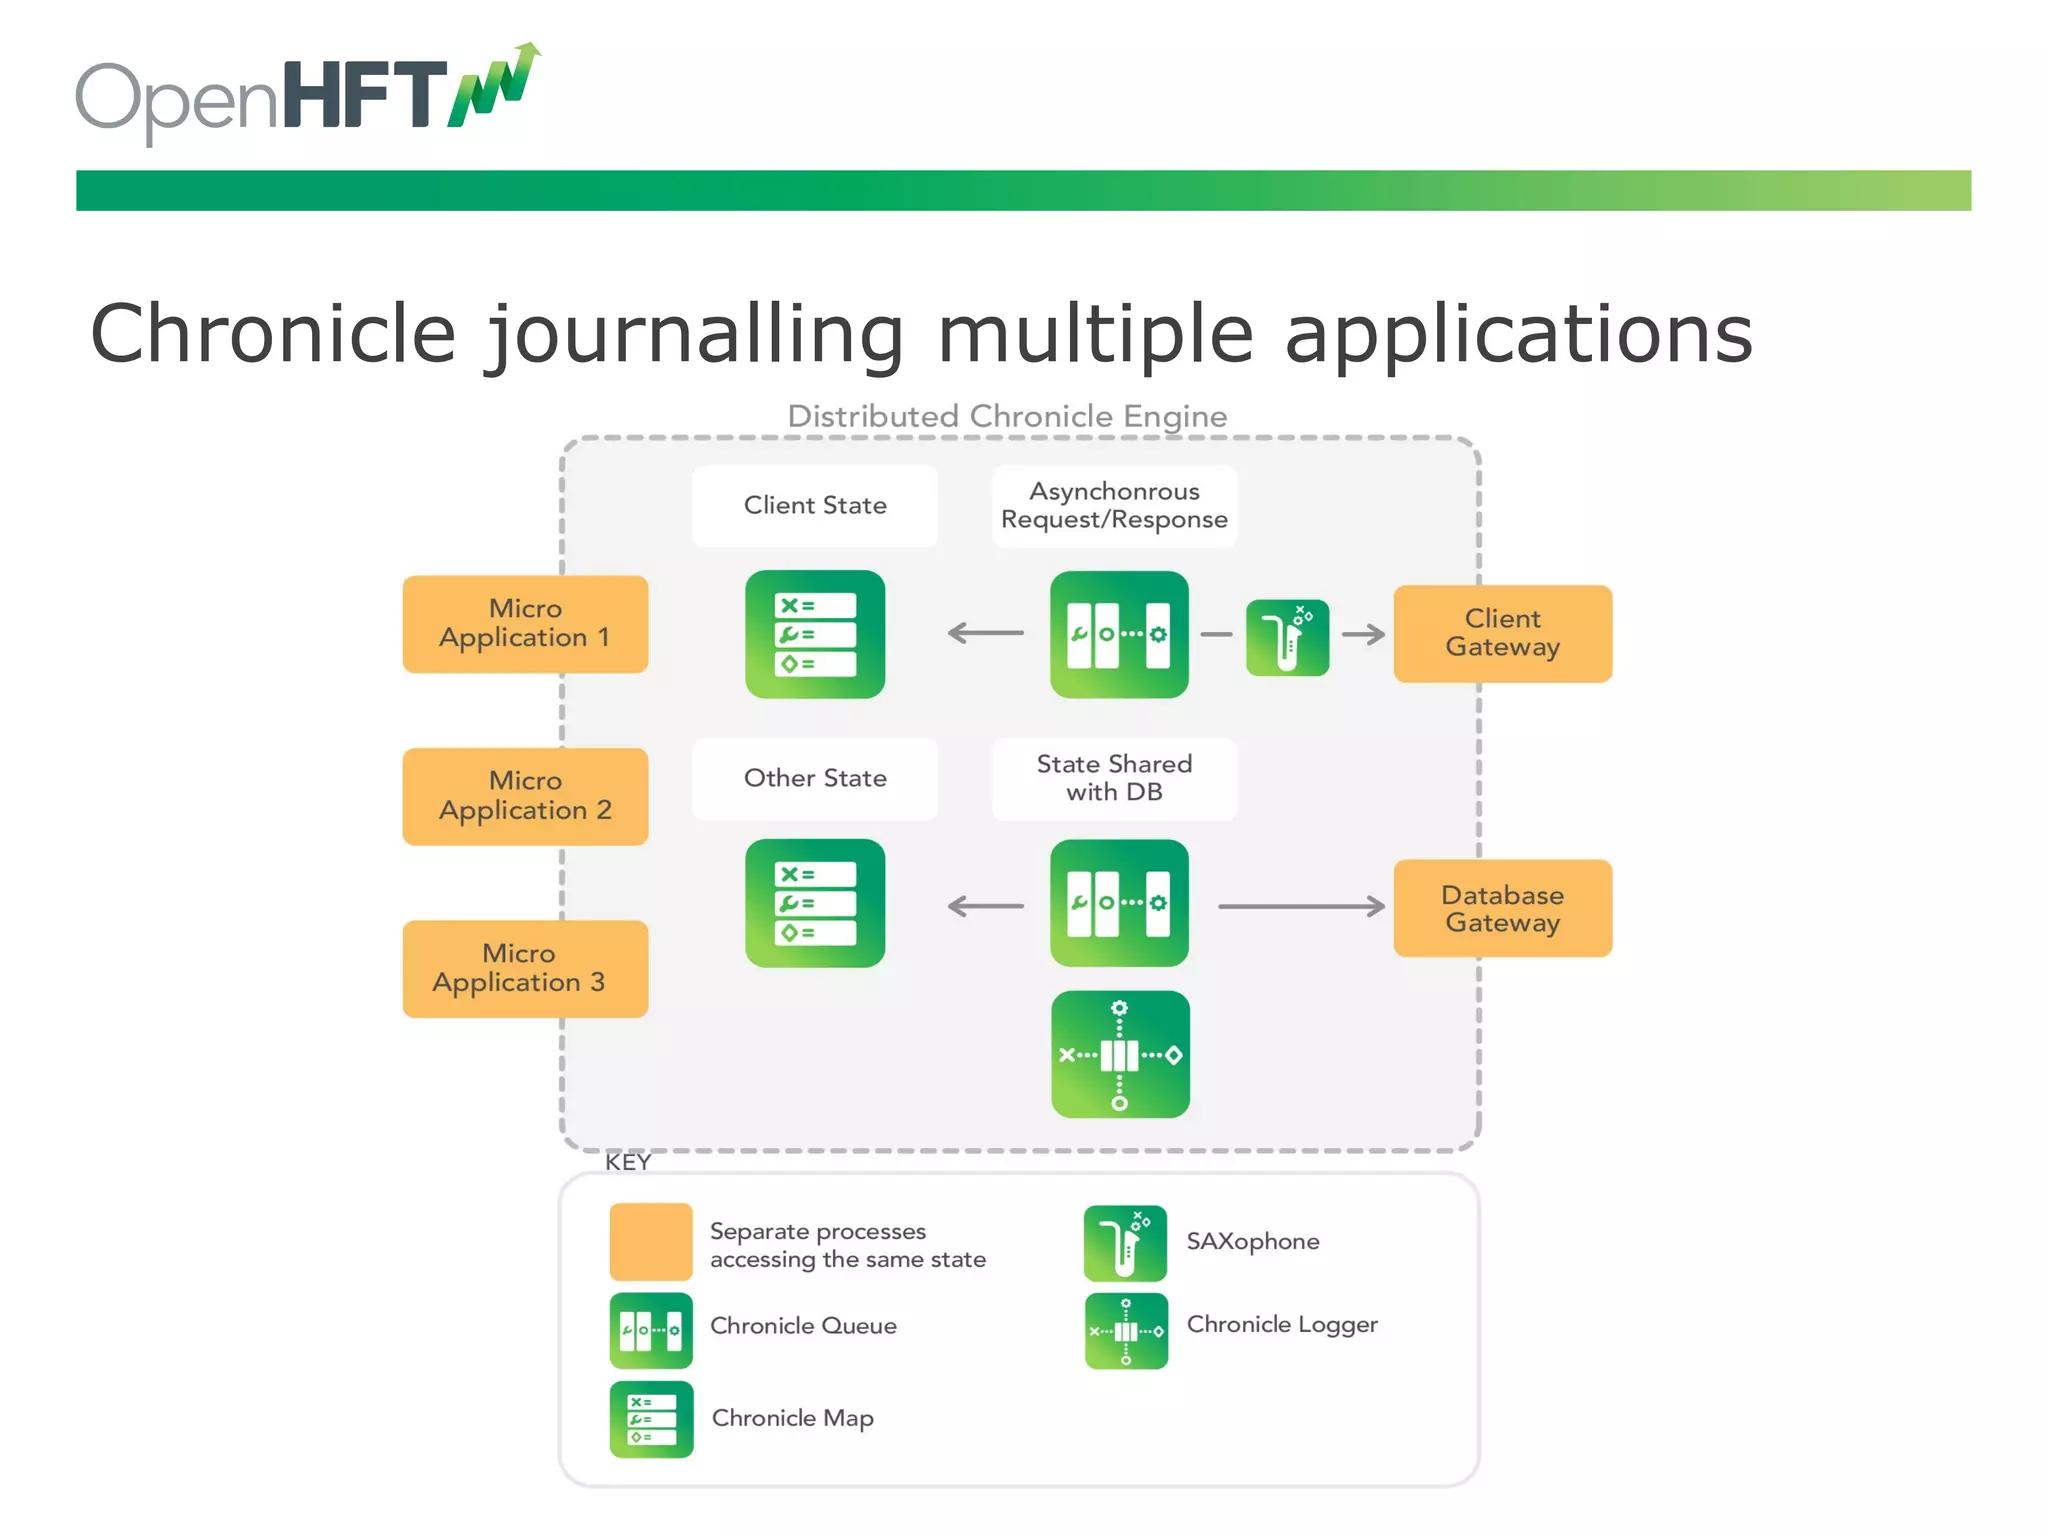
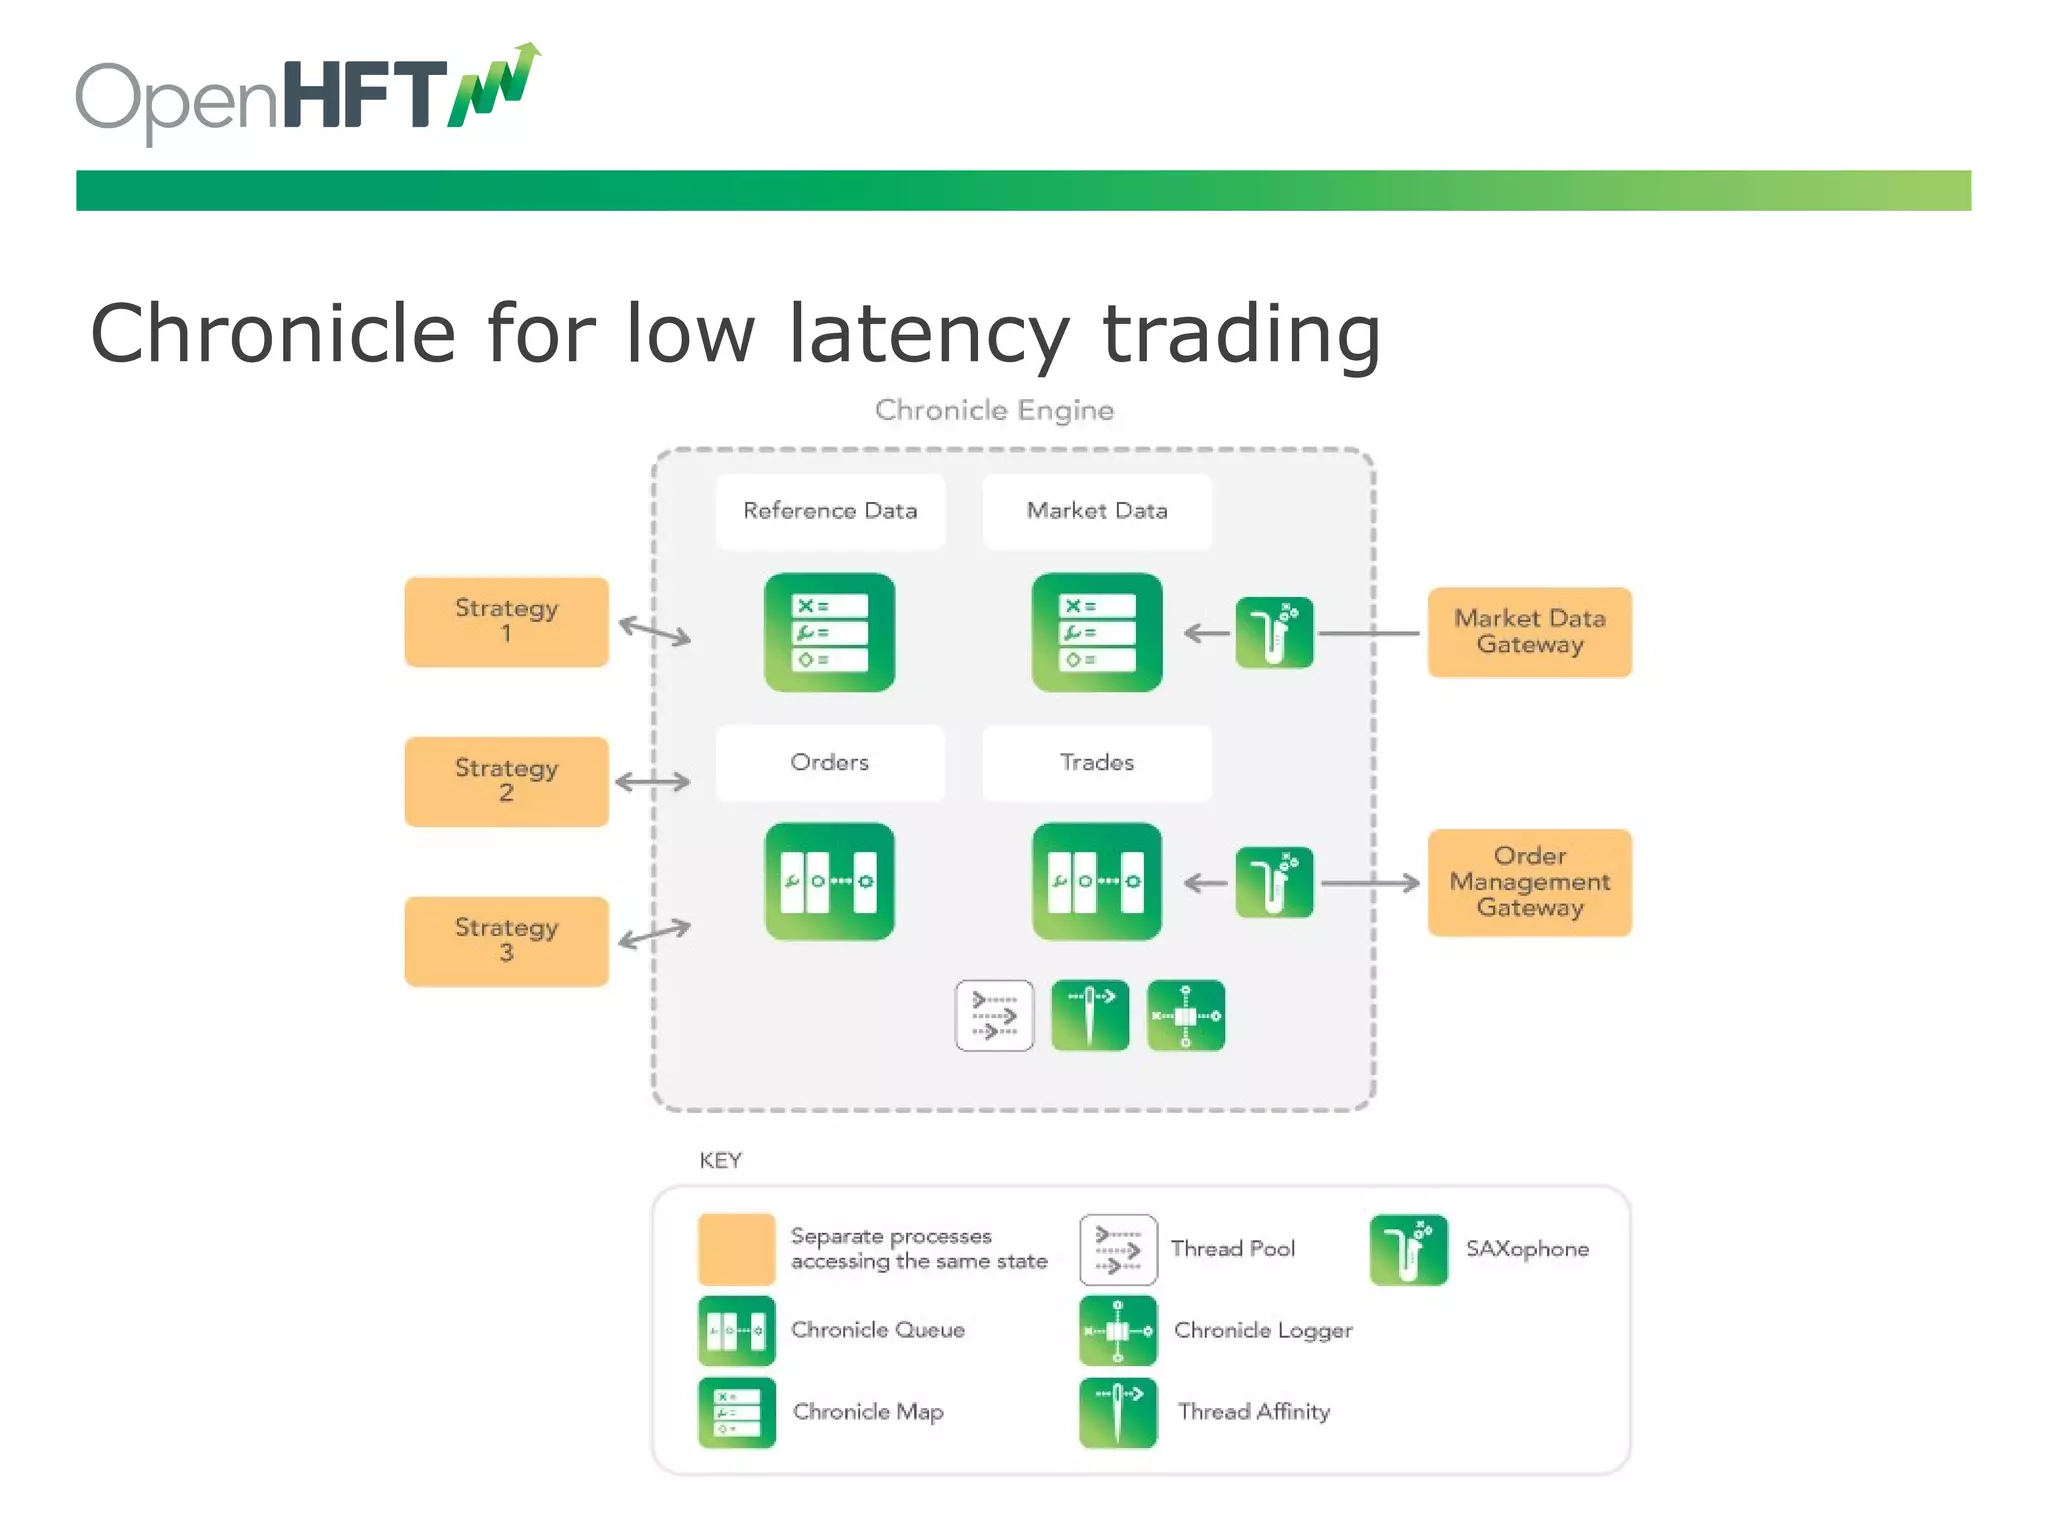
Chronicle tech offers low latency data structures, with 200 ns latency, millions of ops/sec through various modules.
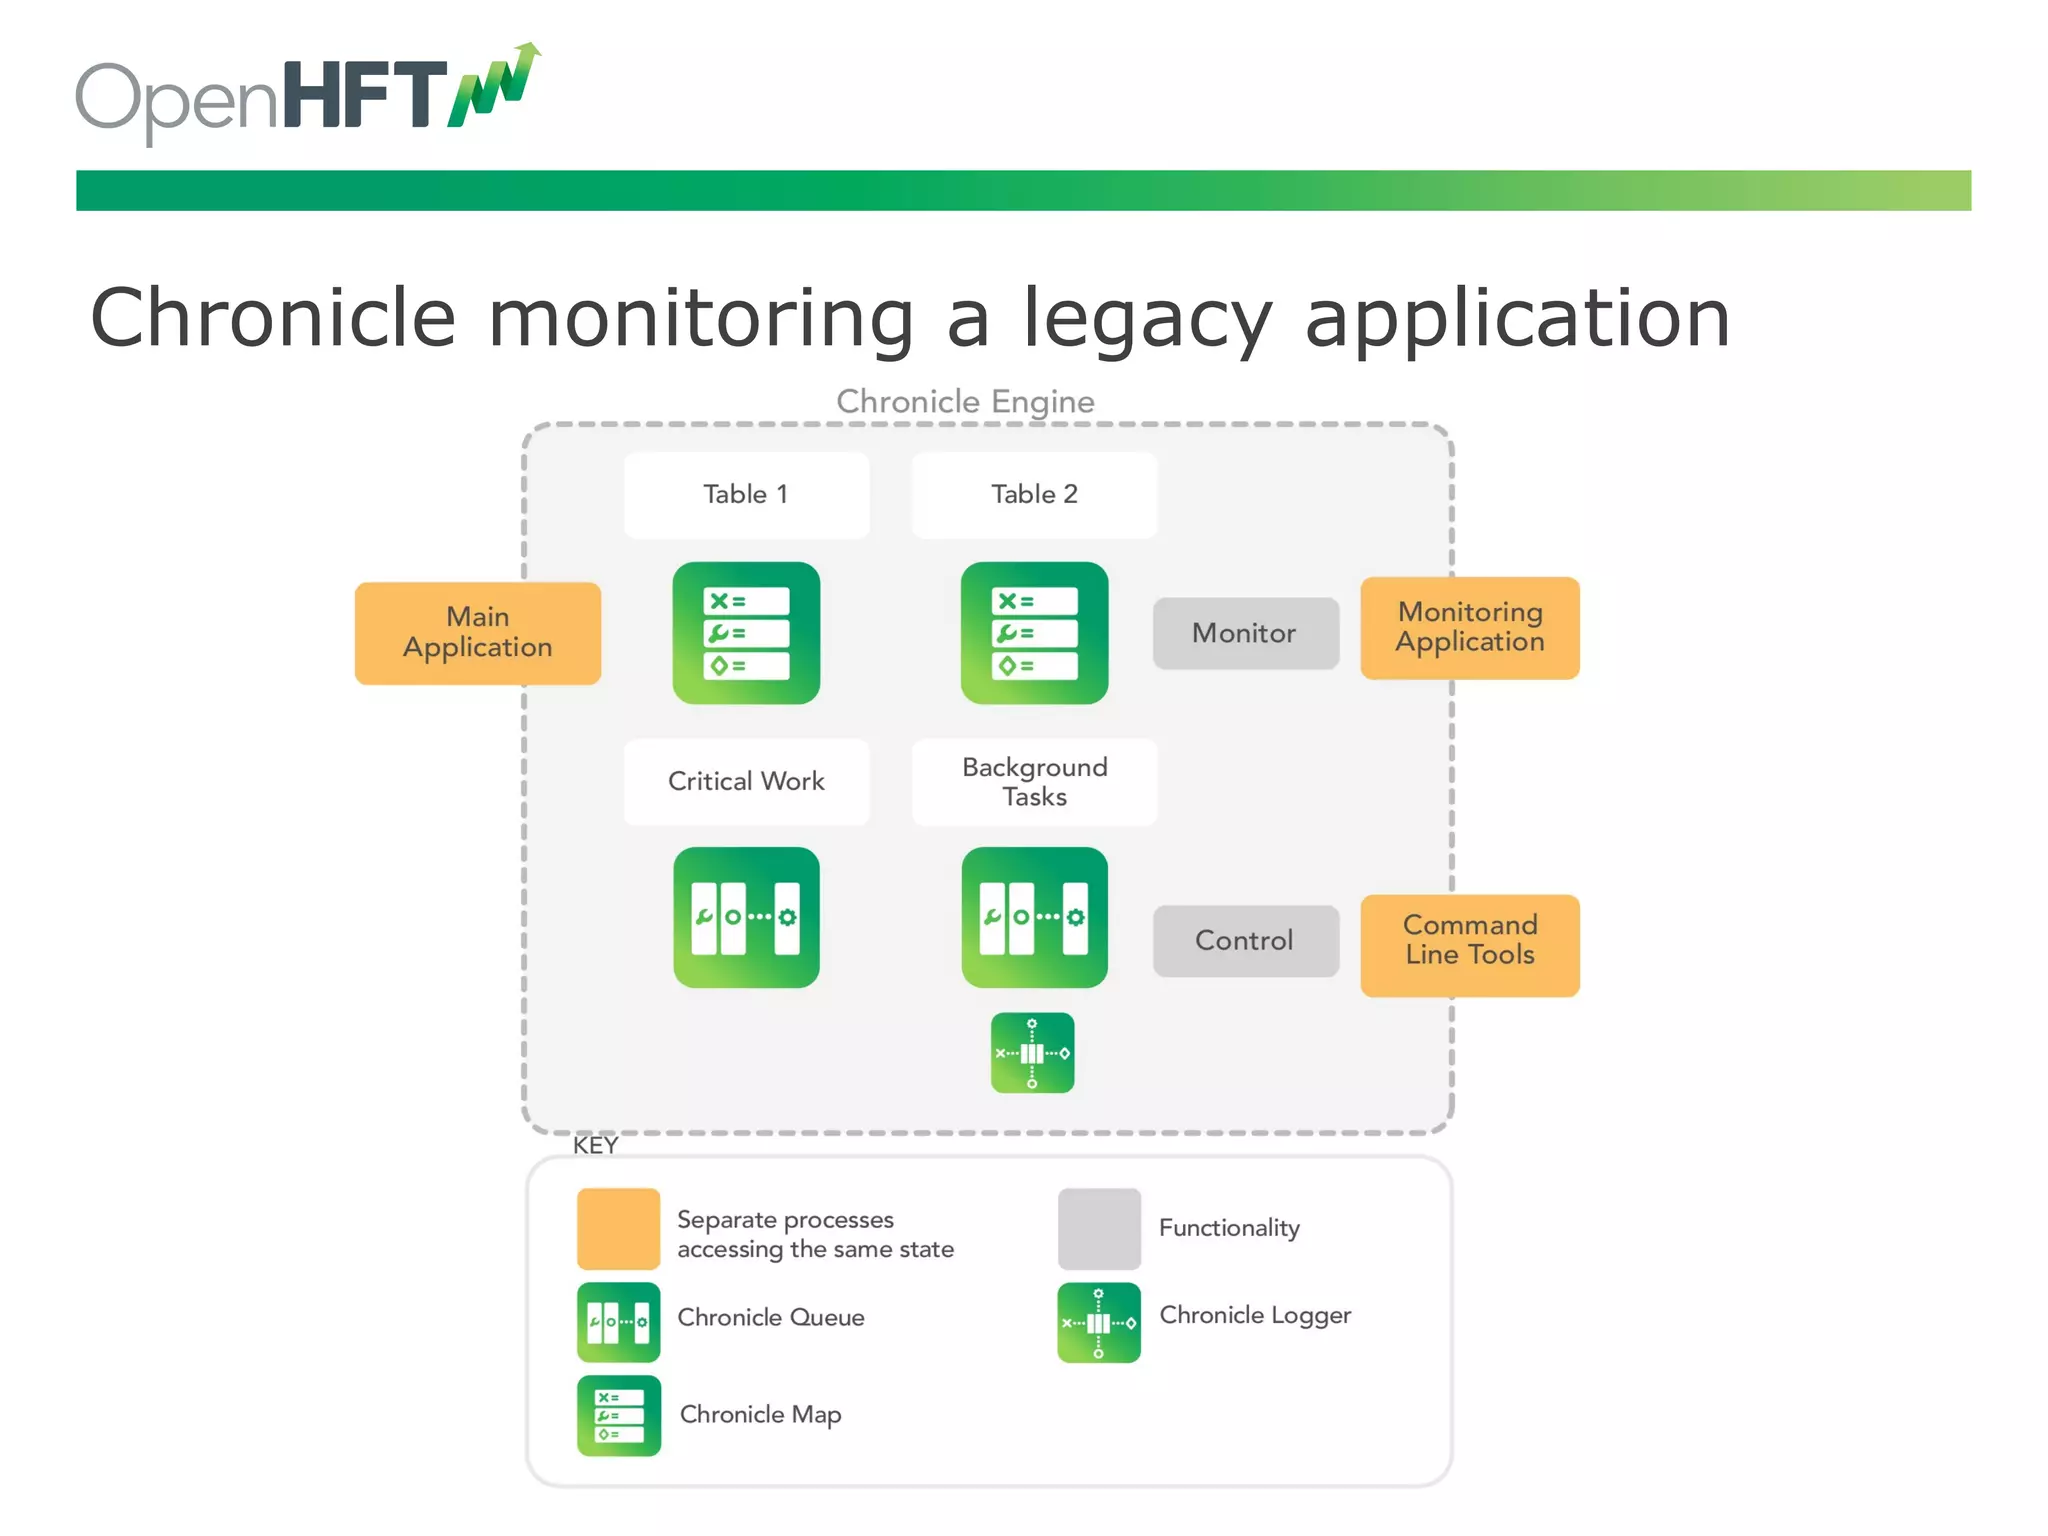
Chronicling applications in legacy settings, journaling and trading examples highlight practical uses.
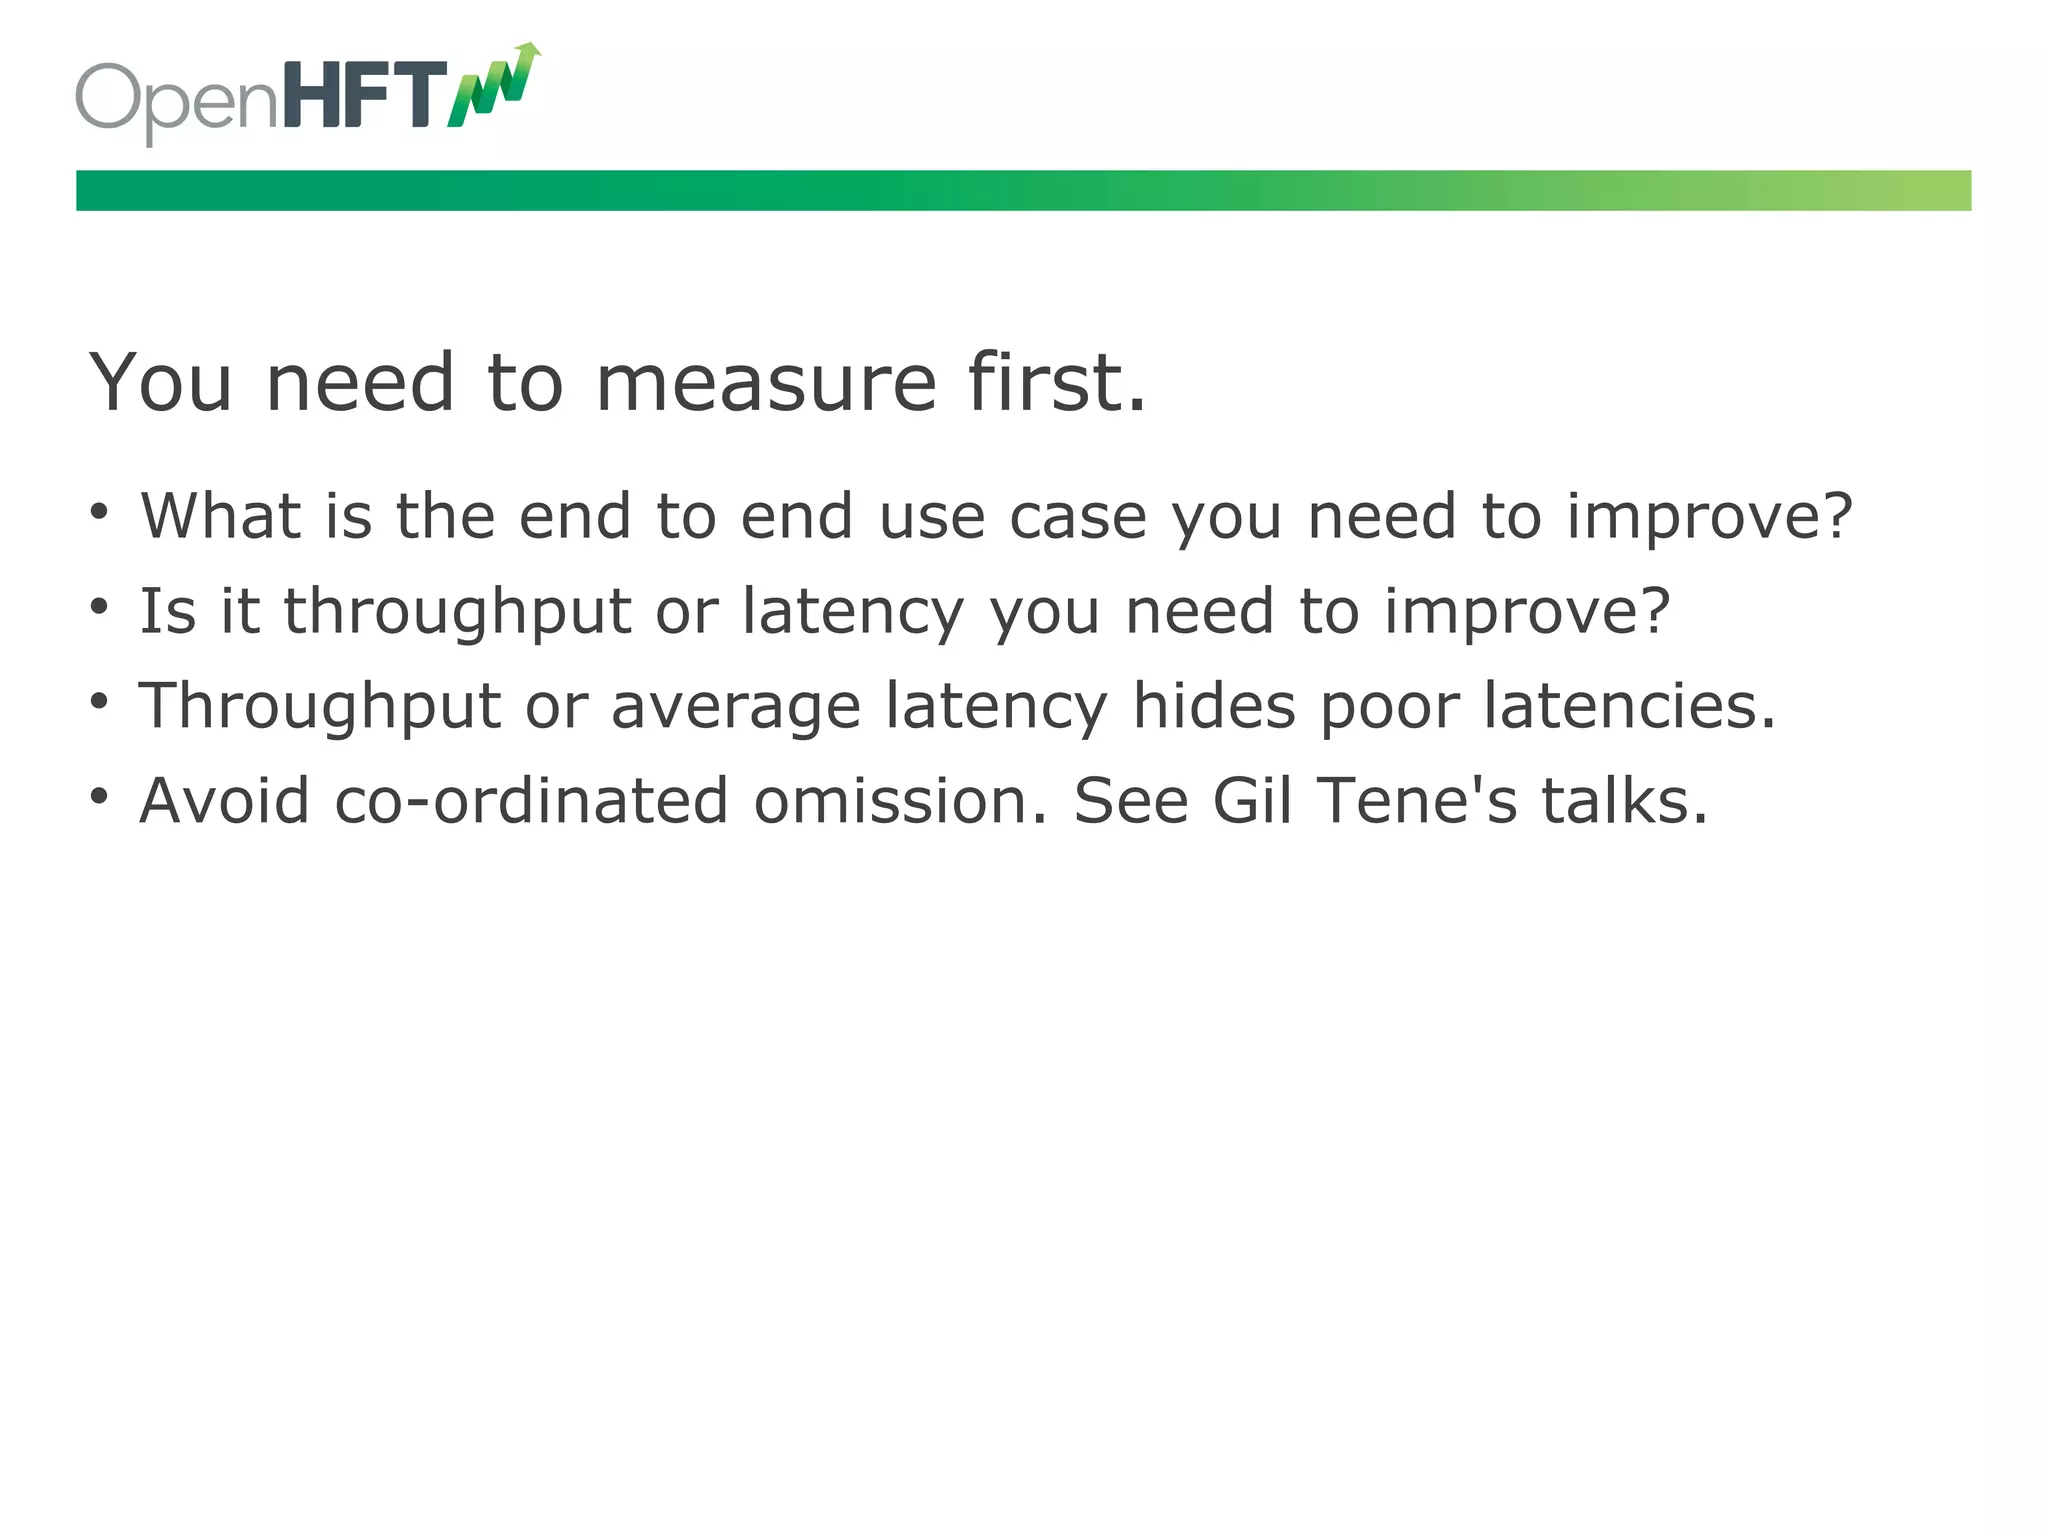
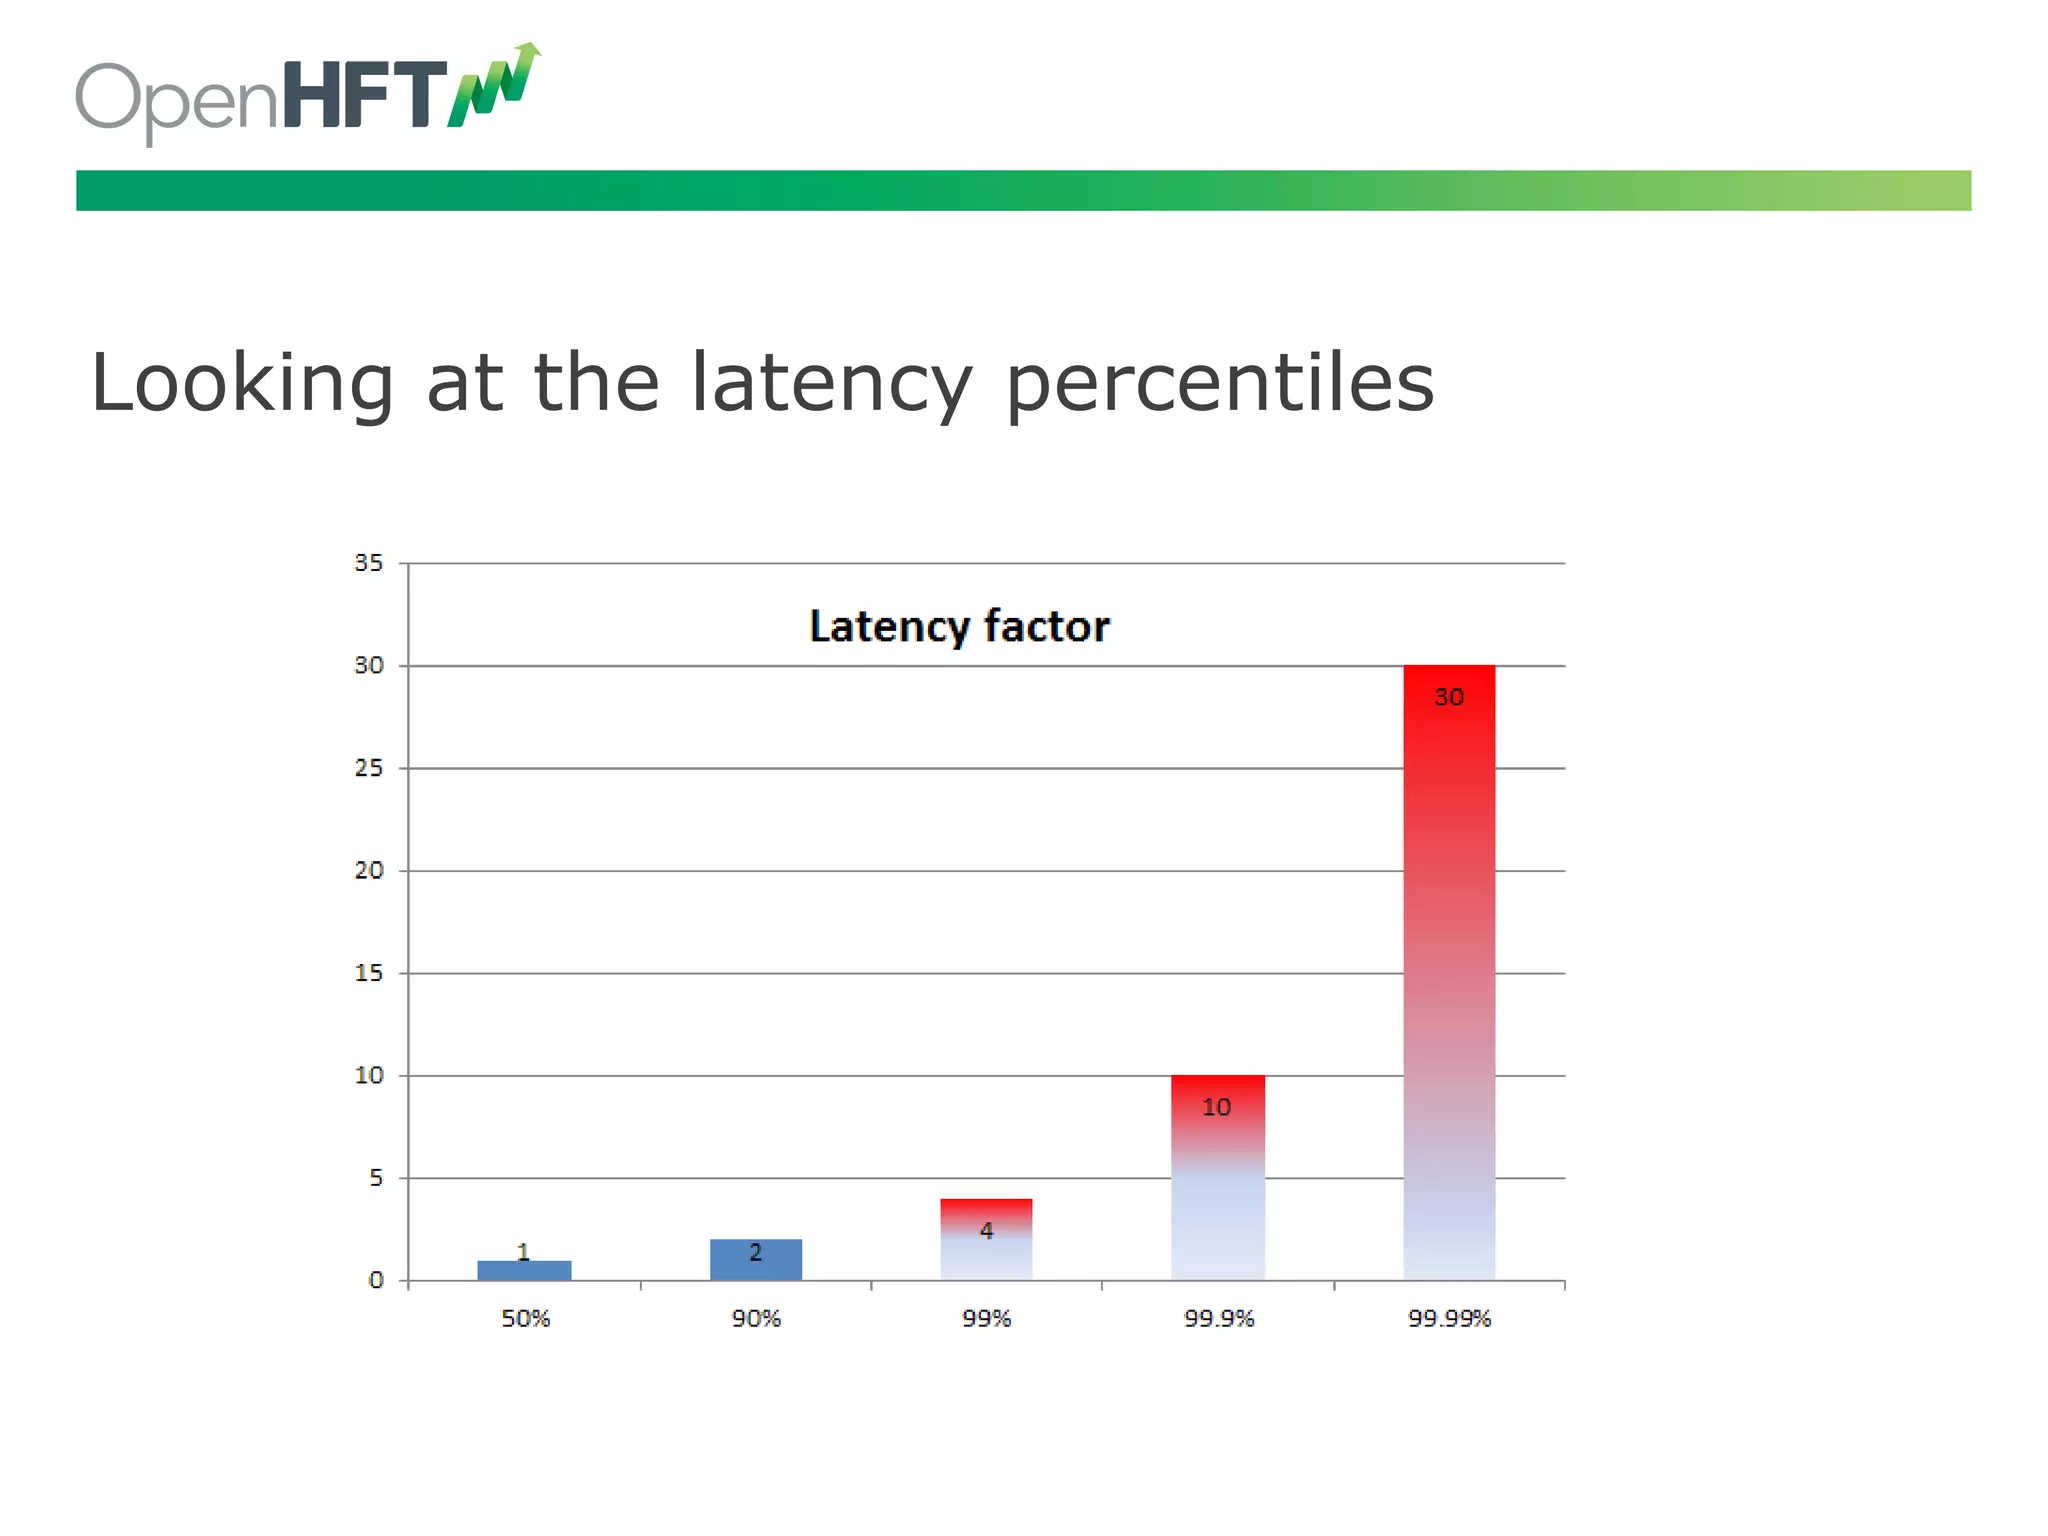
Begin with measuring latency vs throughput, understanding percentiles, and addressing identified issues.
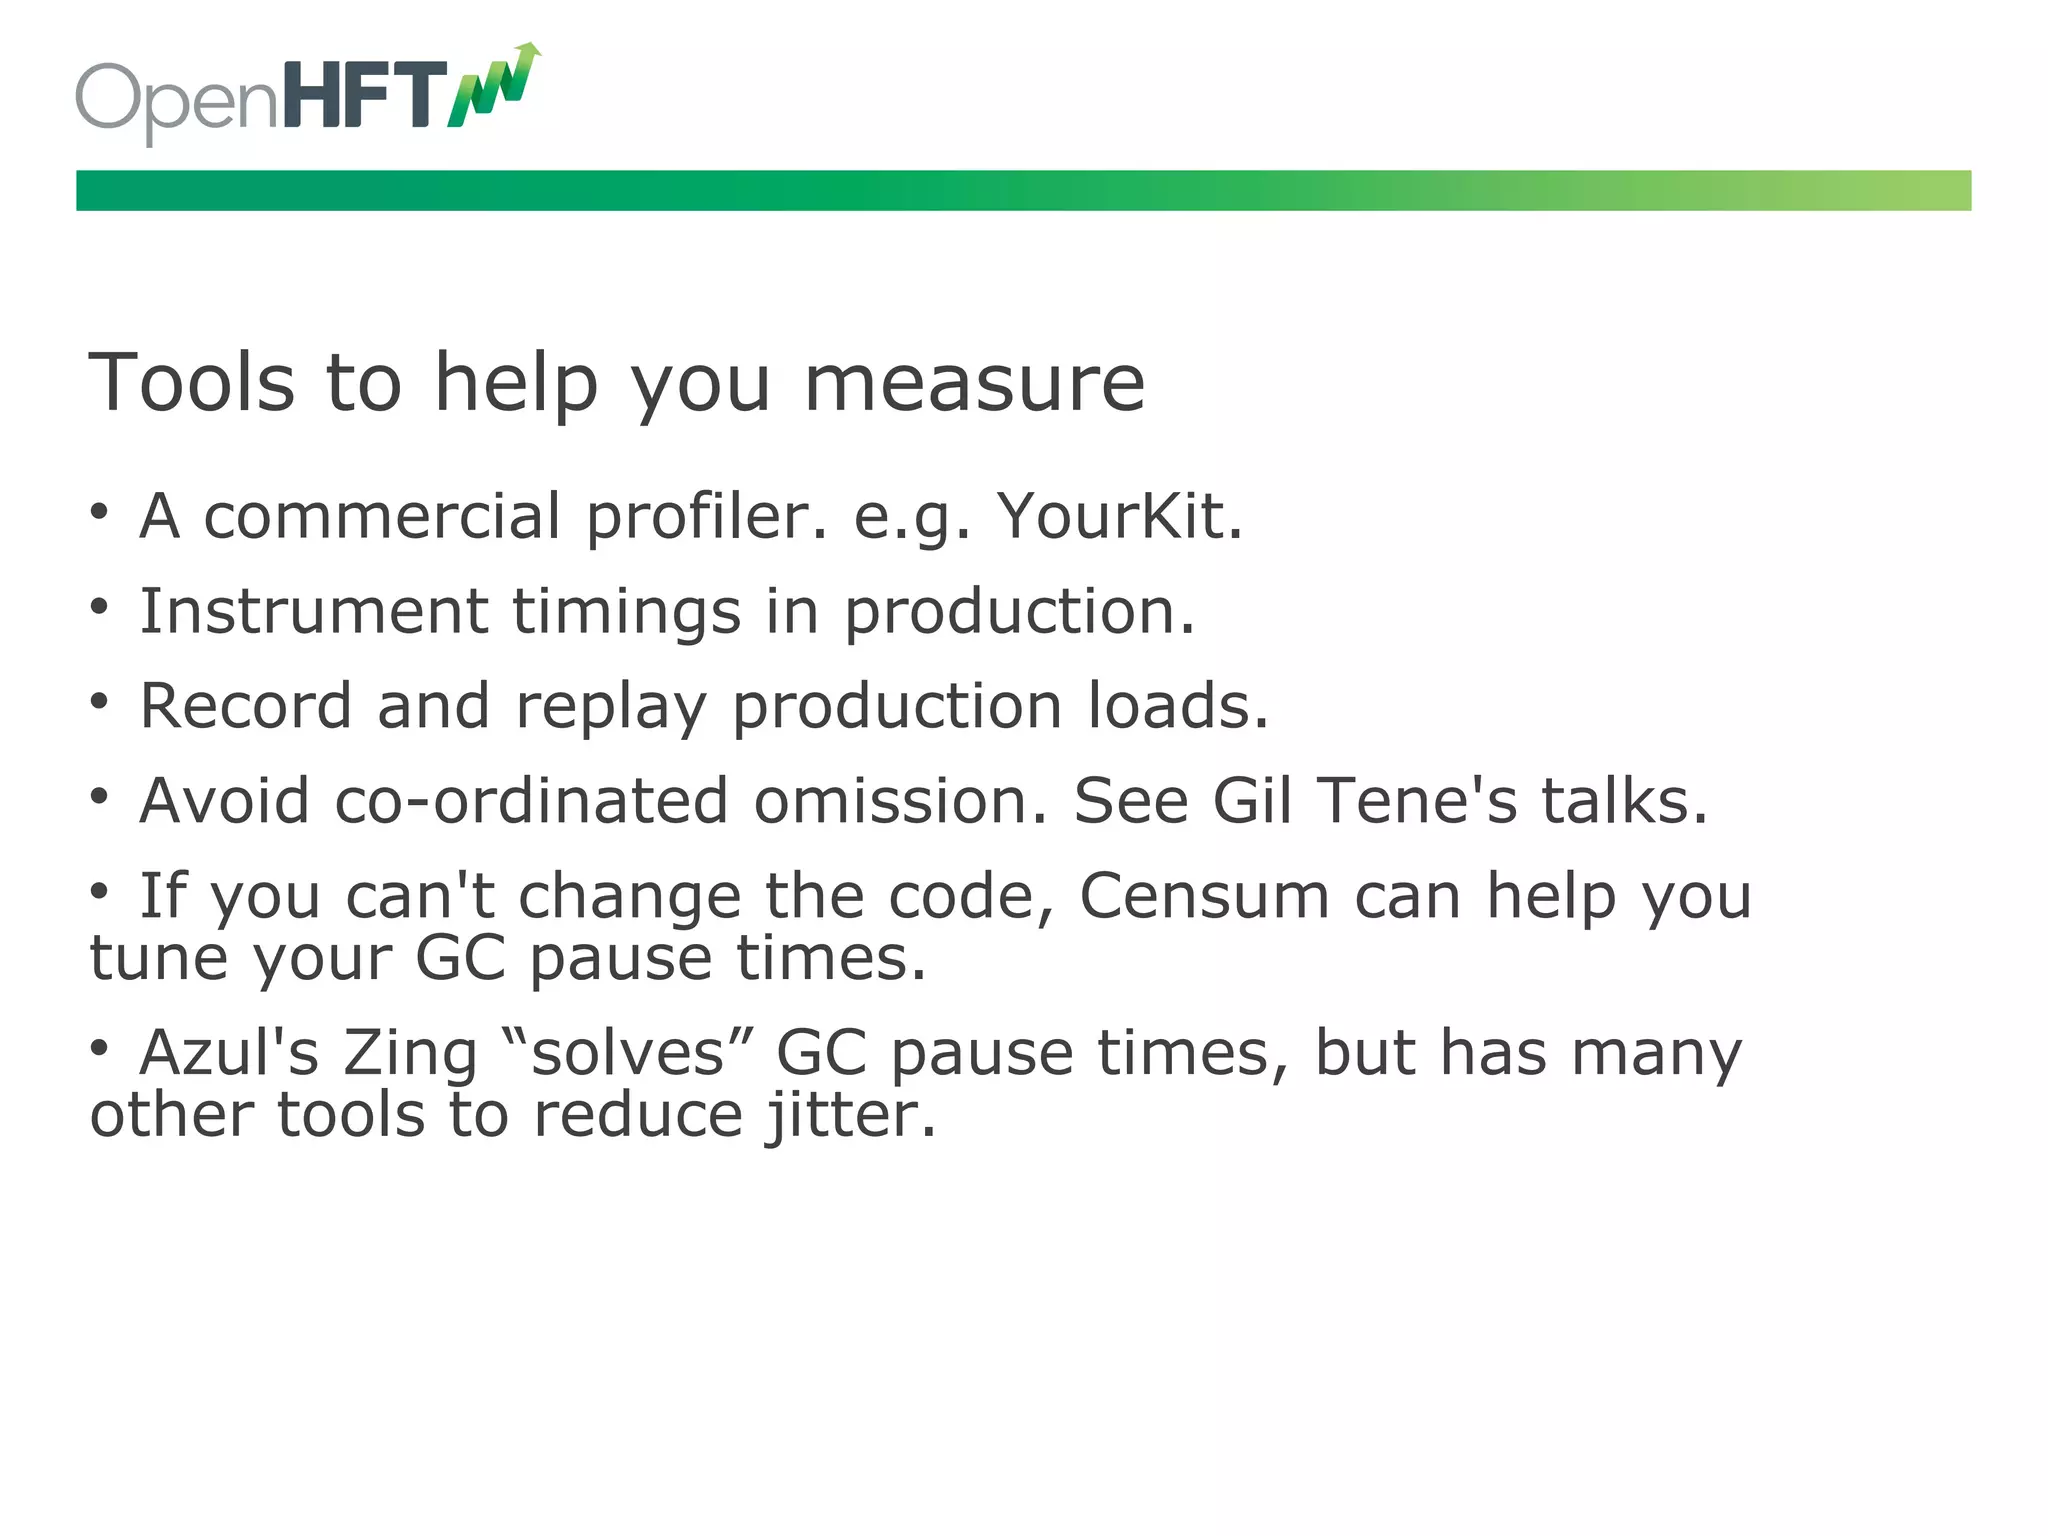
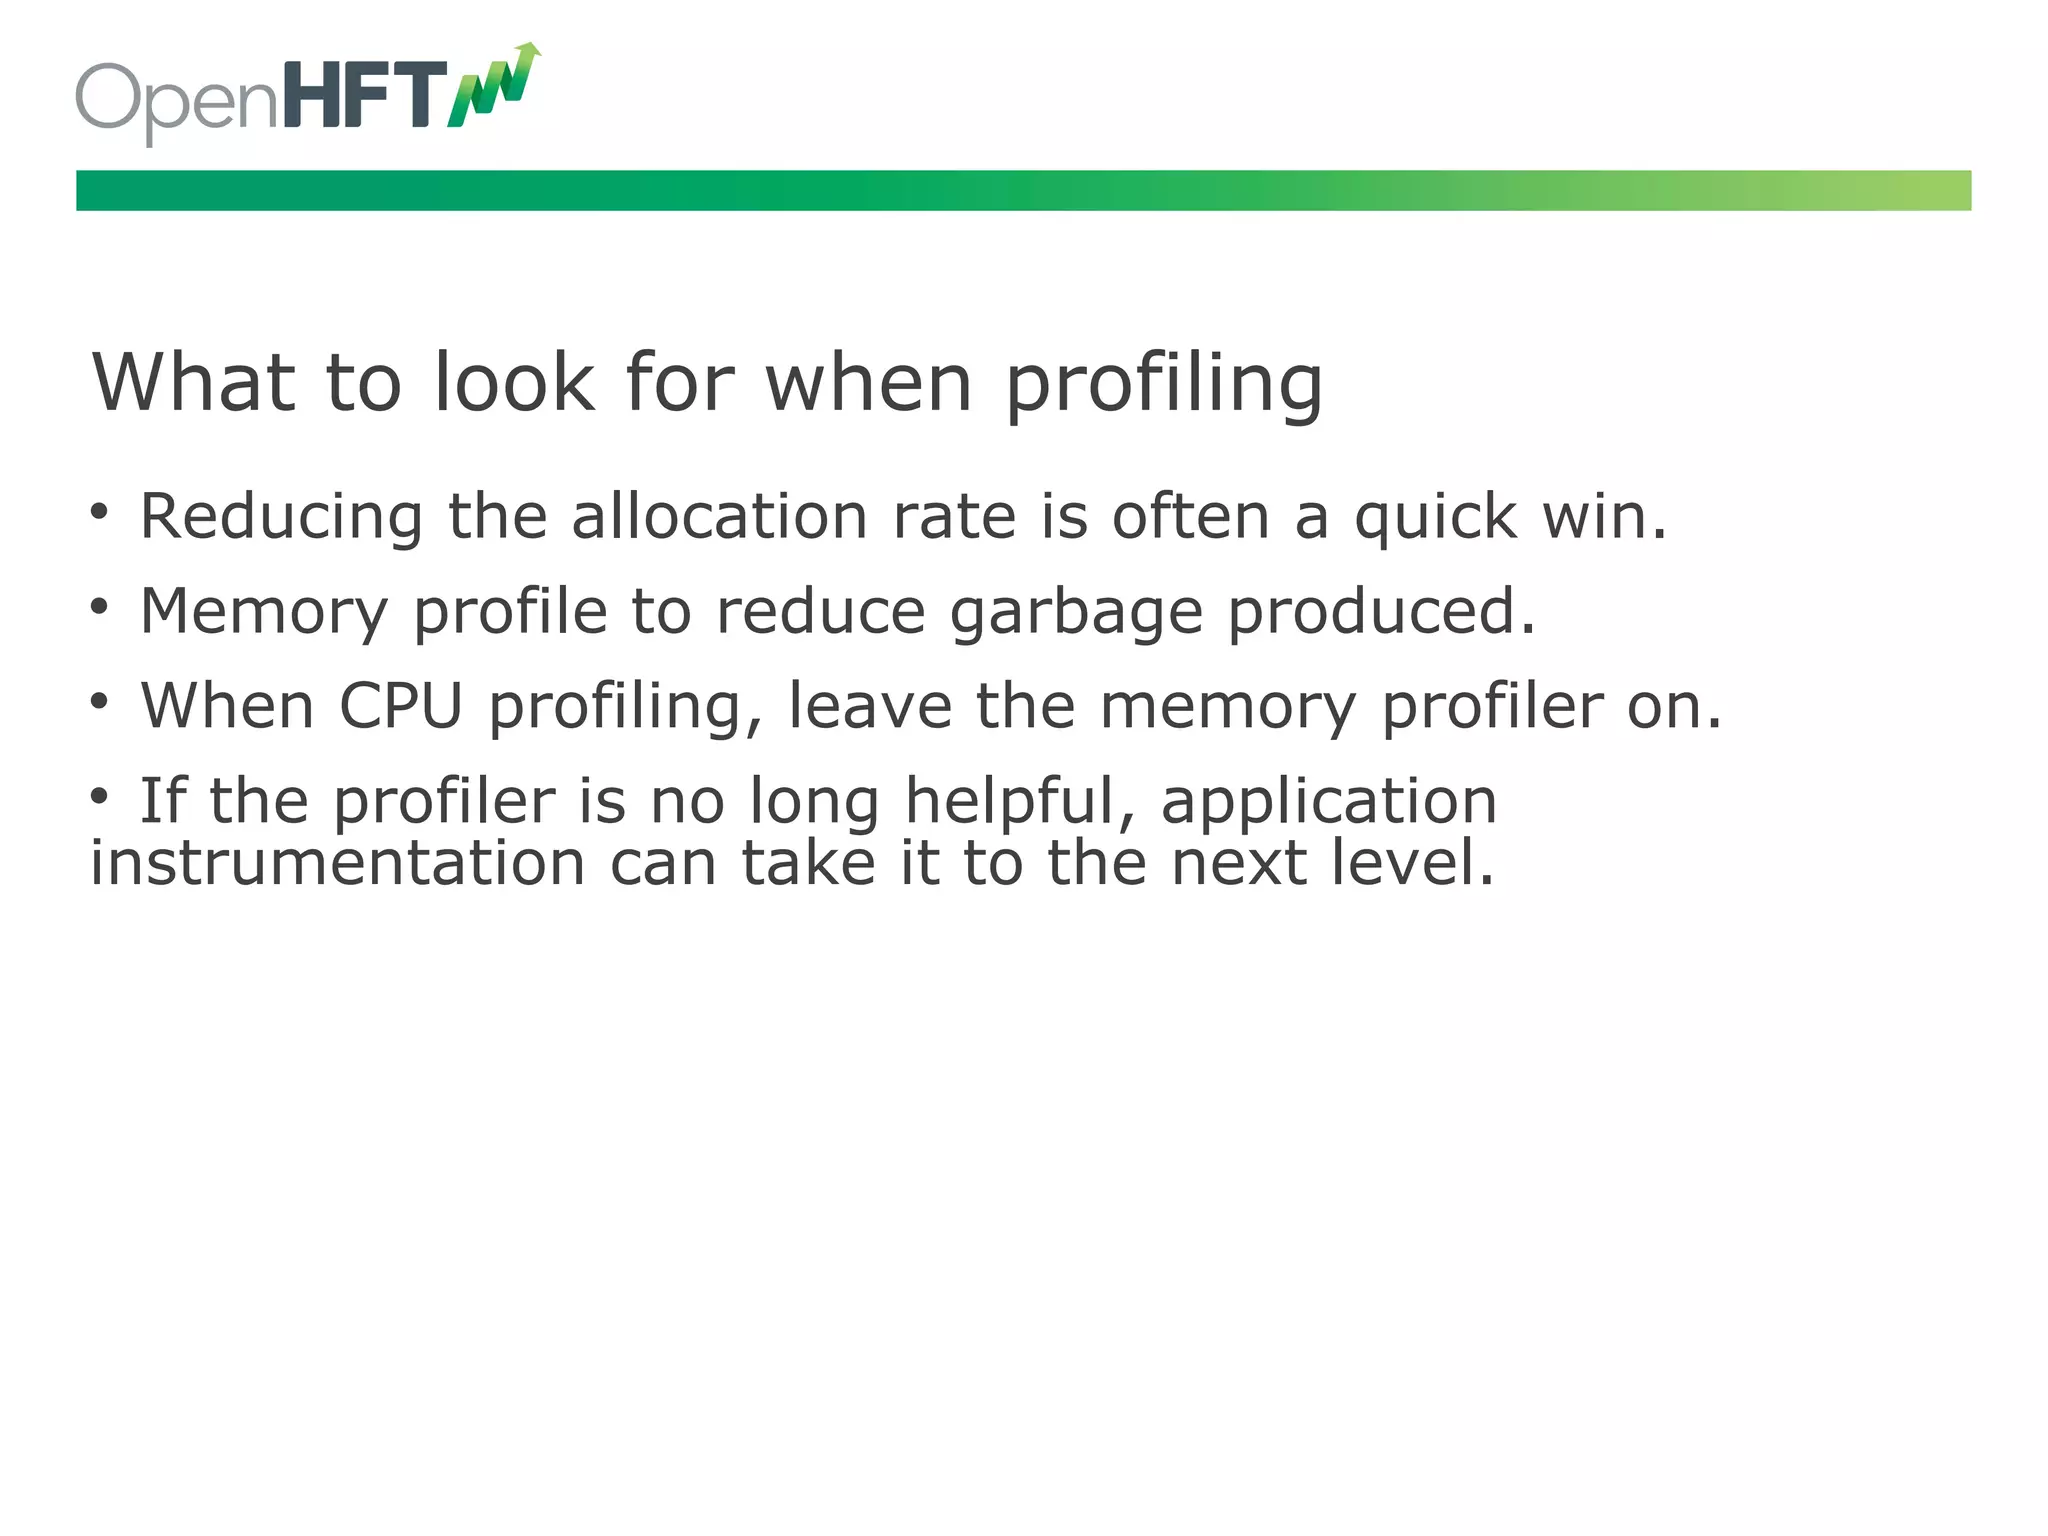
Tools and methods including profilers and GC tuning assist in diagnosing latency and garbage metrics.
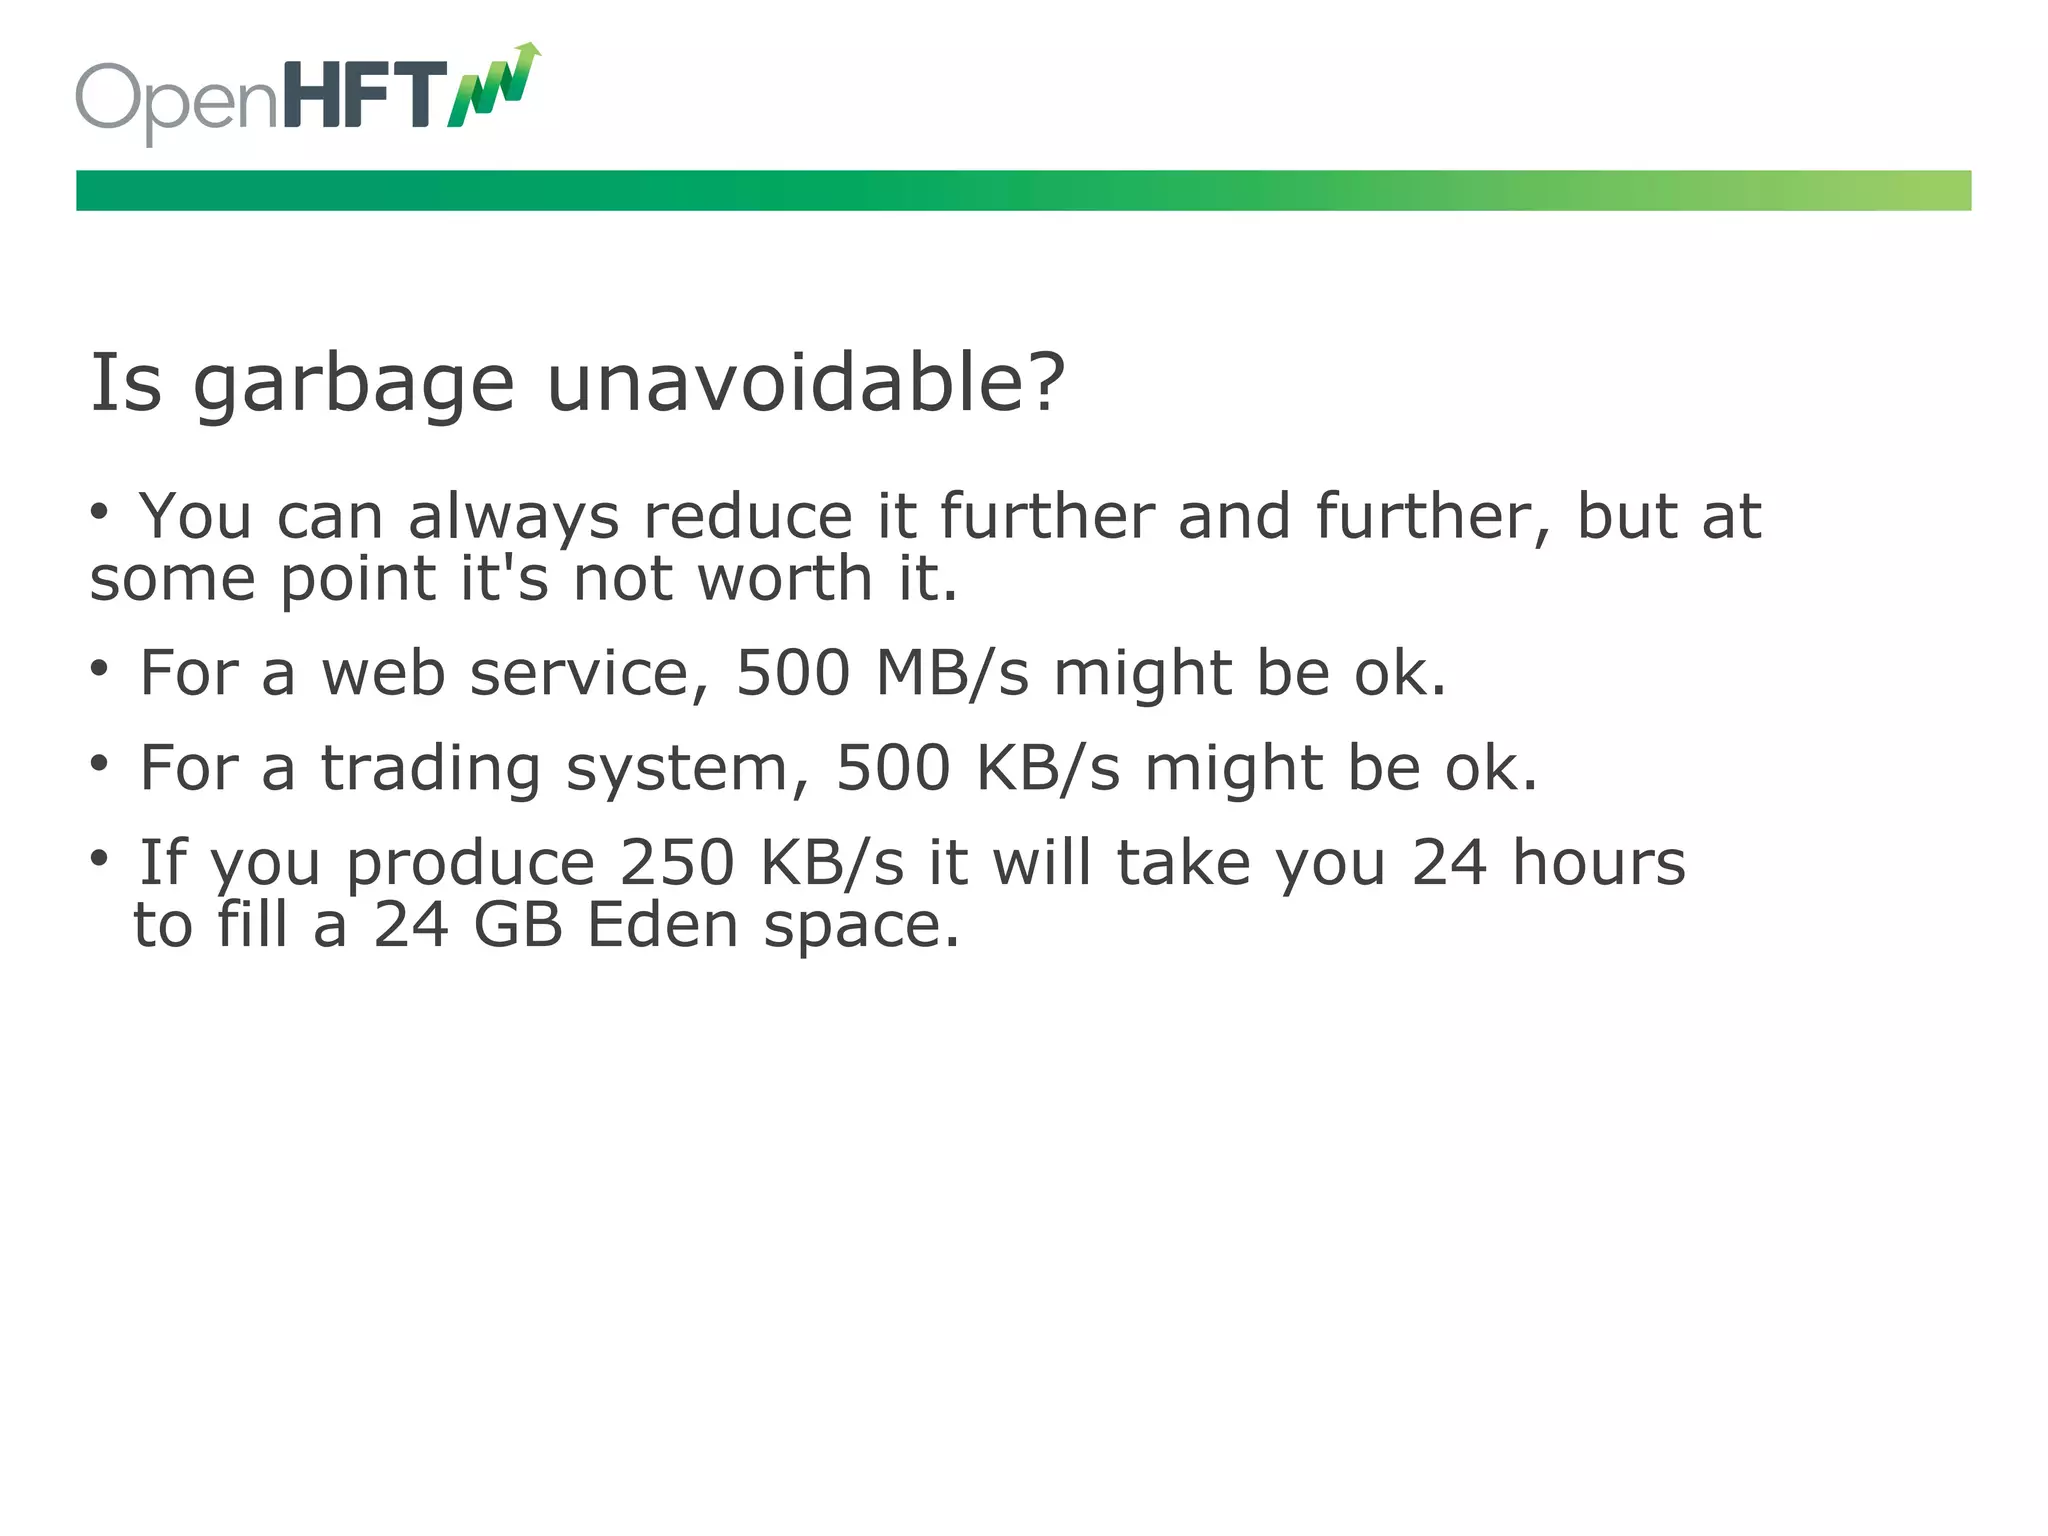
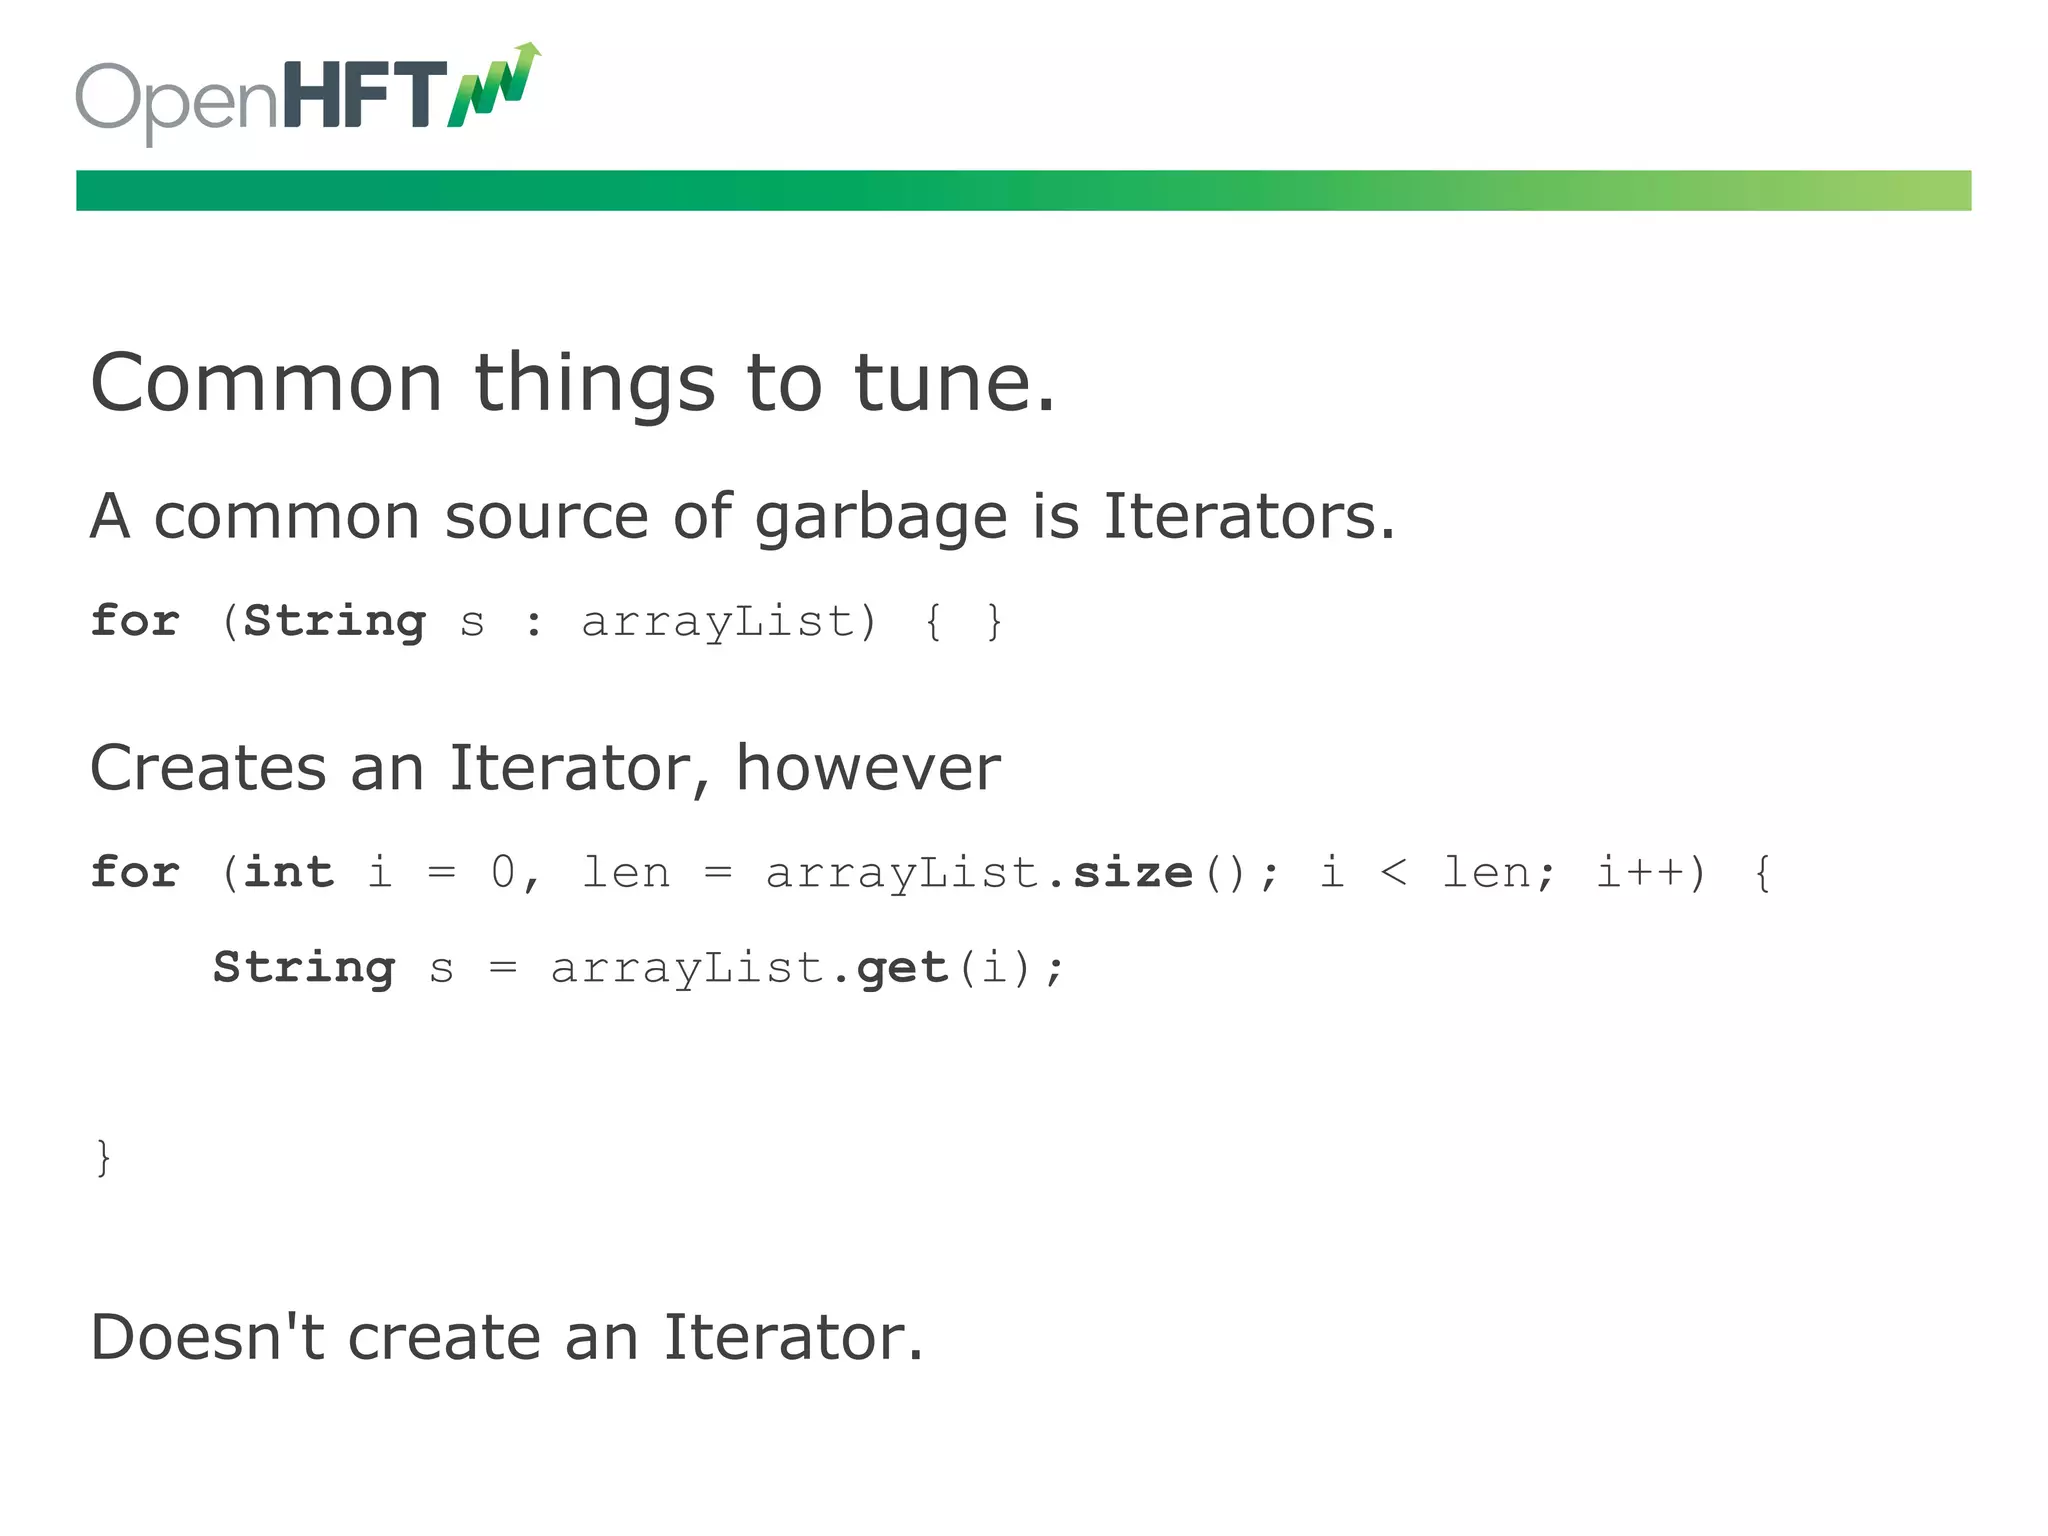
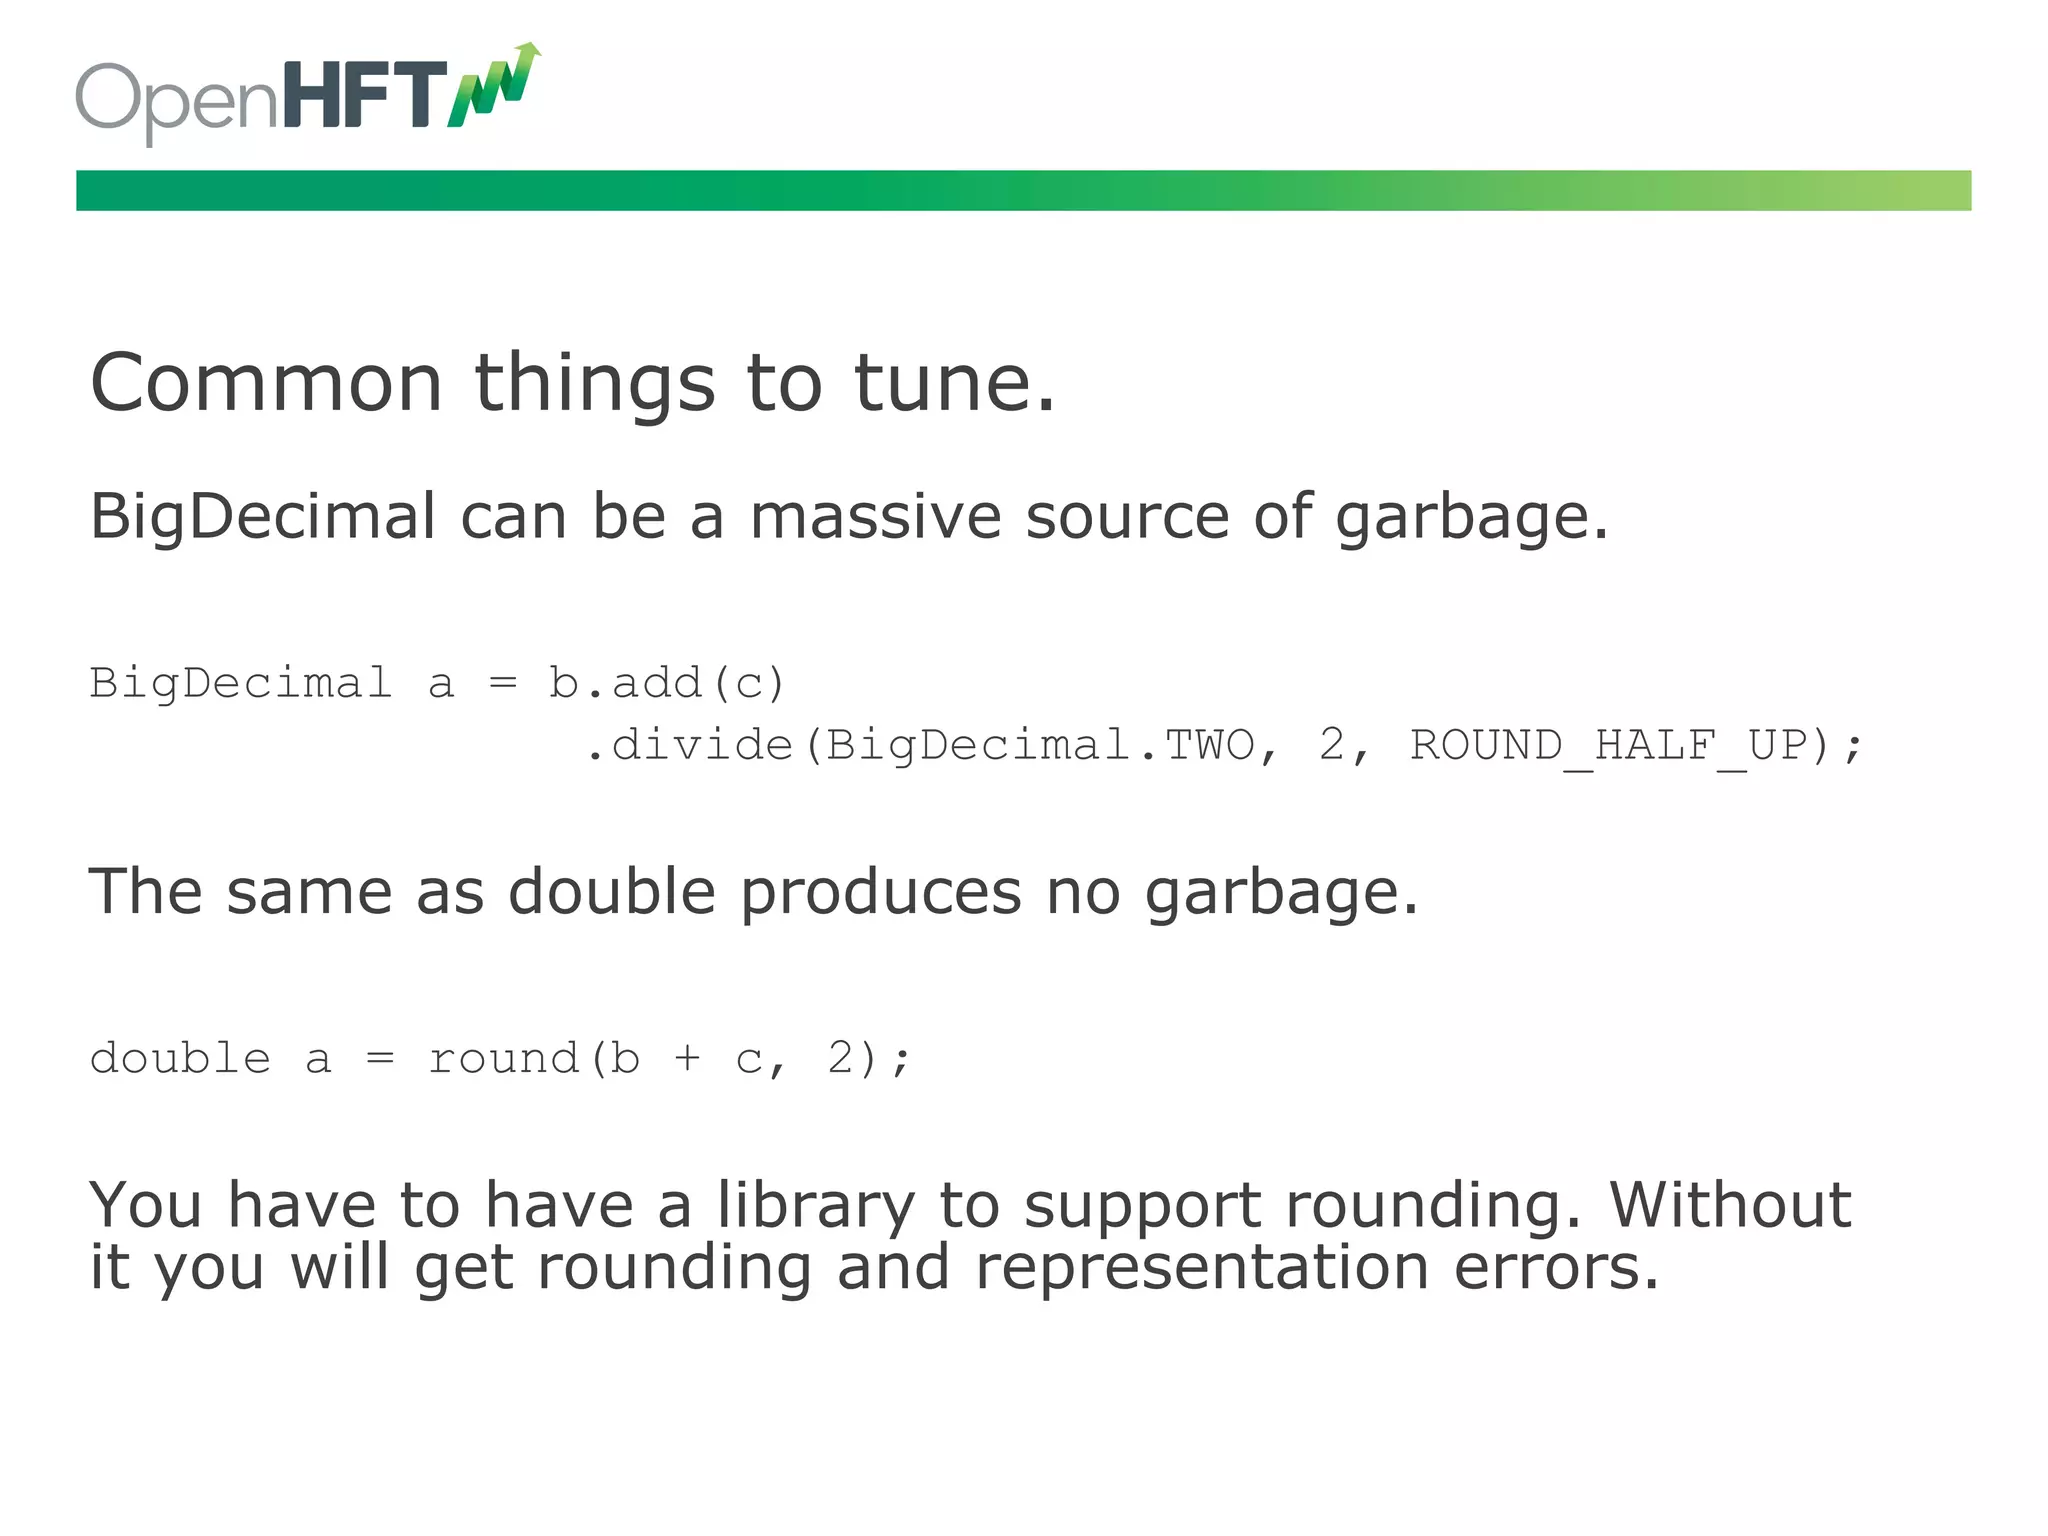
Strategies to minimize garbage collection including tuning iterators and using primitives to enhance performance.
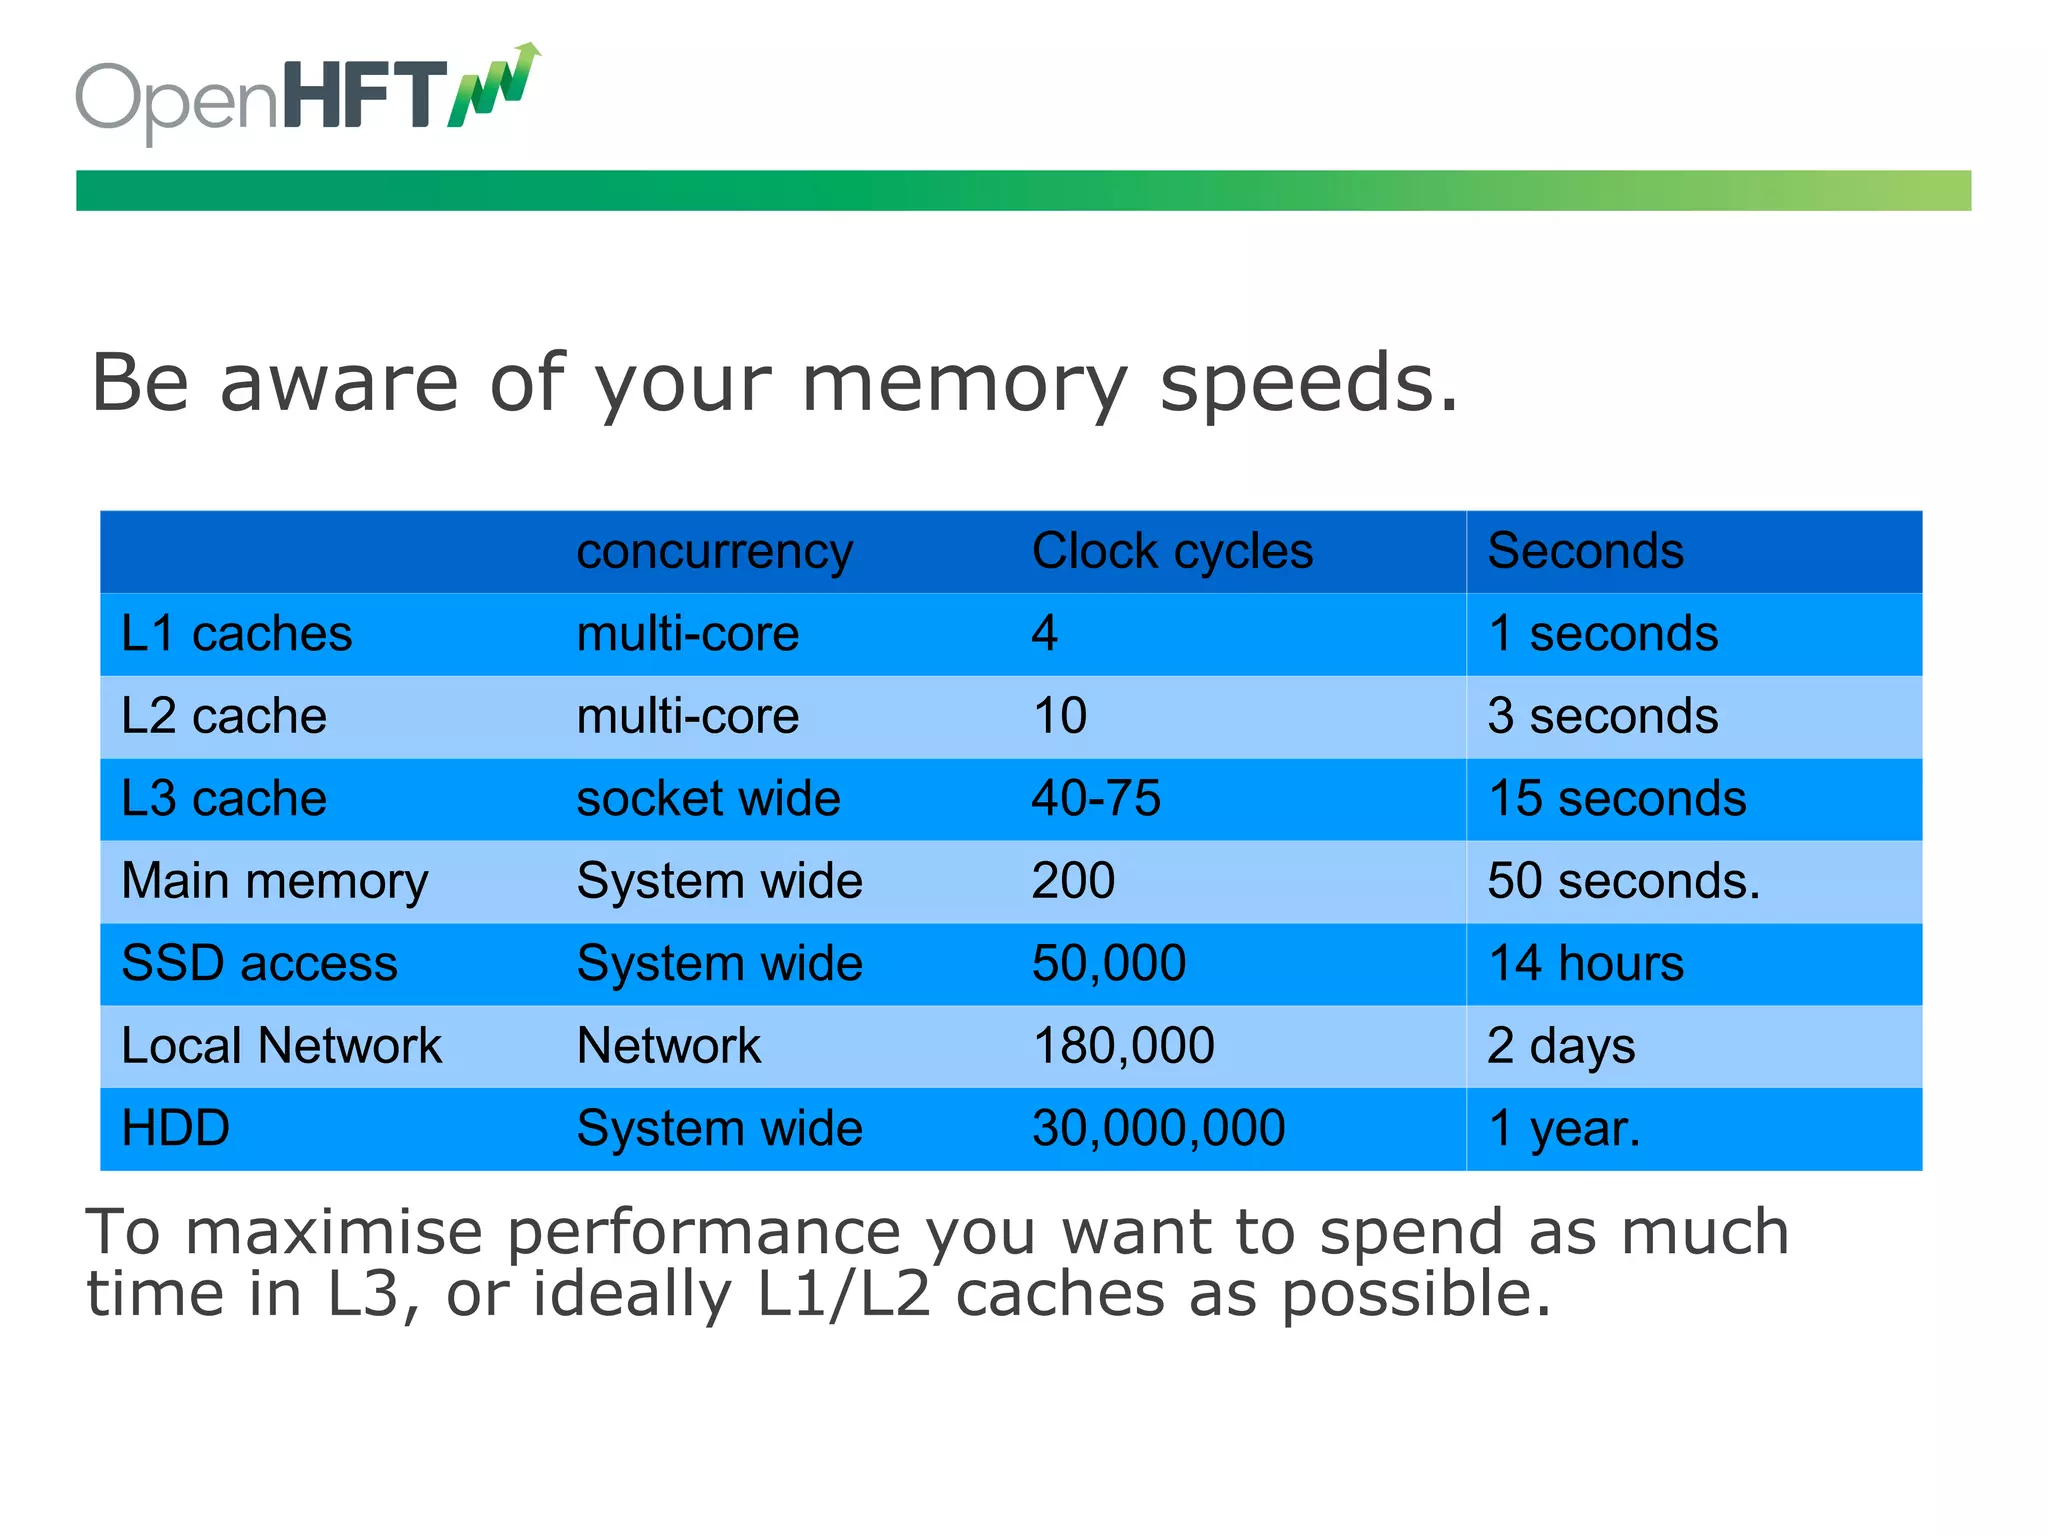
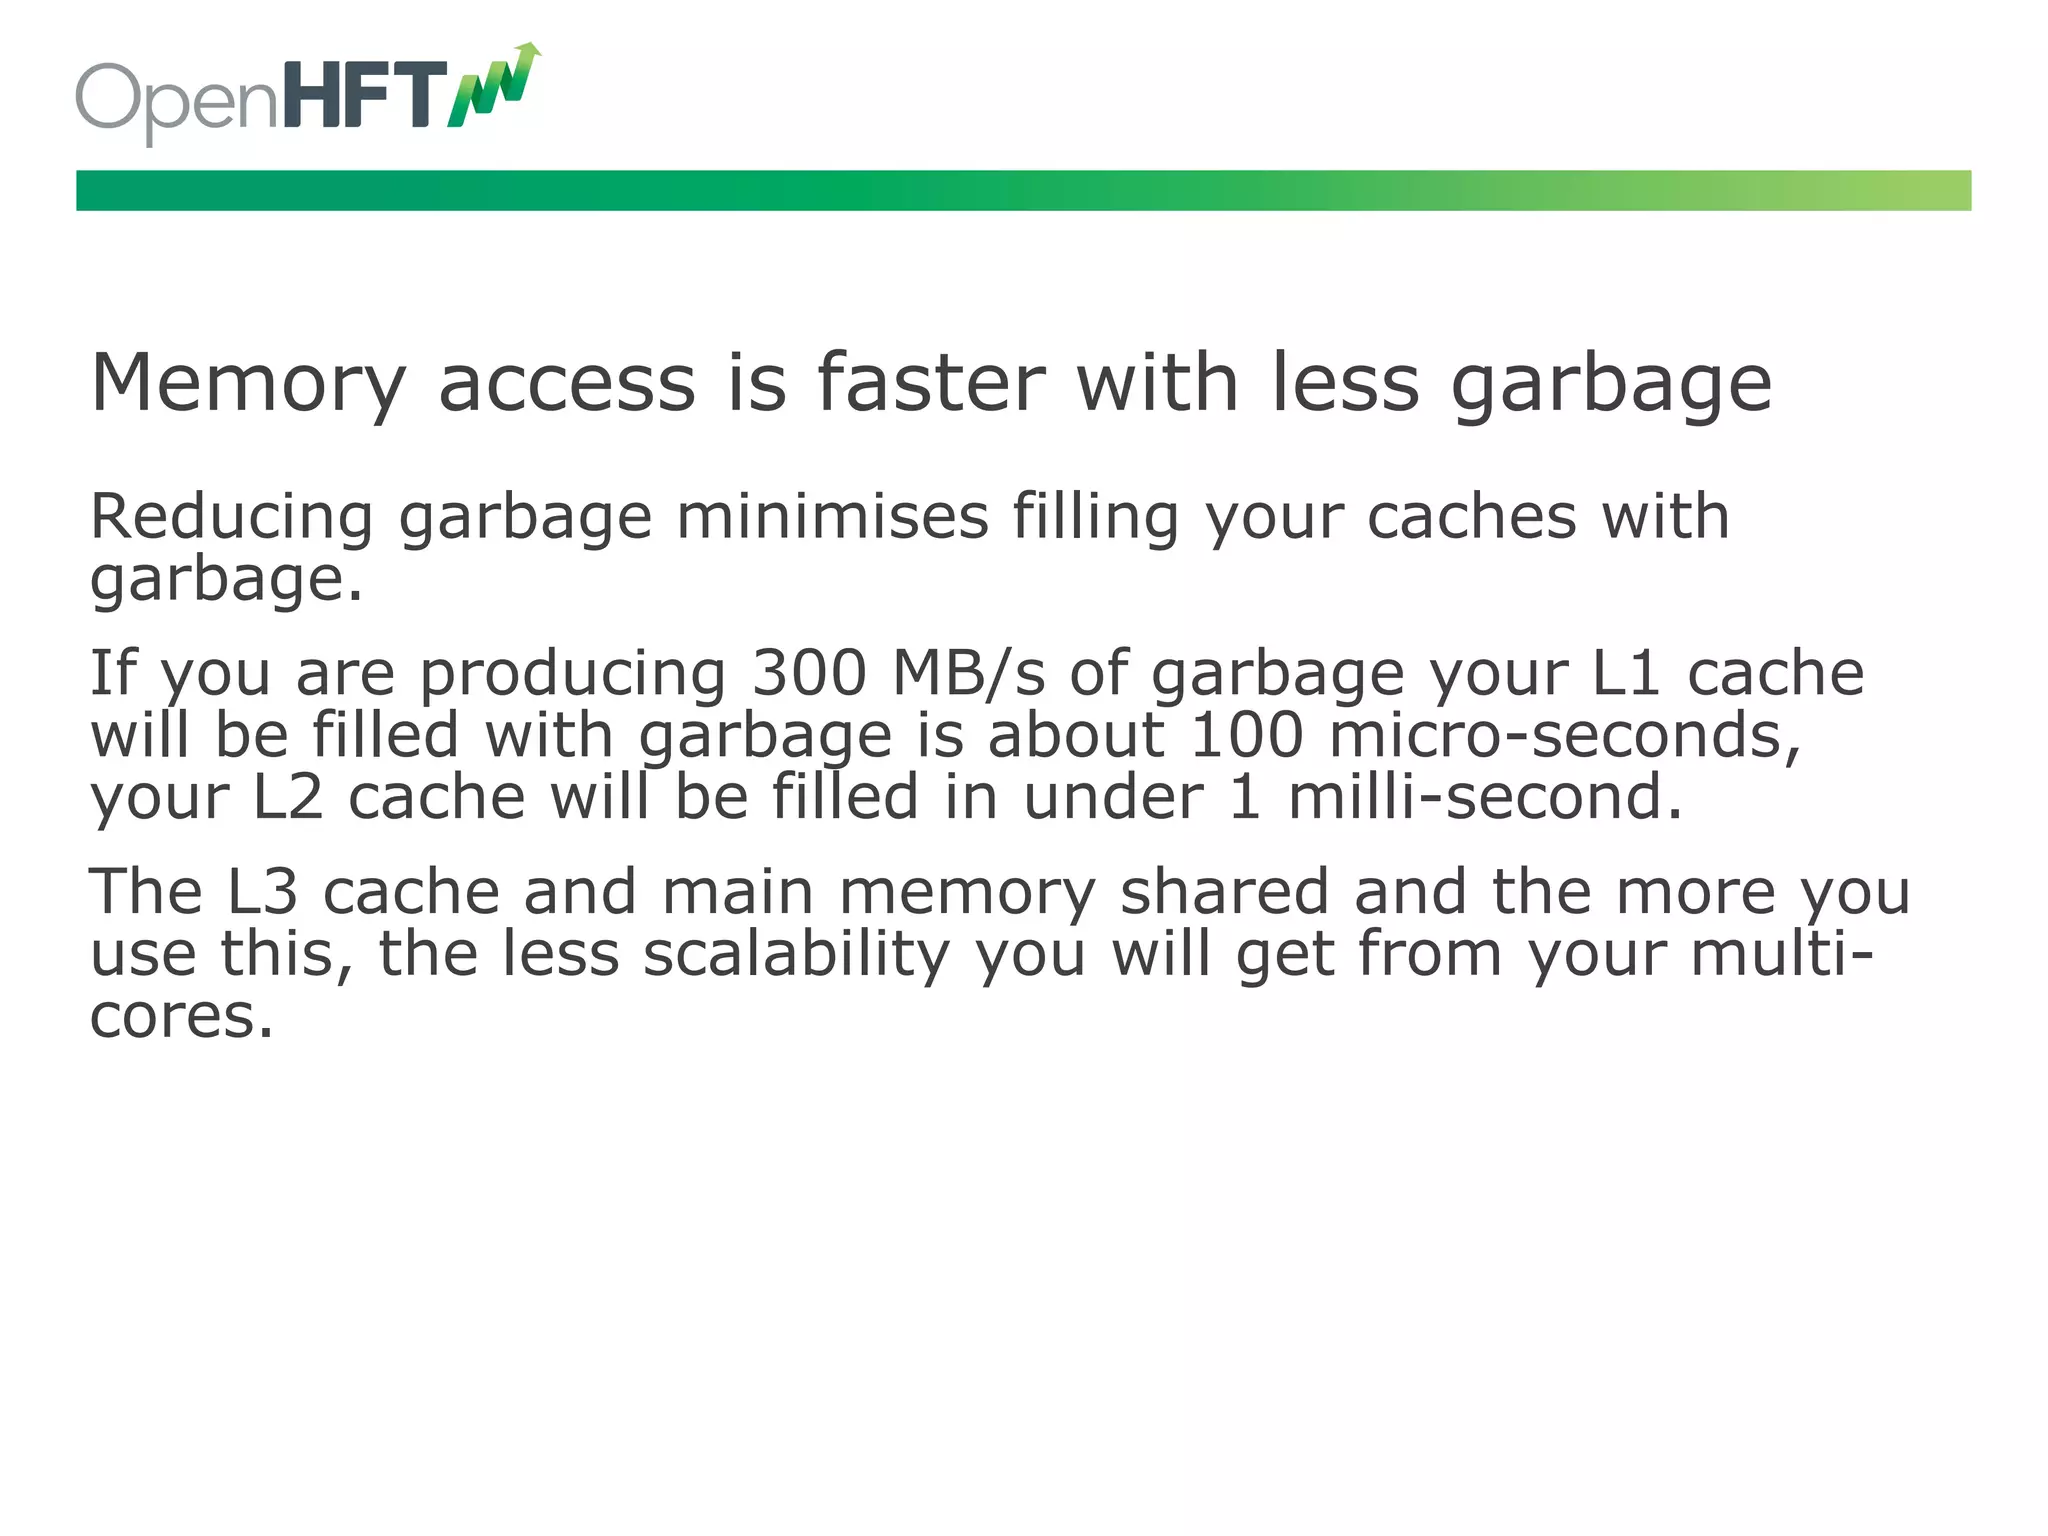
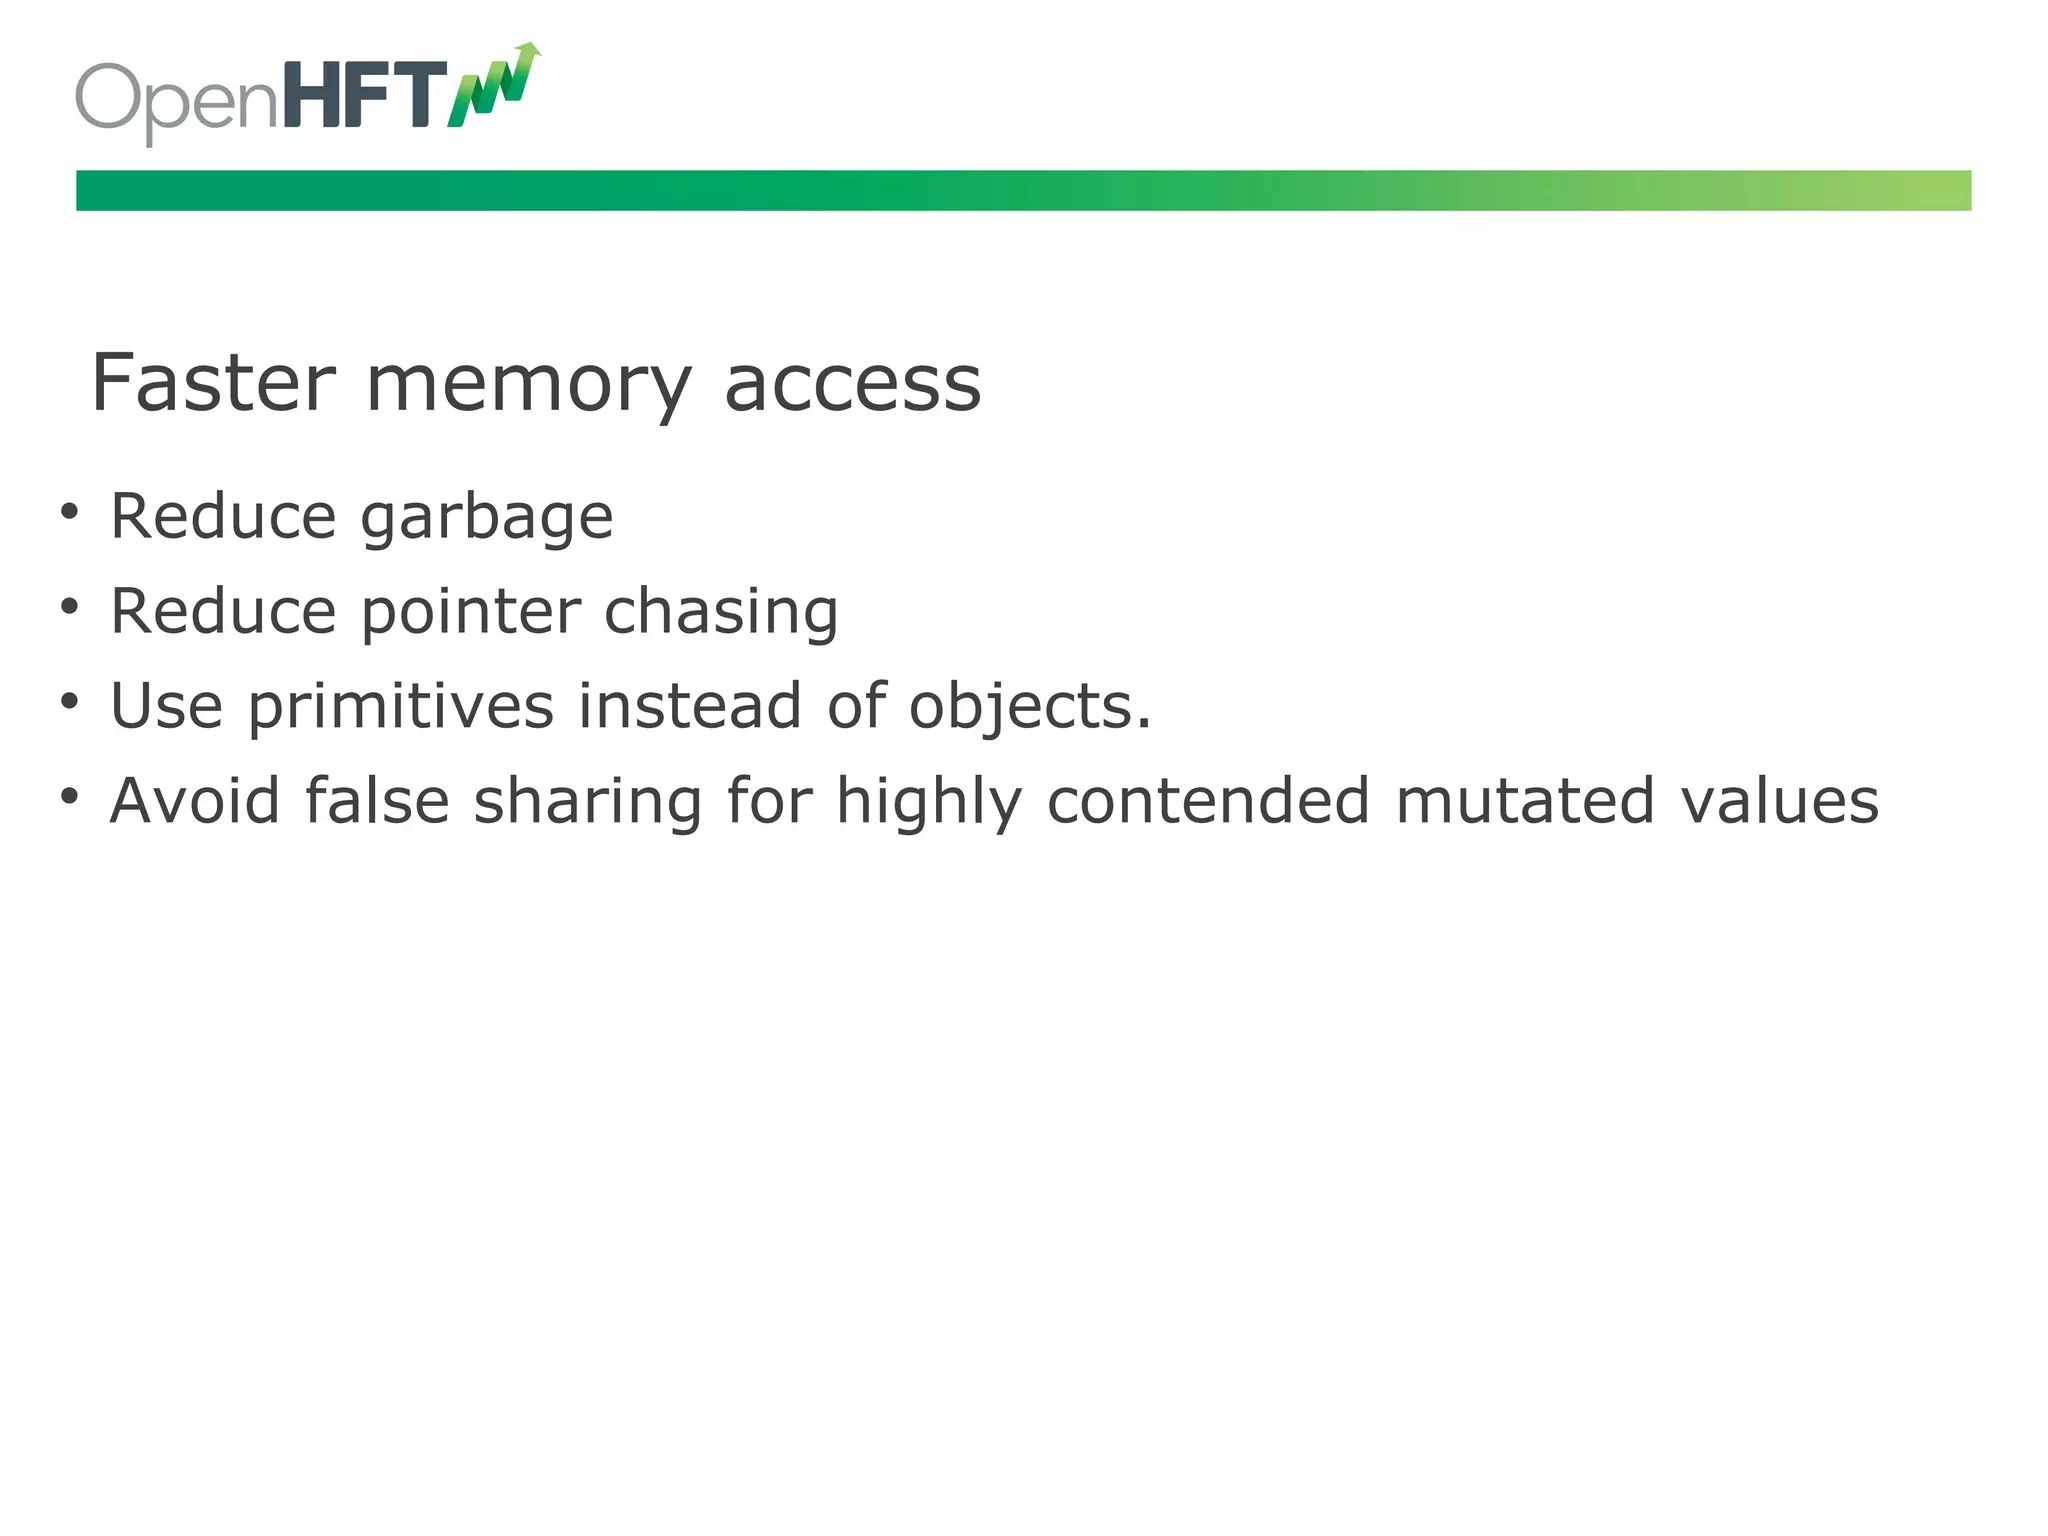
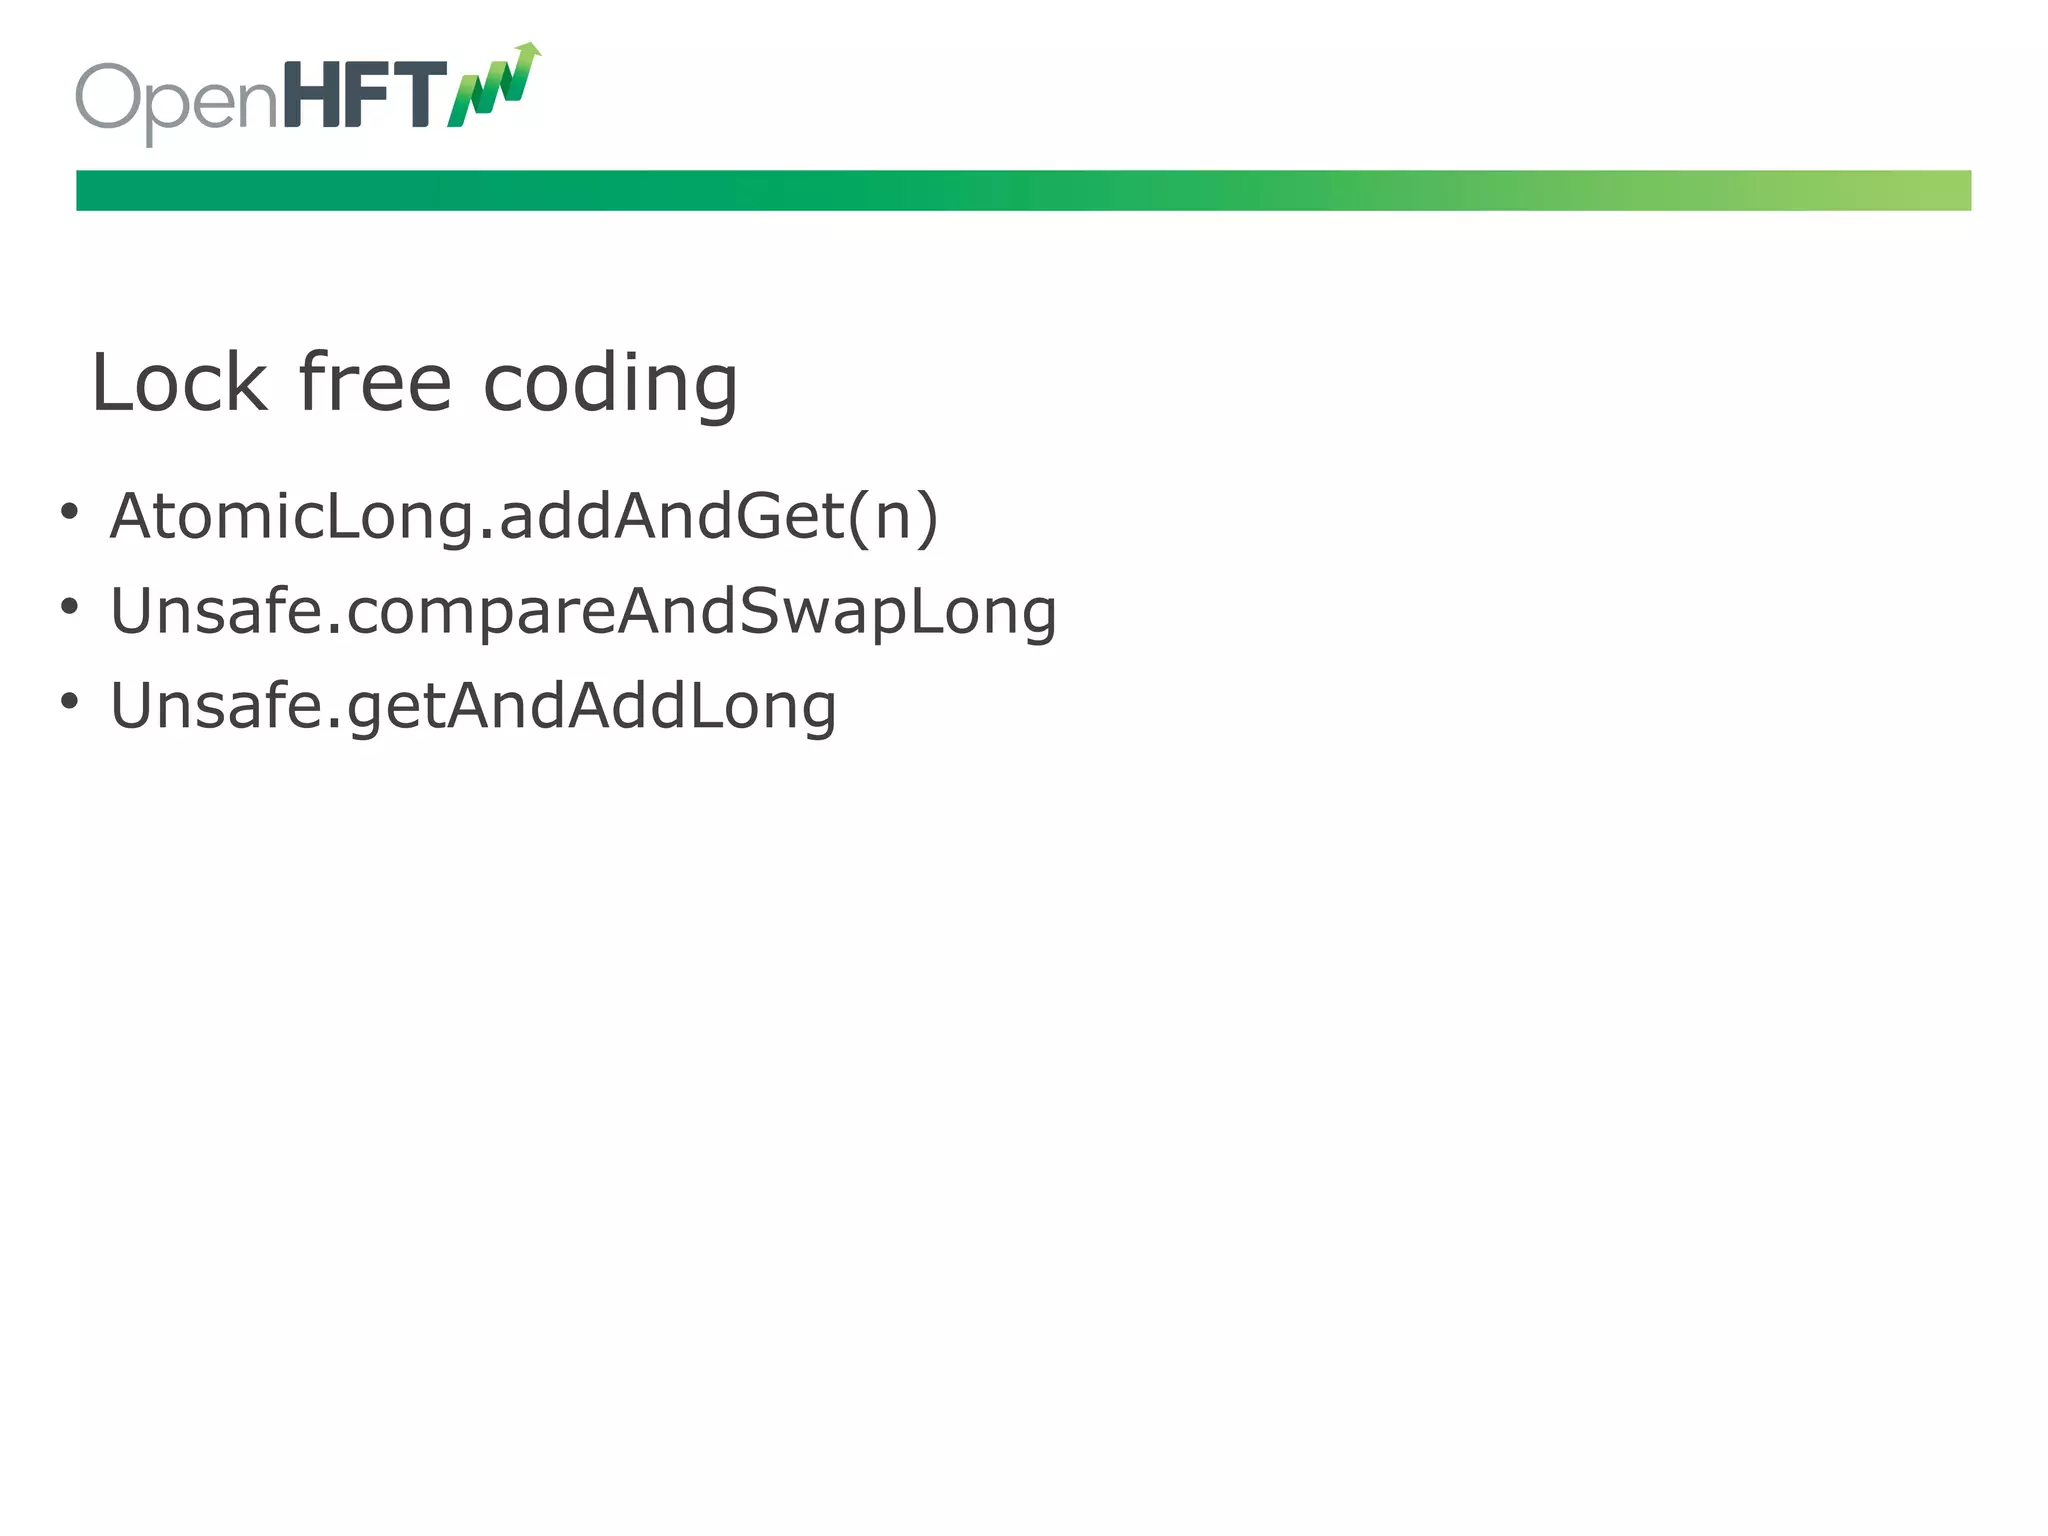
Understanding memory speeds, cache efficiency, and techniques like lock-free coding to optimize access.
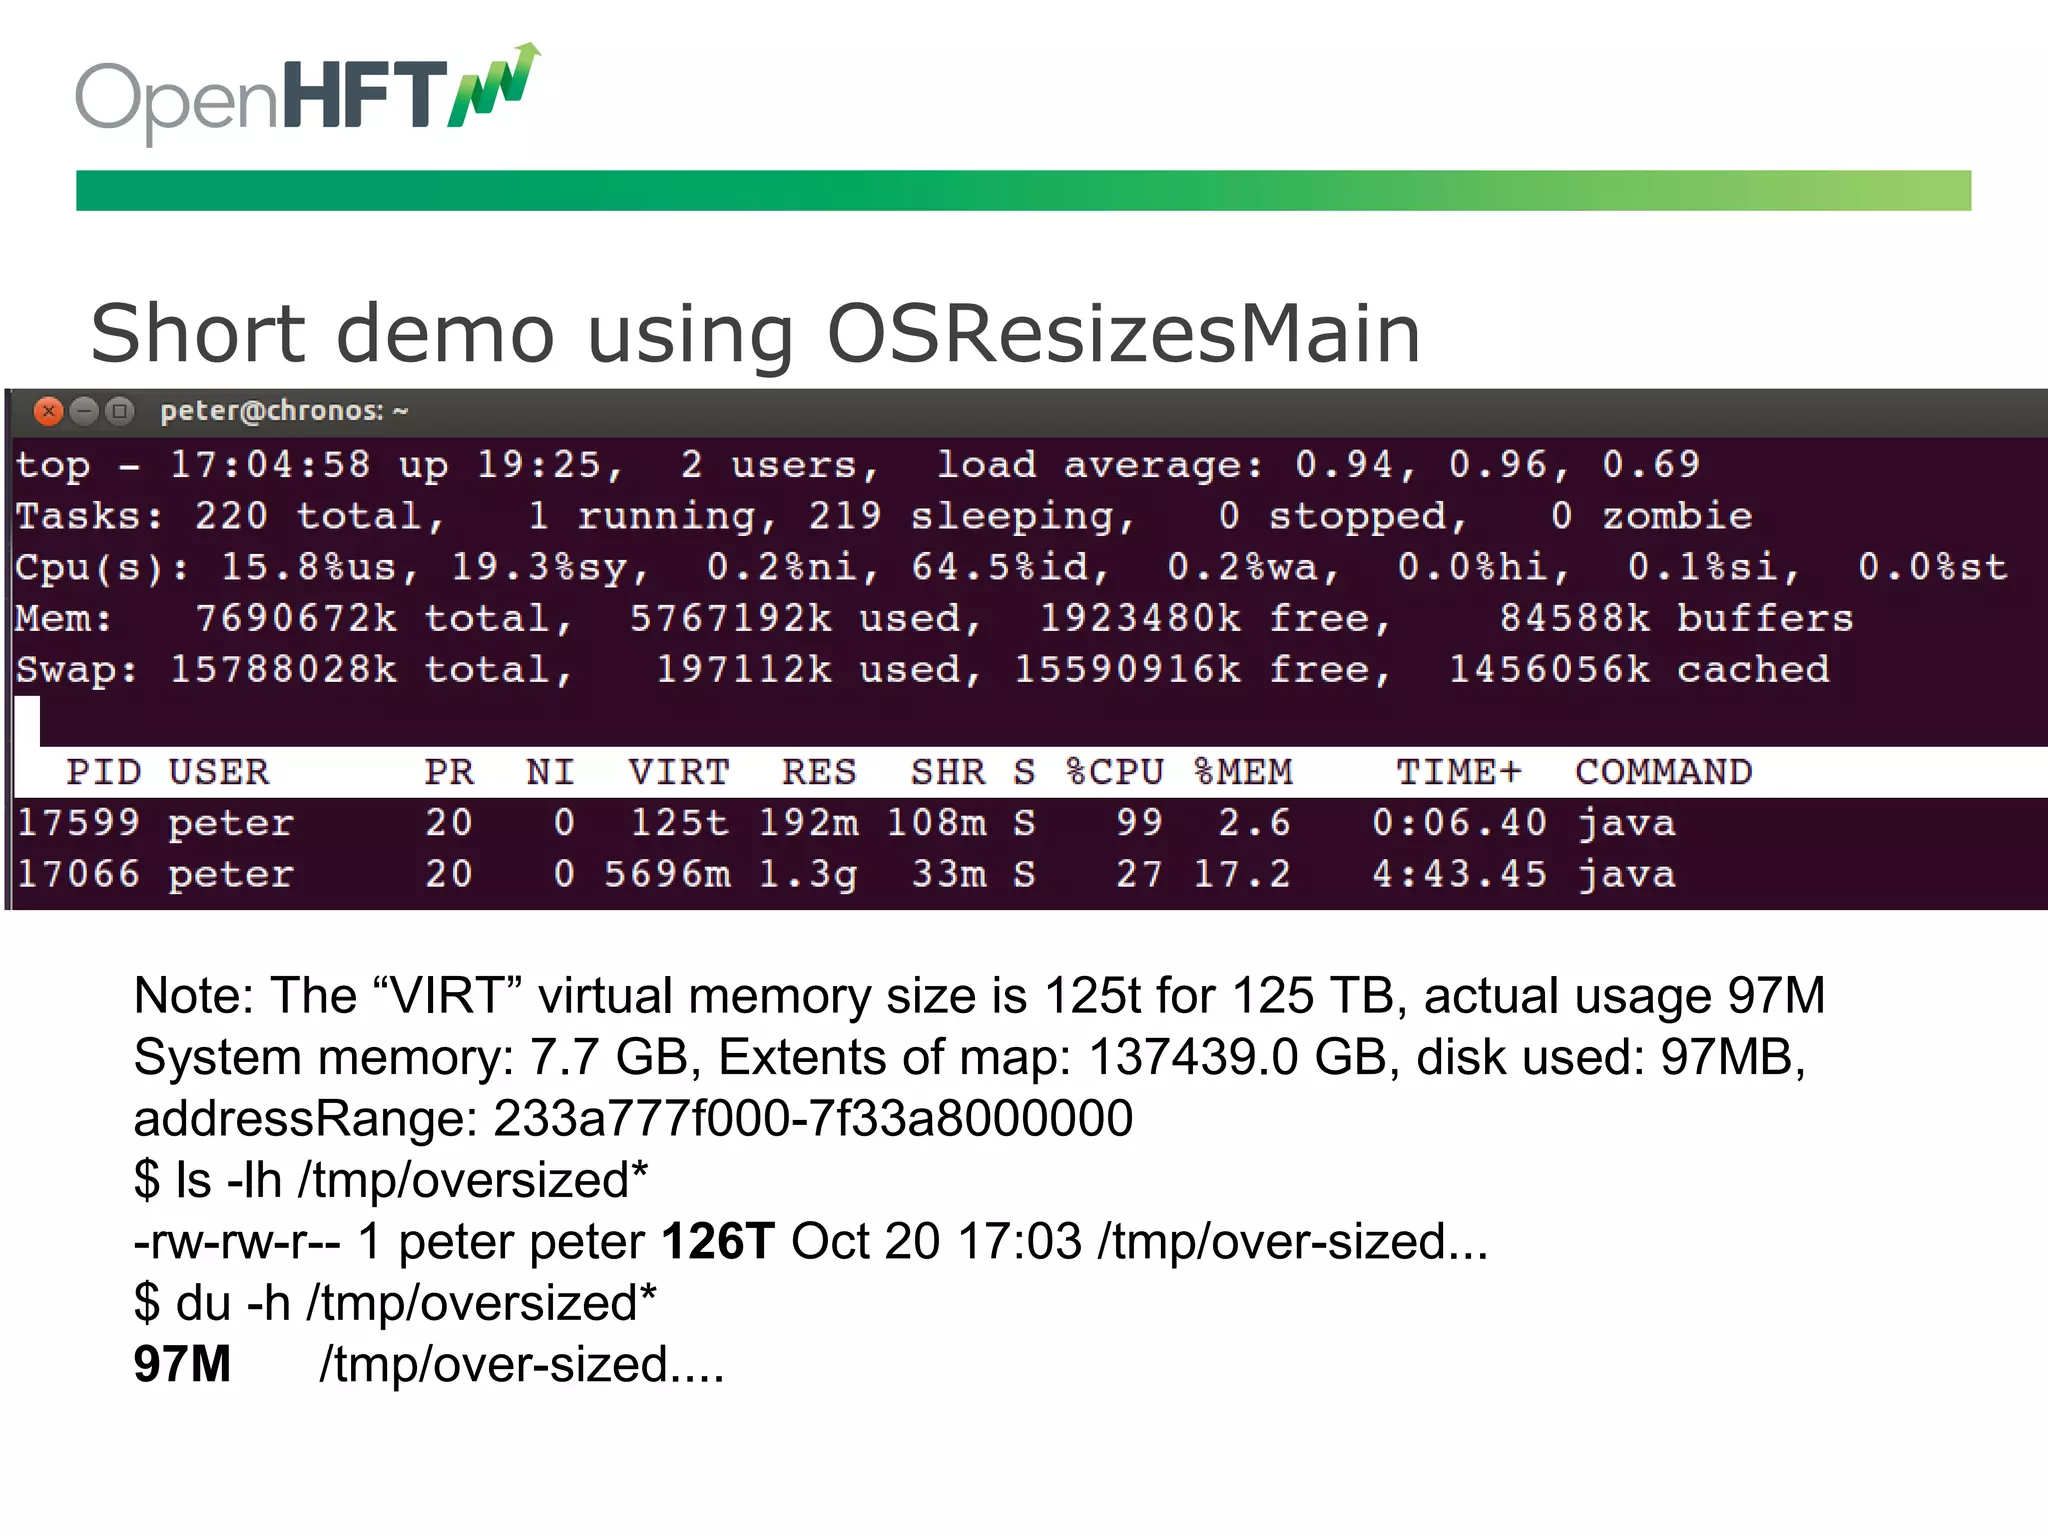
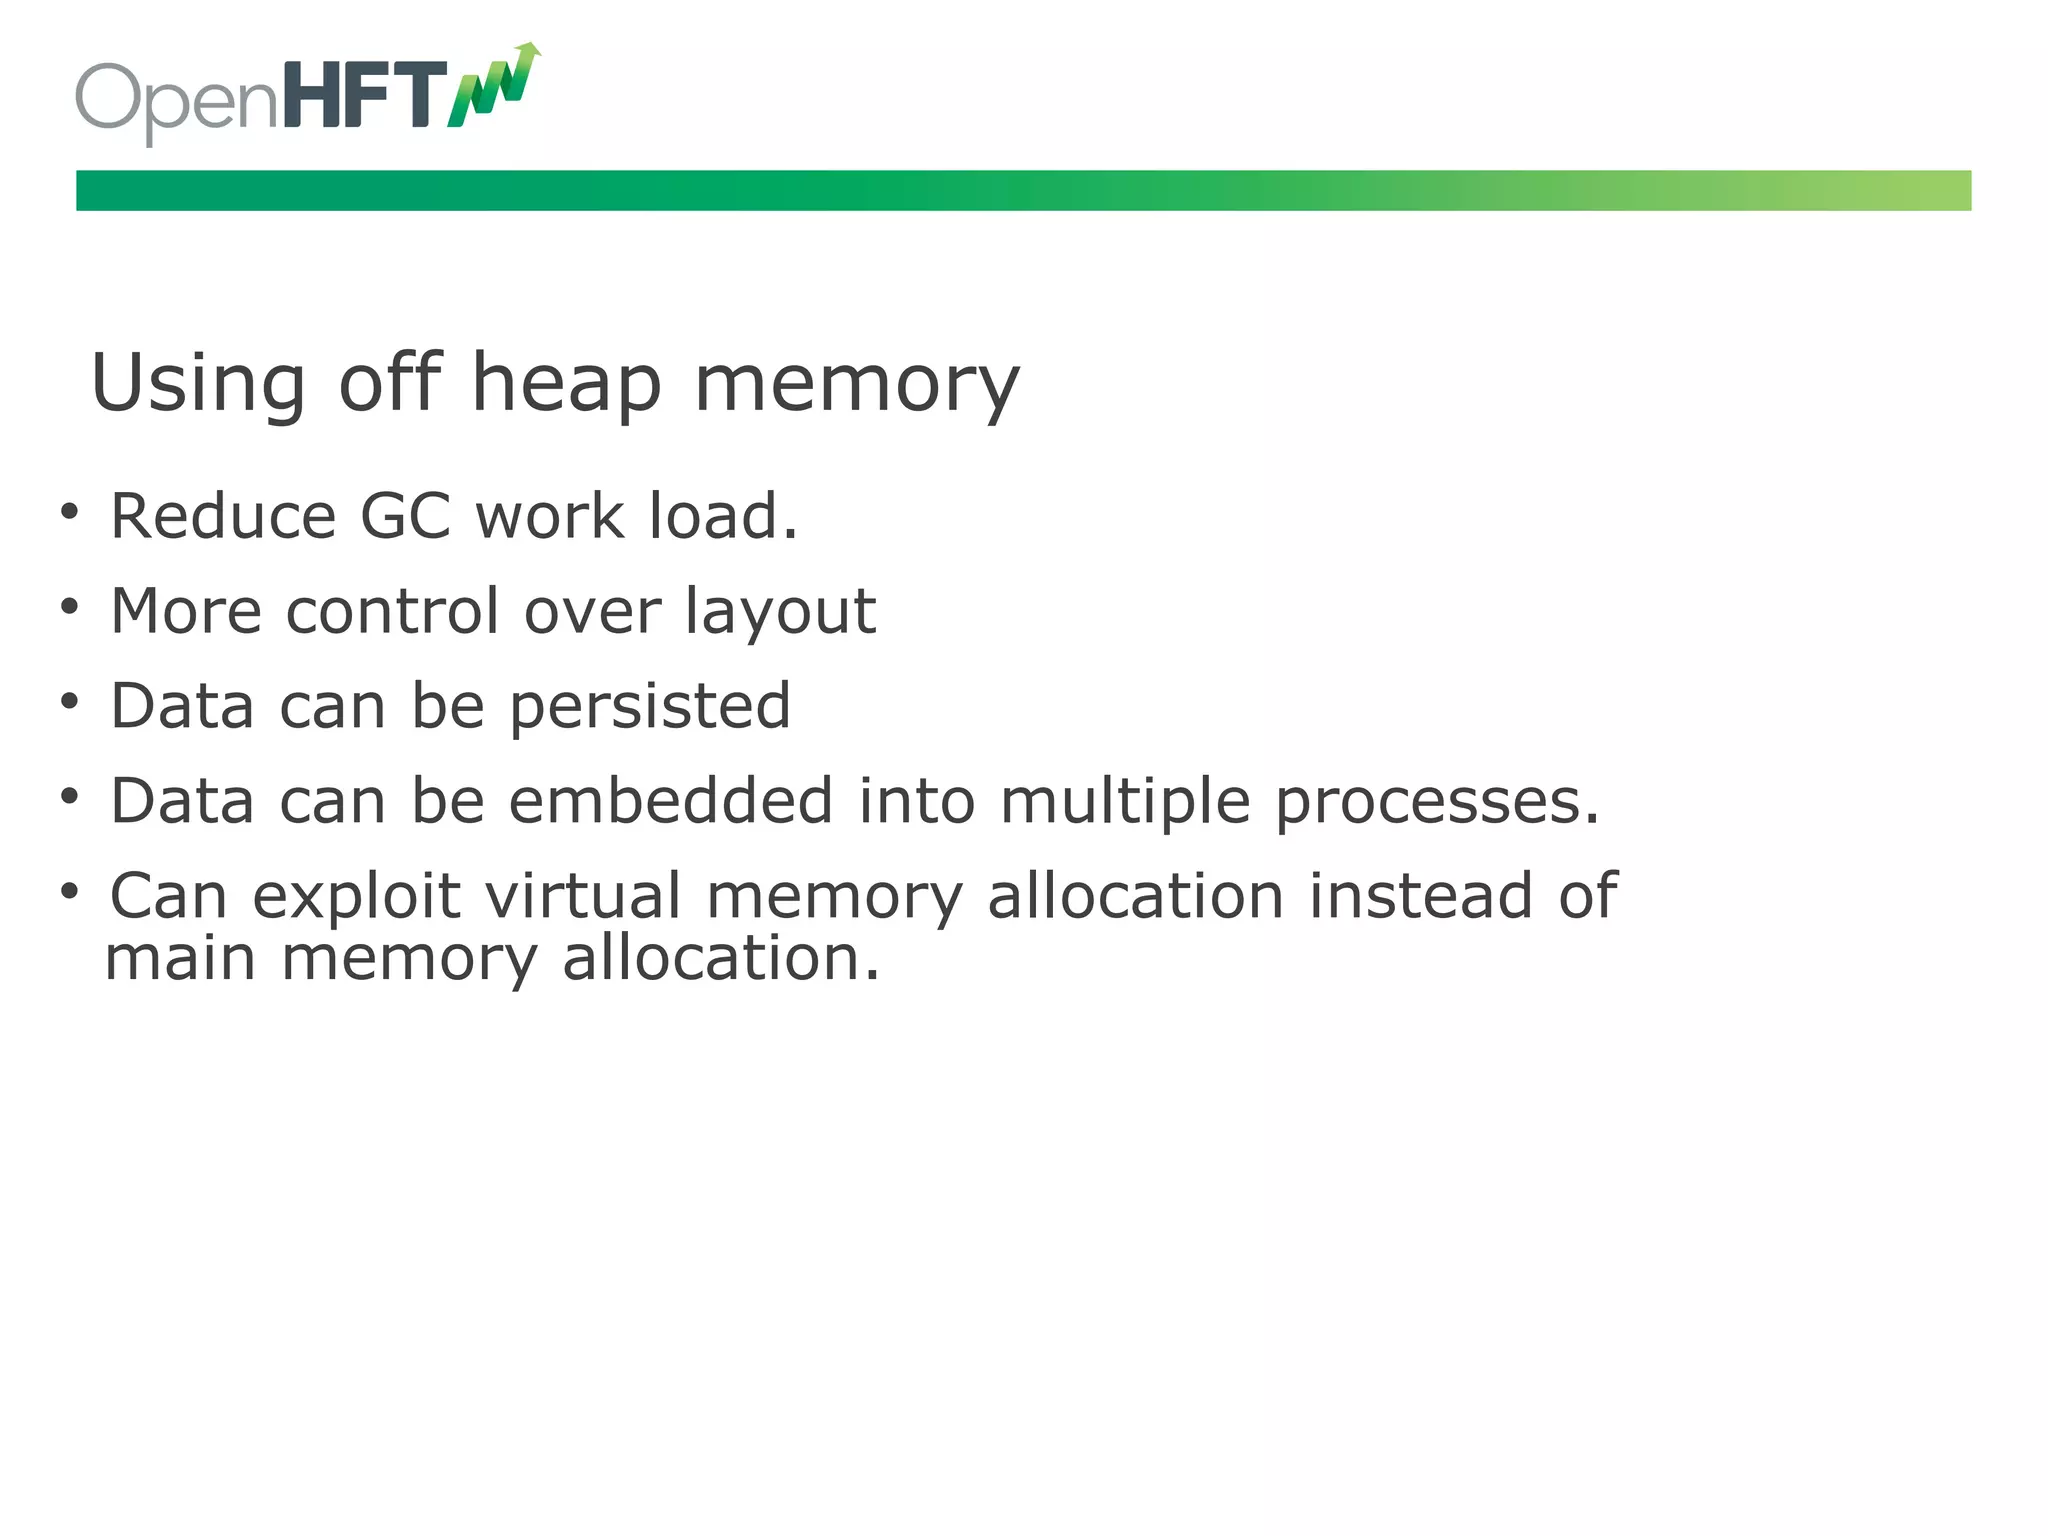
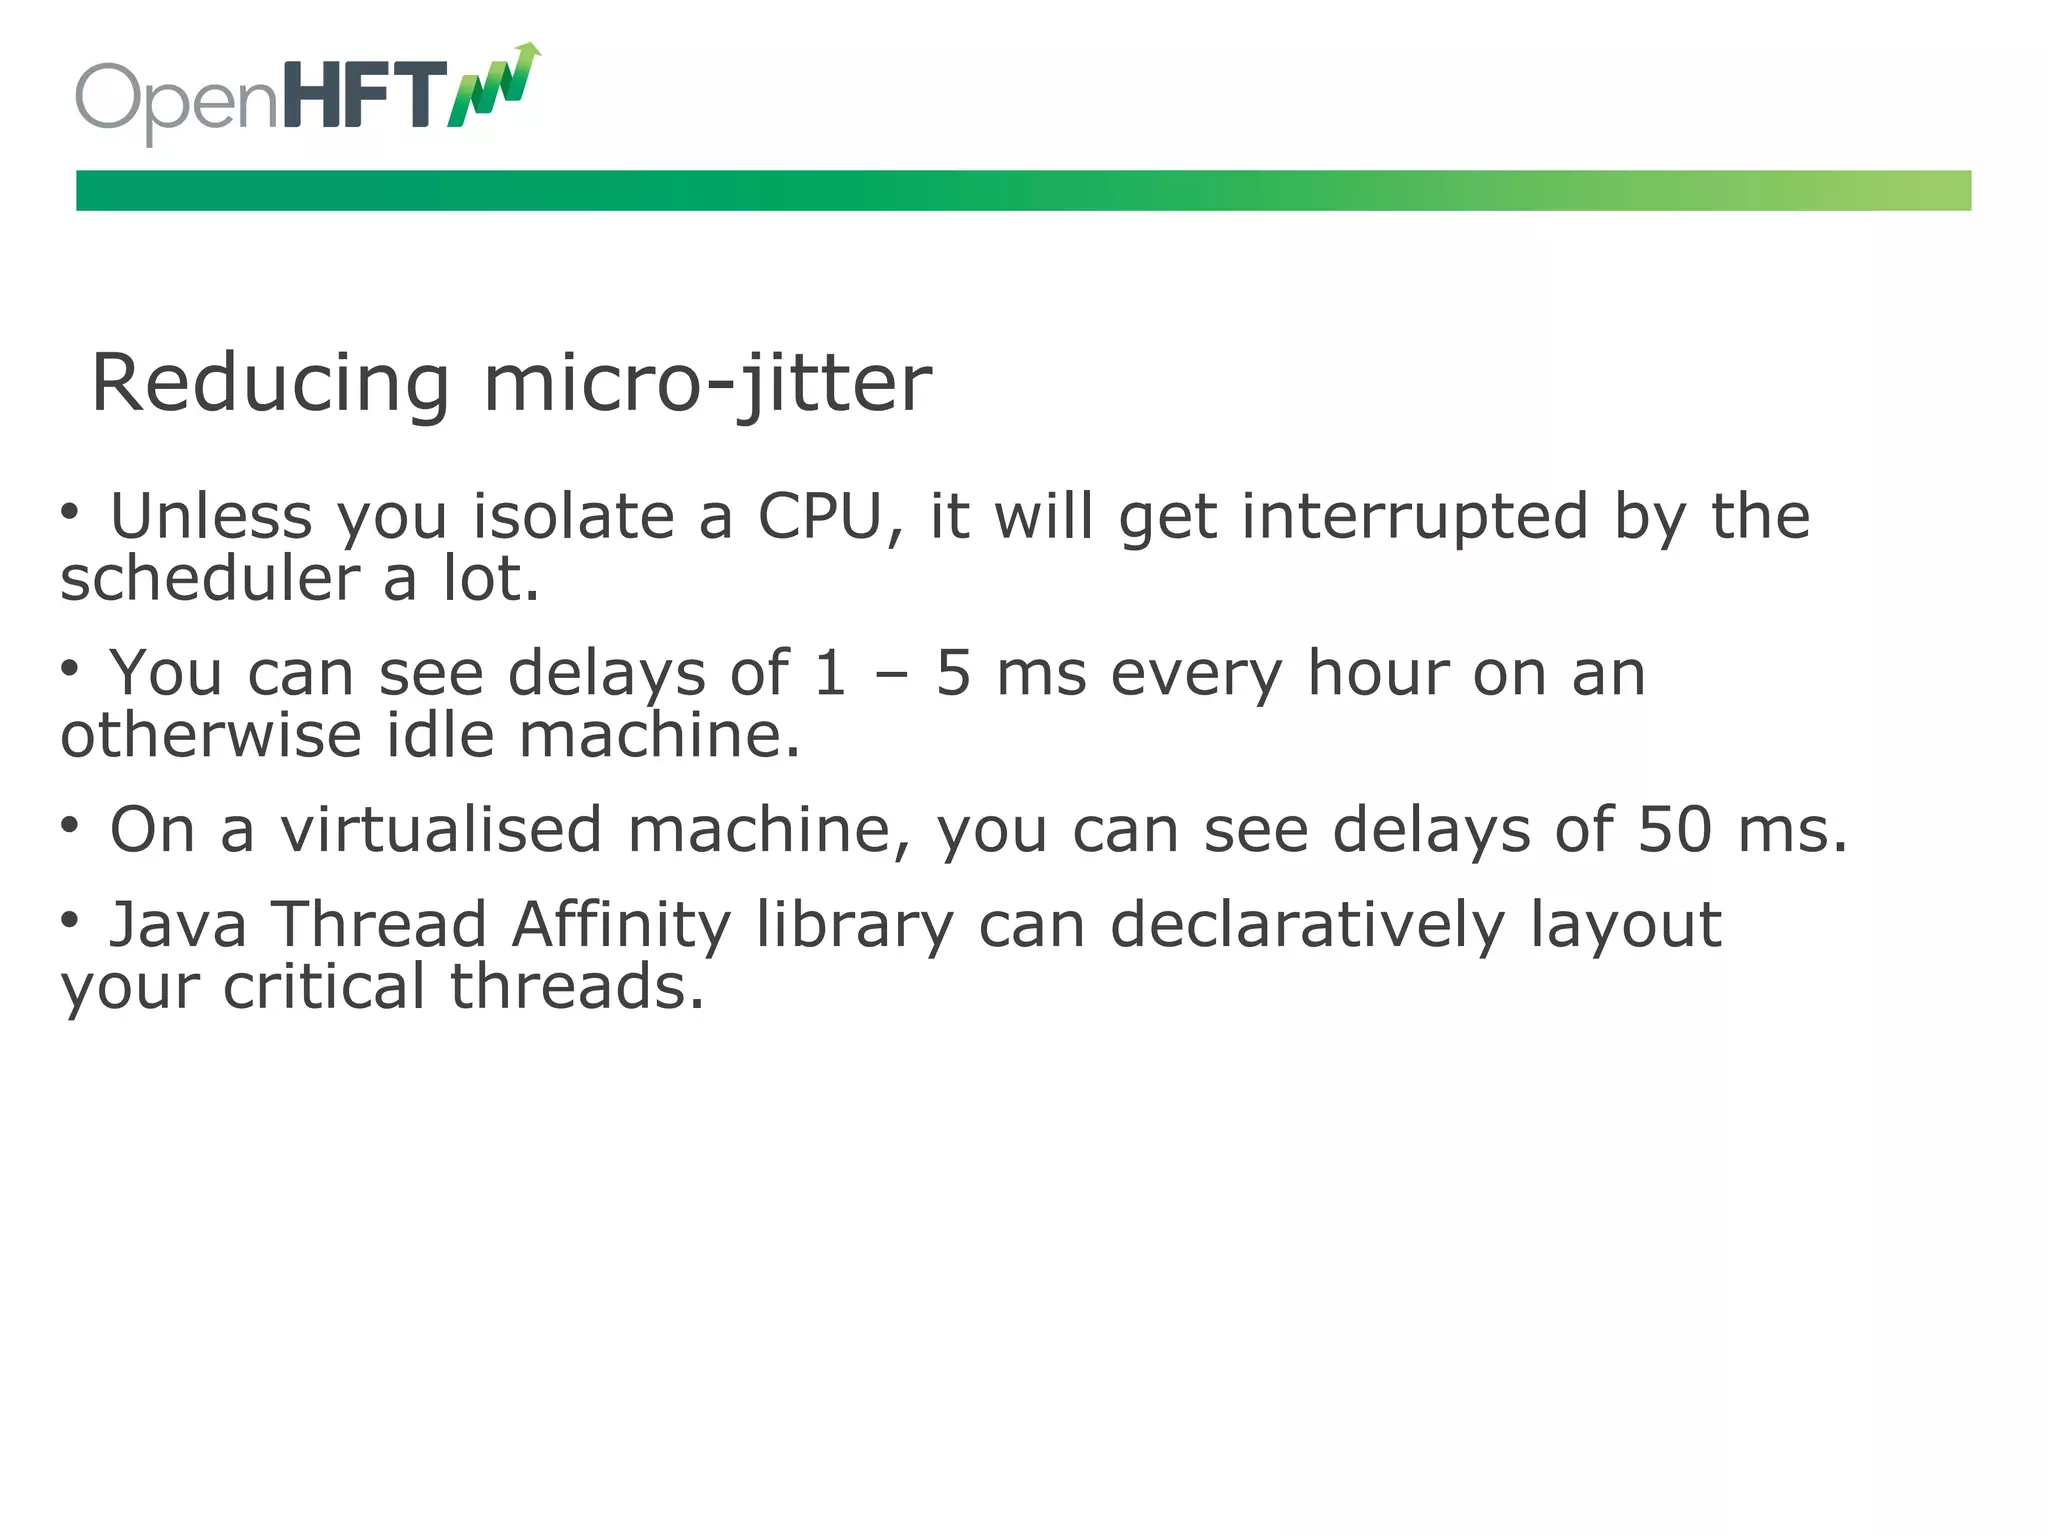
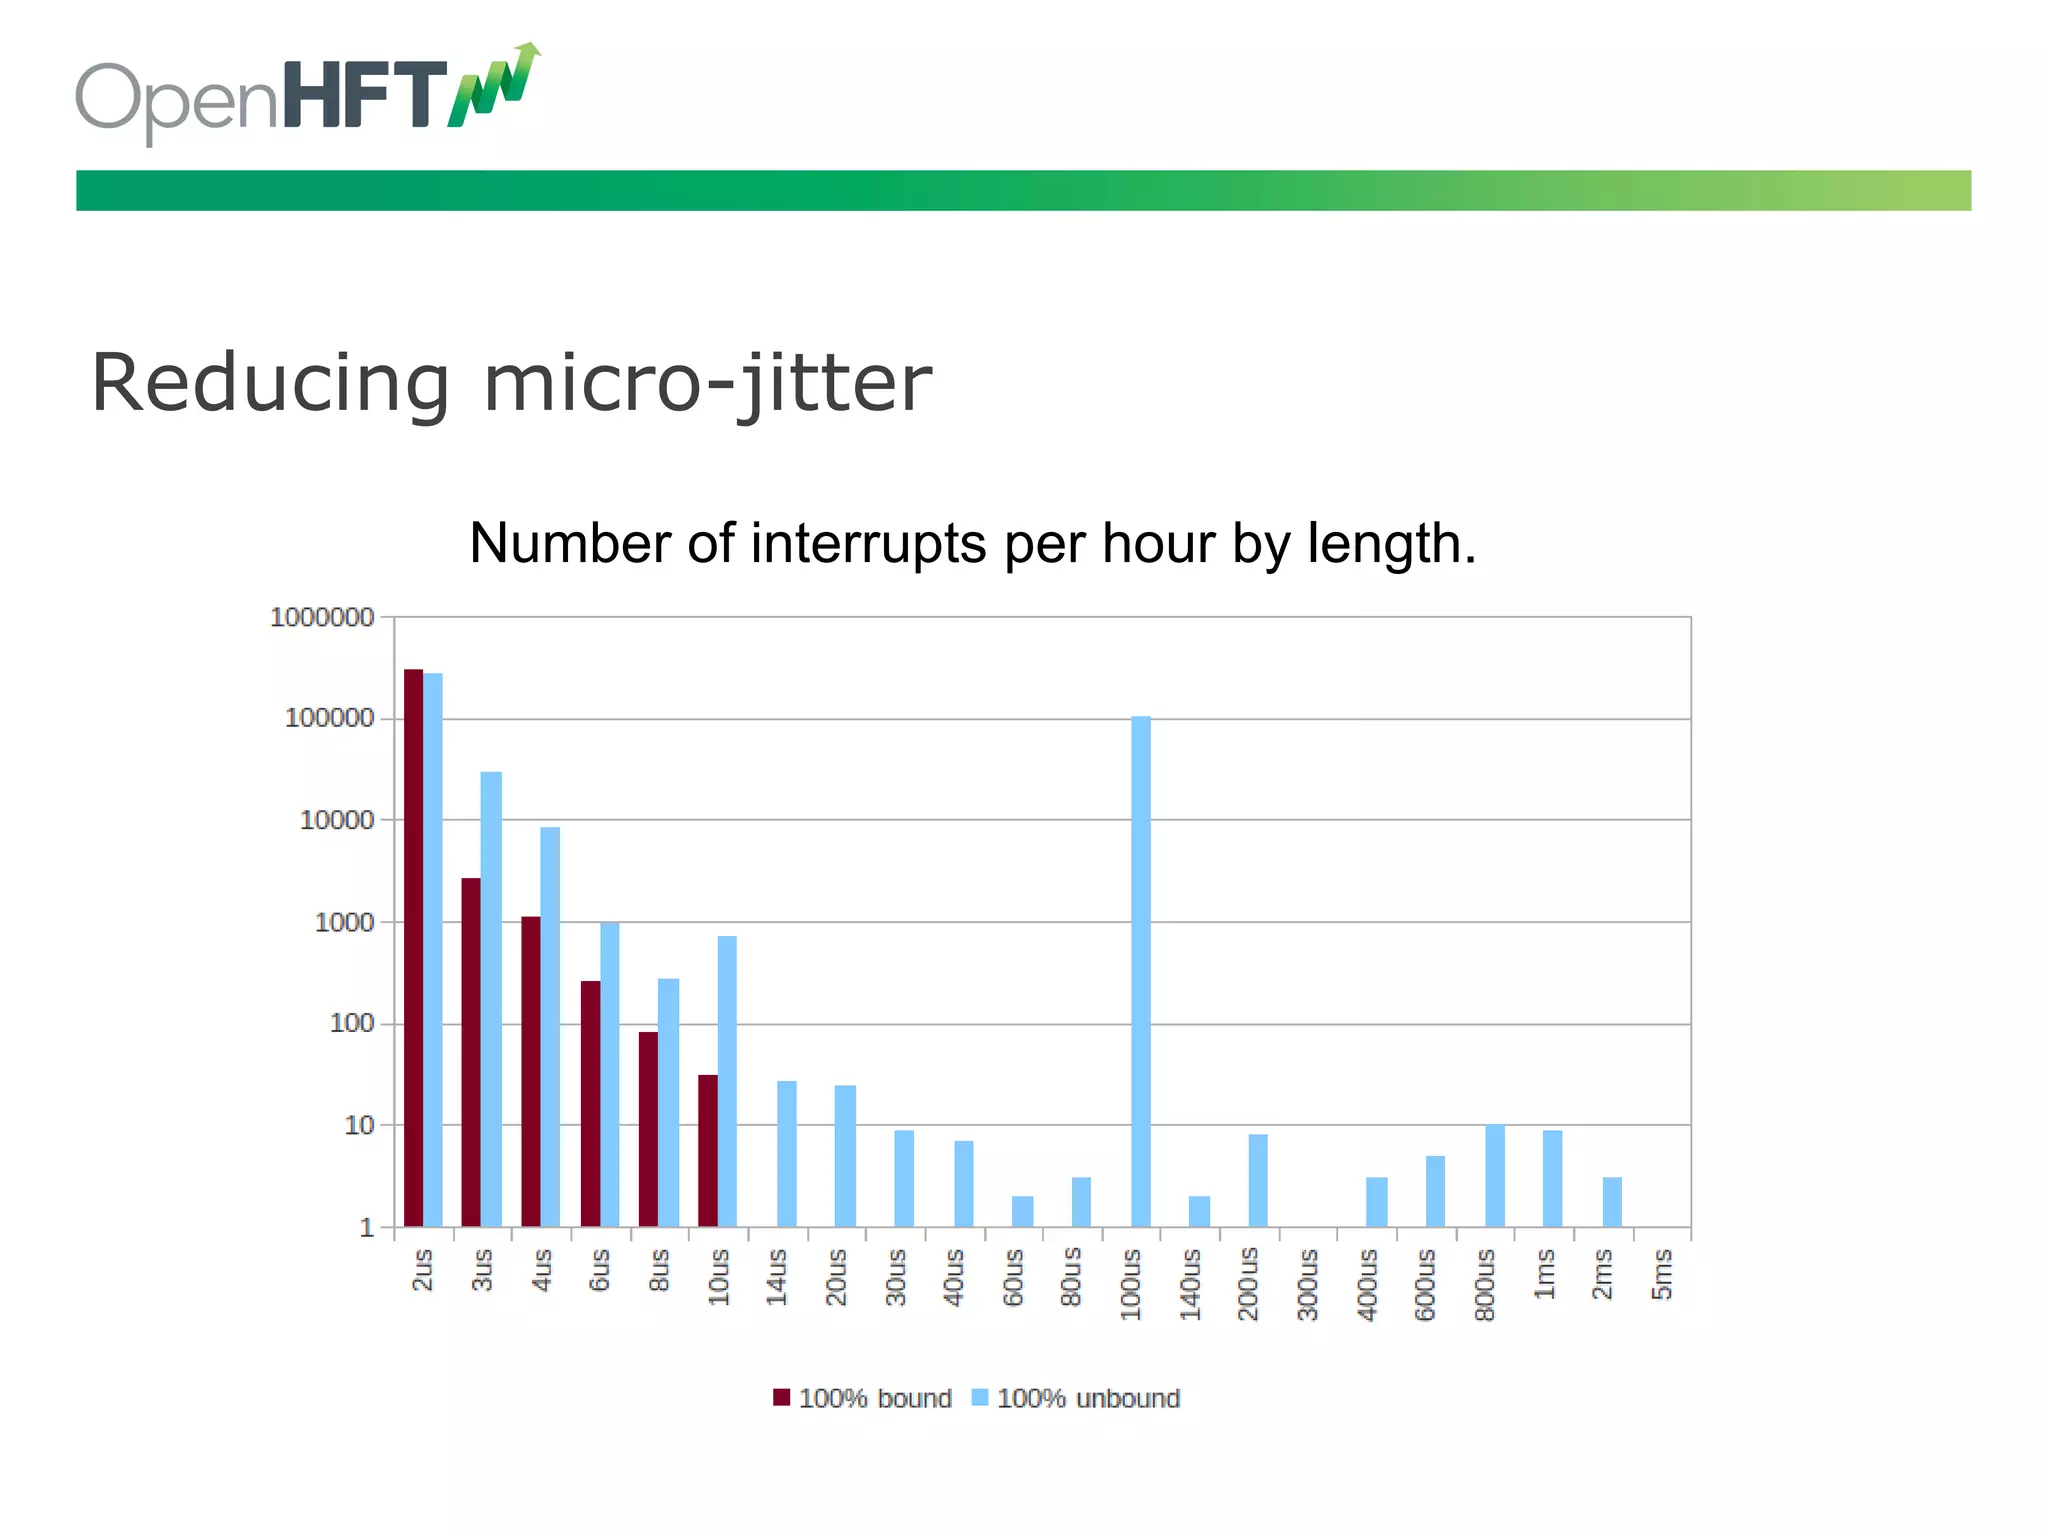
Off-heap memory usage and network optimizations to avoid jitters, aiming for latency reductions.
Closing remarks, Q&A session and resources for further information.